Attached files
| file | filename |
|---|---|
| 8-K - FORM 8-K - Clearwater Paper Corp | d20696d8k.htm |
 CLEARWATER PAPER CORPORATION SEPTEMBER 2015 Exhibit 99.1 |
 FORWARD
LOOKING STATEMENTS
2 This presentation contains, in addition to historical information, certain forward-looking statements within the meaning of the Private Securities Litigation Reform Act of 1995, including statements regarding North American tissue demand and capacity, U.S. paperboard demand, Chinese paperboard competition, business strategies, EBITDA margins and model, measures to address market dynamics, strategic capital projects and financial impact, and Adjusted EBITDA run-rate. Words such as “anticipate,” “expect,” “intend,” “will,” “plan,” “goals,” “objectives,” “target,” “project,” “believe,” “schedule,” “estimate,” “may,” and similar expressions are intended to identify such forward-looking statements. These forward-looking statements are based on management’s updated expectations, estimates, assumptions and projections that are subject to change. Our actual results of operations may differ materially from those expressed or implied by the forward-looking statements contained in this presentation. Important factors that could cause or contribute to such differences include the risk and uncertainties described from time to time in our public filings with the Securities and Exchange Commission, as well as the following: • competitive pricing pressures for our products, including as a result of increased capacity as additional manufacturing facilities are operated
by our competitors; •
paperboard customers may adjust inventory levels through decreased
purchasing; •
customer acceptance, timing and quantity of purchases of our new
through-air-dried, or TAD products, or other tissue products;
• announced price increases for our products may not be accepted in whole or part;
• the loss of or changes in prices in regards to a significant customer; • changes in transportation costs and disruptions in transportation services; • manufacturing or operating disruptions, including equipment malfunction and damage to our manufacturing facilities caused by fire or
weather-related events and IT system failures;
• changes in the cost and availability of wood fiber and wood pulp; • labor disruptions; • changes in costs for and availability of packaging supplies, chemicals, energy and maintenance and repairs;
• environmental liabilities or expenditures; • changes in the U.S. and international economies and in general economic conditions in the regions and industries in which we
operate; •
changes in customer product preferences and competitors' product
offerings; •
changes in expenses and required contributions associated with our pension
plans; •
reliance on a limited number of third-party suppliers for raw
materials; •
cyclical industry conditions;
• inability to successfully implement our operational efficiencies and expansion strategies;
• inability to fund our debt obligations; • restrictions on our business from debt covenants and terms; and • changes in laws, regulations or industry standards affecting our business. Forward-looking statements contained in this presentation present management’s views only as of the date of this presentation or as indicated. We undertake no obligation to publicly update forward-looking statements, whether as a result of new information, future events or otherwise. |
 OVERVIEW OF CLEARWATER PAPER 3 |
 INTRODUCTION TO CLEARWATER PAPER WE ARE A COMPANY FORMED IN LATE 2008 WITH MORE THAN 60 YEARS OF OPERATING HISTORY WE OPERATE TWO BUSINESS SEGMENTS Pulp and paperboard: 40% of 2014 net sales Consumer products: 60% of 2014 net sales FINANCIAL OVERVIEW FOR 2014 Net Sales: $2.0 Billion Adjusted EBITDA¹: $240 Million 2008 to 2014 Adjusted EBITDA¹ CAGR: 21% APPROXIMATELY 3,300 EMPLOYEES
4 See Appendix for the definition of Adjusted EBITDA as well as the reconciliation to the most comparable GAAP measure. 1 |
 CONSUMER
PRODUCTS DIVISION OVERVIEW
Clearwater Paper is one of the LARGEST NORTH AMERICAN
MANUFACTURERS OF PRIVATE LABEL TISSUE, focused on high value tissue products across all categories, retail channels and geographies. 5 |
 CONSUMER
PRODUCTS DIVISION MARKET DRIVERS
STABLE GROWTH – The tissue market has grown an average of 100 104 107 113 114 117 119 121 124 124 124 127 129 127 130 132 134 137 139 141 143 269 273 276 279 282 285 288 290 293 296 298 301 304 307 311 313 315 316 319 321 324 1996 1997 1998 1999 2000 2001 2002 2003 2004 2005 2006 2007 2008 2009 2010 2011 2012 2013 2014 2015 2016 e e e e U.S. TISSUE DEMAND (INDEXED) U.S. POPULATION (MM) Source: U.S. Tissue demand per RISI for North America only from US Tissue Data January 2015, U.S. Population per U.S. Census December
2012 6 1 % – 2 % annually since 1996, consistent with
population growth. |
 CONSUMER
PRODUCTS DIVISION CAPACITY AND RETAIL CHANNELS
OVERVIEW OF FACILITIES Tissue Production Capacity¹: 433,000 tons Tissue Conversion Capacity¹: 435,000 tons Clearwater Paper Tissue Parent Roll Clearwater Paper Tissue Converting Represents 2014 annual volumes excluding specialty mills IRI Panel data for Retail channel share by dollar amount sold as of Jan. 5, 2015. Company sales data. Change in Industry Retail Channel Mix U.S. TISSUE INDUSTRY RETAIL CHANNEL MIX 2009 2014 Grocery 37 % 33 % Mass + Supercenter 28 % 31 % Club 22 % 23 % Drug 7 % 5 % Dollar 3 % 4 % All Other 3 % 4 % Clearwater Paper Focus on Diversifying Channel Mix CLEARWATER PAPER RETAIL CHANNEL MIX 2011 2014 Grocery 82 % 68 % Mass + Supercenter 10 % 19 % Drug 2 % 2 % Dollar 6 % 10 % All Other 1 % 7 Lewiston,ID Las Vegas,NV Oklahoma City, OK Shelby, NC Elwood, IL Neenah, WI Lady Smith, WI 1 2 3 ³ ² |
 PRIVATE
LABEL CONTINUES TO CAPTURE MARKET SHARE IN TISSUE
Clearwater Paper ranks as one of the LARGEST NORTH
AMERICAN PRIVATE LABEL TISSUE MANUFACTURERS Private Label Market Share of Total U.S. 2014 U.S. Retail Tissue Industry Product Mix 60 % 29 % Tissue 7 % 4 % Source: IRIWorldwide. Dec. 2014. 8 60% 0% 10% 20% 30% 40% 50% 60% Bath Tissue Paper Towels Facial Tissue Napkins Total Private Label 2003 2011 2012 2013 2014 15% 18% 26% 43% 18% 20% 32% 25% 52% 25% 21% 32% 27% 49% 26%26% 21% 33% 30% 48% 22% 33% 31% 54% 27% |
 OPPORTUNITY FOR PRIVATE LABEL
AND CLEARWATER PAPER TO GROW
MARKET SHARE NATIONALLY
Clearwater
Paper Market Share by Region WEST MID-WEST EAST Clearwater Paper 17.2 % 8.0 % 5.3 % Brand Names 69.3 % 73.6 % 73.0 % Other Private Label 13.5 % 18.4 % 21.7 % Source: IRIWorldwide. January 2015 14.7% 5.2% 4.0% 6.3% 16.4% 5.9% 4.1% 6.9% 16.8% 6.3% 4.5% 7.3% 17.2% 8.0% 5.3% 8.1% WEST MID-WEST EAST TOTAL MARKET 2011 2012 2013 2014 2011 2012 2013 2014 2011 2012 2013 2014 2011 2012 2013 2014 9 |
 NORTH
AMERICAN MARKET
DEMAND VS. CAPACITY Longer Term Market Remains in Equilibrium Source: RISI May 2015 update for Outlook for World Tissue Business and company estimates, RISI June 2015 US Tissue Monthly Data
It is assumed that any productivity improvements (approximately 100k per year or 1% of capacity) will be offset by closures over a cycle. Notes: Projected capacity changes represents both virgin and recycled tissue capacity changes. Please see Appendix for breakdown of specific
projects reflected in the capacity changes. 10
9,506 9,788 10,382 9,803 594 0 2,000 4,000 6,000 8,000 10,000 12,000 2014 Tissue Demand 2014 Tissue Capacity Projected New Capacity Projected 2016 Tissue Capacity Projected 2016 Tissue Demand 1 2014 DEMAND TO CAPACITY RATIO OF 97% 2016 E DEMAND TO CAPACITY RATIO OF 94% 9,506 9,788 10,382 9,803 594 1 1 |
 PAPERBOARD DIVISION OVERVIEW LEADING MANUFACTURER OF SBS 1 used in packaging of premium consumer goods, pharmaceuticals, food and liquid, and food service plates, cups and folding cartons. 11 1 Solid Bleach Sulfate paperboard |
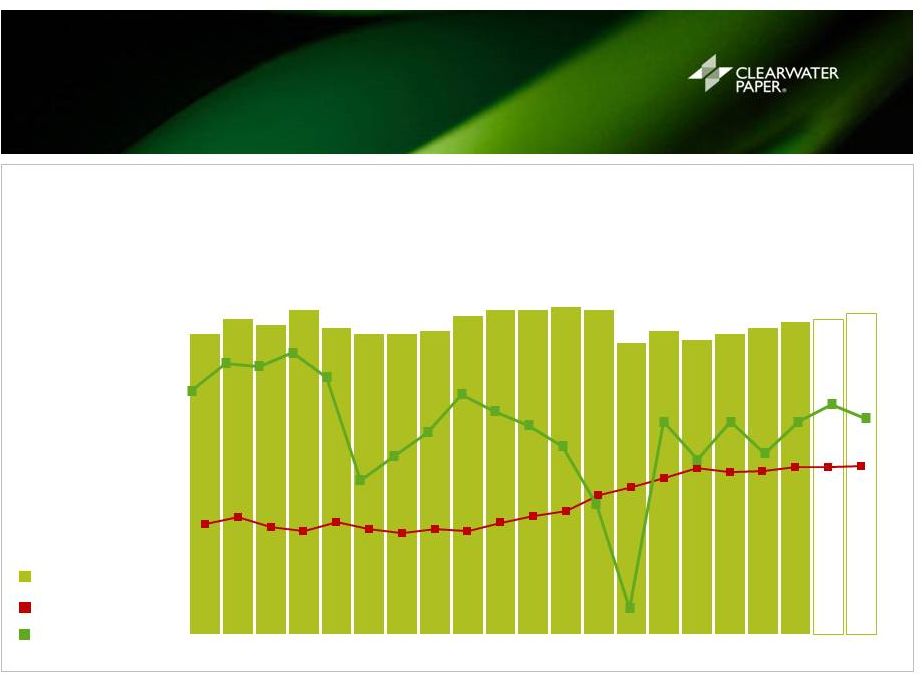 12 PAPERBOARD DEMAND REMAINS STABLE NORTH AMERICA DEMAND FOR SBS BASED PRODUCTS EXPECTED TO REMAIN STABLE THROUGH 2016 • North American industry backlogs are below seasonal averages and Clearwater Paper expectations in Q3 2015
• The strong U.S. dollar is attracting European SBS manufacturers, pressuring U.S. exports
• China’s ivory board is expected to have minimal impact on Clearwater Paper in 2015
• Secular trend away from foam (polystyrene) cups and products continues Source: RISI estimates as of January 2015 ¹ Based on tons produced. Projections based on North American Packaging papers and board demand estimates per RISI.
² Average price per short ton of 16 pt. SBS folding carton C1S. Price estimates per
RISI. U.S. BLEACHED
PAPERBOARD
DEMAND
U.S. BLEACHED
PAPERBOARD
PRICE
U.S. GDP % CHANGE
100 105 103 108 102 100 100 101 106 108 108 109 108 97 101 98 100 102 104 105 107 $ 760 $ 810 $ 740 $ 713 $ 773 $ 728 $ 700 $ 727 $ 713 $ 772 $ 817 $ 851 $ 961 $ 1,020 $ 1,082 $ 1,150 $ 1,122 $ 1,130 $ 1,155 $ 1,157 $ 1,163 1996 1997 1998 1999 2000 2001 2002 2003 2004 2005 2006 2007 2008 2009 2010 2011 2012 2013 2014 2015 2016 3.7 % 4.5 % 4.4 % 4.8 % 4.1 % 1.1 % 1.8 % 2.5 % 3.6 % 3.1 % 2.7 % 2.1 % 0.4 % -2.6 % 2.8 % 1.7 % 2.8 % 1.9 % 2.8 % 3.3 % 2.9 % e e (INDEXED) 1 ($/SHORT TON ) 2 |
 PULP
AND PAPERBOARD DIVISION CAPACITY AND MARKETS
Clearwater Paper ranks as one of the top five largest paperboard manufacturers in North America Lewiston Mill ID Cypress Bend Mill AR OVERVIEW OF FACILITIES Pulp Production Capacity 1 : 856,000 tons Paperboard Production Capacity 1 : 812,000 tons Clearwater Paper Pulp Clearwater Paper SBS Source: Company estimates, RISI, AF&PA Represents 2014 annual volumes. Represents ~6.0 million tons. 2014 North American Bleached Paperboard Production by Type² 2014 36 % Packaging 23 % 17 % 13 % Bristols 8 % 3 % 2014 North American Bleached Paperboard Production by Market Share 2014 International Paper 24 % MeadWestvaco 23 % Georgia Pacific 13 % Evergreen 13 % Clearwater Paper 12 % Rock-Tenn 7 % Weyerhauser 5 % Tembec Paperboard 3 % 13 1 2 |
 14 GROW OUR TISSUE BUSINESS > Lead private label in quality > Expand geographically > Diversify retail channel penetration OPTIMIZE PROFITABILITY OF PAPERBOARD AND TISSUE BUSINESSES > Improve sales mix > Reduce costs > Continue to improve quality OUR MACRO STRATEGY TO CREATE SHAREHOLDER VALUE |
 SUCCESSFUL EXECUTION OF
PREVIOUSLY STATED GOALS
GOAL COMPLETE NEW PAPER MACHINE AT SHELBY, NC FACILITY GOAL OPTIMIZE THE PAPERBOARD BUSINESS GOAL MAINTAIN A PRUDENT CAPITAL STRUCTURE TO LOWER WEIGHTED AVERAGE COST OF CAPITAL GOAL ASSET RATIONALIZATION/ COST INFRASTRUCTURE GOAL RETURN OF CAPITAL TO SHAREHOLDERS Sold 5 specialty mills in December 2014 for $114 million Closure of Long Island and Thomaston converting operations in 2013-2014 Established cross divisional supply chain function to drive out costs system wide Record 2014 production of 792K tons and Adjusted EBITDA margin of 22% Cost and production improvement projects Idaho major maintenance cycle increased from 12 to 18 months Enhanced access to fiber supply with chipping facility acquisition near Lewiston, Idaho
70k ton Shelby TAD machine startup in Q4 2012 on budget
Full run rate achieved in Q3 2014 versus goal of Q4 2013
Conservative capital structure with target leverage through the cycle of 3x Adjusted
EBITDA and ample liquidity
Refinanced bonds and reduced long-term debt interest rate to 5% from 8.6%
since 2013
Announced new $100 million share repurchase program in December 2014
Returned $230 million in capital to shareholders from 2011-2014 through
share repurchases
Reduced shares outstanding by 20% or 4.5 million shares through 2014 Achieved $72 million Adjusted EBITDA in Q3 2014 Input cost inflation and conventional tissue pricing headwinds persist Sold specialty mills in December 2014 representing 8% or $18.4 million in Adjusted EBITDA 1 See Appendix for the definition of Adjusted EBITDA as well as the reconciliation to the most comparable GAAP measure.
2 Pulp and Paperboard operating income for 2014 of $144.2 million plus depreciations of $25.5 million and loss on impairment of Clearwater Fiber intangible asset resulting in Adjusted EBITDA of $172.7 million 15 GOAL $300 MILLION ADJUSTED EBITDA 1 1 2 |
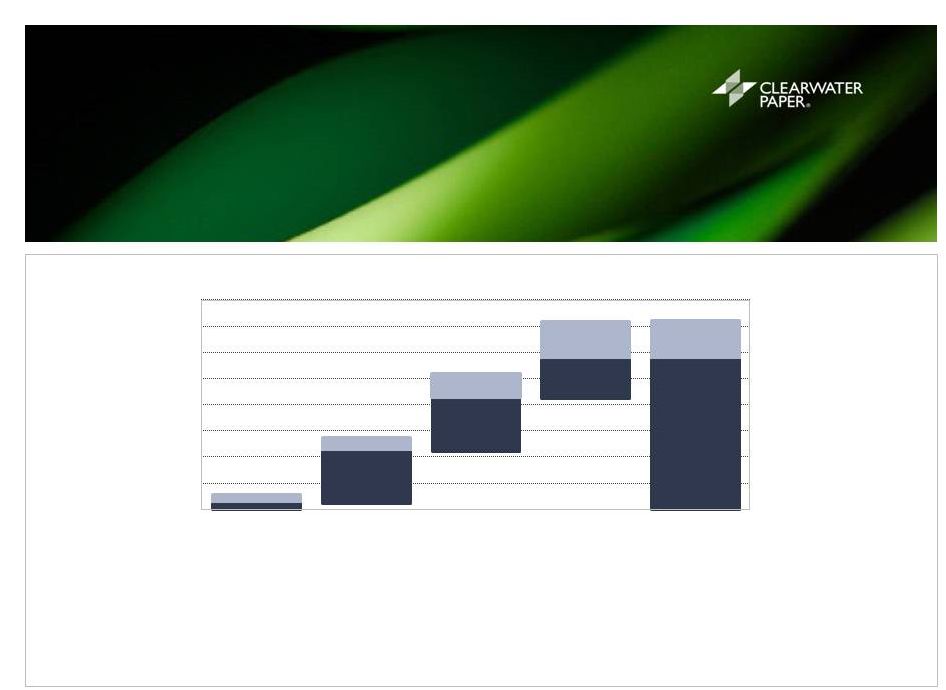
 $300 $28 $22 $46 $18 $230 $100 $150 $200 $250 $300 $350 Original Target at 2011 Price / Cost Conventional Tissue Pricing Paperboard Pricing Fiber, Transportation, Chemicals, Gas Sale of Specialty Mills Reset Target at 2014 Price / Cost ADJ. EBITDA 1,2 (MILLIONS) 13.4% 16.4% UPDATED ADJUSTED EBITDA TARGET IN LIGHT OF CHANGES IN MARKET CONDITIONS AND DIVESTITURE 16 1 Non-GAAP measure – See definition and reconciliation to most comparable GAAP measure .
2 This information is based upon management’s expectations and estimates as of April 22, 2015, which are in part based on market and industry
data. Many factors are outside the control of management, including particularly input costs for commodity products, and actual results may differ materially from the information set forth above. See “Forward-Looking Statements”
on page 2. PRICING AND INPUT COSTS VS. 2011
• Pricing pressure for conventional tissue products • Competitive market environment a barrier to passing through input cost inflation to customers
• Key input costs up $46 million • Partly offset by improved paperboard pricing • $18.4 million of Adjusted EBITDA 1 divested with sale of specialty products mills 2 |
 CLEARWATER PAPER CROSS CYCLE FINANCIAL MODEL NET SALES 1 ADJUSTED GROSS PROFIT % OF NET SALES 2 ADJUSTED SG&A % OF NET SALES 2 ADJUSTED OPERATING PROFIT % OF NET SALES 2 ADJUSTED NET EARNINGS % OF NET SALES 2 ADJUSTED EBITDA % OF NET SALES 2 100% 17.0% (6.0%) 11.0% 5.0% 15.0% 1 Net sales for the year ended December 31, 2014 were $1,967.1 million and include results of the specialty tissue business which was sold at the
end of Q4’14. Net sales for the second quarter ended June 30, 2015 were $444.6 million. 2 Non-GAAP measure – See definition and reconciliation to most comparable GAAP measure. 17 Q2’15 RESULTS 100% 13.7% (7.0%) 6.8% 3.2% 11.4% 2014 RESULTS 100% 13.9% (6.3%) 7.5% 3.5% 12.1% |
 • Pulp optimization at mills • Standardize the back end of our converting lines • Bring new swing-line in Las Vegas on-line • Execute national warehousing and logistics optimization strategy • 100% adoption of pallet-based warehouse platform • Standardize our national 3 rd party logistics strategy • Grow cup market stock and folding carton market share • Simplify cup and brik manufacturing complexity • Reduce complexity in our business through grade & SKU validation • Improve our category insights to help retailers sell best mix of products • Implement Black/Green belt training projects through Total Productive Maintenance (TPM) • Conduct loss analysis audits by mill • Develop Supply Chain planning tools (Demantra) for efficiencies • Launch Phase 2 of JD Edwards (Project 1Way), TM1 (financial forecasting) PATH TO 15% ADJUSTED EBITDA CROSS CYCLE TARGET MARGIN 18 GOAL INCREASE OUR SALES EFFECTIVENESS GOAL ACHIEVE SUPPLY CHAIN EFFICIENCIES GOAL STRENGTHEN OUR CONTINUOUS IMPROVEMENT CULTURE GOAL IMPROVE OUR MANUFACTURING COST STRUCTURE GOAL IMPLEMENT THE RIGHT PROCESSES, TOOLS, SYSTEMS • Reallocate $107M net specialty proceeds to strategic investments • Operational improvements |
 STRATEGIC INVESTMENTS
EXPECTED TO ACHIEVE
ADJUSTED EBITDA MARGIN TARGET
19 (MILLIONS $) 2015 2016-2018 FULL RUN-RATE EXPECTED 1 STRATEGIC INVESTMENTS 2 CAPEX CAPEX ADJUSTED EBITDA IMPACT Pulp Optimization $26 $120-$130 $30-$35 Warehouse Automation $12 $25-$30 $27-$32 Paper Machine and Converting Line Upgrades $27 $11-$12 Converting Lines $14 $10-$12 IT $6 TOTAL STRATEGIC CAPEX $85 $145-$160 PLUS BENEFITS FROM: Operational Efficiency $20-$32 Sales & Marketing Efficiency $10-$15 Stranded Overhead $7 TOTAL $115-$145 Invest to improve operating efficiency and profitability 1 Non-GAAP measure – See definition and reconciliation to most comparable GAAP measure 2 Based on Q1’15 prices, input costs, and market and industry data. Many factors are outside the control of management, including particularly
input costs for commodity products, and actual results may differ materially from the information set forth above. See “Forward-Looking Statements” on page 2. 3 Improvements start to contribute in 2016 through 2018 after the first year of investment in 2015.
• High return/low risk investments • Expected to permanently reduce cost structure • Expected Adjusted EBITDA improvement of $115 to $145 million in 2-3 years
1, 3 • Funding in Year 1 from sale proceeds of specialty mills |
 EXPECTED ADJUSTED EBITDA
FROM STRATEGIC INVESTMENTS AND
OPERATIONAL IMPROVEMENTS
1, 2 20 • Expected to yield a $115-$145 million Adjusted EBITDA increase over the $230M reset run rate
• In addition, assume an annual $10-15 million of margin pressure • Implies $285-$335 million Adjusted EBITDA run rate in 2018 1 Based on Q1’15 prices, input costs, and market and industry data. Many factors are outside the control of management, including particularly input costs for commodity products, and actual results may differ materially from the information set forth above. See “Forward-Looking Statements” on page 2. 2 Non-GAAP measure – See definition and reconciliation to most comparable GAAP measure.
$- $20 $40 $60 $80 $100 $120 $140 $160 2015 2016 2017 2018 Expected Adjusted EBITDA Benefit From Investment and Operational Improvements1 ADJ. EBITDA 1,2 (MILLIONS) $5-$10 $40-$50 $40-$60 $30-$60 $115-$145 1 1 |
 CLEARWATER PAPER’S
VALUE PROPOSITION 21 |
 BALANCED CAPITAL ALLOCATION
2011-2014 22 • 20% of total shares outstanding from 2011 through 2014 • Continued investment in the business while returning capital to investors Capital Allocation 2011-2014 Cumulative Shares Repurchased Total Shares Outstanding (As of Dec 31st) Commitment to return at least 50% of Discretionary Free Cash Flow 1 to shareholders through 2015 1 Discretionary Free Cash Flow is cash flow from operations less maintenance capital expenditures
2011 – 2014 Capex 34 % TAD Expansion 35 % Stock Repurchase 31 % |
 CLEARWATER
PAPER
PAPERBOARD
2 LARGE-CAP
CONSUMER
3 S&P 500 CLEARWATER PAPER IS A LEADER AMONGST ITS PEERS IN VALUE CREATION Source: Bloomberg. Market data as of August 25, 2015 Note: Total Shareholder Return includes with dividends reinvested and stock price performance.
1 Small cap tissue peers include Cascades, Orchids and Wausau. 23 400%+ Total Shareholder Return Since Spin-off ² Paperboard peers include International Paper, Graphic Packaging, Kapstone, MeadWestvaco, Packaging Corp of America, RockTenn,
Sonoco and WestRock. MeadWestvaco is excluded following merger announcement on January
26, 2015, and WestRock included in place
of RockTenn beginning June 24, 2015. ³ Large cap consumer product peers include Kimberly-Clark and Procter & Gamble. INDEXED TOTAL RETURNS SPIN DATE (100)% 0% 100% 200% 300% 400% 500% 600% 700% 800% 900% Dec-2008 Apr-2010 Aug-2011 Dec-2012 Apr-2014 Aug-2015 Clearwater Paper Small Cap Tissue¹ Paperboard² Large Cap Consumer³ S&P 500 406.2% 633.0% 158.3% 148.4% 104.1% 1 SMALL-CAP
TISSUE |
 Strong Upward Trend in Multiple Over Time
WHICH HAS LED TO MULTIPLE
EXPANSION SINCE THE SPIN
24 CLEARWATER PAPER SMALL-CAP
TISSUE
1 PAPERBOARD 2 LARGE-CAP
CONSUMER
3 SPIN DATE 2-YEAR FORWARD EBITDA MULTIPLE Source: Bloomberg and Capital IQ. Market data as of Aug 25 , 2015 1 Small cap tissue peers include Cascades, Orchids and Wausau. ² Paperboard peers include International Paper, Graphic Packaging, Kapstone, MeadWestvaco, Packaging Corp of America, RockTenn,
Sonoco and WestRock. MeadWestvaco is excluded following merger announcement on January
26, 2015, and WestRock included in place
of RockTenn beginning June 24, 2015. ³ Large cap consumer product peers include Kimberly-Clark and Procter & Gamble. 2x 4x 6x 8x 10x 12x 14x Dec-2008 Apr-2010 Aug-2011 Dec-2012 Apr-2014 Aug-2015 Clearwater Paper Small Cap Tissue¹ Paperboard² Large Cap Consumer Products³ 10.9x 6.9x 6.5x 6.0x |
 RETURN
ON INVESTED CAPITAL 1,6
(UNAUDITED) 25 1 Return on Invested Capital (ROIC) is defined as [Net Earnings + Interest Expense] / [Tangible Stockholders’ Equity 6 + Debt – Excess (Deficit) Cash 6 ]. 2 Weighted Average Cost of Capital (WACC) is defined as [(Debt x Cost of Debt x {1-Marginal Tax Rate})/(Debt + Stockholders’ Equity)]+
[(Stockholders’ Equity x Cost of Equity)/(Debt + Stockholders’ Equity)]. 3 2013 Adjusted ROIC Net Earnings was adjusted to remove a benefit of $67.5 million from discrete tax items relating to release of uncertain tax positions. 2013 Adjusted ROIC Interest Expense includes debt retirement costs of $17.1 million. 4 2014 Adjusted ROIC Net Earnings was adjusted to remove costs/loss associated with optimization and sale of the specialty mills totaling $37.0
million after-tax. 2014 Adjusted ROIC Interest Expense includes debt
retirement costs of $24.4 million. 5
LTM Ending 6/30/15 Adjusted ROIC Net Earnings was adjusted to remove costs/loss
associated with optimization and sale of the specialty mills totaling $36.0 million after-tax. LTM Ending 6/30/15 Adjusted ROIC Interest Expense includes debt retirement costs of $24.4 million.
6 Non-GAAP measure – See definition and reconciliation to most comparable GAAP measure below. 12.4% 12.7% 16.7% 4.7% 4.3% 11.1% 12.7% 12.2% 8.3% 7.7% 6.5% 4.5% 3.7% 0% 5% 10% 15% 20% 2011 2012 2013 2014 LTM Ending 6/30/15 5 ROIC Adjusted ROIC WACC 2 3,4,5 1 4 3 |
 CLEARWATER PAPER’S
OUTLOOK 26 |
 CONSUMER PRODUCTS PULP AND PAPERBOARD CORPORATE SHIPMENT VOLUMES • Higher : 2–4% higher • Lower : 3-4% lower PRICE/MIX • Slightly higher: 0–2% higher • Slightly lower : 0-1% lower PULP/WOOD FIBER COSTS • Cost/shipped ton: stable • Cost/shipped ton: stable CHEMICAL COSTS • Cost/shipped ton: stable • Cost/shipped ton: lower OP. & PKG. SUPPLIES • Cost/shipped ton: stable • Cost/shipped ton: stable TRANSPORTATION COSTS • Cost/shipped ton: higher • Cost/shipped ton: stable ENERGY COSTS • Cost/shipped ton: stable • Cost/shipped ton: lower MAINTENANCE & REPAIRS • Stable • Lower due to completion
of Arkansas major
maintenance outage ($7M)
SG&A • Stable • Stable • Stable UPDATED THIRD QUARTER 2015 OUTLOOK (COMPARED TO Q2’15) 1 27 Outlook: consolidated net sales flat; adjusted operating margin 9.0-10.0% 2 1 This information is based upon management’s current expectations and estimates, which are in part based on market and industry data.
Many factors are outside the control of management, including particularly
input costs for commodity products, and actual results may differ materially from the information set forth above. See “Forward-Looking Statements” on page 2. 2 Updated from Q2 2015 Supplemental Information provided on July 30, 2015. 2 2 2 |
 28 1 This information is based upon management’s current expectations and estimates, which are in part based on market and industry data. Many
factors are outside the control of management, including particularly
input costs for commodity products, and actual results may differ materially from the information set forth above. See “Forward-Looking Statements” on page 2. 2 Non-GAAP measure – See definition and reconciliation to most comparable GAAP measure below. UPDATED BRIDGE TO Q3’15 ADJUSTED EBITDA OUTLOOK 1,2 $51 $1-$2 $3-$4 $2-$3 $2-$3 $7 $1 $1 $62-$66 $1 $15 $25 $35 $45 $55 $65 $75 Q2'15 Adj. EBITDA PPD Price/Volume CPD Price/Volume Chemicals Energy Maintenance Labor Transportation AR Electrical Disruptions Q3'15 Adj. EBITDA Outlook ADJ. EBITDA 2 (MILLIONS) 1,2 2 |
 APPENDIX 29 |
 RECONCILIATION OF GAAP TO NON-GAAP:
CLEARWATER PAPER EBITDA 1 AND ADJUSTED EBITDA 1 30 ¹ See Appendix for the definition of Adjusted EBITDA as well as the reconciliation to the most comparable GAAP measure.
2 Interest expense, net for 2009, 2013, and 2014 includes debt retirement costs of $6.2, $17.1 and $24.4 million respectively.
($ in millions) 2008 2009 2010 2011 2012 2013 2014 Q1’15 Q2’15 earnings/(loss) $ 9.7 $ 182.5 $ 73.8 $ 39.7 $ 64.1 $ 107.0 $ (2.3) $ 5.8 $ 15.6 $ 5.6 $ 93.2 $ 2.4 $ 31.2 $ 47.5 $ (68.7) $ (18.6) $ 1.7 $ 8.7 2 $ 13.1 $ 21.7 $ 22.6 $ 44.8 $ 33.8 $ 61.1 $ 63.6 $ 7.8 $ 7.8 $ 47.0 $ 47.4 $ 47.7 $ 76.9 $ 79.3 $ 90.3 $ 90.1 $ 21.0 $ 20.6 1 $ 75.4 $ 344.8 $ 146.5 $ 192.7 $ 224.7 $ 189.6 $ 170.0 $ 36.2 $ 52.7 - $ (170.6) - - - - - - - - - $ 20.3 - - - - - - - - - $ 2.9 - - - - - - - - - $ 1.0 - - - - - - - - $ 2.0 - - - - - - - - - $ 6.0 $ 1.3 - - - - - - - - $ 18.8 $ .6 $ .7 equity-based compensation expense (benefit) - $ 2.6 $ 3.7 $ 1.5 $ 1.4 $ 4.1 $ 4.6 $ (.5) $ (1.5) - - - - - - - $ 1.7 - associated with optimization and sale of the specialty mills - - - - - - $ 40.8 $ (.1) $ (1.3) of Clearwater Fiber intangible asset - - - - - - 3.1 - - EBITDA 1 $ 75.4 $ 176.8 $ 170.5 $ 197.1 $ 229.1 $ 199.7 $ 238.5 $ 37.9 $ 50.7 $ |
 EBITDA
& ADJUSTED EBITDA RECONCILIATION OF NON-GAAP
FINANCIAL MEASURES (UNAUDITED)
31 1 EBITDA is a non-GAAP measure that management uses as a supplemental performance measure. The most directly comparable GAAP measure is
net earnings (loss). EBITDA is net earnings (loss) adjusted for net
interest expense (including debt retirement costs), income taxes, and depreciation and amortization. It should not be considered as an alternative to net earnings (loss) computed under GAAP.
2 Interest expense, net for the third quarter of 2014 includes debt retirement costs of $24.4 million.
3 Adjusted EBITDA excludes the impact of the items listed that we do not believe are indicative of our core operating performance.
(Dollars in thousands)
Q1'14 Q2'14 Q3'14 Q4'14 Q1'15 Q2'15 Earnings before interest, income taxes, and depreciation & amortization (EBITDA) 1 GAAP net earnings (loss) $ 6,226 $ 12,453 $ 6,253 ($27,247) $ 5,757 $ 15,597 Interest expense, net 2 10,734 10,688 33,990 8,158 7,782 7,774 Income tax provision 3,558 9,942 3,735 1,321 1,698 8,702 Depreciation and amortization expense 22,231 22,015 22,293 23,606 21,008 20,632 EBITDA 1 $ 42,749 $ 55,098 $ 66,271 $ 5,838 $ 36,245 $ 52,705 Directors' equity-based compensation expense (benefit) 2,817 (36) (185) 2,010 (470) (1,457) Costs associated with Thomaston facility closure 750 374 42 91 - - Costs associated with Long Island facility closure 8,432 1,843 4,767 3,771 554 735 Costs/loss associated with optimization and sale of the specialty mills - - 1,066 39,735 (131) (1,331) Loss on impairment of Clearwater Fiber intangible asset - - - 3,078 - - Costs associated with labor agreement - - - - 1,730 - Adjusted EBITDA 3 $ 54,748 $ 57,279 $ 71,961 $ 54,523 $ 37,928 $ 50,652 |
 SEGMENT
EBITDA & ADJUSTED EBITDA RECONCILIATION OF NON-GAAP
FINANCIAL MEASURES (UNAUDITED)
32 1 Segment EBITDA is a non-GAAP measure that management uses as a supplemental performance measure. The most directly comparable GAAP
measure is segment operating income (loss). Segment EBITDA is segment
operating income (loss) adjusted for depreciation and amortization. It should not be considered as an alternative to segment operating income (loss) computed under GAAP. 2 Segment Adjusted EBITDA excludes the impact of the items listed that we do not believe are indicative of our core operating
performance. (Dollars in thousands)
Q1'14 Q2'14 Q3'14 Q4'14 Q1'15 Q2'15 Consumer Products Operating (loss) income ($523) $ 12,705 $ 12,535 (30,745) $ $ 12,395 $ 17,032 Depreciation and amortization expense 15,490 15,071 15,484 15,459 12,977 13,438 Segment EBITDA 1 $ 14,967 $ 27,776 $ 28,019 ($15,286) $ 25,372 $ 30,470 Costs associated with Thomaston facility closure 750 374 42 91 - - Costs associated with Long Island facility closure 8,432 1,843 4,767 3,771 554 735 Costs/loss associated with optimization and sale of the specialty mills - - 579 40,222 (131) (1,331) Costs associated with labor agreement - - - - 814 - Segment Adjusted EBITDA 2 $ 24,149 $ 29,993 $ 33,407 $ 28,798 $ 26,609 $ 29,874 Pulp and Paperboard Operating income $ 36,776 $ 33,635 $ 45,602 $ 28,158 $ 16,194 $ 27,754 Depreciation and amortization expense 6,270 6,019 5,939 7,224 7,311 6,737 Segment EBITDA 1 $ 43,046 $ 39,654 $ 51,541 $ 35,382 $ 23,505 $ 34,491 Loss on impairment of Clearwater Fiber intangible asset - - - 3,078 - - Costs associated with labor agreement - - - - 916 - Segment Adjusted EBITDA 2 $ 43,046 $ 39,654 $ 51,541 $ 38,460 $ 24,421 $ 34,491 Corporate Operating loss ($15,735) ($13,257) ($14,159) ($15,181) ($13,352) ($12,713) Depreciation and amortization expense 471 925 870 923 720 457 Corporate EBITDA 1 ($15,264) ($12,332) ($13,289) ($14,258) ($12,632) ($12,256) Directors' equity-based compensation expense (benefit) 2,817 (36) (185) 2,010 (470) (1,457) Costs/loss associated with optimization and sale of the specialty mills - - 487 (487) - - Corporate Adjusted EBITDA 2 ($12,447) ($12,368) ($12,987) ($12,735) ($13,102) ($13,713) |
 ADJUSTED GROSS PROFIT & ADJUSTED SG&A RECONCILIATION OF NON-GAAP FINANCIAL MEASURES (UNAUDITED) 33 1 Gross profit is defined as net sales minus cost of sales. 2 Adjusted gross profit and Adjusted selling, general and administrative expenses exclude the impact of the items listed that we do not believe are
indicative of our core operating performance. (Dollars in
thousands) Q1'14
Q2'14 Q3'14 Q4'14 Q1'15 Q2'15 Gross profit 1 $ 58,291 $ 64,648 $ 76,685 $ 58,675 $ 44,194 $ 60,211 Costs associated with Thomaston facility closure 750 374 42 91 - - Costs associated with Long Island facility closure 3,941 1,843 3,877 3,771 554 735 Costs associated with labor agreement - - - - 1,730 - Adjusted gross profit 2 $ 62,982 $ 66,865 $ 80,604 $ 62,537 $ 46,478 $ 60,946 Selling, general and administrative expenses (SG&A) ($33,514) ($31,565) ($31,817) ($33,206) ($28,957) ($28,138) Costs associated with Long Island facility closure 232 - - - - - Directors' equity-based compensation expense (benefit) 2,817 (36) (185) 2,010 (470) (1,457) Costs/loss associated with optimization and sale of the specialty mills - - 1,066 (424) (131) (1,331) Adjusted selling, general and administrative expenses 2 ($30,465) ($31,601) ($30,936) ($31,620) ($29,558) ($30,926) |
 SEGMENT
ADJUSTED OPERATING INCOME (LOSS)
RECONCILIATION OF NON-GAAP
FINANCIAL MEASURES (UNAUDITED)
34 1 Adjusted operating income (loss) excludes the impact of the items listed that we do not believe are indicative of our core operating
performance. (Dollars in thousands)
Q1'14 Q2'14 Q3'14 Q4'14 Q1'15 Q2'15 Consumer Products Operating (loss) income ($523) $ 12,705 $ 12,535 ($30,745) $ 12,395 $ 17,032 Costs associated with Thomaston facility closure 750 374 42 91 - - Costs associated with Long Island facility closure 8,432 1,843 4,767 3,771 554 735 Costs/loss associated with optimization and sale of the specialty mills - - 579 40,222 (131) (1,331) Costs associated with labor agreement - - - - 814 - Adjusted Consumer Products operating income 1 $ 8,659 $ 14,922 $ 17,923 $ 13,339 $ 13,632 $ 16,436 Pulp and Paperboard Operating Income $ 36,776 $ 33,635 $ 45,602 $ 28,158 $ 16,194 $ 27,754 Loss on impairment of Clearwater Fiber intangible asset - - - 3,078 - - Costs associated with labor agreement - - - - 916 - Adjusted Pulp and Paperboard operating income 1 $ 36,776 $ 33,635 $ 45,602 $ 31,236 $ 17,110 $ 27,754 Corporate Operating loss ($15,735) ($13,257) ($14,159) ($15,181) ($13,352) ($12,713) Directors' equity-based compensation expense (benefit) 2,817 (36) (185) 2,010 (470) (1,457) Costs/loss associated with optimization and sale of the specialty mills - - 487 (487) - - Adjusted Corporate operating loss 1 ($12,918) ($13,293) ($13,857) ($13,658) ($13,822) ($14,170) |
 ADJUSTED NET EARNINGS & ADJUSTED NET
EARNINGS PER DILUTED COMMON SHARE
RECONCILIATION OF NON-GAAP FINANCIAL
MEASURES (UNAUDITED)
35 1 All non-tax items are tax effected at the expected annual rate for that period.
2 Adjusted net earnings and Adjusted net earnings per diluted common share exclude the impact of the items listed that we do not believe are
indicative of our core operating performance. (Dollars in thousands
- except per-share amounts)
Q1'14 Q2'14 Q3'14 Q4'14 Q1'15 Q2'15 GAAP net earnings (loss) $ 6,226 $ 12,453 $ 6,253 ($27,247) $ 5,757 $ 15,597 Special items, after tax: 1 Debt retirement costs - - 15,777 - - - Directors' equity-based compensation expense (benefit) 1,802 (23) (120) 1,322 (325) (998) Costs associated with Thomaston facility closure 480 242 27 60 - - Costs associated with Long Island facility closure 5,394 1,193 3,069 2,480 383 504 Costs/loss associated with optimization and sale of the specialty mills - - 689 36,338 (91) (912) Discrete tax item related to state tax rate changes - 1,388 - - - - Loss on impairment of Clearwater Fiber intangible asset - - - 2,024 - - Costs associated with labor agreement - - - - 1,197 - Adjusted net earnings 2 $ 13,902 $ 15,253 $ 25,695 $ 14,977 $ 6,921 $ 14,191 Net earnings (loss) per diluted common share $ 0.29 $ 0.61 $ 0.31 ($1.39) $ 0.30 $ 0.81 Special items, after tax: 1 Debt retirement costs - - 0.78 - - - Directors' equity-based compensation expense (benefit) 0.08 - (0.01) 0.07 (0.02) (0.05) Costs associated with Thomaston facility closure 0.02 0.01 - - - - Costs associated with Long Island facility closure 0.25 0.06 0.15 0.13 0.02 0.03 Costs/loss associated with optimization and sale of the specialty mills - - 0.03 1.86 - (0.05) Discrete tax item related to state tax rate changes - 0.07 - - - - Loss on impairment of Clearwater Fiber intangible asset - - - 0.10 - - Costs associated with labor agreement - - - - 0.06 - Adjusted net earnings per diluted common share 2 $ 0.66 $ 0.74 $ 1.28 $ 0.77 $ 0.36 $ 0.74 |
 KEY
SEGMENT RESULTS – PULP AND PAPERBOARD
(UNAUDITED) 36 1 Non-GAAP measure – See definition and reconciliation to most comparable GAAP measure below. 2 Segment Adjusted EBITDA margin is defined as Segment Adjusted EBITDA divided by Segment net sales.
PULP AND PAPERBOARD CROSS-CYCLE FINANCIAL MODEL Q1'14 Q2'14 Q3'14 Q4'14 Q1’15 Q2’15 (short tons) 200,665 195,924 201,609 176,467 191,635 204,983 $988 $1,017 $1,016 $1,017 $1,031 $997 in thousands) $198,412 $199,629 $205,038 $180,675 $198,850 $205,167 1 ($ in thousands) $43,046 $39,654 $51,541 $38,460 $24,421 $34,491 1,2 21.7% 19.9% 25.1% 21.3% 12.3% 16.8% 19.0% |
 KEY
SEGMENT RESULTS – CONSUMER PRODUCTS
(UNAUDITED) 37 1 Includes away-from-home (AFH), contract, machine-glazed (MG) and parent roll tissue products. 2 Includes retail, AFH, and contract tissue case products. 3 Non-GAAP measure – See definition and reconciliation to most comparable GAAP measure below. 4 Segment Adjusted EBITDA margin is defined as Segment Adjusted EBITDA divided by Segment net sales. 5 Results include specialty tissue business which was sold at the end of Q4’14.
CONSUMER PRODUCTS CROSS-CYCLE FINANCIAL MODEL RESULTS INCLUDE SPECIALTY MILLS 5 RESULTS WITHOUT SPECIALTY MILLS Q1'14 Q2'14 Q3'14 Q4'14 Q1'15 Q2’15 Shipments Non-Retail (short tons) 1 56,839 59,832 59,703 57,765 21,107 24,744 Retail (short tons) 70,919 75,009 75,363 72,420 71,102 71,476 Total Tissue Tons 127,758 134,841 135,066 130,185 92,209 96,220 Converted Products (cases in thousands) 2 13,437 14,101 14,360 13,603 13,025 13,125 Sales Price Non-Retail ($/short ton) 1 $1,489 $1,492 $1,531 $1,506 $1,475 $1,430 Retail ($/short ton) $2,841 $2,795 $2,836 $2,820 $2,864 $2,846 Total Tissue ($/short ton) $2,239 $2,217 $2,259 $2,237 $2,546 $2,482 Segment net sales ($ in thousands) $286,508 $299,130 $306,104 $291,643 $235,176 $239,391 Segment Adjusted EBITDA 3 ($ in thousands) $24,149 $29,993 $33,407 $28,798 $26,609 $29,874 Segment Adjusted EBITDA margin 3,4 8.4% 10.0% 10.9% 9.9% 11.3% 12.5% 17.0% |
 RETURN
ON INVESTED CAPITAL, TANGIBLE STOCKHOLDERS’ EQUITY & EXCESS CASH
RECONCILIATION OF NON-GAAP FINANCIAL
MEASURES (UNAUDITED)
38 (Dollars in thousands) 2011 2012 2013 2014 Twelve Months Ending June 30, 2015 Net earnings (loss) 39,674 $ 64,131 $ 106,955 $ ($2,315) 360 $ Interest expense, net 44,809 33,796 44,036 39,150 33,284 Net earnings before interest 1 84,483 $ 97,927 $ 150,991 $ 36,835 $ 33,644 $ Tangible stockholders' equity 2 205,623 $ 263,608 $ 334,783 $ 263,494 $ 255,741 $ Debt 523,694 523,933 650,000 575,000 575,000 Less excess cash 3 (48,440) (17,579) (78,675) (62,331) (56,465) Invested capital 680,877 $ 769,962 $ 906,108 $ 776,163 $ 774,276 $ Return on Invested Capital (ROIC) 12.4% 12.7% 16.7% 4.7% 4.3% Stockholders' equity 484,904 $ 540,894 $ 605,094 $ 497,537 $ 487,301 $ Goodwill (229,533) (229,533) (229,533) (209,087) (209,087) Intangible assets, net (49,748) (47,753) (40,778) (24,956) (22,473) Tangible stockholders' equity 2 205,623 $ 263,608 $ 334,783 $ 263,494 $ 255,741 $ Cash 8,439 $ 12,579 $ 23,675 $ 27,331 $ 11,465 $ Short-term investments 55,001 20,000 70,000 50,000 60,000 Operating cash 4 (15,000) (15,000) (15,000) (15,000) (15,000) Excess cash 3 48,440 $ 17,579 $ 78,675 $ 62,331 $ 56,465 $ 1 Note: Balance sheet items are as of the end of each period presented. 2 3 4 Non-GAAP measure. Tangible stockholders' equity is defined as stockholders’ equity less Goodwill and Intangible assets, net.
Operating cash is defined as a minimum amount of available cash deemed by management to
be sufficient to avoid operating disruptions due to a mismatch of cash inflows and outflows during an accounting period. Excess cash is defined as the sum of Cash and Short-term investments less Operating cash 1 . |
 PRO
FORMA IMPACT OF SALE OF SPECIALTY MILLS
(UNAUDITED) 39 1 Non-GAAP measure – See definition and reconciliation to most comparable GAAP measure CONSUMER PRODUCTS INCLUDING SPECIALTY MILLS SPECIALTY MILLS PRO FORMA CONSUMER PRODUCTS EXCLUDING SPECIALTY MILLS (Dollars in millions) TWELVE MONTHS ENDED DECEMBER 31, 2014 TWELVE MONTHS ENDED NOVEMBER 30, 2014 PRO FORMA Net sales $1,183.4 $217.7 $965.7 Adjusted operating income 1 $54.8 $8.8 $46.0 Depreciation and amortization expense $61.5 $9.6 $51.9 Adjusted EBITDA 1 $116.3 $18.4 $97.9 |
 40 1 This information is based upon management’s current expectations and estimates, which are in part based on market and industry data.
Many factors are outside the control of management, including particularly
input costs for commodity products, and actual results may differ materially from the information set forth above. See “Forward-Looking Statements” on page 2. 2 EBITDA is a non-GAAP measure that management uses as a supplemental performance measure. The most directly comparable GAAP measure is
net earnings (loss). EBITDA is net earnings adjusted for net interest
expense (including debt retirement costs), income taxes, and depreciation and amortization. It should not be considered as an alternative to net earnings computed under GAAP. 3 Adjusted EBITDA excludes the impact of the items listed that we do not believe are indicative of our core operating performance.
Q3’15 OUTLOOK 1 RECONCILIATION OF NON-GAAP FINANCIAL MEASURES (UNAUDITED) (Dollars in thousands) FROM TO Earnings before interest, income taxes, and depreciation & amortization (EBITDA) 2 GAAP net earnings $21,000 $23,000 Interest expense, net $8,000 $8,000 Income tax provision $11,000 $13,000 Depreciation and amortization expense $21,000 $21,000 EBITDA 2 $61,000 $65,000 Directors' equity-based compensation expense $700 $700 Costs associated with Long Island facility closure $300 Adjusted EBITDA 3 $62,000 $66,000 THREE MONTHS ENDING SEPTEMBER 30, 2015 RANGE OF ESTIMATE OUTLOOK $300 |
 RECONCILIATION OF GAAP TO NON-GAAP:
STRATEGIC INVESTMENTS 41 ¹ See Appendix for the definition of Adjusted EBITDA as well as the reconciliation to the most comparable GAAP measure.
PULP OPTIMIZATION WAREHOUSE AUTOMATION PAPER MACHINE UPGRADES CONVERTING LINE OPERATING EFFICIENCIES SALES & MARKETING EFFICIENCY STRANDED OVERHEAD Operating Income $22.5-27.5 $21.3-26.3 $7.1-8.1 $8.6-10.6 $20 - $32 $10 - $15 $7 Depreciation $7.5 $5.7 $3.9 $1.4 - - - EBITDA $30 - $35 $27 - $32 $11 - $12 $10 - $12 $20 - $32 $10 - $15 $7 Adjusted EBITDA $30 - $35 $27 - $32 $11 - $12 $10 - $12 $20 - $32 $10 - $15 $7 |
 DEFINITIONS OF NON-GAAP
MEASURES CLEARWATER PAPER DEFINITIONS OF NON-GAAP MEASURES EBITDA is a non-GAAP measure that Clearwater Paper management uses as a supplemental performance measure to evaluate the cash generating capacity of Clearwater
Paper. The most directly comparable GAAP measure is net earnings. EBITDA, as
defined by Clearwater Paper management, is net earnings adjusted for net
interest expense, income taxes, and depreciation and amortization. It
should not be considered as an alternative to net earnings computed
under GAAP. Adjusted EBITDA is a non-GAAP measure that Clearwater
Paper management defines as EBITDA adjusted for items that we do not
believe are indicative of our core operating performance, including
acquisition and disposition related expenses, alternative fuel mixture
tax credits, sale of foam assets, expenses associated with the Metso litigation and
costs associated with directors equity based compensation. The
most directly comparable GAAP measure is net earnings. It should
not be considered as an alternative to net earnings computed under
GAAP. 42 |
 MAJOR
MAINTENANCE SCHEDULE¹
2014 2015 2016 2017 2018 2019 2020 2021 Major Maintenance $MMs $0 $22 TBD TBD TBD TBD $0 TBD Lewiston Q1 Q3 Q1 Q3 Q1 Cypress Bend Q2 Q2 Q2 Q2 43 1 This information is based upon management’s current expectations and estimates. |
 NORTH
AMERICAN TISSUE PROJECTED CAPACITY CHANGE
44 Source: RISI and Other Industry COMPANY MILL/LOCATION CONV/TAD CAPACITY CHANGE ESTIMATED DATE CHANNEL/BUSINESS/PRODUCTS Announced New Capacity through 2016 Double Tree/Royal Gila Bend, AZ Conv 32,000 2015:Q1 PrimeLine PM from Adritz Orchids Paper Products Pryor, OK Conv 30,000 2015:Q1 New PM from Recard Confidential Confidential Conv 80,000 2015:Q4 Metso Advantage DCT 200TS First Quality Tissue Anderson, SC TAD 70,000 2015:Q4 TAD PM Valmet Von Drehle Corporation Natchez, MS Conv 35,000 2015:Q4 Valmet Advantage NTT St. Croix Tissue (APP) Baileyville, ME Conv 66,000 2015:Q4 PrimeLine W8 PM from Adritz First Quality Tissue Anderson, SC ATMOS 75,000 2016:Q1 Retail/P.L./BRT St. Croix Tissue (APP) Baileyville, ME Conv 66,000 2016:Q2 PrimeLine W8 PM from Andritz First Quality Tissue Lock Haven, PA TAD 70,000 2016:Q4 TAD PM likely Valmet Confidential Confidential Conv 70,000 2016 Metso Advantage DCT Net Capacity Change through 2016 594,000 Announced New Capacity in 2017 Orchids Paper Products Barnwell, SC Conv 35,000 2017:Q1 PM likely Valmet Resolute Forest Products Calhoun, TN Conv 66,000 2017:Q1 Valmet Advantage NTT Procter & Gamble Box Elder, UT TAD 80,000 2017:Q3 Retail/Brand/Bounty Net Capacity Change through 2017 181,000 Capacity Changes in the North American Tissue Industry |