Attached files
| file | filename |
|---|---|
| EX-99.2 - EX-99.2 - CALPINE CORP | d68097dex992.htm |
| 8-K - 8-K - CALPINE CORP | d68097d8k.htm |
 Barclays Capital 2015 CEO Energy/Power Conference Thad Hill President and CEO, Calpine Corp. September 9, 2015 Exhibit 99.1 |
 2 Forward-Looking Statements The information contained in this presentation includes certain estimates, projections and other forward-looking
information that reflect Calpine’s current views with respect to
future events and financial performance. These estimates,
projections and other forward-looking information are based on assumptions that Calpine believes, as of the date hereof, are reasonable. Inevitably, there will be differences between such estimates and actual results, and
those differences may be material.
There can be no assurance that any estimates, projections or
forward-looking information will be realized. All such
estimates, projections and forward-looking information speak only as of the date hereof. Calpine undertakes no duty to update or revise the information contained herein other than as required by law.
You are cautioned not to place undue reliance on the estimates,
projections and other forward-looking information in
this presentation as they are based on current expectations and general
assumptions and are subject to various risks,
uncertainties and other factors, including those set forth in
Calpine’s Quarterly Reports on Form 10Q for the three
months ended March 31 and June 30, 2015, its Annual Report on Form
10-K for the year ended December 31, 2014 and in other
documents that Calpine files with the SEC. Many of these risks, uncertainties and other factors are beyond Calpine’s control and may cause actual results to differ materially from the views, beliefs and estimates expressed
herein. Calpine’s reports and other information filed
with the SEC, including the risk factors identified in its Annual Report on Form 10-K for the year ended December 31, 2014, can be found on the SEC’s website at www.sec.gov and on
Calpine’s website at www.calpine.com.
Reconciliation to U.S. GAAP Financial Information
The following presentation includes certain “non-GAAP financial
measures” as defined in Regulation G under the
Securities Exchange Act of 1934, as amended. Schedules are
included herein that reconcile the non-GAAP financial
measures included in the following presentation to the most directly
comparable financial measures calculated and presented in
accordance with U.S. GAAP. Safe Harbor Statement
|
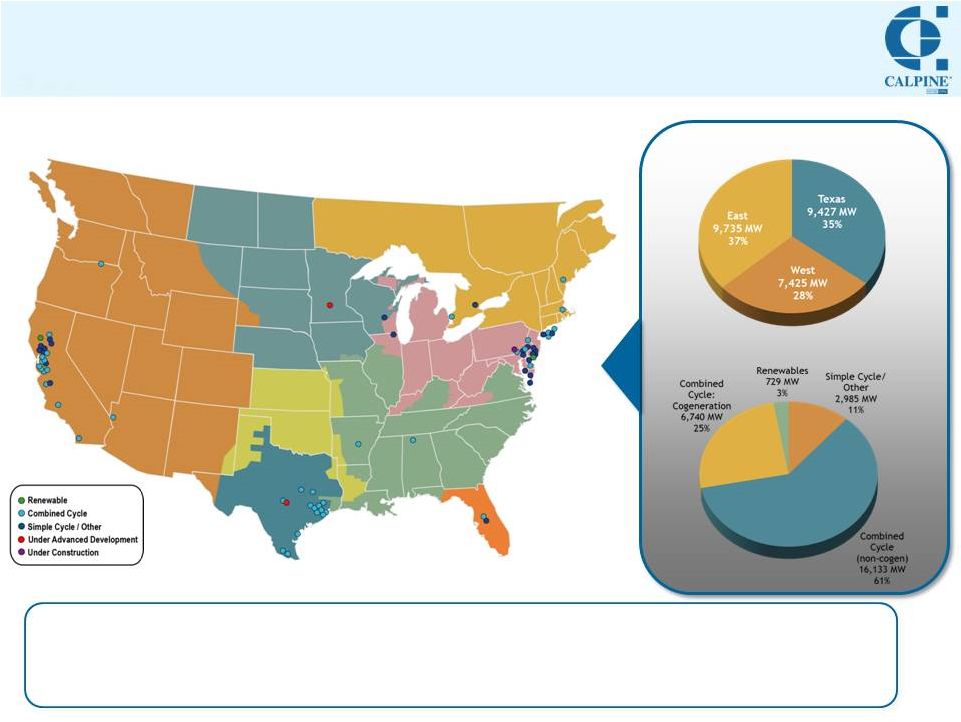 3 National Portfolio of Approximately 27,000 MW As of 07/30/2015 • Geographically diversified portfolio: Scale in three most competitive power markets in America
• Largest operator of combined heat and power (cogeneration) technology in America
• Largest geothermal power producer in America • Featuring one of smallest environmental footprints in America’s power generation sector
• Geographically diversified portfolio: Scale in three most competitive power markets in America
• Largest operator of combined heat and power (cogeneration) technology in America
• Largest geothermal power producer in America • Featuring one of smallest environmental footprints in America’s power generation sector
Geographic Diversity
Dispatch Technology |
 4 Clean Modern Efficient Source: Calpine, Energy Velocity (2014). Figures adjusted to incorporate announced/completed M&A activity as though it
were effective as of 1/1/14. CPN steam-adjusted heat rate excludes peakers. TLN does not reflect potential divestitures required to occur within 12 months of formation.
Our 2014 steam-adjusted
heat rate was 7,384
Nation’s Largest Baseload
Renewable,
Natural Gas and Cogeneration Power Provider
6,000 8,000 10,000 12,000 CPN DYN TLN NRG 0 500 1,000 1,500 2,000 2,500 CPN DYN TLN NRG 0 1 2 3 4 5 CPN DYN TLN NRG 0 10 20 30 40 50 CPN DYN TLN NRG |
 Well Positioned for Secular Trends 5 Complemented by Disciplined & Balanced Capital Allocation 1 Calpine uniquely advantaged in evolving power markets $0.8 B $1.5 B $1.3 B $3.3 B $1.6 B 2011 2012 2013 2015E Acquisition Organic Growth Debt Repayment / Financing Costs Share Repurchase Right Fleet • Clean, reliable, flexible assets • Best-in-class operations • No environmental compliance obligations or legacy liabilities Right Place • Scale in major US competitive wholesale power markets • Strategic geographic diversity • Increasing potential for volatility in key markets Right Time • Abundant, affordable natural gas • More stringent environmental regulations • Need for flexible capacity to integrate intermittent renewables • Markets prioritizing reliability 1 2014 As of 7/30/15 and includes estimated / announced 2015 growth capital expenditures, debt amortizations / repurchases, and YTD share
repurchases. |
 Current Topics • Recapping the Champion Acquisition • Texas: Signs of Life in August • PJM: Robust Capacity Performance Results • Clean Power Plan: Favoring Natural Gas Generation as Long-Term Solution
Calpine remains well positioned to benefit from key industry
trends 6 |
 7 Expanding Customer Channels Through Acquisition of Well-Established Retail Sales Platform Transaction Summary • $240 million 1 acquisition of nation’s largest independent retail electric provider • Purchased at ~4-5x initial Adjusted EBITDA 2 ; Immediately accretive to Adj. FCF 2 Per Share • Expected to close by 4Q15 Subject to working capital adjustments. A non-GAAP financial measure. Reconciliations of Adj. EBITDA and Adj. FCF to Net Income (Loss), the most comparable U.S. GAAP measure, are available on our website. Estimated for 2015. Industry standard conversion assumes 10 MWh of annual electricity usage per residential customer. • ~22 million MWh of customer load served annually 3 • Currently operating in ERCOT, PJM, MISO, NYISO and ISO-NE; New coverage areas to come • Primarily Commercial & Industrial customer base (~90% of load in 2014): ~19,000 C&I customers, or ~2 million residential customer equivalents 4 • Award-winning customer service practices, driving strong retention rates Strategic Rationale • Consistent with previously announced initiatives to get “closer to customers” — Essential in an era of declining wholesale power market liquidity • Ideal platform to add sizeable retail organization — Experienced team with track record for growth — Significant geographic overlap with Calpine wholesale fleet — Customer service commitment mirrors Calpine focus on operational excellence Extending customer reach through accretive acquisition Source: Champion Energy. 1 2 3 4 |
 Texas: Signs of Life in August 8 Energy-Only Market Responding to Heat + Record Load Available Wind Capacity (Availability Factor %) 1,063 MW (7%) 2,404 MW (17%) 2,390 MW (17%) 1,265 MW (9%) 1,082 MW (8%) 661 MW (5%) Outages 4,822 MW 4,859 MW 2,523 MW 3,081 MW 4,885 MW 5,264 MW Real-Time Price ² ($/MWh) $431 $620 $170 $507 $578 $784 Operating Reserve Margin³ 5.7% 5.0% 6.8% 5.4% 5.2% 5.7% System Statistics: Source: ERCOT, Calpine. Data shown for highest-price 5-minute interval of each day, during which time market
conditions were tightest. Online / available to
SCED. Shown for peak hour.
Actual amount of generation online in excess of peak demand, including
reserves. Record
Load (3 rd time in 5 days); What if wind had looked like a typical hot day? Reaction in Forward Curves Continued load growth Only modest incremental capacity in 2016 (nearly all wind) Favorable indicators for upside opportunity Source: Broker quotes, Calpine. ERCOT-HOU shown. 50,000 55,000 60,000 65,000 70,000 75,000 7/30/15 8/5/15 8/10/15 8/11/15 8/12/15 8/13/15 Operating Reserves Wind Fossil / Nuclear ¹ Demand (Load) 1 2 3 $20 $25 $30 $35 $40 $45 $50 Jan-15 Mar-15 May-15 Jul-15 |
 PJM: Robust Capacity Performance Results 9 Calpine’s PJM Fleet Features Locationally Advantaged Assets CPN MW Cleared (UCAP) 5,265 MW % Cleared as Capacity Perf. 65% Wtd.-Avg. Price $208/MW-d 2018/19 Auction: Key Takeaways • Locational separation — EMAAC = highest priced zone — ComEd separated from RTO for first time • Limited new build: Least amount to clear in last 4 years — Contributing factors: CP penalties financing challenges Increased risk for single sites Higher collateral requirements — Surprisingly low MOPR-exempt participation • Risk premiums — Performance penalty risk a key driver of bids MOPR Exempted 13,531 MW Offered 4,133 MW Cleared 3,507 MW Future Considerations • Heavy reliance on DR (11,000 MW) diminishes as CP target escalates to 100% • Additional plants at risk? — 13,000 MW uncleared — Clean Power Plan Reliable fleet well-positioned to respond to pay-for-performance initiatives
$50 $75 $100 $125 $150 $175 $200 $225 $250 0 500 1,000 1,500 2,000 2,500 3,000 3,500 4,000 EMAAC COMED MAAC RTO PPL CPN MW Base Price Capacity Performance Price |
 • Targets 75% CCGT utilization • Calls for market-based solution — Price on carbon will allow market to solve for most efficient means of emissions reductions Clean Power Plan Favors Natural Gas Generation as Long-Term Solution 10 Calpine’s Clean Fleet Benefits from Emissions Regulation Features lowest fossil-based CO2 footprint in IPP sector Clean Power Plan Highlights Calpine fleet benefits from higher capacity factors Forthcoming environmental regulations (+ low natural gas prices)
continue to favor natural gas-fired generation at the expense of
inefficient coal Implies generation
50%+
vs. prior 3yr average
0 500 1,000 1,500 2,000 2,500 CPN IPP1 IPP2 IPP3 0% 10% 20% 30% 40% 50% 60% 70% 80% 2012 2013 2014 2015YTD CCGT @ 75% CF … |
 Current guidance Original guidance +$100/kW = +$6/share price Why You Should Invest in Calpine Today Attractive Entry Point, Given Favorable Future Drivers 11 See footnotes included in 2Q15 earnings presentation on company website. Based upon CPN closing stock price of $15.30 on
9/2/15. Compelling Value Proposition…
Powerful Free Cash Flow Generator
Current share price
implies:
2015 Adj. FCF
Yield
~15% Merchant CCGT Value $375-425/kW • Increasing environmental regulations • Sustained low nat gas prices • Influx of intermittent renewables Need for integration and ramping support • Regulatory emphasis on reliability: “Pay for Performance” Secular Shift Away from Baseload Generation Monetize Yield Return Capital Manage Portfolio Manage Balance Sheet Focus on Customers Disciplined capital allocation + Active portfolio management Building upon our track record Supported by... 1 12% 13% 14% 15% 16% 17% $2.00 $2.10 $2.20 $2.30 $2.40 $2.50 $2.60 Adj. Free Cash Flow Per Share 1 2 3 |
 |