Attached files
| file | filename |
|---|---|
| 8-K - FORM 8-K - DONEGAL GROUP INC | d37671d8k.htm |
 Investor Presentation September 2015 Pursuing Effective Business Strategy in Regional Insurance Markets Exhibit 99.1 |
 Forward-Looking Statements
The Company bases all statements made in this presentation that are not
historic facts on its current expectations. These statements are
forward-looking in nature (as defined in the Private
Securities Litigation Reform Act of 1995) and involve a number of risks and
uncertainties. Actual results could vary materially. Factors
that could cause actual results to vary materially include: the
Company’s ability to maintain profitable operations, the adequacy of the
loss and loss expense reserves of the Company’s insurance
subsidiaries, business and economic conditions in the areas in
which the Company operates, interest rates, competition from various insurance and other financial businesses, acts of terrorism, the availability and cost of reinsurance, adverse and
catastrophic weather events, legal and judicial developments, changes in
regulatory requirements, the Company’s ability to integrate
and manage successfully the insurance companies it may acquire
from time to time and other risks the Company describes from time to time in the periodic reports it files with the Securities and Exchange Commission. You should not place undue
reliance on any such forward-looking statements. The Company
disclaims any obligation to update such statements or
to announce publicly the results of any revisions that it may
make to any forward-looking statements to reflect the
occurrence of anticipated or unanticipated events or
circumstances after the date of such statements. Reconciliations
of non-GAAP data are included in the Company’s news releases regarding quarterly financial results, available on the Company’s website at
investors.donegalgroup.com.
2 |
 Insurance Holding Company With Mutual
Affiliate • Regional property and casualty insurance group – 21 Mid-Atlantic, Midwestern, New England and Southern states – Distribution force of approximately 2,400 independent agencies – Completed 10 M&A transactions between 1988 and 2010 • Interrelated operations and pooling agreement with Donegal Mutual since inception in 1986 • DGICA and DGICB trade on NASDAQ exchange – DGICA dividend yield of 3.7% 3 |
 Structure Provides Stability to Pursue Successful
Long-Term Business Strategy
• Outperform industry in service, profitability and book value growth • Drive revenues with organic growth and opportunistic transactions • Focus on margin enhancements and investment contributions 4 (Detailed organizational chart included in Supplemental Information – see page 28) |
 Objective: Outperform Industry
Service, Profitability and Book Value Growth
5 Change in Net Written Premiums DGI CAGR: 7% Peer CAGR: 4%
GAAP Combined Ratio
DGI Avg: 99% Peer Avg: 100% Change in Book Value DGI CAGR: 6% Peer CAGR: 4%
Donegal Group
Peer Group* * Peer Group consists of CINF, EMCI, HMN, THG, SIGI, STFC, UFCS (Source: SNL) |
 1 st Half 2015: Improved Underwriting Results Led to Operating EPS* of 45¢ vs. None in 1 st Half 2014 • 8.8% increase in net written premiums – Driven by Michigan Insurance Company reinsurance change, rate increases and new commercial lines accounts • 96.6% statutory combined ratio* – Lower catastrophe weather losses vs. 1H 2014 – Continuing benefits from rate increases and underwriting initiatives • Book value per share at $15.62 compared with $15.40 at year-end 2014 6 Additional details are available at investors.donegalgroup.com
* Reconciliations and definitions of non-GAAP data also are available on
our website |
 Drive Revenues with Organic Growth and
Opportunistic Transactions
7 $302 $307 $314 $365 $363 $392 $454 $496 Net Written Premiums (dollars in millions) $579 7 $533 2005 2006 2007 2008 2009 2010 2011 2012 2013 2014 Michigan Sheboygan Peninsula Le Mars Southern Atlantic States December 2008 Acquired Sheboygan Falls Implemented Pooling Change December 2010 Acquired Michigan Implemented 25% Quota Share |
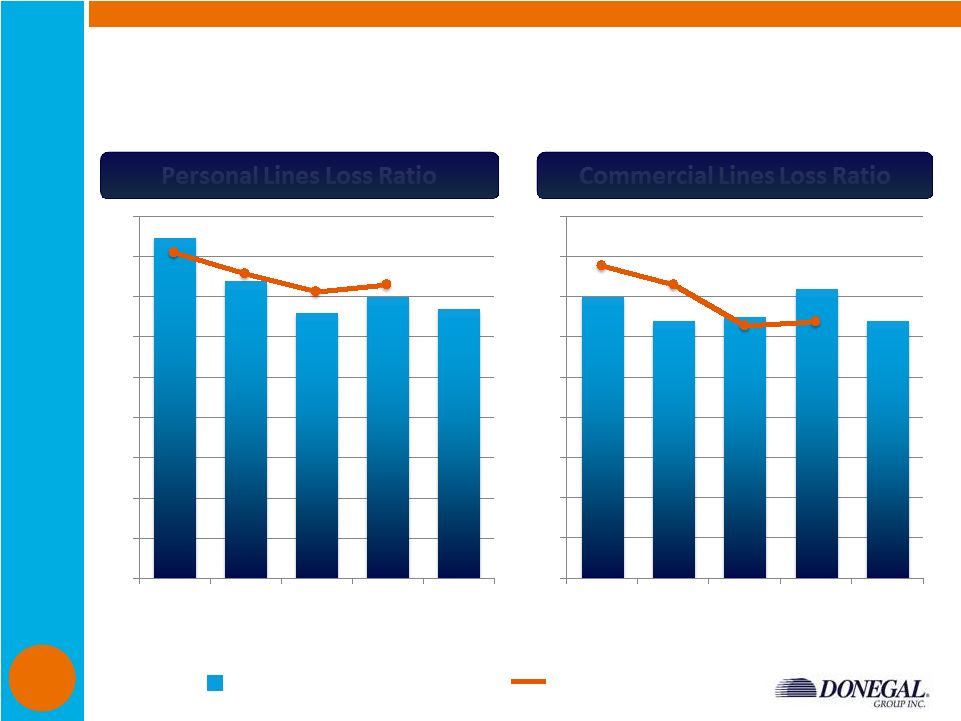 Focus on Underwriting Profitability to
Enhance Margins
0% 10% 20% 30% 40% 50% 60% 70% 80% 90% 2011 2012 2013 2014 2015 YTD 0% 10% 20% 30% 40% 50% 60% 70% 80% 90% 2011 2012 2013 2014 2015 YTD Donegal Insurance Group (SNL P&C Group) SNL P&C Industry (Aggregate) Personal Lines Loss Ratio Personal Lines Loss Ratio Commercial Lines Loss Ratio Commercial Lines Loss Ratio 8 |
 9 Achieve Book Value Growth By Implementing Plan Pursue quality premium growth and enhance underwriting profitability Support insurance operations with conservative investment strategy |
 Maintain Multi-faceted Regional Growth
Strategy • $579 million in 2014 net written premiums across 21 states in four operating regions – $768 million in direct written premiums for insurance group* • 10 M&A transactions since 1988 • Acquisition criteria: – Serving attractive geography – Favorable regulatory, legislative and judicial environments – Similar personal/commercial business mix – Premium volume up to $100 million 10 10 * Includes Donegal Mutual Insurance Company and Southern Mutual Insurance Company |
 Example: Michigan Insurance Company
• Attractive franchise acquired in 2010 • Fully integrated into Donegal systems in 2013 • Strategic fit – Capable management team – Quality agency distribution system – Diversified mix of business (Dollars in millions) 2015 2014 2013 2012 2011 2010 (under prior owner) Direct written premiums $115** $111 $112 $111 $108 $105 External quota share 0% 20% 30% 40% 50% 75% Ceded to Donegal Mutual* 25% 25% 25% 25% 25% N/A Retained by MICO 75% 55% 45% 35% 25% 25% Included in DGI NPW $95** $72 $62 $57 $46 N/A Statutory combined ratio 86.2% (1 half) 101% 99% 94% 95% 97% * Premiums ceded to Donegal Mutual are included in pooling agreement with Atlantic States (80% to DGI) ** Projected based
on estimated 2015 growth rate
11 st |
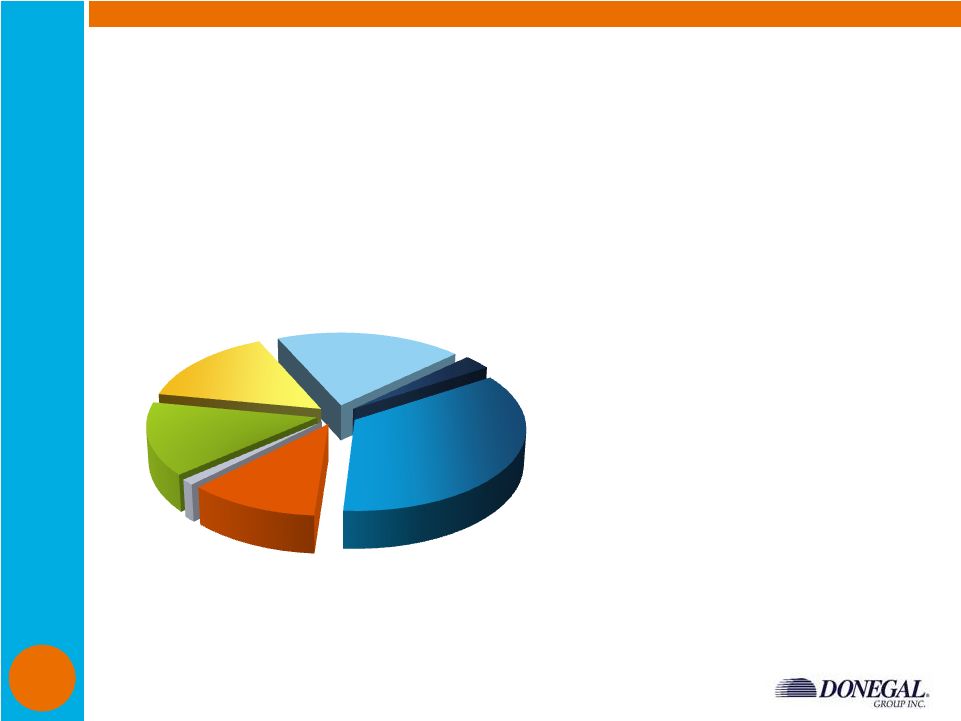 Continue Strategic Efforts to Balance
Business Mix Homeowners 20% Other Personal 3% Personal Auto 35% Commercial Auto 11% Other Commercial 1% Multi Peril 15% Workers' Comp 15% • Commercial lines = 42% of NWP in 2014 – Commercial lines renewal premiums increases in 5-
7% range – Ongoing emphasis on new business growth in all regions • Personal lines = 58% of NWP in 2014 – Rate increases in 3-
8% range – Modest exposure growth in addition to MICO premiums retained Net Written Premiums by Line of Business (2014) 12 |
 Emphasize Growth in Commercial Lines
• 93.7% statutory combined ratio for 1H 2015 • Introduce core Donegal products in new regions • Growth focus on accounts with premiums in $10,000 to $75,000 range • Expand appetite within classes and lines already written: – Agency development – Add related classes – Appropriately use reinsurance • Disciplined underwriting: – Expanding use of predictive modeling – Large account reviews – Loss control 50.0% 55.0% 60.0% 65.0% 70.0% 75.0% 80.0% 85.0% 90.0% 95.0% 100.0% 2010 2011 2012 2013 2014 In-Force Policy Count Retention Levels 13 |
 Focus on Personal Lines Profitability
• 98.9% statutory combined ratio for 1H 2015 • Focus on the preferred and superior risk markets • Underwriting initiatives: – Rate increases in virtually every jurisdiction – Expanding use of predictive modeling – New and renewal inspections – Seek geographic spread of risk – Balance portfolio (auto/home) • Strong policy retention 14 |
 Organic Growth Centered on Relationships
with ~2,400 Independent Agencies
• Ongoing objectives: – Achieve top three ranking within appointed agencies in lines of business we write – Cultivate relationships with existing agencies to move writings to next premium tier – Leverage “regional” advantages and maintain personal relationships as agencies grow and consolidate • Continuing focus on commercial lines growth: – Emphasize expanded commercial lines products and capabilities in current agencies – Appoint commercial lines focused agencies to expand distribution in key geographies – Strengthen relationships with agencies appointed in recent years 15 |
 Support Agents with Best-In-Class Technology
Coming Soon –
BillingCenter, Mobile App Phase II
16 |
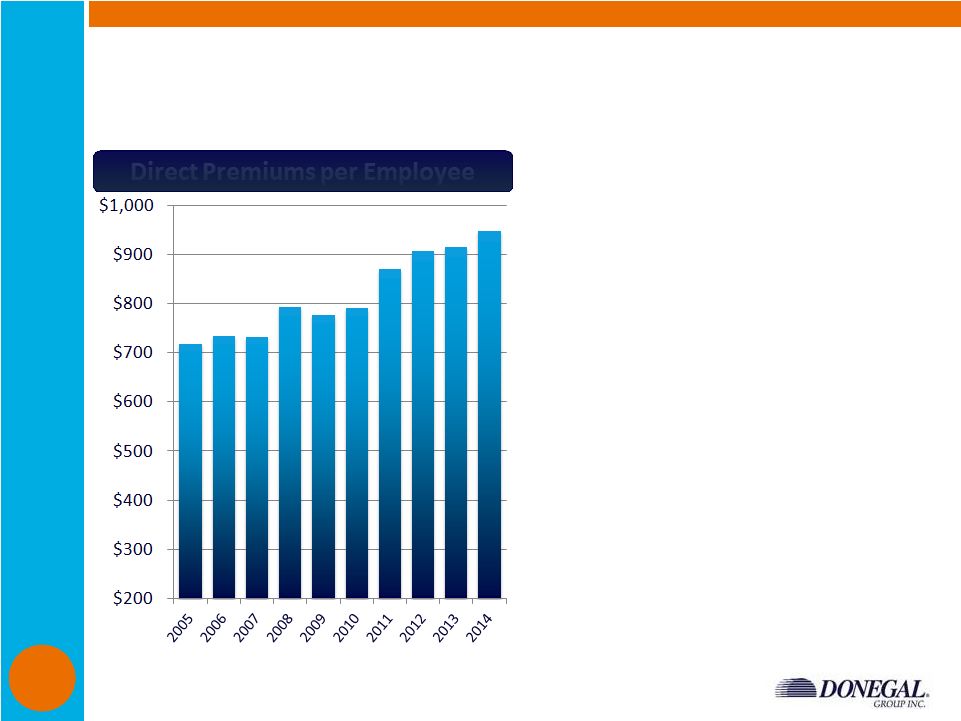 Drive Increased Efficiency with Automation
• Current infrastructure can support premium growth • Premiums per employee rising due to underwriting systems • Claims system allows more rapid and efficient claims handling • Mutual affiliation provides opportunities for operational and expense synergies • Statutory expense ratio of 29.9 for 2014 vs. 30.2% for 2013 (Dollars in thousands) Direct Premiums per Employee Direct Premiums per Employee 17 |
 Enhance Underwriting Profitability to Improve
Operating Margins
• Sustain pricing discipline and conservative underwriting • Manage exposure to catastrophe/unusual weather events – Reinsurance coverage in excess of a 200-year event • Link employee incentive compensation directly to underwriting performance • Focus on rate adequacy and pricing sophistication • Coordinated underwriting across all regions • Emphasize IT-based programs such as automated decision trees and predictive modeling 18 |
 Employ Sophisticated Pricing and
Actuarial Tools
• Predictive modeling tools enhance our ability to appropriately price our products – Sophisticated predictive modeling algorithms for pricing/tiering risks – Territorial segmentation and analysis of environmental factors that affect loss experience – Expanding use of predictive modeling to additional lines of business • Formal schedule of regular rate adequacy reviews for all lines of business, including GLM analysis on claim costs and agency performance • Telematics/usage-based insurance initiatives 19 |
 $217,897 $243,015 $250,936 $265,605 $292,301 2010 2011 2012 2013 2014 Reserve Range at 12/31/2014 Low $266,300 High $310,400 Selected at midpoint Maintain Emphasis on Reserve Adequacy • Reserves at $292 million at year-end 2014 – Midpoint of actuarial range – Conservative reinsurance program limits volatility • Emphasis on faster claims settlements to reduce longer-term exposures • 2014 development of $14 million within targeted range Values shown are selected reserves Vertical bars represent actuarial ranges (dollars in thousands, net of reinsurance) Established Reserves at Year-end Established Reserves at Year-end 20 |
 21 Achieve Book Value Growth By Implementing Plan Pursue quality premium growth and enhance underwriting profitability Support insurance operations with conservative investment strategy |
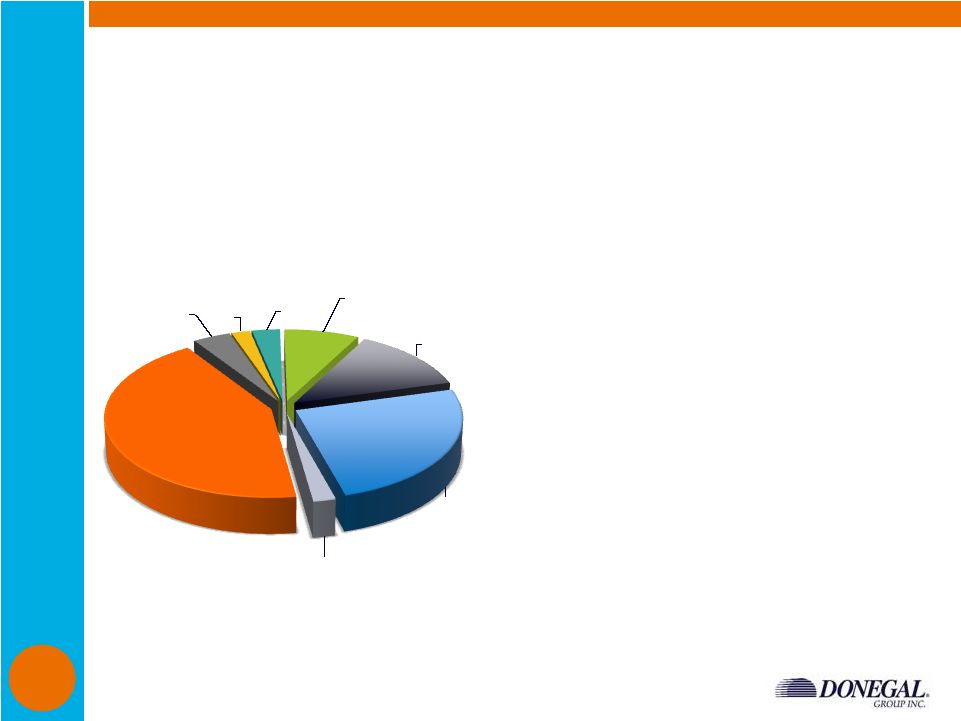 Maintain Conservative Investment Mix
Short-Term
Securities 2% Treasury 3% Agency 8% Corporate 13% Mortgage Backed Securities (MBS) 25% Taxable Munis 2% Tax-Exempt Municipals 43% Equity 4% • 89% of portfolio invested in fixed maturities – Effective duration = 4.5 years – Tax equivalent yield = 3.2% • Emphasis on quality – 83% AA-rated or better – 94% A-rated or better • Liquidity managed through laddering * Excluding investments in affiliates $823.5 Million in Invested Assets* (as of June 30, 2015) 22 |
 Donegal Financial Services Corporation
Bank Investment = 5% of Invested Assets
• DFSC owns 100% of Union Community Bank – Serves Lancaster County (location of Donegal headquarters) with 14 branch offices • Expanded via acquisition in 2011 – Added scale to banking operation – Enhanced value of historic bank investment – Increased potential for bottom-line contribution • DGI owns approximately 48% of DFSC – 52% owned by Donegal Mutual • Union Community Bank is financially strong and profitable 23 |
 Union Community Bank
(48% owned by Donegal Group Inc.)
• 2014 financial results: – $506 million in assets at year-end 2014 – $2.9 million in 2014 net income • Excellent capital ratios at June 30, 2015: 24 Tier 1 capital to average total assets 17.38% Tier 1 capital to risk-weighted assets 23.69% Risk-based capital to risk-weighted assets 25.87% |
 Review: Long-Term Business Strategy for
Growth and Success
• Maximize benefits of regional business approach • Outperform industry in service, profitability and book value growth • Drive revenues with organic growth and opportunistic transactions • Focus on margin enhancements and investment contributions 25 |
 Strong Capital + Solid Plan to Drive Results
• Rated A (Excellent) by A.M. Best – Debt-to-capital of approximately 14% – Premium-to-surplus of approximately 1.5-to-1 • Dividend yield of 3.7% for Class A shares • Authorization for repurchase of up to 500,000 shares of Class A common stock 26 Book Value Plus Cumulative Dividends |
 Supplemental Information
27 |
 Structure Provides Flexibility and Capacity
28 (1) Because of the different relative voting power of Class A common stock and Class B common stock, public stockholders hold approximately
35% of the aggregate voting power of the combined classes, and
Donegal Mutual holds approximately 65% of the aggregate voting power of the combined classes. 100% Reinsurance = P&C Insurance Subsidiaries = Thrift Holding Company/State Savings Bank POOLING AGREEMENT 100% 100% Donegal Mutual Insurance Company Donegal Mutual Insurance Company Donegal Financial Services Corporation (Union Community Bank) Donegal Financial Services Corporation (Union Community Bank) Public Stockholders Public Stockholders 80% 20% Sheboygan Falls Insurance Company Michigan Insurance Company Southern Insurance Company of Virginia Le Mars Insurance Company The Peninsula Insurance Company Atlantic States Insurance Company Southern Mutual Insurance Company Peninsula Indemnity Company 100% 100% 100% 100% 100% 56% (1) 44% (1) 52% 48% Donegal Group Inc. Donegal Group Inc. |
 History of Contributing Transactions
Company Le Mars Peninsula Sheboygan Southern Mutual Michigan Year Acquired 2004 2004 2008 2009 2010 Company Type Mutual Stock Mutual Mutual Stock Primary Product Line Personal Niche Personal Personal Pers./Comm. Geographic Focus Midwest Mid-Atlantic Wisconsin Georgia/ South Carolina Michigan Transaction Type Demutualization Purchase Demutualization Affiliation Purchase Net Premiums Acquired $20 million $34 million $8 million $11 million $27 million* * Michigan's direct premiums written were $105 million in 2010
29 |
 Net Premiums Written by Line of Business
(in millions) Q2 15 Q1 15 Q4 14 Q3 14 Q2 14 Q1 14 Q4 13 Q3 13 Personal lines: Automobile $55.6 $52.3 $48.5 $53.2 $52.0 $50.5 $46.7 $50.9 Homeowners 33.4 24.4 27.4 32.0 31.1 22.9 25.7 29.8 Other 4.9 4.2 4.1 4.5 4.6 3.8 4.0 4.2 Total personal lines 93.9 80.9 80.0 89.7 87.7 77.2 76.4 84.8 Commercial lines: Automobile 20.0 20.1 15.0 15.8 17.5 17.3 13.0 14.0 Workers’ compensation 25.3 28.8 19.1 20.7 22.4 26.6 16.3 18.3 Commercial multi-peril 24.3 25.0 19.6 20.1 21.7 22.1 16.8 18.0 Other 2.1 1.8 1.6 1.6 2.1 1.4 1.3 1.4 Total commercial lines 71.7 75.7 55.3 58.2 63.7 67.4 47.4 51.8 Total net premiums written $165.6 $156.6 $135.3 $147.9 $151.4 $144.6 $123.8 $136.6 30 |
 Combined Ratio Analyses
(percent) Q2 15 Q1 15 Q4 14 Q3 14 Q2 14 Q1 14 Q4 13 Q3 13 Stat combined ratios: Personal lines 99.4 98.4 106.5 95.2 99.5 102.7 99.3 97.9 Commercial lines 92.4 95.1 95.1 94.4 105.8 104.3 89.4 93.0 Total lines 96.4 96.9 101.8 95.0 102.1 103.2 95.4 96.0 GAAP combined ratios (total lines): Loss ratio (non-weather) 59.1 59.5 67.8 56.3 63.2 61.7 59.1 57.8 Loss ratio (weather-related) 5.9 6.0 2.8 7.7 8.5 11.4 3.5 7.2 Expense ratio 33.3 32.7 30.4 32.1 31.9 31.3 31.9 32.3 Dividend ratio 0.4 0.6 0.6 0.7 0.4 0.3 0.4 0.3 Combined ratio 98.7 98.8 101.6 96.8 104.0 104.7 94.9 97.6 GAAP supplemental ratios: Fire losses greater than $50,000 3.9 7.4 4.9 4.4 6.8 7.6 4.8 2.4 Development on prior year loss reserves 2.6 -0.4 4.8 1.4 4.4 -0.3 0.1 2.4 31 |