Attached files
| file | filename |
|---|---|
| 8-K - 8-K - KAPSTONE PAPER & PACKAGING CORP | a15-18765_18k.htm |
Exhibit 99.1
|
|
September 2015 Seizing Opportunity Unique System Optimization and Growth Opportunity With Victory Matt Kaplan Interim Chairman and CEO Andrea K. Tarbox Vice President and CFO |
|
|
Forward Looking Statements The information in this presentation and statements made during this presentation may contain certain forward-looking statements within the meaning of federal securities laws. These statements reflect management’s expectations regarding future events and operating performance. These forward-looking statements involve a number of risks and uncertainties. A list of the factors that could cause actual results to differ materially from those expressed in, or underlying, any forward-looking statements can be found in the Company’s filings with the Securities and Exchange Commission, such as its annual and quarterly reports. The Company disclaims any obligation to revise or update such statements to reflect the occurrence of events after the date of this presentation. This presentation refers to certain non-U.S. GAAP financial information. A reconciliation of non-U.S. GAAP to U.S. GAAP financial measures is available in the attached appendix. Forward-Looking Statements Non-GAAP Financial Measures Risk Factors 2 |
|
|
3 The Building of KapStone US Corr. Inc. Purchase Price $332 MM 6.4 Xs TTM Adj. EBITDA IP’s Kraft Paper Division Purchase Price $204 MM 3.3 Xs TTM Adj. EBITDA MWV’s Kraft Paper Division Purchase Price $466 MM 5.8 Xs TTM Adj. EBITDA Jan. 2007 July 2008 Oct. 2011 Longview Fibre Purchase Price $1.025 B 6.1 Xs TTM Adj. EBITDA July 2013 2009 2010 2012 Victory Packaging Purchase Price $615 MM* 6.1 Xs TTM Adj. EBITDA 2014 June 2015 Five Major Acquisitions Since 2007 *$515 MM after $100 MM tax benefit |
|
|
FY Net Sales FY Adj. EBITDA* 4 $s in Millions CAGR of 32% CAGR of 38% Strong Growth Record *Adjusted to exclude alternative fuel mixture credits, non-cash stock compensation, acquisition, start up and other costs, and dunnage bag business sold in March 2009 **Analysts' consensus $224 $492 $626 $782 $906 $1,217 $1,748 $2,301 $2,918 2007 2008 2009 2010 2011 2012 2013 2014 2015** $s in Millions $50 $78 $27 $95 $165 $183 $333 $456 $453 2007 2008 2009 2010 2011 2012 2013 2014 2015** |
|
|
5 Rapidly Generating Cash Use Source Generated $1.4 billion of cash from operations since inception LTM adjusted free cash flow through June 2015 of $150 million Returned $114 million to shareholders with dividends Invested over $500 million in CAPEX for our operations Net debt was $1.7 billion Net debt to EBITDA at June 30, 2015 was 3.4 times Average weighted interest is 1.82% Available revolver is $466 million Maintain ability to grow $120 $102 $2,966 $1,400 $1,270 $2,664 $114 $510 $29 $ in Millions Source & Use of Funds Since Inception (Inception – June 30, 2015) |

|
|
Founded in 1976, Victory Packaging (“Victory”) is a large, national distributor of all types of packaging specializing in providing unique solutions for its clients Customers with complex service needs are frequently not attractive to other integrated box manufacturers 65 distribution centers in the United States, Mexico and Canada Outstanding management team committed to continue current roles under KapStone ownership Strong sales and profit growth Net sales increased to $953 million in 2014 from $557 million in 2010, a 14.3% 4 year CAGR Adjusted EBITDA increased to $55 million in 2014 from $32 million in 2010, a 14.6% 4 year CAGR Invested heavily in future Victory purchases over 370,000 tons of corrugated products Long history between two companies Minimal capital required to sustain and grow the business Victory Acquisition 6 |
|
|
7 Victory - Significant Value Enhancing Synergies Unique strategic fit that could simultaneously “fill the converting assets” and “fill the mills” with an expected annual run rate for synergies of $30 million Expected to be at full run rate by mid-2016 “Fill the converting assets” Opportunity to fully utilize KapStone converting assets by sourcing more of Victory’s corrugated box purchases of over 370,000 tons annually from KapStone’s converting facilities KapStone to supply an incremental 115,000 tons to Victory while still relying heavily on Victory’s current supplier base Current 5 year capital plan supports this growth at converting facilities “Fill the mills” The mill vertical integration benefits are obtained by sourcing additional linerboard tons needed for increased converting operations from our mills and diverting those linerboard tons away from export Provides additional opportunities for ultra high performance linerboard to improve economics and enhance sustainability Ability to consume more medium, where KapStone has some mill capacity |
|
|
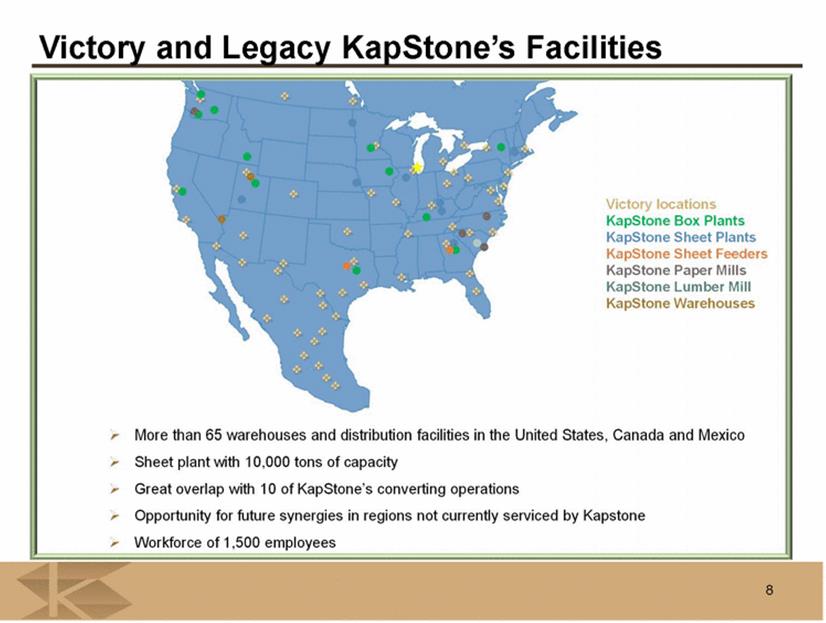
Victory and Legacy KapStone’s Facilities Victory locations KapStone Box Plants KapStone Sheet Plants KapStone Sheet Feeders KapStone Paper Mills KapStone Lumber Mill KapStone Warehouses More than 65 warehouses and distribution facilities in the United States, Canada and Mexico Sheet plant with 10,000 tons of capacity Great overlap with 10 of KapStone’s converting operations Opportunity for future synergies in regions not currently serviced by Kapstone Workforce of 1,500 employees 8 |
|
|
Provides Growth and Synergies Creative growth allows KapStone to optimize synergies Brings impressive, profitable growth track record Helps de-risk KapStone’s operations by providing higher level of integration Significant synergies of $30 million expected by mid-2016 Increases the utilization of the converting assets and mills Reduces dependency on less valuable, more volatile sales while increasing sales on higher margin products Important first step towards expanding Longview mill and utilizing excess pulping capacity Additional opportunities for growth Incremental converting expansion opportunities in strategic locations Organic and M&A growth in packaging fulfillment Why Victory 9 |
|
|
Strengthens KapStone’s design and packaging solutions capabilities Triples field sales presence Experienced, successful management team retained and incented with earn-out Victory and its management are well-known to Matt Kaplan, a previous board member Accretive Day 1 Completed acquisition June 1 KapStone’s 2nd quarter includes Victory’s June results $93 million revenue $7 million adjusted EBITDA Why Victory 10 Transforms and Strengthens KapStone |
|
|
Appendix |
|
|
*Not included in analysis are two contingent earn out payments First payment potentially due in two and a half years of $25 million will be accounted for as purchase price Second payment potentially due in four years of $20 million will be reflected as operating expense when appropriate **Timing of synergy realization: $5 million in 2015, $22 million in 2016, full realization in 2017 Deal Metrics 12 12 Months Ended December 31, 2014* Net Sales $ 953 Adjusted EBITDA $ 55 Purchase Price * $ 615 Less: Tax step-up at present value $ 100 Adjusted Purchase Price $ 515 Purchase Price Multiple 9.4 X Adjustments to EBITDA Synergies to be Realized in 24 Months $ 30** Adjusted EBITDA $ 85 Adj. EBITDA Purchase Price Multiple* 6.1 X $’s in Millions |
|
|
13 Net Sales Adj. EBITDA Victory’s Impressive Growth Record Organic growth driven significantly by the win of major contract in 2013 2014 sales bolstered by approximately $20 million from three small acquisitions Net Sales CAGR 14.3% Adj. EBITDA CAGR 14.6% $32 $30 $31 $47 $55 2010 2011 2012 2013 2014 $s in Millions $557 $585 $609 $868 $953 2010 2011 2012 2013 2014 $s in Millions |