Attached files
| file | filename |
|---|---|
| 8-K - 8-K - XERIUM TECHNOLOGIES INC | august112015jefferiesprese.htm |
Industrials Conference August 2015

2 Forward Looking Statements and Non-GAAP Reconciliations Various statements herein and remarks that we may make today about Xerium's future expectations, plans and prospects are forward-looking statements which reflect our current views with respect to future events and financial performance. Statements which include the words “expect,” “intend,” “plan,” “believe,” “project,” anticipate”, and similar statements of a future or forward-looking nature identify forward-looking statements for the purposes of the federal securities laws or otherwise. Our actual results may differ materially from these forward-looking statements and estimates as a result of various important factors, including those discussed in our earnings press release dated August 10, 2015, which is posted in the Investor Relations section of our website at www.xerium.com, and other factors discussed in our filings with the SEC, including our Form 10-K for the year ended December 31, 2014 and our Form 10-Q for the quarter ended June 30, 2015, all of which are on file with the SEC and are also available in the investor relations section of our website at www.xerium.com under the heading "SEC Filings." In addition, market data about the production volumes of our end-users is no guarantee of future production levels. Last, any forward-looking statements which we make in this presentation or in remarks today, represent our views only as of today. We disclaim any duty to update any such forward looking statements. We also plan to discuss supplementary non-GAAP financial measures, such as Adjusted EBITDA, that we use internally to assess financial performance, and therefore, believe will assist you in better understanding our company. Reconciliations of these measures to the comparable GAAP numbers are available in our most recent earnings press release, in this presentation and in an additional reconciliation schedule, all of which are posted in the Investor Relations section of our website at www.xerium.com.
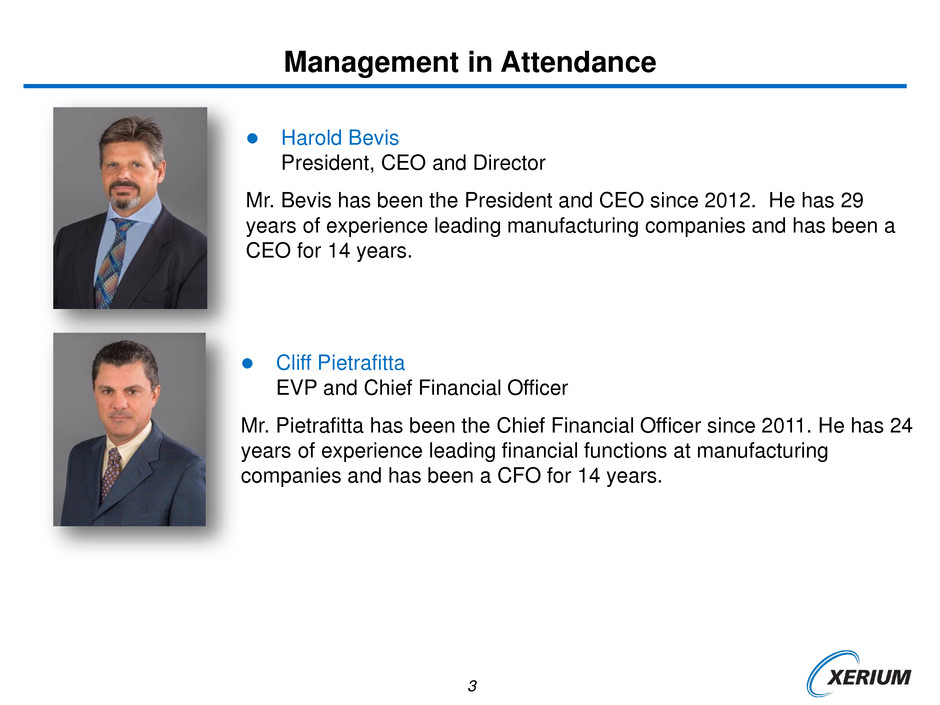
3 Harold Bevis President, CEO and Director Mr. Bevis has been the President and CEO since 2012. He has 29 years of experience leading manufacturing companies and has been a CEO for 14 years. Management in Attendance Cliff Pietrafitta EVP and Chief Financial Officer Mr. Pietrafitta has been the Chief Financial Officer since 2011. He has 24 years of experience leading financial functions at manufacturing companies and has been a CFO for 14 years.
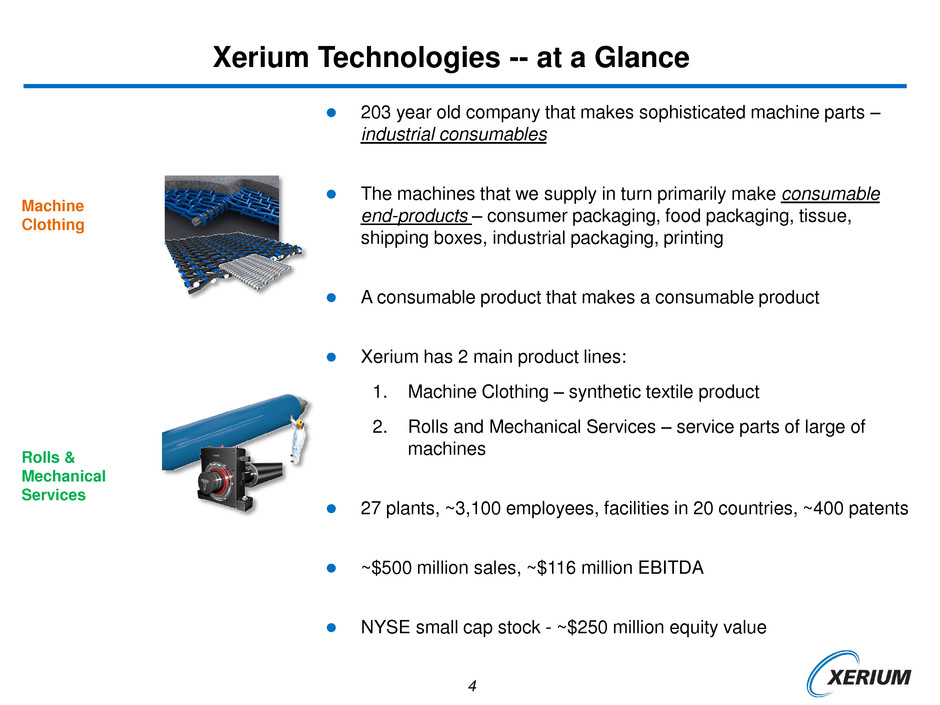
4 Xerium Technologies -- at a Glance 203 year old company that makes sophisticated machine parts – industrial consumables The machines that we supply in turn primarily make consumable end-products – consumer packaging, food packaging, tissue, shipping boxes, industrial packaging, printing A consumable product that makes a consumable product Xerium has 2 main product lines: 1. Machine Clothing – synthetic textile product 2. Rolls and Mechanical Services – service parts of large of machines 27 plants, ~3,100 employees, facilities in 20 countries, ~400 patents ~$500 million sales, ~$116 million EBITDA NYSE small cap stock - ~$250 million equity value Machine Clothing Rolls & Mechanical Services
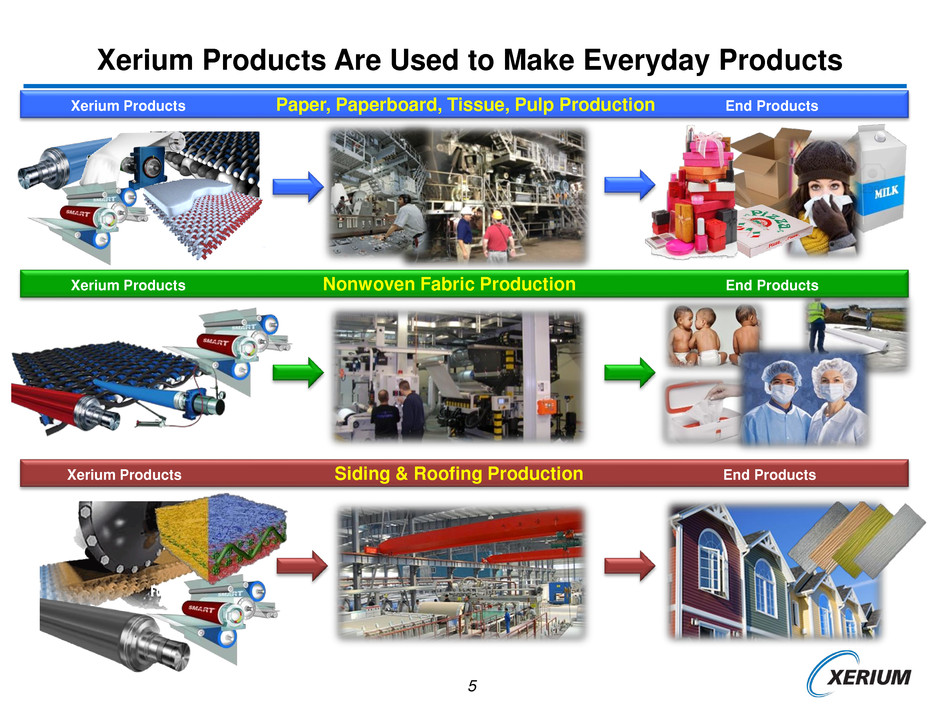
5 Xerium Products Paper, Paperboard, Tissue, Pulp Production End Products Xerium Products Nonwoven Fabric Production End Products Xerium Products Siding & Roofing Production End Products Xerium Products Are Used to Make Everyday Products
6 At the cusp of a large, additive sales growth incentive program $87 million of investment over 2-1/2 years a. 27 plants globally b. Plant modernization program includes 8 plant expansions and 2 recently-opened greenfield plants spanning 7 countries, more to go c. 7 plants closed, more to go 39 new products developed with varying launch schedules Just getting underway in second half of 2015 In parallel, the company has been reducing cost throughout its operations Consecutively expanded gross margins, by over 350 basis points over the last 11 quarters – on flat sales Delivered Adjusted EBITDA margin improvement 9 out of the last 11 quarters 3 year cost savings will be ~$70 million by the end of 2015 ($48 million in the books) Actions already taken will continue momentum in second half 2015, including the consolidation of a large plant in Warwick, Quebec, Canada The partnering of the already-successful cost-reduction program with newly launching sales growth program could generate powerful earnings Our balanced approach toward capital allocation is transitioning from restructuring, high payback cost-out initiatives to sales growth programs Majority of asset repositioning has been with machines already owned We are considering 2 additional cost offset programs Strong multi-year pipeline As repositioning spending declines, excess cash will be used to pay down debt Investment Highlights

7 Before 2012 • Declining performance and an even worse outlook • Challenging global business environment in legacy business segments • Very little in motion to lay the foundation for a different future Since 2012 - Big transformation program is underway • Remolded team top-down • Geographic footprint realignment • Breakthrough innovation to enter new markets • Fast & reliable supply chains 2012 – A Need for an Aggressive Business Transformation
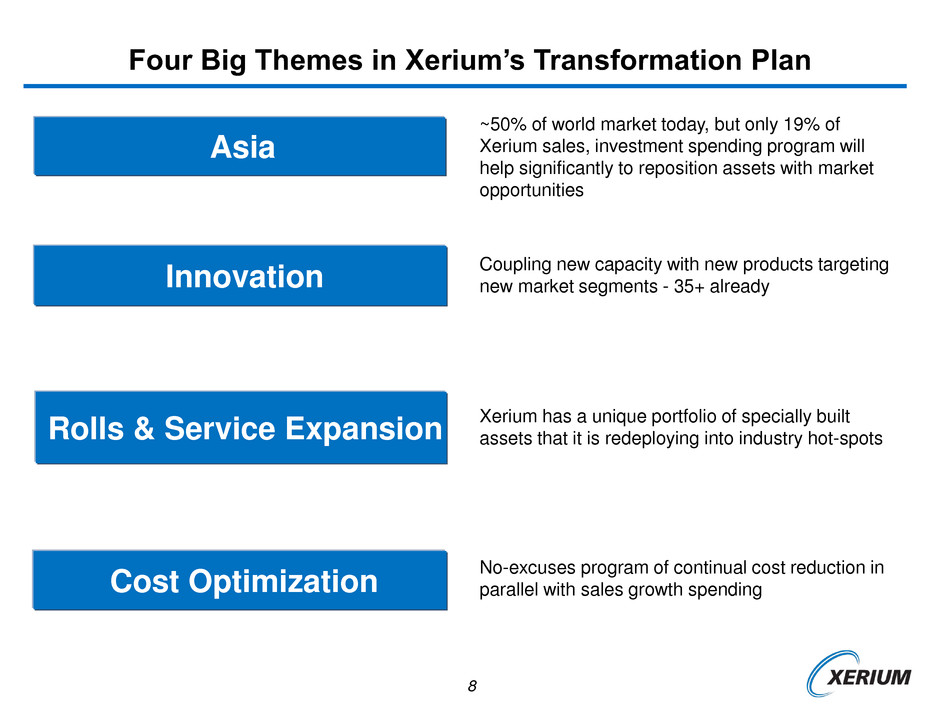
8 Asia ~50% of world market today, but only 19% of Xerium sales, investment spending program will help significantly to reposition assets with market opportunities Four Big Themes in Xerium’s Transformation Plan Cost Optimization No-excuses program of continual cost reduction in parallel with sales growth spending Rolls & Service Expansion Xerium has a unique portfolio of specially built assets that it is redeploying into industry hot-spots Innovation Coupling new capacity with new products targeting new market segments - 35+ already

9 Growth Markets $87 Million Sales Growth Investment Program is Nearing Completion Machine Automation Emerging countries High-growth applications New market segments Accretive growth rates Mechanical Service Redeploy unique assets to hot-spots Accretive growth rates Expansion of SMART® machine automation program into closed-loop systems Accretive growth rates Legacy Businesses Cash Know-how
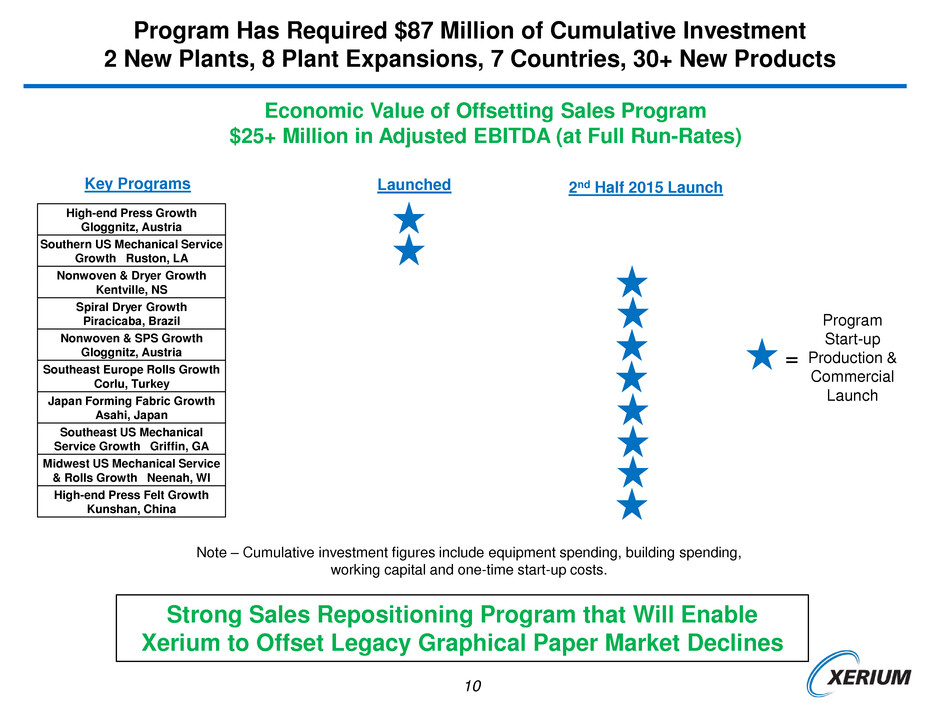
10 Program Start-up Production & Commercial Launch = High-end Press Growth Gloggnitz, Austria Southern US Mechanical Service Growth Ruston, LA Nonwoven & Dryer Growth Kentville, NS Spiral Dryer Growth Piracicaba, Brazil Nonwoven & SPS Growth Gloggnitz, Austria Southeast Europe Rolls Growth Corlu, Turkey Japan Forming Fabric Growth Asahi, Japan Southeast US Mechanical Service Growth Griffin, GA Midwest US Mechanical Service & Rolls Growth Neenah, WI High-end Press Felt Growth Kunshan, China Launched 2nd Half 2015 Launch Key Programs Program Has Required $87 Million of Cumulative Investment 2 New Plants, 8 Plant Expansions, 7 Countries, 30+ New Products Note – Cumulative investment figures include equipment spending, building spending, working capital and one-time start-up costs. Strong Sales Repositioning Program that Will Enable Xerium to Offset Legacy Graphical Paper Market Declines Economic Value of Offsetting Sales Program $25+ Million in Adjusted EBITDA (at Full Run-Rates)

11 Xerium’s New Product Program is a Key to Sales Growth Program Success New Products for Future Growth Intellectual Property 425 480 04 08 12 F15' X e ri u m Pat e n ts Patents New Products Focus is on sales growth in non-declining markets. >90% of new products aimed at these markets 32 new products have either come on-line in Q1 and/or are in the pipeline for 2015 41% are in packaging 25% are in non-paper 19% are in tissue 9% are in pulp A key metric is New Positions Won – Net. We are more than offsetting lost positions due to graphical market decline. ~18 month time lag 41% 19% 6% 9% 25% Packaging Tissue Pulp Graphical Non-paper New-to-World Inventions & Patents Sales Growth Programs have lead to a historic level of innovation 425 Patents in portfolio Q2 2015 39 new patents issued 2015 YTD 97 new patents pending 69 inventions This high-level of intellectual property investment and protection is the direct result of increased emphasis on new sales growth for future periods

12 2015 Market Has Been Soft, Second Half Expected to Be Similar Segment Grade First Half 2015 Second Half 2015 Paper Pulp Good Good Newsprint Weak Weak Printing & Writing Weak Weak Packaging Good Good Board Satisfactory Satisfactory Tissue Good Good OEM New Machines Weak Weak Non-paper Fiber Cement Satisfactory Satisfactory Nonwoven Satisfactory Satisfactory GDP Grades of Paper & Board, and Non-Paper Markets Remain Stable (~75% of Market) While Rationalization, Curtailment and Consolidation Remains the Norm in the Graphical Grade Markets (~25% of Market) Xerium’s Counteracting Sales Strategy Has Been to Enter New Market Segments, New Geographies, Launch New Products – And It is On Track
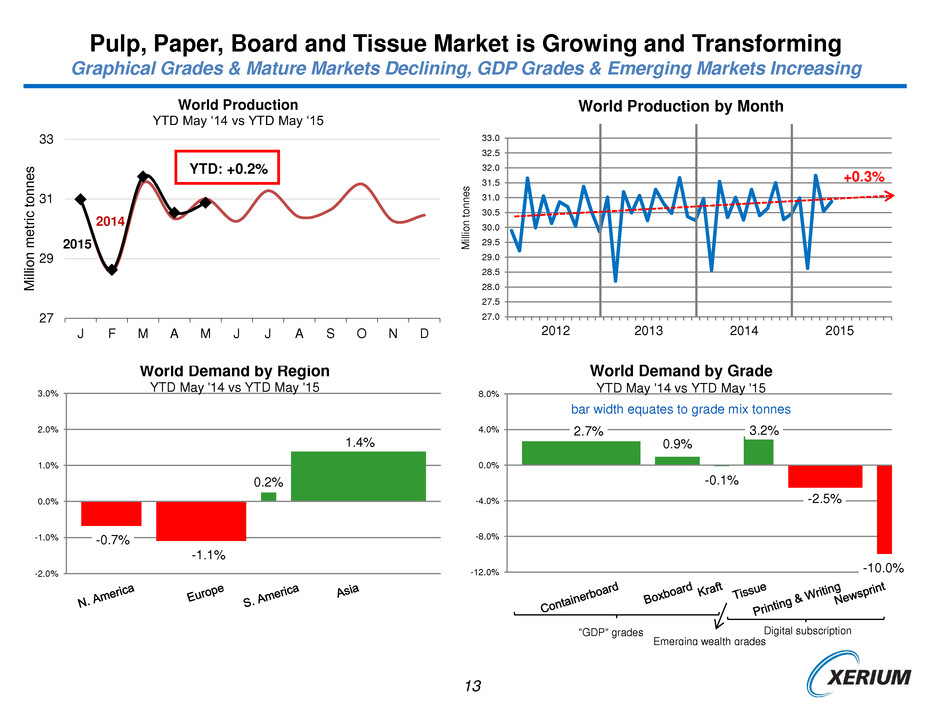
13 Pulp, Paper, Board and Tissue Market is Growing and Transforming Graphical Grades & Mature Markets Declining, GDP Grades & Emerging Markets Increasing 27.0 27.5 28.0 28.5 29.0 29.5 30.0 30.5 31.0 31.5 32.0 32.5 33.0 2012 2013 2014 +0.3% World Production by Month M ill io n t o n n e s 2015 -0.7% -1.1% 0.2% 1.4% -2.0% -1.0% 0.0% 1.0% 2.0% 3.0% World Demand by Region YTD May '14 vs YTD May '15 2.7% 0.9% -0.1% 3.2% -2.5% -10.0% -12.0% -8.0% -4.0% 0.0% 4.0% 8.0% World Demand by Grade "GDP" grades Digital subscription Emerging wealth grades bar width equates to grade mix tonnes YTD May '14 vs YTD May '15 27 29 31 33 J F M A M J J A S O N D World Production YTD May ‘14 vs YTD May ‘15 2015 2014 YTD: +0.2% M ill ion m e tr ic t onn e s

14 Q2 2015 Was a Good Quarter, Except for Weak Sales in North America Sales Growth Investment Programs Cost-Out Programs Working Capital Management Asia Sales South America Sales Europe Sales North America Sales ✘ ✔ ✔ ✔ ✔ ✔ ✔ Xerium Expects Weak North American Sales to Persist in 2nd Half of 2015 In Response, We Have Taken Fixed Cost Out of North America With Closure of Warwick Plant Scorecard

15 Q2 2015 Adjusted EBITDA Improved to $28 million, Sales Growth Programs Coming On Line Sales • $123.1 million 3% increase compared to Q1 2015 (constant currency) Adjusted EBITDA • $115.1 million Q2 2015 TTM 8% increase vs Q2 2014 TTM • $28 million Q2 2015 7% increase compared to Q1 2015 • 5th consecutive quarter of improved margins, 10 of last 11 quarters Net Debt Leverage Currency Impact Sales Growth Program Gross Margins • 41% of sales 11 th consecutive quarter of improved gross margin rates (excluding startup costs) • Negatively affected sales, adjusted EBITDA and free cash flow • Second half 2015 outlook for euro-to-dollar has worsened Adjusted EPS • $0.37/share Q2 2015 32% increase from $0.28/share in Q1 2015 • 4.1x in Q2 2015, substantially the same as 4.0x in Q1 2015 • 2 1/2 year, $87 million sales growth programs coming to completion • Plants coming on line in second half of 2015 • Many new sales growth angles with positive financial returns
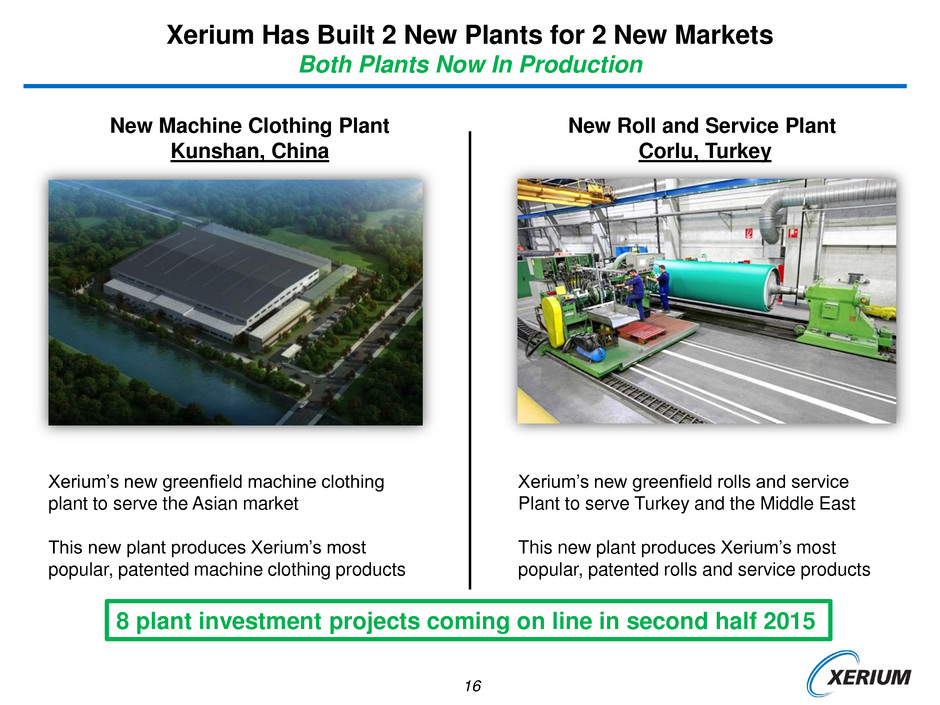
16 Xerium Has Built 2 New Plants for 2 New Markets Both Plants Now In Production New Machine Clothing Plant Kunshan, China New Roll and Service Plant Corlu, Turkey Xerium’s new greenfield rolls and service Plant to serve Turkey and the Middle East This new plant produces Xerium’s most popular, patented rolls and service products Xerium’s new greenfield machine clothing plant to serve the Asian market This new plant produces Xerium’s most popular, patented machine clothing products 8 plant investment projects coming on line in second half 2015
17 New management team delivering value, in the early stages of a transformation: 11th consecutive quarter of improved gross margins 5th consecutive quarter of improved EBITDA margins EDITDA margins now at ~23%, up from ~16% at the beginning of 2012 ~$4 billion accessible global market is large and growing, although there is quarter to quarter volatility Large factory investment program is coming on line in second half of 2015 Program has required $87 million of cumulative investment, 2 new plants, 8 plant expansions, 7 countries, 30+ new products More in the pipeline As repositioning spending declines, excess cash will be used to pay down debt Xerium Executive Summary
Thank You!
