Attached files
| file | filename |
|---|---|
| 8-K - 8-K - Horizon Global Corp | horizonglobalform8-kearnin.htm |
| EX-99.1 - EXHIBIT 99.1 - Horizon Global Corp | hzn_063015xexhibit991.htm |

1 DRIVEN TO DELIVER 2Q 2015 Earnings NYSE: HZN Horizon Global Second Quarter 2015 Earnings Presentation August 10, 2015
2 DRIVEN TO DELIVER 2Q 2015 Earnings NYSE: HZN Safe Harbor Statement Forward-Looking Statements Any "forward-looking" statements contained herein, including those relating to market conditions or the Company's financial condition and results, expense reductions, liquidity expectations, business goals and sales growth, involve risks and uncertainties, including, but not limited to, risks and uncertainties with respect to the spin-off from TriMas Corporation, including the future prospects of the Company as an independent company, general economic and currency conditions, various conditions specific to the Company's business and industry, the Company's leverage, liabilities imposed by the Company's debt instruments, market demand, competitive factors, supply constraints, material and energy costs, technology factors, litigation, government and regulatory actions, the Company’s ability to successfully implement its profitability improvement measures, the Company's accounting policies, future trends, and other risks which are detailed in the Company's Registration Statement filed on Form S-1 (available at www.sec.gov). These risks and uncertainties may cause actual results to differ materially from those indicated by the forward-looking statements. All forward-looking statements made herein are based on information currently available, and the Company assumes no obligation to update any forward-looking statements. Non-GAAP Financial Measures In this presentation, certain non-GAAP financial measures may be used. Reconciliations of these non-GAAP financial measures to the most directly comparable GAAP financial measure may be found at the end of this presentation or in the earnings releases available on the Company’s website. Additional information is available at www.horizonglobal.com.

3 DRIVEN TO DELIVER 2Q 2015 Earnings NYSE: HZN Business Update • Mark Zeffiro Financial Results • David Rice Outlook • Mark Zeffiro Q&A Horizon Global Second Quarter 2015
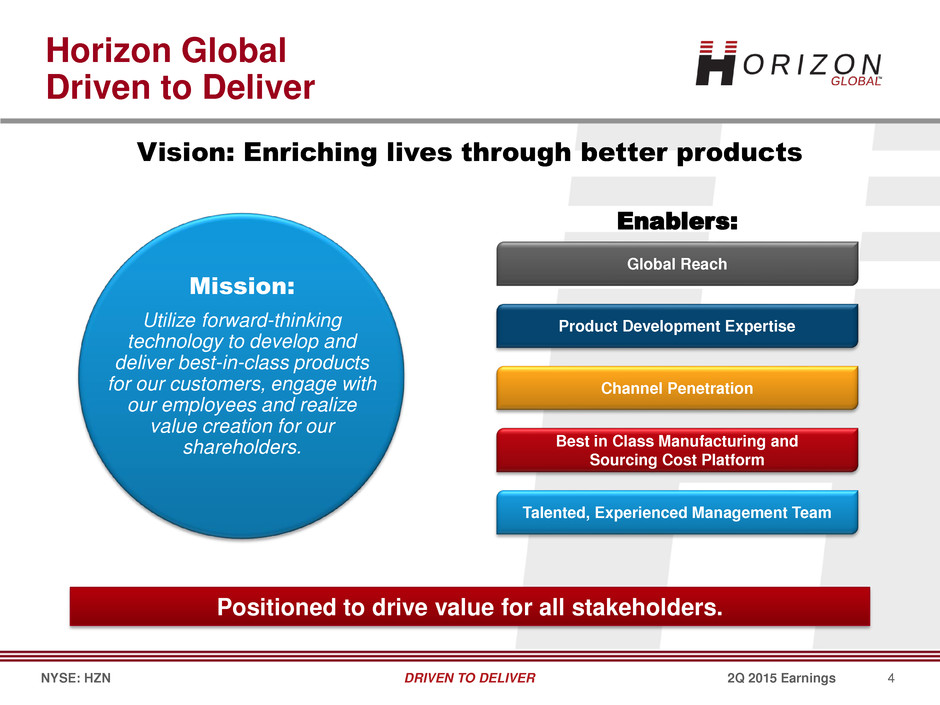
4 DRIVEN TO DELIVER 2Q 2015 Earnings NYSE: HZN Horizon Global Driven to Deliver Vision: Enriching lives through better products Mission: Utilize forward-thinking technology to develop and deliver best-in-class products for our customers, engage with our employees and realize value creation for our shareholders. Global Reach Product Development Expertise Channel Penetration Best in Class Manufacturing and Sourcing Cost Platform Talented, Experienced Management Team Positioned to drive value for all stakeholders. Enablers:
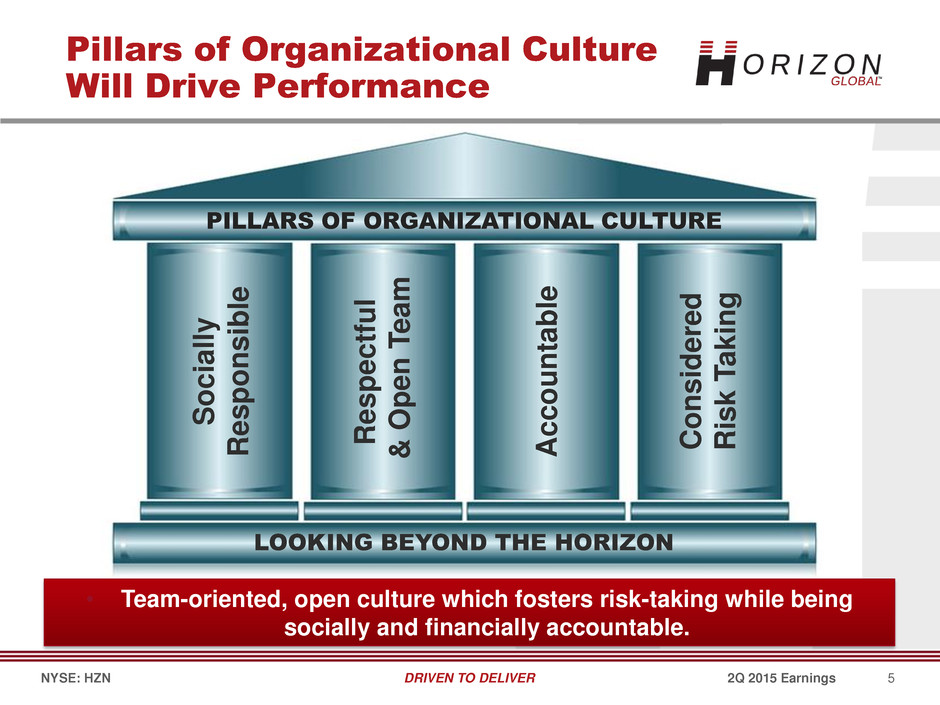
5 DRIVEN TO DELIVER 2Q 2015 Earnings NYSE: HZN LOOKING BEYOND THE HORIZON Soci a ll y Res p on s ibl e Res p ec tfu l & O pen T ea m Acc o unt a bl e Cons idere d Risk T ak in g PILLARS OF ORGANIZATIONAL CULTURE • Team-oriented, open culture which fosters risk-taking while being socially and financially accountable. Pillars of Organizational Culture Will Drive Performance
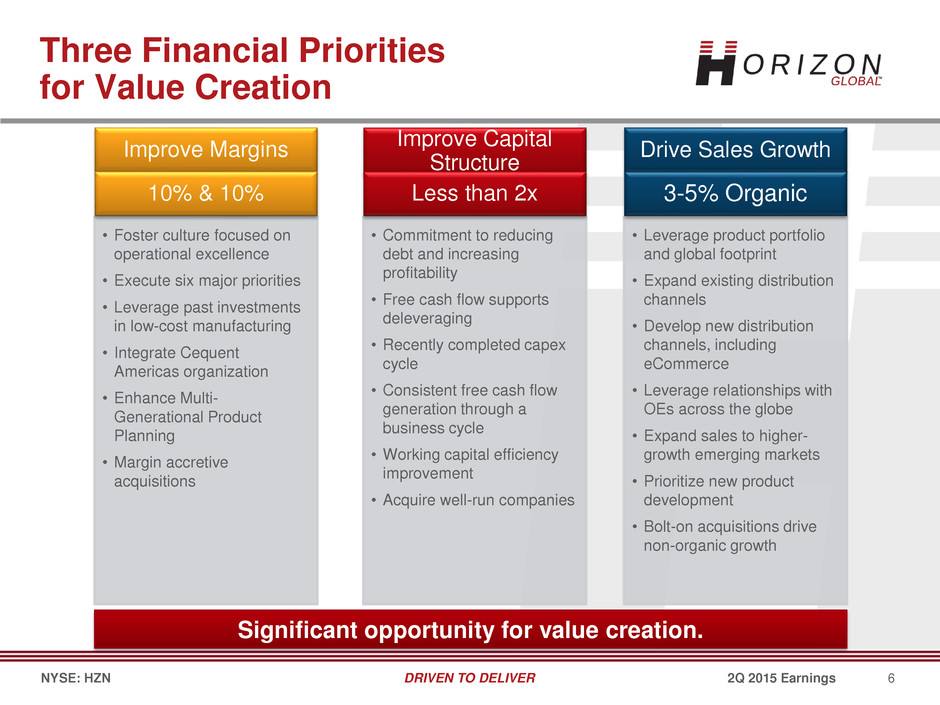
6 DRIVEN TO DELIVER 2Q 2015 Earnings NYSE: HZN • Leverage product portfolio and global footprint • Expand existing distribution channels • Develop new distribution channels, including eCommerce • Leverage relationships with OEs across the globe • Expand sales to higher- growth emerging markets • Prioritize new product development • Bolt-on acquisitions drive non-organic growth • Commitment to reducing debt and increasing profitability • Free cash flow supports deleveraging • Recently completed capex cycle • Consistent free cash flow generation through a business cycle • Working capital efficiency improvement • Acquire well-run companies • Foster culture focused on operational excellence • Execute six major priorities • Leverage past investments in low-cost manufacturing • Integrate Cequent Americas organization • Enhance Multi- Generational Product Planning • Margin accretive acquisitions Drive Sales Growth Improve Capital Structure Improve Margins Three Financial Priorities for Value Creation Significant opportunity for value creation. 10% & 10% Less than 2x 3-5% Organic
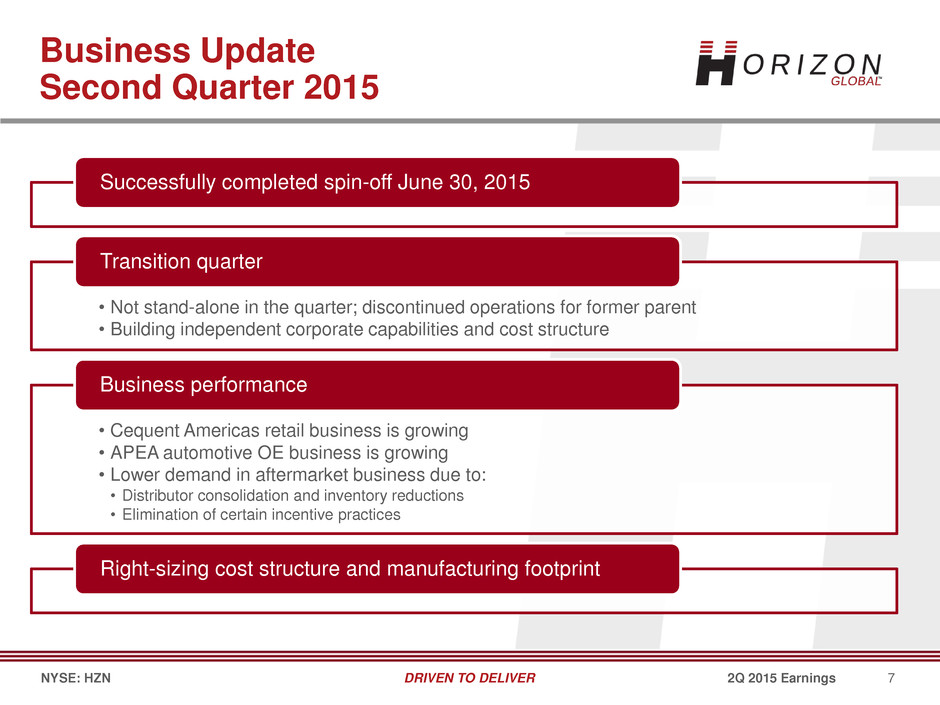
7 DRIVEN TO DELIVER 2Q 2015 Earnings NYSE: HZN Successfully completed spin-off June 30, 2015 • Not stand-alone in the quarter; discontinued operations for former parent • Building independent corporate capabilities and cost structure Transition quarter • Cequent Americas retail business is growing • APEA automotive OE business is growing • Lower demand in aftermarket business due to: • Distributor consolidation and inventory reductions • Elimination of certain incentive practices Business performance Right-sizing cost structure and manufacturing footprint Business Update Second Quarter 2015
8 DRIVEN TO DELIVER 2Q 2015 Earnings NYSE: HZN Business Update • Mark Zeffiro Financial Results • David Rice Outlook • Mark Zeffiro Q&A Horizon Global Second Quarter 2015
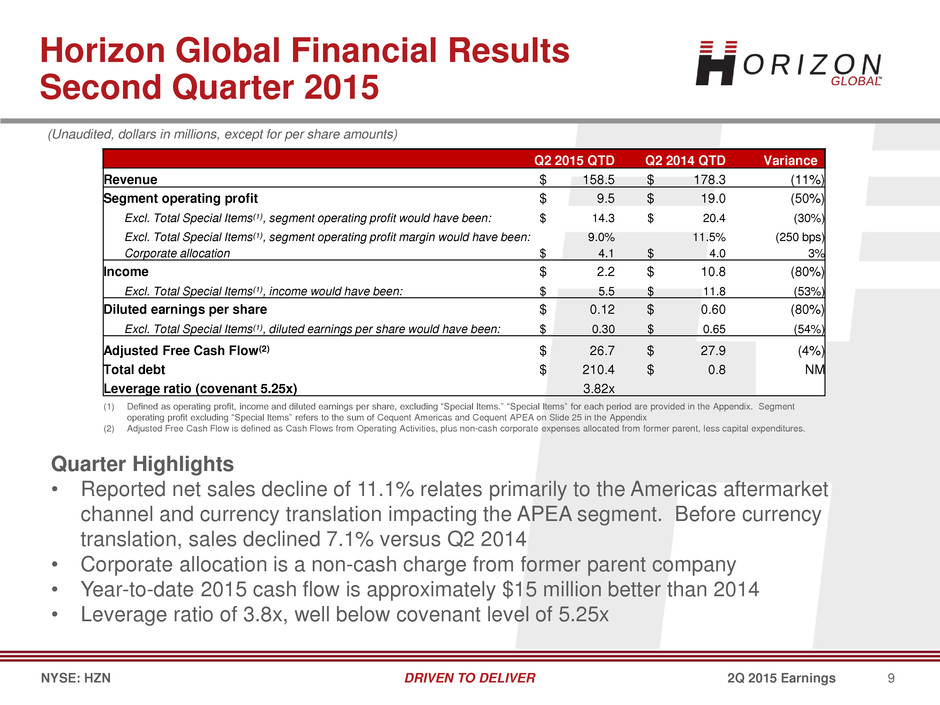
9 DRIVEN TO DELIVER 2Q 2015 Earnings NYSE: HZN Horizon Global Financial Results Second Quarter 2015 (Unaudited, dollars in millions, except for per share amounts) Quarter Highlights • Reported net sales decline of 11.1% relates primarily to the Americas aftermarket channel and currency translation impacting the APEA segment. Before currency translation, sales declined 7.1% versus Q2 2014 • Corporate allocation is a non-cash charge from former parent company • Year-to-date 2015 cash flow is approximately $15 million better than 2014 • Leverage ratio of 3.8x, well below covenant level of 5.25x (1) Defined as operating profit, income and diluted earnings per share, excluding “Special Items.” “Special Items” for each period are provided in the Appendix. Segment operating profit excluding “Special Items” refers to the sum of Cequent Americas and Cequent APEA on Slide 25 in the Appendix (2) Adjusted Free Cash Flow is defined as Cash Flows from Operating Activities, plus non-cash corporate expenses allocated from former parent, less capital expenditures. Q2 2015 QTD Q2 2014 QTD Variance Revenue $ 158.5 $ 178.3 (11%) Segment operating profit $ 9.5 $ 19.0 (50%) Excl. Total Special Items(1), segment operating profit would have been: $ 14.3 $ 20.4 (30%) Excl. Total Special Items(1), segment operating profit margin would have been: 9.0% 11.5% (250 bps) Corporate allocation $ 4.1 $ 4.0 3% Income $ 2.2 $ 10.8 (80%) Excl. Total Special Items(1), income would have been: $ 5.5 $ 11.8 (53%) Diluted earnings per share $ 0.12 $ 0.60 (80%) Excl. Total Special Items(1), diluted earnings per share would have been: $ 0.30 $ 0.65 (54%) Adjusted Free Cash Flow(2) $ 26.7 $ 27.9 (4%) Total debt $ 210.4 $ 0.8 NM Leverage ratio (covenant 5.25x) 3.82x
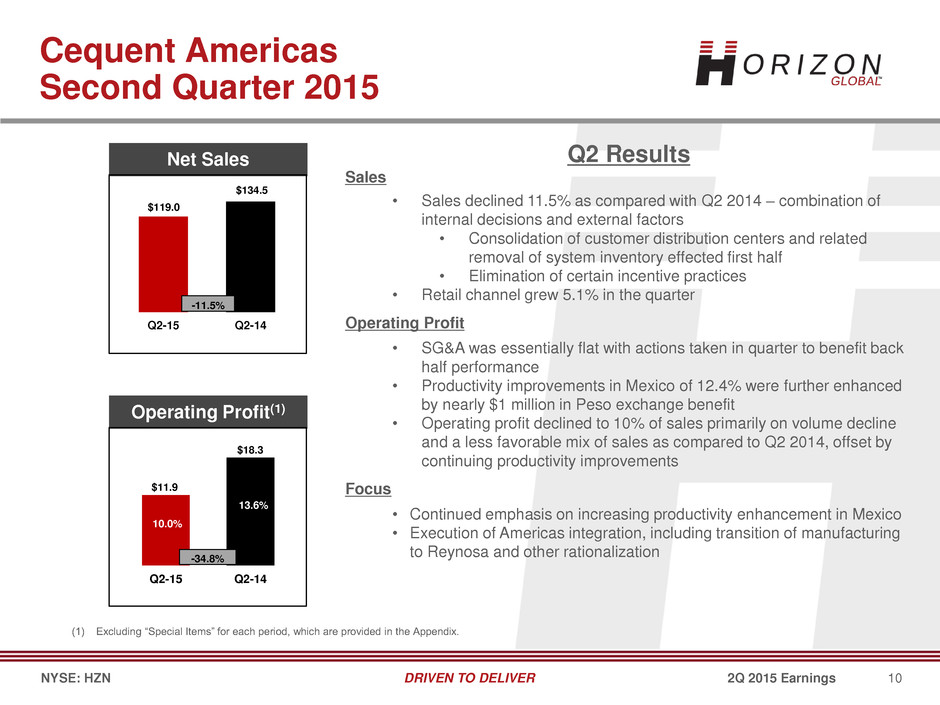
10 DRIVEN TO DELIVER 2Q 2015 Earnings NYSE: HZN Cequent Americas Second Quarter 2015 Net Sales Operating Profit(1) Q2 Results Sales • Sales declined 11.5% as compared with Q2 2014 – combination of internal decisions and external factors • Consolidation of customer distribution centers and related removal of system inventory effected first half • Elimination of certain incentive practices • Retail channel grew 5.1% in the quarter Operating Profit • SG&A was essentially flat with actions taken in quarter to benefit back half performance • Productivity improvements in Mexico of 12.4% were further enhanced by nearly $1 million in Peso exchange benefit • Operating profit declined to 10% of sales primarily on volume decline and a less favorable mix of sales as compared to Q2 2014, offset by continuing productivity improvements Focus • Continued emphasis on increasing productivity enhancement in Mexico • Execution of Americas integration, including transition of manufacturing to Reynosa and other rationalization (1) Excluding “Special Items” for each period, which are provided in the Appendix. Q2-15 Q2-14 $119.0 $134.5 -11.5% Q2-15 Q2-14 -34.8% $11.9 $18.3 10.0% 13.6%
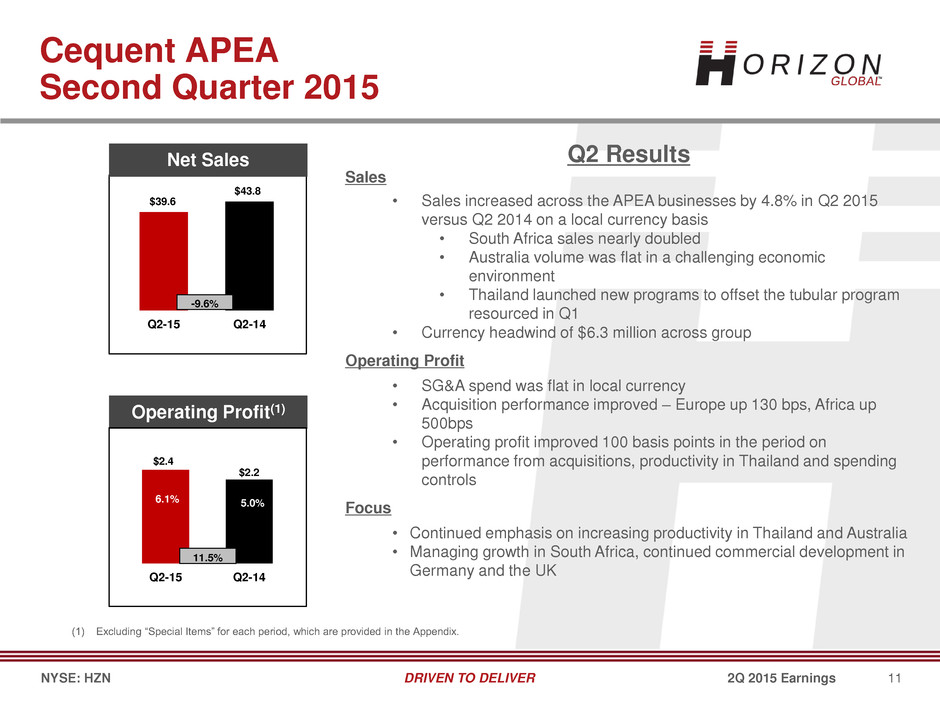
11 DRIVEN TO DELIVER 2Q 2015 Earnings NYSE: HZN Cequent APEA Second Quarter 2015 Q2-15 Q2-14 $39.6 $43.8 Net Sales Operating Profit(1) -9.6% 6.1% 5.0% Q2-15 Q2-14 $2.4 $2.2 11.5% 6.1% 5.0% (1) Excluding “Special Items” for each period, which are provided in the Appendix. Q2 Results Sales • Sales increased across the APEA businesses by 4.8% in Q2 2015 versus Q2 2014 on a local currency basis • South Africa sales nearly doubled • Australia volume was flat in a challenging economic environment • Thailand launched new programs to offset the tubular program resourced in Q1 • Currency headwind of $6.3 million across group Operating Profit • SG&A spend was flat in local currency • Acquisition performance improved – Europe up 130 bps, Africa up 500bps • Operating profit improved 100 basis points in the period on performance from acquisitions, productivity in Thailand and spending controls Focus • Continued emphasis on increasing productivity in Thailand and Australia • Managing growth in South Africa, continued commercial development in Germany and the UK
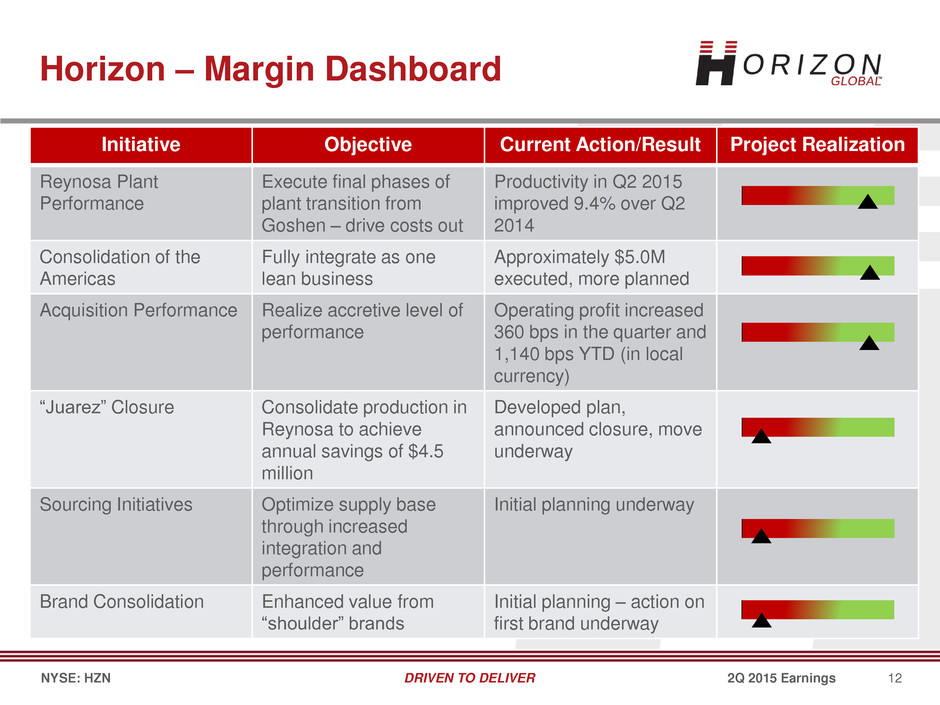
12 DRIVEN TO DELIVER 2Q 2015 Earnings NYSE: HZN Initiative Objective Current Action/Result Project Realization Reynosa Plant Performance Execute final phases of plant transition from Goshen – drive costs out Productivity in Q2 2015 improved 9.4% over Q2 2014 Consolidation of the Americas Fully integrate as one lean business Approximately $5.0M executed, more planned Acquisition Performance Realize accretive level of performance Operating profit increased 360 bps in the quarter and 1,140 bps YTD (in local currency) “Juarez” Closure Consolidate production in Reynosa to achieve annual savings of $4.5 million Developed plan, announced closure, move underway Sourcing Initiatives Optimize supply base through increased integration and performance Initial planning underway Brand Consolidation Enhanced value from “shoulder” brands Initial planning – action on first brand underway Horizon – Margin Dashboard
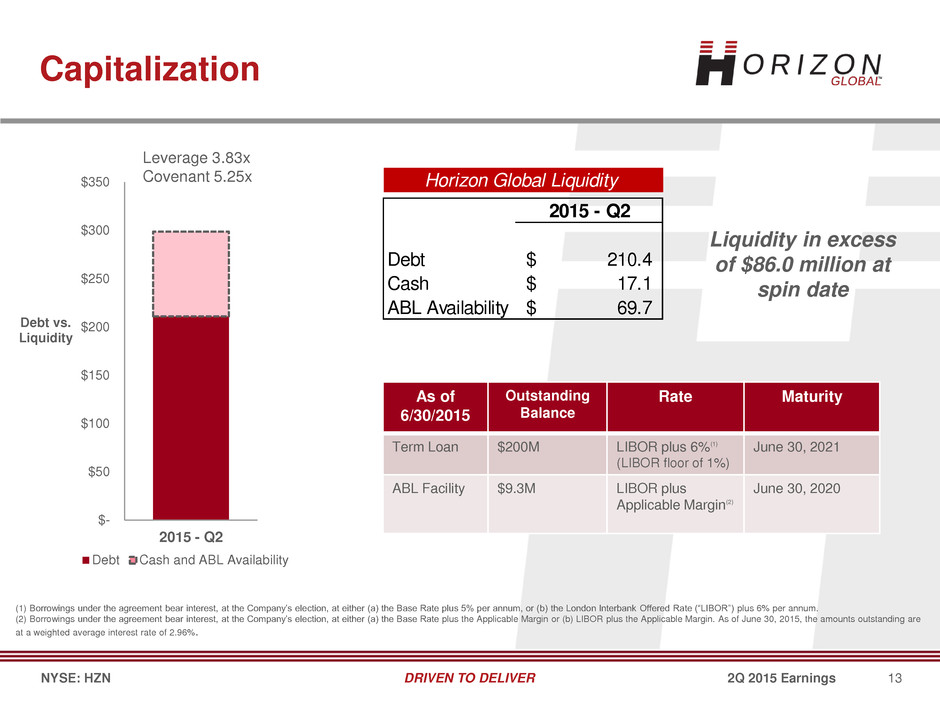
13 DRIVEN TO DELIVER 2Q 2015 Earnings NYSE: HZN As of 6/30/2015 Outstanding Balance Rate Maturity Term Loan $200M LIBOR plus 6%(1) (LIBOR floor of 1%) June 30, 2021 ABL Facility $9.3M LIBOR plus Applicable Margin(2) June 30, 2020 Capitalization (1) Borrowings under the agreement bear interest, at the Company’s election, at either (a) the Base Rate plus 5% per annum, or (b) the London Interbank Offered Rate (“LIBOR”) plus 6% per annum. (2) Borrowings under the agreement bear interest, at the Company’s election, at either (a) the Base Rate plus the Applicable Margin or (b) LIBOR plus the Applicable Margin. As of June 30, 2015, the amounts outstanding are at a weighted average interest rate of 2.96%. (0.25) 0.75x 1.75x 2.75x 3.75x 4.75x 5.75x 6.75x $- $50 $100 $150 $200 $250 $300 $350 2015 - Q2 Debt vs. Liquidity Debt Cash and ABL Availability Leverage 3.83x Covenant 5.25x Liquidity in excess of $86.0 million at spin date 2015 - Q2 Debt 210.4$ Cash 17.1$ ABL Availability 69.7$ Horizon Global Liquidity

14 DRIVEN TO DELIVER 2Q 2015 Earnings NYSE: HZN Business Update • Mark Zeffiro Financial Results • David Rice Outlook • Mark Zeffiro Q&A Horizon Global Second Quarter 2015
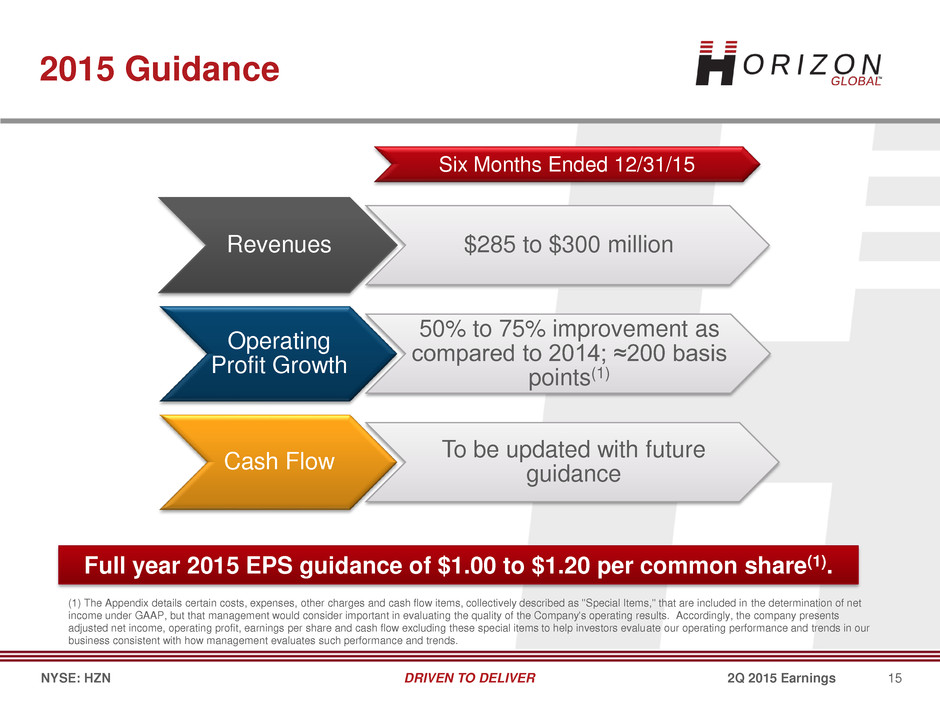
15 DRIVEN TO DELIVER 2Q 2015 Earnings NYSE: HZN Revenues $285 to $300 million Operating Profit Growth 50% to 75% improvement as compared to 2014; ≈200 basis points(1) Cash Flow To be updated with future guidance 2015 Guidance Six Months Ended 12/31/15 Full year 2015 EPS guidance of $1.00 to $1.20 per common share(1). (1) The Appendix details certain costs, expenses, other charges and cash flow items, collectively described as ''Special Items,'' that are included in the determination of net income under GAAP, but that management would consider important in evaluating the quality of the Company's operating results. Accordingly, the company presents adjusted net income, operating profit, earnings per share and cash flow excluding these special items to help investors evaluate our operating performance and trends in our business consistent with how management evaluates such performance and trends.
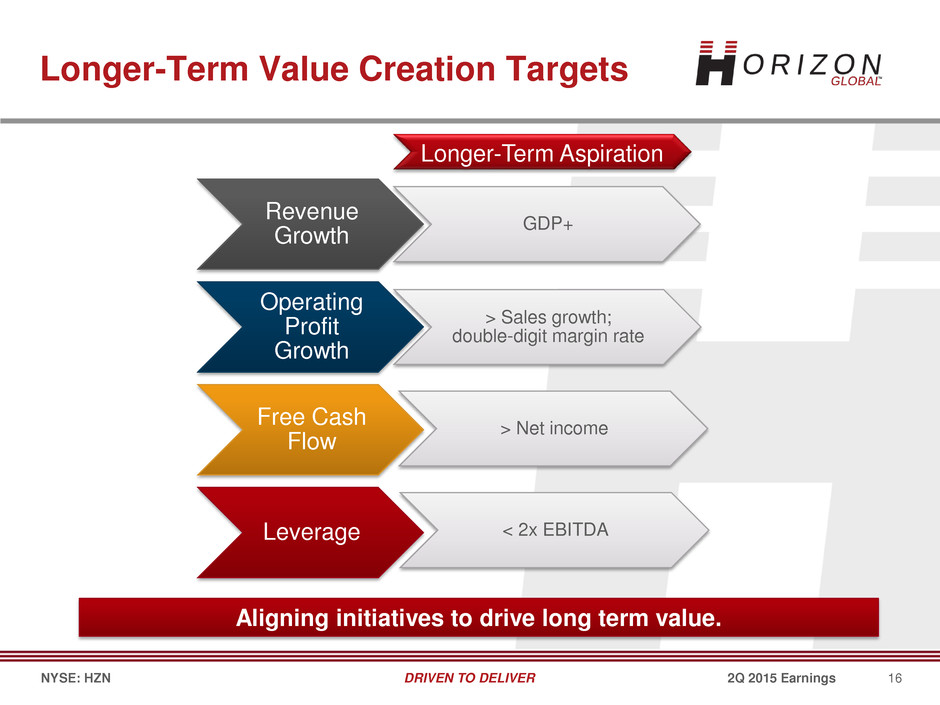
16 DRIVEN TO DELIVER 2Q 2015 Earnings NYSE: HZN Revenue Growth GDP+ Operating Profit Growth > Sales growth; double-digit margin rate Free Cash Flow > Net income Leverage < 2x EBITDA Longer-Term Value Creation Targets Longer-Term Aspiration Aligning initiatives to drive long term value.
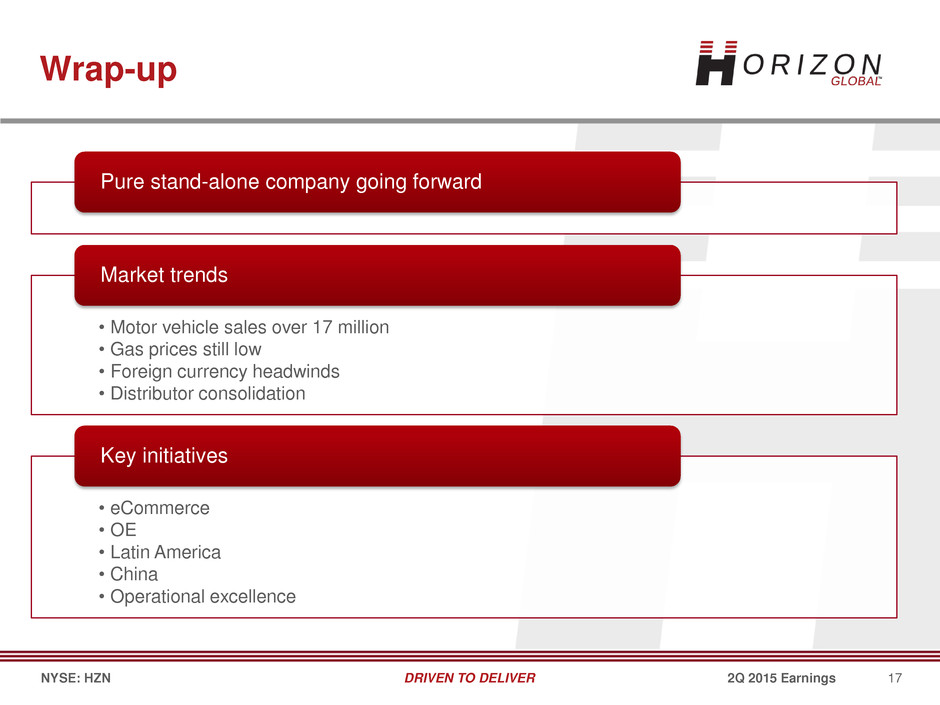
17 DRIVEN TO DELIVER 2Q 2015 Earnings NYSE: HZN Pure stand-alone company going forward • Motor vehicle sales over 17 million • Gas prices still low • Foreign currency headwinds • Distributor consolidation Market trends • eCommerce • OE • Latin America • China • Operational excellence Key initiatives Wrap-up
18 DRIVEN TO DELIVER 2Q 2015 Earnings NYSE: HZN Business Update • Mark Zeffiro Financial Results • David Rice Outlook • Mark Zeffiro Q&A Horizon Global Second Quarter 2015
19 DRIVEN TO DELIVER 2Q 2015 Earnings NYSE: HZN Q&A

20 DRIVEN TO DELIVER 2Q 2015 Earnings NYSE: HZN Appendix
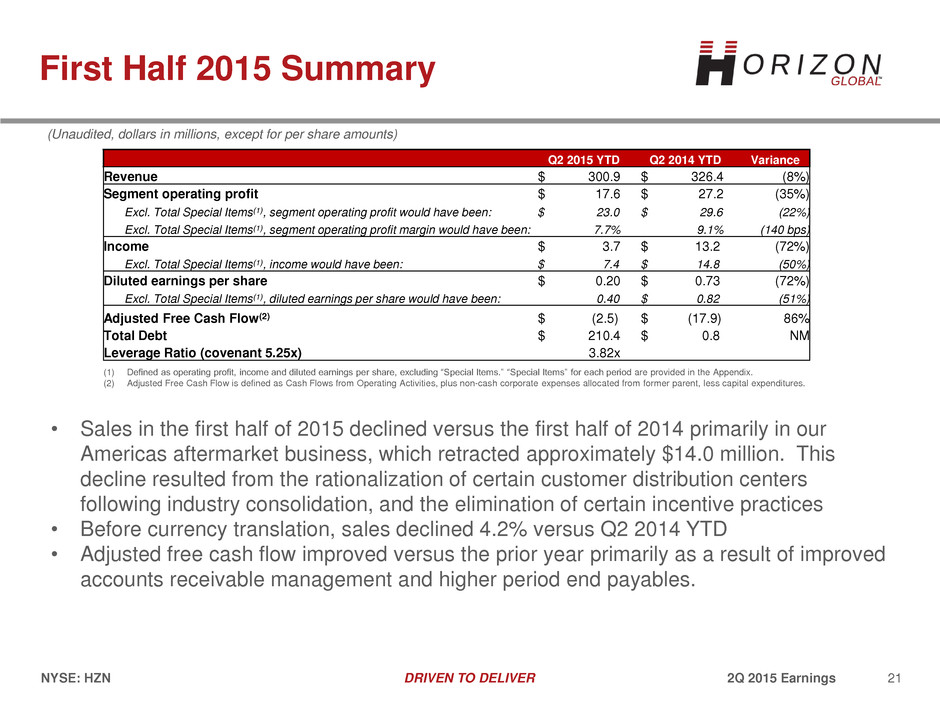
21 DRIVEN TO DELIVER 2Q 2015 Earnings NYSE: HZN First Half 2015 Summary (Unaudited, dollars in millions, except for per share amounts) • Sales in the first half of 2015 declined versus the first half of 2014 primarily in our Americas aftermarket business, which retracted approximately $14.0 million. This decline resulted from the rationalization of certain customer distribution centers following industry consolidation, and the elimination of certain incentive practices • Before currency translation, sales declined 4.2% versus Q2 2014 YTD • Adjusted free cash flow improved versus the prior year primarily as a result of improved accounts receivable management and higher period end payables. Q2 2015 YTD Q2 2014 YTD Variance Revenue $ 300.9 $ 326.4 (8%) Segment operating profit $ 17.6 $ 27.2 (35%) Excl. Total Special Items(1), segment operating profit would have been: $ 23.0 $ 29.6 (22%) Excl. Total Special Items(1), segment operating profit margin would have been: 7.7% 9.1% (140 bps) Income $ 3.7 $ 13.2 (72%) Excl. Total Special Items(1), income would have been: $ 7.4 $ 14.8 (50%) Diluted earnings per share $ 0.20 $ 0.73 (72%) Excl. Total Special Items(1), diluted earnings per share would have been: 0.40 $ 0.82 (51%) Adjusted Free Cash Flow(2) $ (2.5) $ (17.9) 86% Total Debt $ 210.4 $ 0.8 NM Leverage Ratio (covenant 5.25x) 3.82x (1) Defined as operating profit, income and diluted earnings per share, excluding “Special Items.” “Special Items” for each period are provided in the Appendix. (2) Adjusted Free Cash Flow is defined as Cash Flows from Operating Activities, plus non-cash corporate expenses allocated from former parent, less capital expenditures.
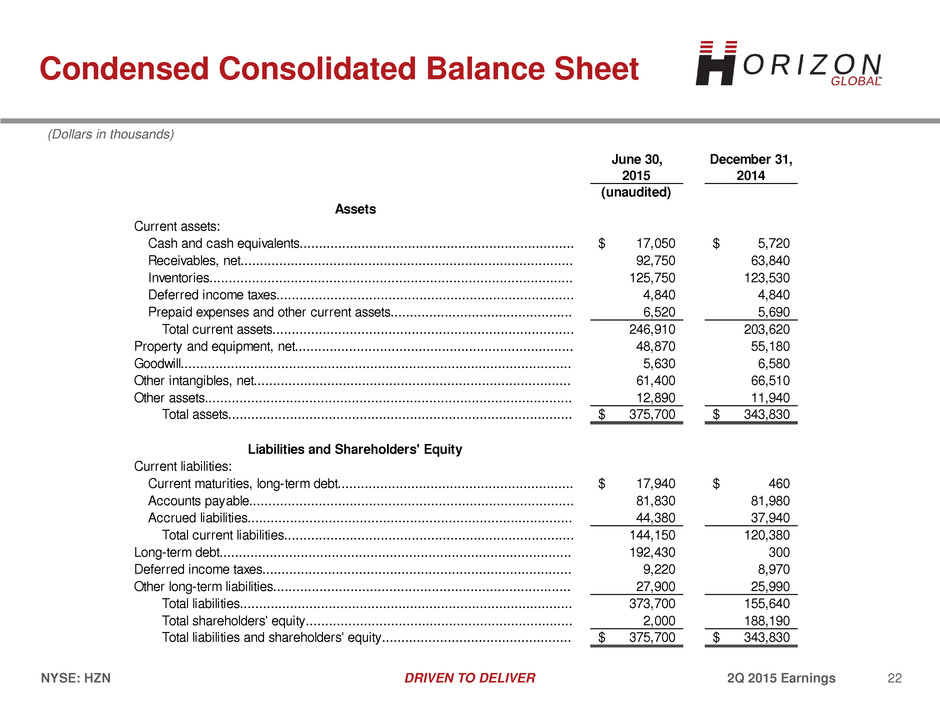
22 DRIVEN TO DELIVER 2Q 2015 Earnings NYSE: HZN Condensed Consolidated Balance Sheet (Dollars in thousands) June 30, December 31, 2015 2014 (unaudited) Assets Current assets: Cash and cash equivalents....................................................................... 17,050$ 5,720$ Receivables, net...................................................................................... 92,750 63,840 Inventories.............................................................................................. 125,750 123,530 Deferred income taxes............................................................................. 4,840 4,840 Prepaid expenses and other current assets............................................... 6,520 5,690 Total current assets.............................................................................. 246,910 203,620 Property and equipment, net........................................................................ 48,870 55,180 Goodwill..................................................................................................... 5,630 6,580 Other intangibles, net.................................................................................. 61,400 66,510 Other assets............................................................................................... 12,890 11,940 Total assets......................................................................................... 375,700$ 343,830$ Liabilities and Shareholders' Equity Current liabilities: Current maturities, long-term debt............................................................. 17,940$ 460$ Accounts payable.................................................................................... 81,830 81,980 Accrued liabilities.................................................................................... 44,380 37,940 Total current liabilities........................................................................... 144,150 120,380 Long-term debt........................................................................................... 192,430 300 Deferred income taxes................................................................................ 9,220 8,970 Other long-term liabilities............................................................................. 27,900 25,990 Total liabilities...................................................................................... 373,700 155,640 Total shareholders' equity..................................................................... 2,000 188,190 Total liabilities and shareholders' equity................................................. 375,700$ 343,830$
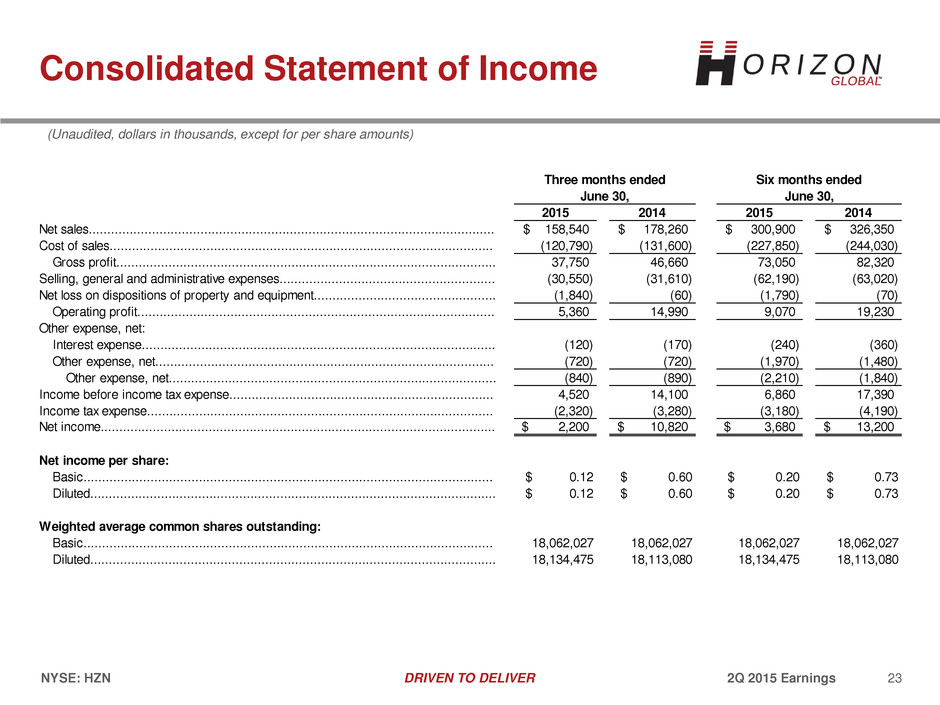
23 DRIVEN TO DELIVER 2Q 2015 Earnings NYSE: HZN Consolidated Statement of Income (Unaudited, dollars in thousands, except for per share amounts) Three months ended Six months ended 2015 2014 2015 2014 Net sales............................................................................................................. 158,540$ 178,260$ 300,900$ 326,350$ Cost of sales....................................................................................................... (120,790) (131,600) (227,850) (244,030) Gross profit...................................................................................................... 37,750 46,660 73,050 82,320 Selling, general and administrative expenses.......................................................... (30,550) (31,610) (62,190) (63,020) Net loss on dispositions of property and equipment................................................. (1,840) (60) (1,790) (70) Operating profit................................................................................................ 5,360 14,990 9,070 19,230 Other expense, net: Interest expense............................................................................................... (120) (170) (240) (360) Other expense, net........................................................................................... (720) (720) (1,970) (1,480) Other expense, net........................................................................................ (840) (890) (2,210) (1,840) Income before income tax expense....................................................................... 4,520 14,100 6,860 17,390 Income tax expense............................................................................................. (2,320) (3,280) (3,180) (4,190) Net income.......................................................................................................... 2,200$ 10,820$ 3,680$ 13,200$ Net inco e per share: Basic.............................................................................................................. $ 0.12 $ 0.60 $ 0.20 $ 0.73 Diluted............................................................................................................. $ 0.12 $ 0.60 $ 0.20 $ 0.73 Weighted average common shares outstanding: Basic.............................................................................................................. 18,062,027 18,062,027 18,062,027 18,062,027 Diluted............................................................................................................. 18,134,475 18,113,080 18,134,475 18,113,080 June 30, June 30,
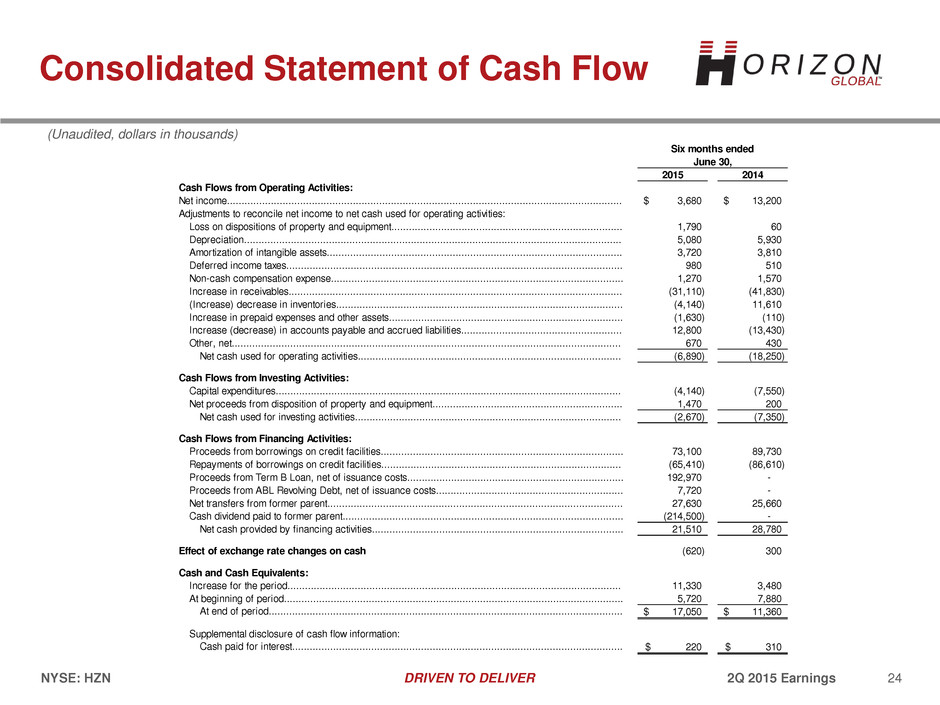
24 DRIVEN TO DELIVER 2Q 2015 Earnings NYSE: HZN Consolidated Statement of Cash Flow (Unaudited, dollars in thousands) 2015 2014 Cash Flows from Operating Activities: Net income....................................................................................................................................... 3,680$ 13,200$ Adjustments to reconcile net income to net cash used for operating activities: Loss on dispositions of property and equipment............................................................................... 1,790 60 Depreciation................................................................................................................................. 5,080 5,930 Amortization of intangible assets..................................................................................................... 3,720 3,810 Deferred income taxes................................................................................................................... 980 510 Non-cash compensation expense.................................................................................................... 1,270 1,570 Increase in receivables.................................................................................................................. (31,110) (41,830) (Increase) decrease in inventories.................................................................................................. (4,140) 11,610 Increase in prepaid expenses and other assets................................................................................ (1,630) (110) Increase (decrease) in accounts payable and accrued liabilities....................................................... 12,800 (13,430) Other, net..................................................................................................................................... 670 430 Net cash used for operating activities.......................................................................................... (6,890) (18,250) Cash Flows from Investing Activities: Capital expenditures...................................................................................................................... (4,140) (7,550) Net proceeds from disposition of property and equipment................................................................. 1,470 200 Net cash used for investing activities........................................................................................... (2,670) (7,350) Cash Flows from Financing Activities: Proceeds from borrowings on credit facilities................................................................................... 73,100 89,730 Repayments of borrowings on credit facilities.................................................................................. (65,410) (86,610) Proceeds from Term B Loan, net of issuance costs.......................................................................... 192,970 - Proceeds from ABL Revolving Debt, net of issuance costs................................................................ 7,720 - Net transfers from former parent..................................................................................................... 27,630 25,660 Cash dividend paid to former parent................................................................................................ (214,500) - Net cash provided by financing activities...................................................................................... 21,510 28,780 Effect of exchange rate changes on cash (620) 300 Cash and Cash Equivalents: Increa e for the period.................................................................................................................. 11,330 3,480 At beginning of period.................................................................................................................... 5,720 7,880 At end of period......................................................................................................................... 17,050$ 11,360$ Supplemental disclosure of cash flow information: Cash paid for interest................................................................................................................. 220$ 310$ Six months ended June 30,
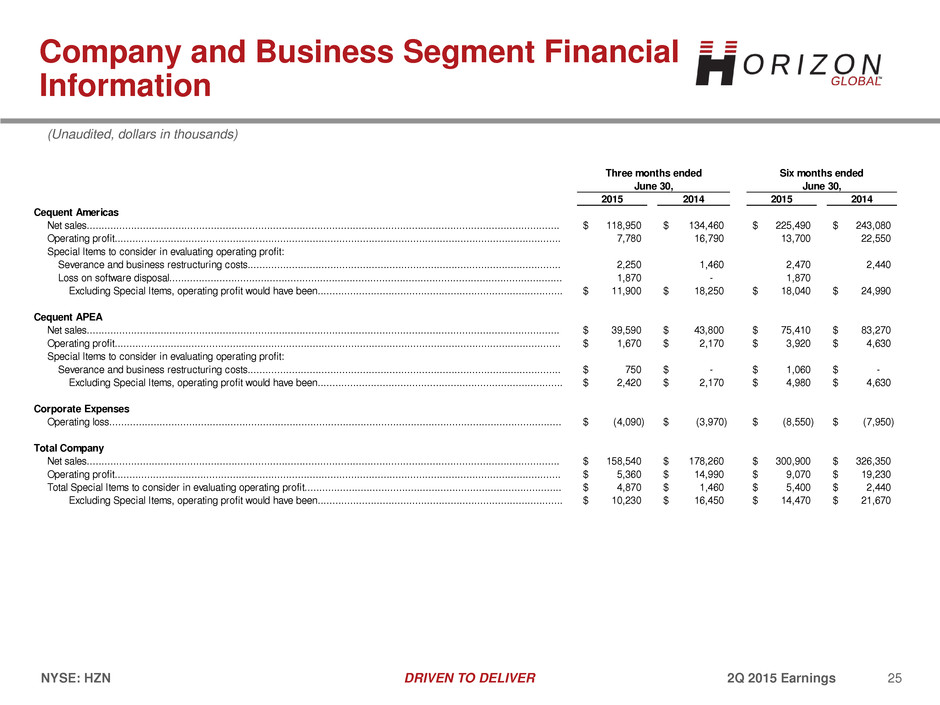
25 DRIVEN TO DELIVER 2Q 2015 Earnings NYSE: HZN Company and Business Segment Financial Information (Unaudited, dollars in thousands) Three months ended 2015 2014 2015 2014 Net sales................................................................................................................................................................ 118,950$ 134,460$ 225,490$ 243,080$ Operating profit....................................................................................................................................................... 7,780 16,790 13,700 22,550 Special Items to consider in evaluating operating profit: Severance and business restructuring costs.......................................................................................................... 2,250 1,460 2,470 2,440 Loss on software disposal..................................................................................................................................... 1,870 - 1,870 Excluding Special Items, operating profit would have been................................................................................... 11,900$ 18,250$ 18,040$ 24,990$ Net sales................................................................................................................................................................ 39,590$ 43,800$ 75,410$ 83,270$ Operating profit....................................................................................................................................................... 1,670$ 2,170$ 3,920$ 4,630$ Special Items to consider in evaluating operating profit: Severance and business restructuring costs.......................................................................................................... 750$ -$ 1,060$ -$ Excluding Special Items, operating profit would have been................................................................................... 2,420$ 2,170$ 4,980$ 4,630$ Operating loss......................................................................................................................................................... (4,090)$ (3,970)$ (8,550)$ (7,950)$ Net sales................................................................................................................................................................ 158,540$ 178,260$ 300,900$ 326,350$ Operating profit....................................................................................................................................................... 5,360$ 14,990$ 9,070$ 19,230$ Total Special Items to consider in evaluating operating profit....................................................................................... 4,870$ 1,460$ 5,400$ 2,440$ Excluding Special Items, operating profit would have been................................................................................... 10,230$ 16,450$ 14,470$ 21,670$ Total Company Cequent Americas Cequent APEA Corporate Expenses June 30, June 30, Six months ended
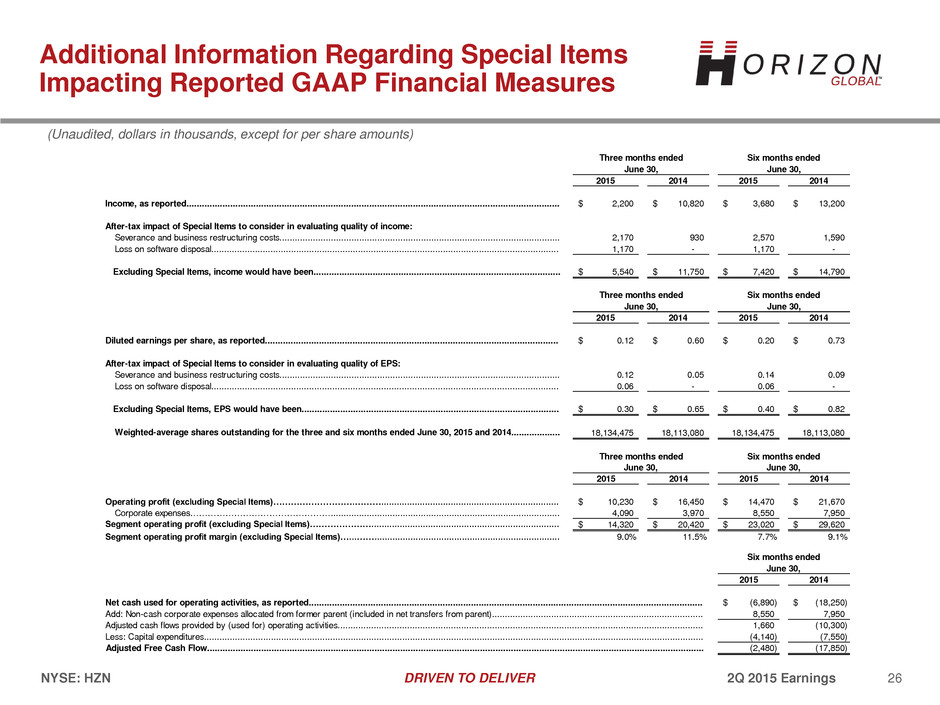
26 DRIVEN TO DELIVER 2Q 2015 Earnings NYSE: HZN Additional Information Regarding Special Items Impacting Reported GAAP Financial Measures (Unaudited, dollars in thousands, except for per share amounts) Three months ended Six months ended June 30, June 30, 2015 2014 2015 2014 Income, as reported................................................................................................................................................. 2,200$ 10,820$ 3,680$ 13,200$ After-tax impact of Special Items to consider in evaluating quality of income: Severance and business restructuring costs............................................................................................................. 2,170 930 2,570 1,590 Loss on software disposal....................................................................................................................................... 1,170 - 1,170 - Excluding Special Items, income would have been................................................................................................ 5,540$ 11,750$ 7,420$ 14,790$ Three months ended Six months ended June 30, June 30, 2015 2014 2015 2014 Diluted earnings per share, as reported.................................................................................................................. 0.12$ 0.60$ 0.20$ 0.73$ After-tax impact of Special Items to consider in evaluating quality of EPS: Severance and business restructuring costs............................................................................................................. 0.12 0.05 0.14 0.09 Loss on software disposal....................................................................................................................................... 0.06 - 0.06 - Excluding Special Items, EPS would have been.................................................................................................... 0.30$ 0.65$ 0.40$ 0.82$ Weighted-average shares outstanding for the three and six months ended June 30, 2015 and 2014................... 18,134,475 18,113,080 18,134,475 18,113,080 2015 2014 2015 2014 Operating profit (excluding Special Items)……………………….………..................................................................... 10,230$ 16,450$ 14,470$ 21,670$ Corporate expenses…………………………………………......................................................................................... 4,090 3,970 8,550 7,950 Segment operating profit (excluding Special Items)…………………......................................................................... 14,320$ 20,420$ 23,020$ 29,620$ Segment operating profit margin (excluding Special Items)…...……........................................................................ 9.0% 11.5% 7.7% 9.1% 2015 2014 (6,890)$ (18,250)$ 8,550 7,950 1,660 (10,300) (4,140) (7,550) (2,480) (17,850) Adjusted Free Cash Flow................................................................................................................................................................................................. June 30, June 30, Three months ended Six months ended Six months ended June 30, Net cash used for operating activities, as reported......................................................................................................................................................... Add: Non-cash corporate expenses allocated from former parent (included in net transfers from parent).................................................................................. Adjusted cash flows provided by (used for) operating activities.............................................................................................................................................. Less: Capital expenditures..................................................................................................................................................................................................
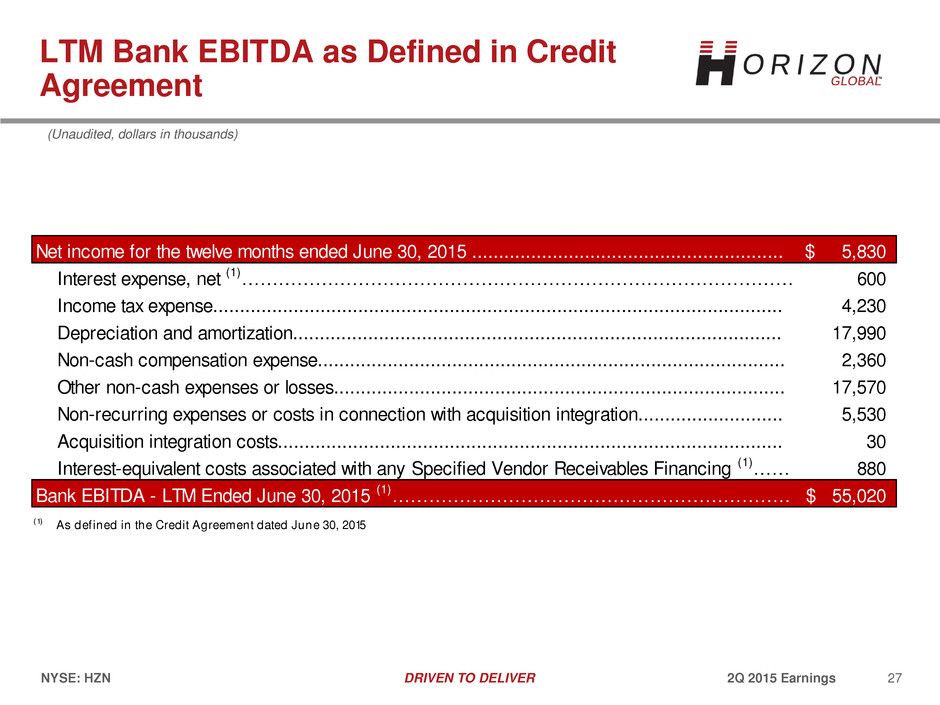
27 DRIVEN TO DELIVER 2Q 2015 Earnings NYSE: HZN LTM Bank EBITDA as Defined in Credit Agreement 5,830$ Interest expense, net (1)………………………………………………………………………………………………600 Income tax expense.......................................................................................................... 4,230 Depreciation and amortization........................................................................................... 17,990 Non-cash compensation expense....................................................................................... 2,360 Other non-cash expenses or losses.................................................................................... 17,570 Non-recurring expenses or costs in connection with acquisition integration........................... 5,530 Acquisition integration costs.............................................................................................. 30 Interest-equivalent costs associated with any Specified Vendor Receivables Financing (1)…………………..880 55,020$ (1) As defined in the Credit Agreement dated June 30, 2015 Net income for the twelve months ended June 30, 2015 .......................................................... Bank EBITDA - LTM Ended June 30, 2015 (1)……………………………………………………………………….. (Unaudited, dollars in thousands)
