Attached files
| file | filename |
|---|---|
| EX-32.2 - EXHIBIT 32.2 - Horizon Global Corp | hzn-123117xexh322.htm |
| EX-32.1 - EXHIBIT 32.1 - Horizon Global Corp | hzn-123117xexh321.htm |
| EX-31.2 - EXHIBIT 31.2 - Horizon Global Corp | hzn-123117xexh312.htm |
| EX-31.1 - EXHIBIT 31.1 - Horizon Global Corp | hzn-123117xexh311.htm |
| EX-23.1 - EXHIBIT 23.1 - Horizon Global Corp | hzn-123117xexh231.htm |
| EX-21.1 - EXHIBIT 21.1 - Horizon Global Corp | hzn-123117xexh211.htm |
| EX-2.3 - EXHIBIT 2.3 - Horizon Global Corp | exhibit23brinkspaexcdocx.htm |
UNITED STATES
SECURITIES AND EXCHANGE COMMISSION
Washington D.C. 20549
__________________________________________________________________________________________________
Form 10-K
(Mark One) | ||
x | ANNUAL REPORT PURSUANT TO SECTION 13 OR 15(d) OF THE SECURITIES EXCHANGE ACT OF 1934 | |
For the fiscal year ended December 31, 2017 | ||
Or | ||
o | TRANSITION REPORT PURSUANT TO SECTION 13 or 15(d) OF THE SECURITIES EXCHANGE ACT OF 1934 | |
For the transition period from to | ||
Commission file number 001-37427
__________________________________________________________________________________________________
HORIZON GLOBAL CORPORATION
(Exact Name of Registrant as Specified in Its Charter)
Delaware (State or Other Jurisdiction of Incorporation or Organization) | 47-3574483 (IRS Employer Identification No.) | |
2600 W. Big Beaver Road, Suite 555
Troy, Michigan 48084
(Address of Principal Executive Offices, Including Zip Code)
(248) 593-8820
(Registrant’s telephone number, including area code)
Securities registered pursuant to Section 12(b) of the Act:
Title of Each Class: | Name of Each Exchange on Which Registered: | |
Common stock, $0.01 par value | New York Stock Exchange | |
Securities registered pursuant to Section 12(g) of the Act: None
Indicate by check mark if the registrant is a well-known seasoned issuer, as defined in Rule 405 of the Securities Act. Yes o No x
Indicate by check mark if the registrant is not required to file reports pursuant to Section 13 or Section 15(d) of the Act. Yes o No x
Indicate by check mark whether the Registrant (1) has filed all reports required to be filed by Section 13 or 15(d) of the Securities Exchange Act of 1934 during the preceding 12 months (or for such shorter period that the Registrant was required to file such reports), and (2) has been subject to such filing requirements for the past 90 days. Yes x No o
Indicate by check mark whether the registrant has submitted electronically and posted on its corporate Web site, if any, every Interactive Data File required to be submitted and posted pursuant to Rule 405 of Regulation S-T (§ 232.405 of this chapter) during the preceding 12 months (or for such shorter period that the registrant was required to submit and post such files). Yes x No o
Indicate by check mark if disclosure of delinquent filers pursuant to Item 405 of Regulation S-K (§ 229.405) is not contained herein, and will not be contained, to the best of Registrant’s knowledge, in definitive proxy or information statements incorporated by reference in Part III of this Form 10-K or any amendment to this Form 10-K. x
Indicate by check mark whether the Registrant is a large accelerated filer, an accelerated filer, a non-accelerated filer, smaller reporting company, or an emerging growth company. See definition of “accelerated filer,” “large accelerated filer,” “smaller reporting company,” and “emerging growth company” in Rule 12b-2 of the Exchange Act.
Large accelerated filer o | Accelerated filer o | Non-accelerated filer o (Do not check if a smaller reporting company) | Smaller reporting company o | Emerging growth company x | ||||
If an emerging growth company, indicate by check mark if the registrant has elected not to use the extended transition period for complying with any new or revised financial accounting standards provided pursuant to Section 13(a) of the Exchange Act. Yes x No o
Indicate by check mark whether the registrant is a shell company (as defined in Rule 12b-2 of the Act). Yes o No x
The aggregate market value of the common stock held by non-affiliates of the Registrant as of June 30, 2017 was approximately $352.3 million, based upon the closing sales price of the Registrant’s common stock, $0.01 par value, reported for such date on the New York Stock Exchange. For purposes of this calculation only, directors and executive officers are deemed to be affiliates of the Registrant.
As of February 26, 2018, the number of outstanding shares of the Registrant’s common stock, $0.01 par value, was 24,950,906 shares.
Portions of the Registrant’s Proxy Statement for the 2018 Annual Meeting of Stockholders are incorporated herein by reference in Part III of this Annual Report on Form 10-K to the extent stated herein.
Horizon Global Corporation
Index
2
Forward-Looking Statements
This Annual Report on Form 10-K may contain “forward-looking statements” as defined in the Private Securities Litigation Reform Act of 1995. Forward-looking statements speak only as of the date they are made and give our current expectations or forecasts of future events. These forward-looking statements can be identified by the use of forward-looking words, such as “may,” “could,” “should,” “estimate,” “project,” “forecast,” “intend,” “expect,” “anticipate,” “believe,” “target,” “plan” or other comparable words, or by discussions of strategy that may involve risks and uncertainties.
These forward-looking statements are subject to numerous assumptions, risks and uncertainties which could materially affect our business, financial condition or future results including, but not limited to, risks and uncertainties with respect to: the Company’s integration of the Westfalia Group (defined herein); the Company’s ability to successfully complete the acquisition of the Brink Group (defined herein); leverage; liabilities imposed by the Company’s debt instruments; market demand; competitive factors; supply constraints; material and energy costs; technology factors; litigation; government and regulatory actions; the Company’s accounting policies; future trends; general economic and currency conditions; various conditions specific to the Company’s business and industry; and other risks that are discussed in, Part I, Item 1A, “Risk Factors.” The risks described in this Annual Report on Form 10-K are not the only risks facing our Company. Additional risks and uncertainties not currently known to us or that we currently deemed to be immaterial also may materially adversely affect our business, financial position and results of operations or cash flows.
The cautionary statements set forth above should be considered in connection with any subsequent written or oral forward-looking statements that we or persons acting on our behalf may issue. We caution readers not to place undo reliance on the statements, which speak only as of the date of this Annual Report on Form 10-K. We do not undertake any obligation to review or confirm analysts’ expectations or estimates or to release publicly any revisions to any forward-looking statement to reflect events or circumstances after the date of this Annual Report on Form 10-K or to reflect the occurrence of unanticipated events, except as otherwise required by law.
We disclose important factors that could cause our actual results to differ materially from our expectations implied by our forward-looking statements under Item 7, “Management’s Discussion and Analysis of Financial Condition and Results of Operations,” and elsewhere in this Annual Report on Form 10-K. These cautionary statements qualify all forward-looking statements attributed to us or persons acting on our behalf. When we indicate that an event, condition or circumstance could or would have an adverse effect on us, we mean to include effects upon our business, financial and other conditions, results of operations, prospects and ability to service our debt.
3
PART I
Item 1. Business
Overview
Horizon Global Corporation, which we refer to herein as “Horizon,” “Horizon Global,” “we” or the “Company,” became an independent, publicly traded company as the result of a spin-off, which we refer to herein as the “spin-off,” from TriMas Corporation, or “TriMas,” on June 30, 2015.
We are a leading designer, manufacturer and distributor of a wide variety of high-quality, custom-engineered towing, trailering, cargo management and other related accessory products on a global basis, serving the automotive aftermarket, retail and original equipment, or “OE,” channels.
The Company is organized into three reportable segments: Horizon Americas, Horizon Asia-Pacific, and Horizon Europe-Africa. Horizon Americas has operations in North and South America, and we believe has been a leader in towing and trailering-related products sold through retail, aftermarket, OE, e-commerce and industrial channels. Horizon Asia‑Pacific and Horizon Europe‑Africa focus their sales and manufacturing efforts outside of North and South America. Horizon Asia‑Pacific operates primarily in Australia, Thailand, and New Zealand, while Horizon Europe‑Africa operates primarily in Germany, France, the United Kingdom, Romania, and South Africa. We believe Horizon Asia‑Pacific and Horizon Europe‑Africa have been leaders in towing related products sold through the OE and aftermarket channels in their regions.
Our products are used in two primary categories across the world: commercial applications, or “Work,” and recreational activities, or “Play.” Some of the markets in our Work category include agricultural, automotive, construction, fleet, industrial, marine, military, mining and municipalities. Some of the markets in our Play category include equestrian, power sports, recreational vehicle, specialty automotive, truck accessory and other specialty towing applications. We believe that the primary brands we offer are among the most recognized in the markets we serve and are known for quality, safety and performance. Our products reach end consumers through many avenues, including independent installers, warehouse distributors, dealers, OE, retail stores and online retailers.
We believe no individual competitor serving the channels we participate in can match our broad product portfolio, which we categorize into the following four groups:
▪ | Towing: This product category includes devices and accessories installed on a tow-vehicle for the purpose of attaching a trailer, camper, etc. such as hitches, fifth wheels, gooseneck hitches, weight distribution systems, wiring harnesses, draw bars, ball mounts, crossbars, towbars, security and other towing accessories; |
▪ | Trailering: This product category includes control devices and components of the trailer itself such as brake controls, jacks, winches, couplers, interior and exterior vehicle lighting and brake replacement parts; |
▪ | Cargo Management: This product category includes a wide variety of products used to facilitate the transportation of various forms of cargo, to secure that cargo or to organize items. Examples of these products are bike racks, roof cross bar systems, cargo carriers, luggage boxes, car interior protective products, rope, tie-downs, tarps, tarp straps, bungee cords, loading ramps and interior travel organizers; and |
▪ | Other: This product category includes a diverse range of items in our portfolio that do not fit into any of the previous three main categories. Items in this category include tubular push bars, side steps, sports bars, skid plates, and oil pans. |
We have positioned our product portfolio to create a variety of options based on price-point, ranging from entry-level to premium-level products across most of our markets. We believe the brands we offer in our aftermarket channel have significant customer recognition, with the four most significant being Reese®, Hayman-Reese™, Draw-Tite® and Westfalia®. We believe all four have substantial market share and have been leading brands in the towing market for over 50 years. These brands provide the foundation of our market position based on worldwide commercial and consumer acceptance. We also maintain a collection of regionally recognized brands that include Aqua Clear™, Bulldog®, BTM, DHF, Engetran, Fulton®, Kovil, Parkside®, Reese Secure™, Reese Explorer™, Reese Power Sports, Reese Towpower™, ROLA®, Tekonsha®, Trojan®, WesBarg® and Witter Towbar Systems. In addition to these product brands, we historically marketed our products to our OE customers in the Asia-Pacific segment, and more recently in the Americas, under the name TriMotive.
For information pertaining to net sales and operating profit attributed to our reportable segments, refer to Note 15, “Segment Information,” included in Item 8, “Financial Statements and Supplementary Data,” within this Annual Report on Form 10-K.
4
Our Industry
Our products are sold into a diverse set of end-markets; the primary applications relate to automotive accessories for light and recreational vehicles. Purchases of automotive accessory parts are discretionary and we believe demand is driven by macro-economic factors including (i) employment trends, (ii) consumer sentiment and (iii) fuel prices, among others.
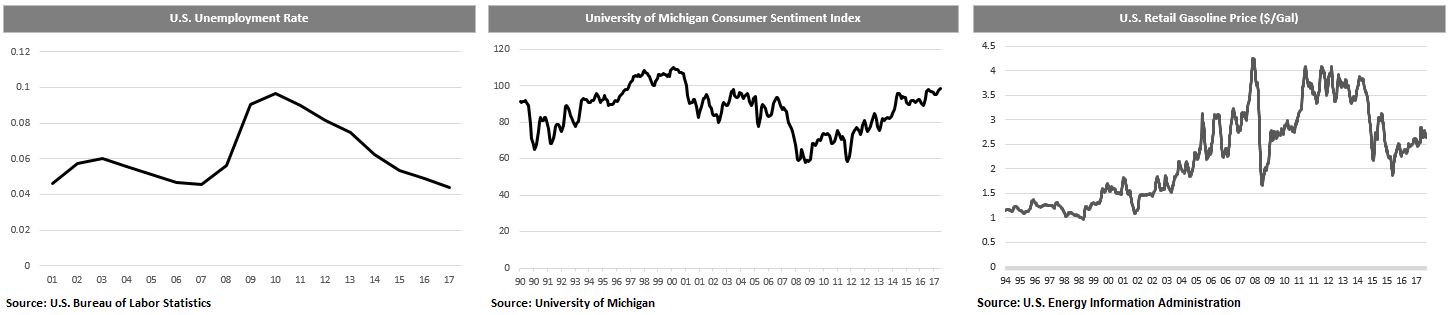
We believe all of these metrics impact both our Work- and Play-related sales. In addition, we believe the Play-related sales are more sensitive to changes in these indices, given the Play-related sales tend to be more directly related to disposable income levels. In general, recent decreases in unemployment and fuel prices, coupled with increases in consumer sentiment, are positive trends for our businesses.
Aftermarket and Retail Channels
We sell our products in the aftermarket and retail channels to a wide range of customers, including national and regional distributors, installers, and both traditional brick and mortar and e-commerce merchants, including automotive, home hardware, farm and fleet, and mass merchants. More recent trends in the aftermarket and retail channels include:
▪ | Channel Consolidation: In the more mature market of the United States, there has been increasing consolidation in distribution networks with larger, more sophisticated aftermarket distributors and retailers gaining market share. In kind, these distributors generally require larger, more sophisticated suppliers with product expertise, category management and supply chain services and capabilities, as well as a global manufacturing and services footprint. We provide customers in this category the opportunity to rationalize their supply base of vendors in our product lines by virtue of our broad offering and product expertise; and |
▪ | Growth of Online Capabilities: Reaching consumers directly through online capabilities, including e-commerce, is having an increasing impact on the global automotive aftermarket and retail channels. Establishment of a robust online presence is critical for suppliers regardless of whether or not they participate directly in e-commerce. We believe we are positioned well to take advantage of this continuing trend, given our established online presence. We support consumers by offering a wide range of information on our products and services, including installation videos, custom-fit guides and links to authorized dealers and both brick and mortar and e-commerce merchants. |
OE Channels
The OE channel is comprised of automobile manufacturers and their dealer networks, referred to collectively as automotive OE, as well as non-automotive manufacturers of agricultural equipment, trailers, and other custom assemblies, collectively referred to as industrial OE. The two main components of this channel are original equipment manufacturers (“OEM”) and original equipment suppliers (“OES”). While OE demand is typically driven by planned production, suppliers also grow by increasing their product content on each unit produced through sales of existing product lines or expansion into new product line offerings. Given the consolidation and globalization throughout the automotive industry, suppliers combining a global presence with strong engineering, technology, manufacturing, supply chain and customer support will be best positioned to take advantage of automotive OE business opportunities.
More recent trends in the global OE supplier market include:
▪ | Global Platform/Supplier Consolidation: Automotive OEs are adopting global vehicle platforms to decrease product development costs and increase manufacturing efficiency and profitability. As a result, automotive OEs are selecting suppliers that have the capacity to manufacture and deliver products on a worldwide basis as well as the flexibility to adapt products to local variations. Suppliers with a global supply chain and efficient manufacturing capabilities are best positioned to benefit from this trend. We believe we are uniquely positioned to take advantage of this trend as a result of our global manufacturing footprint, highly developed supply chain relationships and track record of success in solving application challenges in our product lines; |
5
▪ | Outsourcing of Design and Manufacturing of Vehicle Parts and Systems: Automotive OEs continually strive to simplify their assembly processes, lower costs and reduce development times. As a result, they have increasingly relied on suppliers to perform many of the design, engineering, research and development and assembly functions traditionally performed by automotive OEs. Suppliers with extensive design and engineering capabilities are in the best position to benefit from this trend as they are able to offer value-added solutions with superior features and convenience. We believe certain automotive OEs have sought us out to assist with their engineering challenges to increase towing capacity and for the many solutions provided by our existing products; and |
▪ | Shorter Product Development Cycles: Due to frequent shifts in government regulations and customer preferences, OEs are requiring suppliers to continue to provide new designs and product innovations. These trends are prevalent in mature markets as well as, emerging markets, which are advancing rapidly towards the regulatory standards and consumer preferences of the more mature markets. Suppliers with strong technologies, robust engineering and development capabilities are best positioned to meet OE demands for rapid innovation. Our broad product offerings, product expertise, and global engineering footprint enables us to rapidly deploy solutions meeting the changing customer needs. |
Competitive Strengths
We believe our reportable segments share and benefit from the following competitive strengths:
▪ | Diverse Product Portfolio of Market Leading Brands. We believe we benefit from a diverse portfolio of high-quality and highly-engineered products sold under globally recognized and market leading brand names. By offering a wide range of products, we are able to provide a complete solution to satisfy our customers’ towing, trailering and cargo management needs, as well as serve diverse channels through effective brand management. Our brands are well-known in their respective product areas and channels. We believe that we are the leading supplier of towing products and among the leading suppliers of trailering products globally. |
▪ | Global Scale with Flexible Manufacturing Footprint and Supply Chain. We were built through internal growth and a series of acquisitions to become the only truly global automotive accessories company with the products we offer. We have the ability to produce low-volume, customized, quick-turn products in our global manufacturing facilities, while our sourcing arrangements with third-party suppliers provides us with the flexibility to manufacture or source high-volume products as end-market demand fluctuates. Our flexible manufacturing capability, low-cost manufacturing facilities and established supply chain allow us to quickly and efficiently respond to changes in end-market demand. |
▪ | Long-Term Relationships with a Diverse Customer Base. Our customers encompass a broad range of OEs, mass merchants, e-commerce websites, distributors, dealers, and independent installers, representing multiple channels to reaching the end consumer. Blue chip customers include Walmart, Ford Motor Company, FCA, Volkswagen, BMW, Mercedes-Benz, AutoZone, Amazon, Toyota, Canadian Tire, LKQ, U-Haul, Home Depot and Etrailer, among others. Our customer relationships are well established, with many exceeding 20 years. These strong partnerships can provide stability to our revenue base through economic cycles. We believe Horizon’s diverse product portfolio, global scale and flexible manufacturing capabilities enable us to provide a unique value proposition to customers. |
▪ | Globally Competitive Cost Structure. Since becoming an independent public company, we have focused on margin improvement activities, identifying and acting on projects to reduce our cost structure. With focused, identifiable projects under way or complete, we believe we will benefit from improved operating margins and cash flow that can then be deployed to high-value creation activities. The combination of our strong brand names, leading market position, flexible manufacturing and sourcing operations have historically resulted in significant cash flow generation. |
▪ | Experienced Management Team. Our management team is led by our Chief Executive Officer, Mark Zeffiro, who was a senior executive at TriMas for over seven years and has more than 25 years of financial, operational and business leadership experience with companies such as Black & Decker and General Electric Company. David Rice, our Chief Financial Officer, joined TriMas in 2005 and brings more than 30 years of financial, audit and leadership experience to the role. David was previously division finance officer of Cequent Performance Products. Carl Bizon, President of Horizon Americas, has over 23 years of experience, including nearly eight years as the President of Horizon’s international business, including both Europe-Africa and Asia-Pacific. The leadership team of Horizon Asia‑Pacific includes Jason Kieseker, who joined the Horizon business in 2001 and has held various leadership roles within our Horizon Asia‑Pacific business. The leadership team of Horizon Europe‑Africa includes Paul Caruso, who has over 30 years of experience in a variety of roles within the industrial and automotive markets. |
6
Key Business Priorities
Horizon Global established three strategic platforms for value creation focused on business improvement and transformation, supported by a company culture of continuous improvement.
▪ | Margin Expansion. Our first priority is to drive the organization to a 10% operating margin level. We believe the investments made in our facilities and equipment over the past few years, along with our efforts to realign or operations, should provide the foundation for additional margin expansion. We are developing an organization in which all team members are focused on constantly improving the efficiency of all operations through the adoption of lean and continuous improvement practices. |
▪ | Capital Structure. Our second priority is to improve our capital structure. Our net leverage ratio, as defined in certain of the agreements covering our indebtedness, at December 31, 2017 was approximately 3.2 times (expected to be 5.0 times subsequent to the acquisition of Brink International B.V. (“Brink Group”), which is discussed below). Our long-term net leverage ratio target is less than 2 times. We aim to accomplish this goal through both margin improvement as well as paying down our fixed obligations, and should we decide to do so, we have a structure in place that allows us to prepay debt in addition to the amortization required under our term debt. |
▪ | Organic Growth. Our third priority is to grow the business 3% to 5% on an organic basis, annually. We have identified five broad areas of focused growth activities, involving geographic markets and sales channels, which we believe are particularly aligned with our competitive strengths. |
Growth Strategies
Prior to becoming an independent public company, Horizon operated on a regional basis under separate management teams, with independent business decisions and resource allocations made by the Horizon Americas, Horizon Asia‑Pacific and Horizon Europe‑Africa leaders. As a public company, we are reorganizing our global operations to operate as a single combined entity. As a result, we believe that we have multiple opportunities to integrate, improve and grow our business, whether via organic initiatives or via acquisitions of new products or in new geographies, through the following strategies:
▪ | Original Equipment. The global market for accessories and vehicle personalization is increasing and automotive manufacturers are looking for suppliers to partner with to create genuine accessories to meet this need. Historically, this has been a regional effort, but the growth of global automotive OE has increased the need for global suppliers. Our geographic footprint, existing customer relationships and the increase in global vehicle platforms align to present us with unique opportunities to grow with our automotive OE customers. |
▪ | E-commerce. We intend to leverage the breadth of our product portfolio and global manufacturing footprint to expand our presence in the high growth e-commerce channel. This strategy is applicable in our developed markets where a focus on content delivery and customer support drive growth. It is also a powerful tool as we look at developing new, less mature markets around the world, enabling a direct connection with the users of our product set. |
▪ | Latin American Markets. Since entering the Latin American market, we have witnessed a desire to accessorize vehicles among new entrants to the middle class. We expanded our global footprint and product portfolio in Brazil by acquiring DHF Soluções Automotivas Ltda and Engetran Engenharia, Indústria, e Comércio de Peças e Acessórios Veiculares Ltda, respectively, which are included in Horizon Americas. We believe these expansions into new geographies, as well as our manufacturing presence in Mexico, provide opportunities for growth, while supporting both new and existing global customers. |
▪ | Chinese Market. China is in the early stages of adoption for towing and trailering products. As this adoption rate increases, there is an opportunity for us to bring our experience in the safe use of these products into the market in a meaningful capacity. The rapidly growing middle class, in concert with a developing interest in an outdoor recreational lifestyle, is expected to result in incremental demand for our automotive aftermarket products and accessories. We intend to leverage our existing relationships with global automotive OEs and our global manufacturing and distribution network to expand our sales in this developing economy. |
▪ | Product Innovation. Our focus in multi-generational product planning is to formalize the process by which we integrate the feedback and needs of users into our product development engine. We look to move beyond simply responding to the feedback that we receive, to anticipating the functionality future products need to possess to enrich the lives of our users. |
7
Marketing, Customers and Distribution
Horizon employs a dedicated sales force in each of our primary channels. In serving our customers globally, we rely upon our strong historical customer relationships, custom engineering capability, brand recognition, broad product offerings, our established distribution network and varied merchandising strategies to bolster our towing, trailering, cargo management and accessory product sales. Significant Horizon customers include Ford Motor Company, Volkswagen, Toyota and General Motors/Holden in the OE channel; Walmart, Tractor Supply Company and Super Retail Group in the retail channel; and LKQ, U-Haul and Redneck Trailer Supplies in the aftermarket channel. No customer represented greater than 10% of total revenue during the years ended December 31, 2017, 2016 or 2015.
Competition
The competitive environment for automotive accessory products is highly fragmented and is characterized by numerous smaller suppliers, even the largest of which tend to focus in narrow product categories. We believe there is no individual competitor that has the breadth of product portfolio on a global basis in the markets we serve. Significant towing competitors include Curt Manufacturing, B&W Trailer Hitches, The Bosal Group, Brink Group, Buyers Products Company, Demco Products, PullRite, Westin Automotive Products and Camco. Significant trailering competitors include Pacific Rim, Dutton-Lainson, Shelby, Ultra-Fab, Sea-Sense and Atwood. In addition, competition in the cargo management product category primarily comes from Thule, Yakima, Bell, Masterlock and Saris.
Acquisition Strategy
We believe that our businesses have significant opportunities to grow through disciplined strategic acquisitions. We typically seek bolt-on acquisitions, in which we acquire another industry participant or adjacent product lines that enhance the strengths of our core businesses. When evaluating acquisition targets, we look for opportunities to expand our existing product offerings, gain access to new customers and end markets, add new early life cycle technologies, as well as add additional distribution channels, expand our geographic footprint and/or capitalize on scale and cost efficiencies.
Westfalia Acquisition
On October 4, 2016, we completed our previously announced acquisition of Westfalia-Automotive Holding GmbH and TeIJs Holding B.V., which we refer to collectively as the “Westfalia Group” or “Westfalia”. Pursuant to the purchase agreement, we acquired all of the outstanding equity interests of the Westfalia Group for cash consideration of approximately $99.2 million and the issuance to certain of the sellers of 2,704,310 shares of our common stock in a transaction exempt from registration requirements of the Securities Act of 1933, or the “Securities Act.” We funded the cash payment, as well as the repayment of certain of the Westfalia Group’s debt, through a combination of cash on hand and $152.0 million of incremental borrowings under our Term B Loan.
The Westfalia Group is a leading European towing company. Headquartered in Rheda-Wiedenbrück, Germany, with operating facilities in 11 countries, it manufactures towing and trailering products, including more than 1,700 different types of towbars, wiring kits and carrier systems for cars and light utility vehicles. It holds in excess of 300 issued patents and published patent applications protecting its unique line of towing and trailering products. The brands under which it markets its products include Westfalia, Terwa and Siarr.
The acquisition of the Westfalia Group positions us as a leading manufacturer of towing and trailering equipment in Europe and further complements our broad portfolio. We believe the acquisition will expand our opportunities for revenue and margin growth, increase our market share and augment our global OE footprint with access to new markets and customers.
Brink Group
On December 13, 2017, we entered into a definitive agreement to acquire the Brink Group, subject to the satisfaction of customary closing conditions, including receipt of regulatory approvals. We plan to finance the acquisition through new long-term debt and cash on hand. The Company expects to close the acquisition in the second quarter of 2018.
The Brink Group is an industry-leading innovator and manufacture of towbars, wiring kits, and towing accessories. Headquartered in Staphorst, Netherlands, with operations in eight countries, it manufactures towing and trailering solutions serving the automotive OE and aftermarket channels. This acquisition will strengthen our global platform and enhance our product portfolio.
8
Materials and Supply Arrangements
We are sensitive to price movements in our raw materials supply base. Our largest material purchases are for steel, copper, and aluminum. We also consume a significant amount of energy via utilities in our facilities. Historically, when we have experienced increasing costs of steel, we have successfully worked with our suppliers to manage cost pressures and disruptions in supply. Price increases used to offset inflation or a disruption of supply in core materials have generally been successful, although sometimes delayed. Increases in price for these purposes represent a risk in execution.
Employees and Labor Relations
As of December 31, 2017, we employed approximately 4,300 people, of which approximately 13% were located in the United States. In the United States, we have no collective bargaining agreements. Employee relations have generally been satisfactory.
On July 21, 2015, we announced the decision to close our manufacturing facility in Ciudad Juarez, Mexico along with our distribution warehouse in El Paso, Texas, within our Horizon Americas segment, impacting approximately 214 hourly and 47 salaried employees. During the second quarter of 2016, we vacated the El Paso, Texas and Juarez, Mexico sites.
Seasonality and Backlog
We experience some seasonality in our business. Sales of towing and trailering products in the northern hemisphere, where we generate the majority of our sales, are generally stronger in the second and third calendar quarters, as trailer OEs, distributors and retailers acquire product for the spring and summer selling seasons. Our growing businesses in the southern hemisphere are stronger in the first and fourth calendar quarters. We do not consider order backlog to be a material factor in our businesses.
Environmental Matters
We are subject to increasingly stringent environmental laws and regulations, including those relating to air emissions, wastewater discharges and chemical and hazardous waste management and disposal. Some of these environmental laws hold owners or operators of land or businesses liable for their own and for previous owners’ or operators’ releases of hazardous or toxic substances or wastes. Other environmental laws and regulations require the obtainment and compliance with environmental permits. To date, costs of complying with environmental, health and safety requirements have not been material. However, the nature of our operations and our long history of industrial activities at certain of our current or former facilities, as well as those acquired, could potentially result in material environmental liabilities.
While we must comply with existing and pending climate change legislation, regulation and international treaties or accords, current laws and regulations have not had a material impact on our business, capital expenditures or financial position. Future events, including those relating to climate change or greenhouse gas regulation could require us to incur expenses related to the modification or curtailment of operations, installation of pollution control equipment or investigation and cleanup of contaminated sites.
Intangible Assets
Our identified intangible assets, consisting of customer relationships, trademarks and trade names and technology, are recorded at approximately $90.2 million as of December 31, 2017, net of accumulated amortization. The valuation of each of our identified intangibles was performed using broadly accepted valuation methodologies and techniques.
Customer Relationships. We have developed and maintained stable, long-term selling relationships with customer groups for specific branded products and/or focused market product offerings within each of our businesses. Useful lives assigned to customer relationship intangibles range from five to 25 years and have been estimated using historic customer retention and turnover data. Other factors considered in evaluating estimated useful lives include the diverse nature of focused markets and products of which we have significant share, how customers in these markets make purchases and these customers’ position in the supply chain. We also monitor and evaluate the impact of other evolving risks including the threat of lower cost competitors and evolving technology.
Trademarks and Trade Names. Each of our operating groups designs and manufactures products for focused markets under various trade names and trademarks. Our trademark/trade name intangibles are well-established and considered long-lived assets that require maintenance through advertising and promotion expenditures. Because it is our practice and intent to maintain and to continue to support, develop and market these trademarks/trade names for the foreseeable future, we consider our rights in these trademarks/trade names to have an indefinite life, except as otherwise dictated by applicable law. During the second quarter of 2016, we made a decision to simplify our brand offering in the Horizon Americas segment. This resulted in the impairment of trade names with an aggregate carrying value of $2.4 million. During the fourth quarter of 2016, we performed our annual assessment of indefinite-lived intangible assets. Based on this assessment, we determined that certain trade names with an aggregate carrying value of $6.9 million were impaired. This resulted in impairment charges of $6.2 million. No impairments were recorded in 2017.
9
For additional information, refer to Note 6, “Goodwill and Other Intangible Assets,” included in Item 8, “Financial Statements and Supplementary Data,” within this Annual Report on Form 10-K.
Technology. We hold a number of U.S. and foreign patents, patent applications, and proprietary product and process-oriented technologies. We have, and will continue to dedicate, technical resources toward the further development of our products and processes in order to maintain our competitive position in the industrial, commercial and consumer end markets that we serve. Estimated useful lives for our technology intangibles range from three to 15 years and are determined in part by any legal, regulatory or contractual provisions that limit useful life. Other factors considered include the expected use of the technology by the operating groups, the expected useful life of the product and/or product programs to which the technology relates, and the rate of technology adoption by the industry.
International Operations
Approximately 52.6% of our net sales for the year ended December 31, 2017 were derived outside of the United States. We may significantly expand our international operations through organic growth and acquisitions. In addition, approximately 94.9% of our consolidated property and equipment - net as of December 31, 2017 were located outside of the United States. We operate manufacturing facilities in Australia, Brazil, France, Germany, Romania, Mexico, New Zealand, South Africa, and Thailand. For information pertaining to the net sales and total assets attributed to our international operations, refer to Note 15, “Segment Information,” included in Item 8, “Financial Statements and Supplementary Data,” within this Annual Report on Form 10-K.
Website Access to Company Reports
We use our Investor Relations website, www.horizonglobal.com, as a channel for routine distribution of important information, including news releases, analyst presentations and financial information. We post filings as soon as reasonably practicable after they are electronically filed with, or furnished to, the SEC, including our annual, quarterly, and current reports on Forms 10-K, 10-Q and 8-K, our proxy statements and any amendments to those reports or statements. All such postings and filings are available on our Investor Relations website free of charge. The SEC also maintains a website, www.sec.gov, that contains reports, proxy and information statements and other information regarding issuers that file electronically with the SEC. The content on any website referred to in this Annual Report on Form 10-K is not incorporated by reference into this Annual Report on Form 10-K unless expressly noted.
10
Item 1A. Risk Factors
You should carefully consider each of the risks described below, together with information included elsewhere in this Annual Report on Form 10-K and other documents we file with the SEC. The risks that are highlighted below are not the only ones that we face. Some of our risks relate principally to our business and the industry in which we operate, while others relate principally to our spin-off from TriMas, to the securities markets in general and ownership of our common stock. If any of the following risks actually occur, our business, financial condition or results of operations could be negatively affected.
Risks Relating to our Business and our Industry
Our businesses depend upon general economic conditions and we serve some customers in highly cyclical industries; as such, we may be subject to the loss of sales and margins due to an economic downturn or recession.
Our financial performance depends, in large part, on conditions in the markets that we serve in both the U.S. and global economies. Some of the industries that we serve are highly cyclical, such as the agricultural, automotive, construction, horse/livestock, industrial, marine, military, recreational, trailer and utility markets. We may experience a reduction in sales and margins as a result of a downturn in economic conditions or other macroeconomic factors. Lower demand for our products may also negatively affect the capacity utilization of our production facilities, which may further reduce our operating margins.
Many of the markets we serve are highly competitive, which could limit the volume of products that we sell and reduce our operating margins.
Many of our products are sold in competitive markets. We believe that the principal points of competition in our markets are product quality and price, design and engineering capabilities, product development, conformity to customer specifications, reliability and timeliness of delivery, customer service and effectiveness of distribution. Maintaining and improving our competitive position will require continued investment by us in manufacturing, engineering, quality standards, marketing, customer service and support of our distribution networks. We may have insufficient resources in the future to continue to make such investments and, even if we make such investments, we may not be able to maintain or improve our competitive position. We also face the risk of lower-cost foreign manufacturers located in China, Southeast Asia, India and other regions competing in the markets for our products, and we may be driven as a consequence of this competition to increase our investment overseas. Making overseas investments can be highly complicated and we may not always realize the advantages we anticipate from any such investments. Competitive pressure may limit the volume of products that we sell and reduce our operating margins.
We may be unable to successfully implement our business strategies. Our ability to realize our business strategies may be limited.
Our businesses operate in relatively mature industries and it may be difficult to successfully pursue our growth strategies and realize material benefits therefrom. Even if we are successful, other risks attendant to our businesses and the economy generally may substantially or entirely eliminate the benefits.
We may not achieve our strategic goals for margin expansion, capital structure improvement and organic growth; our past performance in these areas may not be indicative of future performance. Failure to achieve our strategic goals may adversely impact our results of operations.
Our strategic platforms for value creation and goals for margin expansion, capital structure improvement and organic growth are subject to risk and uncertainty and depend on general economic, credit, capital market and other conditions that are beyond our control and are subject to fluctuation. Our past performance with respect to margin expansion, capital structure improvement and organic growth, both before and after the spin-off, should be considered independent from, and may not be a reliable indicator of, future performance. These strategic goals may need to be revised or may not be met for a number of reasons, including changes in general economic conditions in the United States and abroad, changes in credit and capital market conditions, increased competition in the markets for our products, increases in raw material or energy costs and changes in technology and manufacturing techniques.
Increases in our raw material or energy costs or the loss of critical suppliers could adversely affect our profitability and other financial results.
We are sensitive to price movements in our raw materials supply base. Our largest material purchases are for steel, copper and aluminum. The prices for these products have historically been volatile, fluctuate with market conditions and may increase as a result of various factors, including: a reduction in the number of suppliers due to restructurings, bankruptcies and consolidations, declining supply due to mine or mill closures and other factors that adversely impact supplier profitability, including increases in supplier operating expenses caused by rising raw material and energy costs. We may be unable to completely offset the impact with price increases on a timely basis due to outstanding commitments to our customers, competitive considerations or our customers’ resistance to accepting such price increases and our financial performance may be adversely impacted by further price
11
increases. A failure by our suppliers to continue to supply us with certain raw materials or component parts on commercially reasonable terms, or at all, could have a material adverse effect on us. To the extent there are energy supply disruptions or material fluctuations in energy costs, our margins could be materially adversely impacted.
Our products are typically highly engineered or customer-driven and we are subject to risks associated with changing technology and manufacturing techniques that could place us at a competitive disadvantage.
We believe that our customers rigorously evaluate their suppliers on the basis of product quality, price competitiveness, technical expertise and development capability, new product innovation, reliability and timeliness of delivery, product design capability, manufacturing expertise, operational flexibility, customer service and overall management. Our success depends on our ability to continue to meet our customers’ changing expectations with respect to these criteria. We anticipate that we will remain committed to product research and development, advanced manufacturing techniques and service to remain competitive, which entails significant costs. We may be unable to address technological advances, implement new and more cost-effective manufacturing techniques, or introduce new or improved products, whether in existing or new markets, so as to maintain our businesses’ competitive positions or to grow our businesses as desired.
We depend on the services of key individuals and relationships, the loss of which could materially harm us.
Our success will depend, in part, on the efforts of our senior management, including our Chief Executive Officer. Our future success will also depend on, among other factors, our ability to attract and retain other qualified personnel. The loss of the services of any of our key employees or the failure to attract or retain employees could have a material adverse effect on us.
A future impairment of our intangible assets or goodwill could have a material negative impact on our financial results.
At December 31, 2017, our intangible assets and goodwill were approximately $90.2 million and $138.2 million, respectively. Intangibles and goodwill each represented approximately 14% and 21% of our total assets, respectively. If we experience declines in sales and operating profit or do not meet our current and forecasted operating budget, we may be subject to future impairment charges. Because of the significance of these assets, any future impairment could have a material adverse effect on our financial results.
We may face liability associated with the use of products for which patent ownership or other intellectual property rights are claimed.
We may be subject to claims or inquiries regarding alleged unauthorized use of a third party’s intellectual property. An adverse outcome in any intellectual property litigation could subject us to significant liabilities to third parties, require us to license technology or other intellectual property rights from others, require us to comply with injunctions to cease marketing or using certain products or brands, or require us to redesign, re-engineer, or re-brand certain products or packaging, any of which could affect our business, financial condition and operating results. If we are required to seek licenses under patents or other intellectual property rights of others, we may not be able to acquire these licenses on acceptable terms, if at all. In addition, the cost of responding to an intellectual property infringement claim, in terms of legal fees and expenses and the diversion of management resources, whether or not the claim is valid, could have a material adverse effect on our business, results of operations and financial condition.
We may be unable to adequately protect our intellectual property.
While we believe that our patents, trademarks and other intellectual property have significant value, it is uncertain that this intellectual property or any intellectual property acquired or developed by us in the future, will provide a meaningful competitive advantage. Our patents or pending applications may be challenged, invalidated or circumvented by competitors or rights granted thereunder may not provide meaningful proprietary protection. Moreover, competitors may infringe on our patents or successfully avoid them through design innovation. Policing unauthorized use of our intellectual property is difficult and expensive, and we may not be able to, or have the resources to, prevent misappropriation of our proprietary rights, particularly in countries where the laws may not protect such rights as fully as in the United States. The cost of protecting our intellectual property may be significant and could have a material adverse effect on our financial condition and future results of operations.
We may incur material losses and costs as a result of product liability, recall and warranty claims that may be brought against us.
We are subject to a variety of litigation incidental to our business, including claims for damages arising out of use of our products, claims relating to intellectual property matters and claims involving employment matters and commercial disputes.
We currently carry insurance and maintain reserves for potential product liability claims. However, our insurance coverage may be inadequate if such claims do arise and any liability not covered by insurance could have a material adverse effect on our business. Although we have been able to obtain insurance in amounts we believe to be appropriate to cover such liability to date, our
12
insurance premiums may increase in the future as a consequence of conditions in the insurance business generally or our situation in particular. Any such increase could result in lower net income or cause the need to reduce our insurance coverage. In addition, a future claim may be brought against us that could have a material adverse effect on us. Any product liability claim may also include the imposition of punitive damages, the award of which, pursuant to certain state laws, may not be covered by insurance. Our product liability insurance policies have limits that, if exceeded, may result in material costs that could have an adverse effect on our future profitability. In addition, warranty claims are generally not covered by our product liability insurance. Further, any product liability or warranty issues may adversely affect our reputation as a manufacturer of high-quality, safe products, divert management’s attention, and could have a material adverse effect on our business.
Our business may be materially and adversely affected by compliance obligations and liabilities under environmental laws and regulations.
We are subject to increasingly stringent environmental laws and regulations, including those relating to air emissions, wastewater discharges and chemical and hazardous waste management and disposal. Some of these environmental laws hold owners or operators of land or businesses liable for their own and for previous owners’ or operators’ releases of hazardous or toxic substances or wastes. Other environmental laws and regulations require the obtainment and compliance with environmental permits. To date, costs of complying with environmental, health and safety requirements have not been material. However, the nature of our operations and our long history of industrial activities at certain of our current or former facilities, as well as those acquired, could potentially result in material environmental liabilities.
While we must comply with existing and pending climate change legislation, regulation and international treaties or accords, current laws and regulations have not had a material impact on our business, capital expenditures or financial position. Future events, including those relating to climate change or greenhouse gas regulation could require us to incur expenses related to the modification or curtailment of operations, installation of pollution control equipment or investigation and cleanup of contaminated sites.
We have a substantial amount of debt. To service our debt, we will require a significant amount of cash. Our ability to generate cash depends on many factors beyond our control. If we cannot generate the required cash, we may not be able to make the necessary payments required under our debt.
At December 31, 2017, we had total long-term debt of approximately $293.7 million (without giving effect to the equity component of our convertible senior notes or any debt discount). Our ability to make payments on our debt, fund our other liquidity needs, and make planned capital expenditures will depend on our ability to generate cash in the future. Our historical financial results have been, and we anticipate that our future financial results will be, subject to fluctuations. Our ability to generate cash, to a certain extent, is subject to general economic, financial, competitive, legislative, regulatory and other factors that are beyond our control. We cannot guarantee that our business will generate sufficient cash flow from our operations or that future borrowings will be available to us in an amount sufficient to enable us to make payments of our debt, fund other liquidity needs and make planned capital expenditures.
The degree to which we are currently leveraged could have important consequences for shareholders. For example, it could:
▪ | require us to dedicate a substantial portion of our cash from operations to the payment of debt service, reducing the availability of our cash flow to fund working capital, capital expenditures, acquisition and other general corporate purposes; |
▪ | increase our vulnerability to adverse economic or industry conditions; |
▪ | limit our ability to obtain additional financing in the future to enable us to react to changes in our business; or |
▪ | place us at a competitive disadvantage compared to businesses in our industry that have less debt. |
Additionally, any failure to comply with covenants in the instruments governing our debt could result in an event of default which, if not cured or waived, would have a material adverse effect on us.
Our borrowing costs may be impacted by our credit ratings developed by various rating agencies.
Two major ratings agencies, Standard & Poor’s and Moody’s, evaluate our credit profile on an ongoing basis and have each assigned ratings for our long-term debt. If our credit ratings were to decline, our ability to access certain financial markets may become limited, the perception of us in the view of our customers, suppliers and security holders may worsen and as a result, we may be adversely affected.
13
We have significant operating lease obligations and our failure to meet those obligations could adversely affect our financial condition.
We lease many of our manufacturing facilities and certain capital equipment. Our rental expense in 2017 under these operating leases was approximately $20.0 million. A failure to pay our rental obligations would constitute a default allowing the applicable landlord to pursue any remedy available to it under applicable law, which would include taking possession of our property and, in the case of real property, evicting us. These leases are categorized as operating leases and are not considered indebtedness for purposes of our debt instruments.
We may be subject to further unionization and work stoppages at our facilities or our customers may be subject to work stoppages, which could seriously impact the profitability of our business.
As of December 31, 2017, approximately 52% of our work force was unionized under several different unions. We are not aware of any present active union organizing drives at any of our other facilities. We cannot predict the impact of any further unionization of our workplace.
Many of our direct or indirect customers have unionized work forces. Strikes, work stoppages or slowdowns experienced by these customers or their suppliers could result in slowdowns or closures of assembly plants where our products are included. In addition, organizations responsible for shipping our customers’ products may be impacted by occasional strikes or other activity. Any interruption in the delivery of our customers’ products could reduce demand for our products and could have a material adverse effect on us.
Our healthcare costs for active employees and future retirees may exceed our projections and may negatively affect our financial results.
We provide healthcare benefits for active employees through comprehensive hospital, surgical and major medical benefit provisions, all of which are subject to various cost-sharing features. If our costs under our benefit programs for active employees exceed our projections, our business and financial results could be materially adversely affected. Additionally, foreign competitors and many domestic competitors provide fewer benefits to their employees, and this difference in cost could adversely impact our competitive position.
A significant portion of our sales is derived from international sources, which exposes us to certain risks which may adversely affect our business and our financial results.
We have extensive operations outside of the United States. Approximately 53% of our net sales for the year ended December 31, 2017 were derived from sales by our subsidiaries located outside of the United States. In addition, we may significantly expand our international operations through internal growth and acquisitions. International operations, particularly sales to emerging markets and manufacturing in non-U.S. countries, are subject to risks which are not present within U.S. markets, which include, but are not limited to, the following:
▪ | volatility of currency exchange between the U.S. dollar and currencies in international markets; |
▪ | changes in local government regulations and policies including, but not limited to, foreign currency exchange controls or monetary policy, governmental embargoes, repatriation of earnings, expropriation of property, duty or tariff restrictions, investment limitations and tax policies |
▪ | political and economic instability and disruptions, including labor unrest, civil strife, acts of war, guerrilla activities, insurrection and terrorism; |
▪ | legislation that regulates the use of chemicals; |
▪ | disadvantages of competing against companies from countries that are not subject to U.S. laws and regulations, including the Foreign Corrupt Practices Act (“FCPA”); |
▪ | compliance with international trade laws and regulations, including export control and economic sanctions, such as anti-dumping duties; |
▪ | difficulties in staffing and managing multi-national operations; |
▪ | limitations on our ability to enforce legal rights and remedies; |
▪ | tax inefficiencies in repatriating cash flow from non-U.S. subsidiaries that could affect our financial results and reduce our ability to service debt; |
▪ | reduced protection of intellectual property rights; |
14
▪ | increasingly complex laws and regulations concerning privacy and data security, including the European Union’s General Data Protection Regulation; and |
▪ | other risks arising out of foreign sovereignty over the areas where our operations are conducted. |
We are also exposed to risks relating to U.S. policy with respect to companies doing business in foreign jurisdictions, particularly in light of the new U.S. presidential administration. Legislation or other changes in the U.S. tax laws could increase our U.S. income tax liability and adversely affect our after-tax profitability. In addition, the new U.S. presidential administration has introduced greater uncertainty with respect to future tax, trade regulations and trade agreements. Changes in tax policy, trade regulations or trade agreements, such as the disallowance of tax deductions on imported merchandise or the imposition of new tariffs on imported products, could have a material adverse effect on our business and results of operations.
In addition, we could be adversely affected by violations of the FCPA and similar worldwide anti-bribery laws as well as export controls and economic sanction laws. The FCPA and similar anti-bribery laws in other jurisdictions generally prohibit companies and their intermediaries from making improper payments to non-U.S. officials for the purpose of obtaining or retaining business.
Our reputation, ability to do business, and results of operations may be impaired by improper conduct by any of our employees, agents, or business partners.
While we strive to maintain high standards, we cannot provide assurance that our internal controls and compliance systems will always protect us from acts committed by our employees, agents, or business partners that would violate U.S. and/or non-U.S. laws or fail to protect our confidential information, including the laws governing payments to government officials, bribery, fraud, anti-kickback and false claims rules, competition, export and import compliance, money laundering, and data privacy laws, as well as the improper use of proprietary information or social media. Any such allegations, violations of law or improper actions could subject us to civil or criminal investigations in the United States and in other jurisdictions, could lead to substantial civil or criminal, monetary and non-monetary penalties, and related shareholder lawsuits, could lead to increased costs of compliance, could damage our reputation and could have a material effect on our financial statements.
Our growth strategy includes acquisitions. If we are unable to identify attractive acquisition candidates, successfully integrate acquired operations or realize the intended benefits of our acquisitions, we may be adversely affected.
We may pursue strategic acquisition opportunities. Any acquisition will likely require integration expenses and actions that could negatively impact our results of operations, some of which we may not be able to fully anticipate beforehand. In addition, attractive acquisition candidates may not be identified and acquired in the future, financing for acquisitions may be unavailable on satisfactory terms and we may be unable to accomplish our strategic objectives in effecting a particular acquisition. We may encounter various risks in acquiring other companies, including the possible inability to integrate an acquired business into our operations, diversion of management’s attention and unanticipated problems or liabilities, some or all of which could materially and adversely affect our business strategy and financial condition and results of operations.
We may not realize the growth opportunities and cost synergies that are anticipated from acquisitions.
We completed the acquisition of the Westfalia Group in October 2016 and we expect to acquire the Brink Group in the second quarter of 2018. The benefits that are expected to result from these acquisitions will depend, in part, on our ability to realize the anticipated growth opportunities and cost synergies as a result of these acquisitions. Our success in realizing these growth opportunities and cost synergies, and the timing of this realization, depends on the successful integration of the Westfalia Group and the Brink Group. There is a significant degree of difficulty and management distraction inherent in the process of integrating acquisitions as sizable as the Westfalia Group and the Brink Group. The process of integrating operations could cause an interruption of, or loss of, momentum in ours and the Westfalia Group or the Brink Group’s activities. Members of our senior management may be required to devote considerable amounts of time to the integration process, which will decrease the time they will have to manage our business, service existing customers, attract new customers, and develop new products or strategies. If senior management is not able to effectively manage the integration process, or if any significant business activities are interrupted as a result of the integration process, our business could suffer. There can be no assurance that we will successfully or cost-effectively integrate the Westfalia Group or the Brink Group. The failure to do so could have a material adverse effect on our business, financial condition, and results of operations.
Even if we are able to integrate the Westfalia Group and the Brink Group successfully, this integration may not result in the realization of the full benefits of the growth opportunities and cost synergies that we currently expect from this integration, and we cannot guarantee that these benefits will be achieved within anticipated time frames or at all. For example, we may not be able to eliminate duplicative costs. Moreover, we may incur substantial expenses in connection with these integrations. While it is anticipated that certain expenses will be incurred to achieve cost synergies, such expenses are difficult to estimate accurately, and may exceed current estimates. Accordingly, the benefits from these acquisitions may be offset by costs incurred to, or delays in, integrating the businesses.
15
Our acquisition agreements by which we have acquired companies include indemnification provisions that may not fully protect us and may result in unexpected liabilities.
Certain of the agreements related to the acquisition of businesses require indemnification against certain liabilities related to the operations of the company for the previous owner. We cannot be assured that any of these indemnification provisions will fully protect us, and as a result we may incur unexpected liabilities that adversely affect our profitability and financial position.
Increased information technology security threats and more sophisticated and targeted computer crime could pose a risk to our systems, networks, and products.
Increased global information technology security threats and more sophisticated and targeted computer crime pose a risk to the security of our systems and networks and the confidentiality, availability and integrity of our data and communications. While we attempt to mitigate these risks by employing a number of measures, monitoring of our networks and systems, and maintenance of backup and protective systems, our systems, networks and products remain potentially vulnerable to advanced persistent threats. Depending on their nature and scope, such threats could potentially lead to the compromising of confidential information and communications, improper use of our systems and networks, manipulation and destruction of data, defective products, production downtimes and operational disruptions, which in turn could adversely affect our reputation, customer relationships, competitiveness and results of operations. We may be required to incur significant costs to remedy damages caused by these disruptions or security breaches or to protect against disruption or security breaches in the future.
A major failure of our information systems could harm our business.
We depend on integrated information systems to conduct our business. We may experience operating problems with our information systems as a result of system failures, viruses, computer hackers or other causes. Any significant disruption or slowdown of our systems could cause customers to cancel orders or cause standard business processes to become inefficient or ineffective.
The accounting method for convertible debt securities that may be settled in cash, such as our convertible senior notes, could have a material effect on our reported financial results.
Under Accounting Standards Codification (“ASC”) 470-20, “Debt with Conversion and Other Options”, which we refer to as ASC 470-20, an entity must separately account for the liability and equity components of the convertible debt instruments (such as our convertible senior notes) that may be settled entirely or partially in cash upon conversion in a manner that reflects the issuer’s economic interest cost. The effect of ASC 470-20 on the accounting for our convertible senior notes is that the equity component is required to be included in the additional paid-in capital section of stockholders’ equity on our consolidated balance sheet and the value of the equity component would be treated as original issue discount for purposes of accounting for the debt component of our convertible senior notes. As a result, we will be required to record a greater amount of non-cash interest expense in current periods presented as a result of the amortization of the discounted carrying value of our convertible senior notes to their face amount over the term of the convertible senior notes. We will report lower net income in our financial statements because ASC 470-20 will require interest to include both the current period’s amortization of the debt discount and the instrument’s coupon interest, which could adversely affect our reported or future financial results, the trading price of our common stock and the trading price of the convertible senior notes.
In addition, under certain circumstances, convertible debt instruments (such as our convertible senior notes) that may be settled entirely or partly in cash are currently accounted for utilizing the treasury stock method, the effect of which is that the shares issuable upon conversion of our convertible senior notes are not included in the calculation of diluted earnings per share except to the extent that the conversion value of our convertible senior notes exceeds their principal amount. Under the treasury stock method, for diluted earnings per share purposes, the transaction is accounted for as if the number of shares of common stock that would be necessary to settle such excess, if we elected to settle such excess in shares, are issued. We cannot be sure that the accounting standards in the future will continue to permit the use of the treasury stock method. If we are unable to use the treasury stock method in accounting for the shares issuable upon conversion of our convertible senior notes, then our diluted earnings per share would be adversely affected.
The conditional conversion features of our 2.75% Convertible Senior Notes due 2022, if triggered, may adversely affect our financial condition.
In the event the conditional conversion features of the Convertible Notes are triggered, holders of the Convertible Notes will be entitled to convert the Convertible Notes at any time during specified periods at their option. If one or more holders elect to convert their Convertible Notes, unless we elect to satisfy our conversion obligation by delivering solely shares of our common stock, we would be required to make cash payments to satisfy all or a portion of our conversion obligation based on the conversion rate, which could adversely affect our liquidity. In addition, even if holders do not elect to convert their Convertible Notes, we could be required under applicable accounting rules to reclassify all or a portion of the outstanding principal of the Convertible Notes as a current rather than long-term liability, which could result in a material reduction of our net working capital.
16
The convertible note hedge and warrant transactions that we entered into in connection with the offering of the Convertible Senior Notes due 2022 may affect the value of the Convertible Notes and our common stock.
In connection with the offering of the Convertible Notes, we entered into convertible note hedge transactions with certain option counterparties. The Convertible Note Hedges are expected generally to reduce the potential dilution upon conversion of the Convertible Notes and/or offset any cash payments we are required to make in excess of the principal amount of converted Convertible Notes, as the case may be. We also entered into warrant transactions with each option counterparty. The Warrants could separately have a dilutive effect on our common stock to the extent that the market price per share of our common stock exceeds the strike price of the Warrants. In connection with establishing its initial hedge of the Convertible Note Hedges and Warrants, each option counterparty or an affiliate thereof may have entered into various derivative transactions with respect to our common stock concurrently with or shortly after the pricing of the Convertible Notes. This activity could increase (or reduce the size of any decrease in) the market price of our common stock or the Convertible Notes at that time. In addition, each option counterparty or an affiliate thereof may modify its hedge position by entering into or unwinding various derivatives with respect to our common stock and/or purchasing or selling our common stock or other securities of ours in secondary market transactions prior to the maturity of the Convertible Notes (and is likely to do so during any observation period related to a conversion of the Convertible Notes). This activity could also cause or avoid an increase or a decrease in the market price of our common stock or the Convertible Notes. In addition, if any such Convertible Note Hedges and Warrants fail to become effective, each option counterparty may unwind its hedge position with respect to our common stock, which could adversely affect the value of our common stock and the value of the Convertible Notes.
We are subject to counterparty risk with respect to the convertible note hedge transactions.
Each option counterparty to the Convertible Note Hedges is a financial institution, and we will be subject to the risk that it might default under the Convertible Note Hedges. Our exposure to the credit risk of an option counterparty will not be secured by any collateral. Global economic conditions have from time to time resulted in the actual or perceived failure or financial difficulties of many financial institutions. If an option counterparty becomes subject to insolvency proceedings, we will become an unsecured creditor in those proceedings with a claim equal to our exposure at that time under our transactions with the option counterparty. Our exposure will depend on many factors but, generally, the increase in our exposure will be correlated to the increase in the market price and in the volatility of our common stock. In addition, upon a default by an option counterparty, we may suffer adverse tax consequences and more dilution than we currently anticipate with respect to our common stock. We can provide no assurances as to the financial stability or viability of any option counterparty.
Risks Relating to the Spin-off
Our historical consolidated financial information is not necessarily indicative of our future financial condition, results of operations or cash flows nor do they reflect what our financial condition, results of operations or cash flows would have been as an independent public company during the periods presented.
Some of the historical consolidated financial information included in this Annual Report on Form 10-K does not reflect what our financial condition, results of operations or cash flows would have been as an independent public company during all periods presented and is not necessarily indicative of our future financial condition, future results of operations or future cash flows. This is primarily a result of the following factors:
▪ | these historical consolidated financial results include allocations of expenses for services historically provided by TriMas, and those allocations may be significantly lower than the comparable expenses we would have incurred as an independent company; |
▪ | our working capital requirements and capital expenditures historically have been satisfied as a part of TriMas’ corporate-wide capital allocation and cash management programs; as a result, our debt structure and cost of debt and other capital may be significantly different from that reflected in our historical consolidated financial statements; |
▪ | the historical consolidated financial information may not fully reflect the increased costs associated with being an independent public company, including significant changes that have occurred in our cost structure, management, financing arrangements and business operations as a result of our spin-off from TriMas; and |
▪ | the historical consolidated financial information may not fully reflect the effects of certain liabilities that will be incurred or have been assumed by us and may not fully reflect the effects of certain assets and liabilities that have been retained by TriMas. |
We remain subject to continuing contingent liabilities of TriMas following the spin-off.
There are several significant areas where the liabilities of TriMas may yet become our obligations. The separation and distribution agreement and employee matters agreement generally provide that we are responsible for substantially all liabilities that relate to
17
our Horizon Americas and Horizon Asia‑Pacific business activities, whether incurred prior to or after the spin-off, as well as those liabilities of TriMas specifically assumed by us. In addition, under the Internal Revenue Code (the “Code”) and the related rules and regulations, each corporation that was a member of the TriMas consolidated tax reporting group during any taxable period or portion of any taxable period ending on or before the completion of the spin-off is jointly and severally liable for the federal income tax liability of the entire TriMas consolidated tax reporting group for that taxable period. In connection with the spin-off, we entered into a tax sharing agreement with TriMas that allocated the responsibility for prior period taxes of the TriMas consolidated tax reporting group between us and TriMas. However, if TriMas is unable to pay any prior period taxes for which it is responsible, we could be required to pay the entire amount of such taxes. Other provisions of federal law establish similar liability for other matters, including laws governing tax-qualified pension plans as well as other contingent liabilities.
Potential liabilities associated with certain assumed obligations under the tax sharing agreement cannot be precisely quantified at this time.
Under the tax sharing agreement with TriMas, we are responsible generally for certain taxes paid after the spin-off attributable to us or any of our subsidiaries, whether accruing before, on or after the spin-off. We have also agreed to be responsible for, and to indemnify TriMas with respect to, all taxes arising as a result of the spin-off (or certain internal restructuring transactions) failing to qualify as transactions under Sections 368(a) and 355 of the Code for U.S. federal income tax purposes (which could result, for example, from a merger or other transaction involving an acquisition of our shares) to the extent such tax liability arises as a result of any breach of any representation, warranty, covenant or other obligation by us or certain affiliates made in connection with the issuance of the tax opinion relating to the spin-off or in the tax sharing agreement. As described above, such tax liability would be calculated as though TriMas (or its affiliate) had sold its shares of common stock of our company in a taxable sale for their fair market value, and TriMas (or its affiliate) would recognize taxable gain in an amount equal to the excess of the fair market value of such shares over its tax basis in such shares. That tax liability could have a material adverse effect on our company.
We may not be able to engage in desirable strategic or equity raising transactions following the spin-off. In addition, under some circumstances, we could be liable for any adverse tax consequences resulting from engaging in significant strategic or capital raising transactions.
Even if the spin-off otherwise qualifies as a tax-free distribution under Section 355 of the Code, the spin-off may result in significant U.S. federal income tax liabilities to TriMas under applicable provisions of the Code if 50% or more of TriMas’ shares or our shares (in each case, by vote or value) are treated as having been acquired, directly or indirectly, by one or more persons (other than the acquisition of our common stock by TriMas stockholders in the spin-off) as part of a plan (or series of related transactions) that includes the spin-off. Under those provisions, any acquisitions of TriMas shares or our shares (or similar acquisitions), or any understanding, arrangement or substantial negotiations regarding an acquisition of TriMas shares or our shares (or similar acquisitions), within two years before or after the spin-off are subject to special scrutiny. The process for determining whether an acquisition triggering those provisions has occurred is complex, inherently factual and subject to interpretation of the facts and circumstances of a particular case. If a direct or indirect acquisition of TriMas shares or our shares resulted in a change in control as contemplated by those provisions, TriMas (but not its stockholders) would recognize a taxable gain. Under the tax sharing agreement, there are restrictions on our ability to take actions that could cause the separation to fail to qualify as a tax-free distribution, and we will be required to indemnify TriMas against any such tax liabilities attributable to actions taken by or with respect to us or any of our affiliates, or any person that, after the spin-off, is an affiliate thereof. We may be similarly liable if we breach certain other representations or covenants set forth in the tax sharing agreement. As a result of the foregoing, we may be unable to engage in certain strategic or capital raising transactions that our stockholders might consider favorable, including use of Horizon common stock to make acquisitions and equity capital market transactions, or to structure potential transactions in the manner most favorable to us, without adverse tax consequences, if at all.
Potential indemnification liabilities to TriMas pursuant to the separation and distribution agreement could materially and adversely affect our business, financial condition, results of operations and cash flows.
We entered into a separation and distribution agreement with TriMas that provides for, among other things, the principal corporate transactions required to affect the spin-off, certain conditions to the spin-off and provisions governing the relationship between our company and TriMas with respect to and resulting from the spin-off. Among other things, the separation and distribution agreement provides for indemnification obligations designed to make us financially responsible for substantially all liabilities that may exist relating to our Cequent business activities, whether incurred prior to or after the spin-off, as well as those obligations of TriMas assumed by us pursuant to the separation and distribution agreement. If we are required to indemnify TriMas under the circumstances set forth in the separation and distribution agreement, we may be subject to substantial liabilities.
18
In connection with our separation from TriMas, TriMas will indemnify us for certain liabilities. However, there can be no assurance that the indemnity will be sufficient to insure us against the full amount of such liabilities, or that TriMas’ ability to satisfy its indemnification obligations will not be impaired in the future.
Pursuant to the separation and distribution agreement, TriMas agreed to indemnify us for certain liabilities. However, third parties could seek to hold us responsible for any of the liabilities that TriMas has agreed to retain, and there can be no assurance that the indemnity from TriMas will be sufficient to protect us against the full amount of such liabilities, or that TriMas will be able to fully satisfy its indemnification obligations. Moreover, even if we ultimately succeed in recovering from TriMas any amounts for which we are held liable, we may be temporarily required to bear these liabilities ourselves. If TriMas is unable to satisfy its indemnification obligations, the underlying liabilities could have a material adverse effect on our business, financial condition, results of operations and cash flows.
Further, TriMas’ insurers may deny coverage to us for liabilities associated with occurrences prior to the spin-off. Even if we ultimately succeed in recovering from such insurance providers, we may be required to temporarily bear such loss of coverage.
Risks Relating to Ownership of Our Common Stock
Our stock price may be subject to significant volatility due to our own results or market trends.
If our revenue, earnings or cash flows in any quarter fail to meet the investment community’s expectations, there could be an immediate negative impact on our stock price. Our stock price could also be impacted by broader market trends and world events unrelated to our performance.
Our recent issuance of convertible senior notes, or the issuance of any additional shares of our common stock or instruments convertible into shares of our common stock, could materially and adversely affect the market price of our common stock.
In February 2017, we issued $125.0 million aggregate principal amount of convertible senior notes. The convertible senior notes may be settled in cash, shares of common stock or a combination of cash and shares of common stock, at our option. In the future, we may issued additional shares of our common stock or other instruments convertible into, or exchangeable or exercisable for, shares of our common stock. The recent convertible senior notes issuance, and any future issuance of shares of our common stock or instruments convertible into, or exercisable or exchangeable into, shares of our common stock, may materially and adversely affect the market price of our common stock.
In particular, a substantial number of shares of our common stock is reserved for issuance upon conversion of the convertible senior notes upon exercise and settlement or termination of the warrant transactions that we entered into in connection with the convertible senior notes offering, and upon the exercise of stock options, the vesting of restricted stock awards and deferred restricted stock units to our employees. We cannot predict the size of future issuances or the effect, if any, that they may have on the market price for our common stock. The issuance and sale of substantial amounts of shares of our common stock, or the perception that such issuances and sales may occur, could adversely affect the market price of our common stock and impair our ability to raise capital through the sale of additional equity or equity-linked securities. In addition, the market price of our common stock could also be affected by possible sales of our common stock by investors who view our convertible senior notes as a more attractive means of equity participation in us and by hedging or arbitrage trading activity that we expect to develop involving our convertible senior notes and our common stock.
Anti-takeover provisions contained in our Amended and Restated Certificate of Incorporation, or our “certificate of incorporation,” and Amended and Restated Bylaws, or our “bylaws,” as well as provisions of Delaware law, could impair a takeover attempt that stockholders may consider favorable.
Our certificate of incorporation and bylaws provisions, as amended and restated, may have the effect of delaying, deferring or discouraging a prospective acquiror from making a tender offer for our common stock or otherwise attempting to obtain control of us. These provisions, among other things, establish that our board of directors fixes the number of members of the board, divide the board of directors into three classes with staggered terms and establish advance notice requirements for nomination of candidates for election to the board or for proposing matters that can be acted on by stockholders at stockholder meetings. To the extent that these provisions discourage takeover attempts, they could deprive stockholders of opportunities to realize takeover premiums for their shares of common stock. Moreover, these provisions could discourage accumulations of large blocks of our common stock, thus depriving stockholders of any advantages that large accumulations of common stock might provide.
As a Delaware corporation, we will also be subject to provisions of Delaware law, including Section 203 of the General Corporation Law of the State of Delaware. Section 203 prevents some stockholders holding more than 15% of our voting stock from engaging in certain business combinations unless the business combination or the transaction that resulted in the stockholder becoming an interested stockholder was approved in advance by our board of directors, results in the stockholder holding more than 85% of
19
our voting stock, subject to certain restrictions, or is approved at an annual or special meeting of stockholders by the holders of at least 66 2/3% of our voting stock not held by the stockholder engaging in the transaction.
Any provision of our certificate of incorporation or our bylaws or Delaware law that has the effect of delaying or deterring a change in control could limit the opportunity for our stockholders to receive a premium for their shares of our common stock and could also affect the price that some investors are willing to pay for our common stock.
We may issue preferred stock with terms that could dilute the voting power or reduce the value of our common stock.
Our amended and restated certificate of incorporation authorizes us to issue, without the approval of our stockholders, one or more classes or series of preferred stock having such designation, powers, preferences and relative, participating, optional and other special rights, including preferences over our common stock respecting dividends and distributions, as our board of directors generally may determine. The terms of one or more classes or series of preferred stock could dilute the voting power or reduce the value of our common stock. For example, we could grant holders of preferred stock the right to elect some number of our directors in all events or on the happening of specified events or the right to veto specified transactions. Similarly, the repurchase or redemption rights or liquidation preferences we could assign to holders of preferred stock could affect the residual value of our common stock.
We are an “emerging growth company” and we cannot be certain if the reduced disclosure requirements applicable to emerging growth companies will make our common stock less attractive to investors.
We are an “emerging growth company” as defined in the Jumpstart our Business Startups Act of 2012 (the “JOBS Act”). For as long as we continue to be an emerging growth company we may choose to take advantage of certain exemptions from various reporting requirements applicable to other public companies but not to emerging growth companies, which includes, among other things:
▪ | exemption from the auditor attestation requirements under Section 404 of the Sarbanes-Oxley Act of 2002; |
▪ | reduced disclosure obligations regarding executive compensation in our periodic reports and proxy statements; |
▪ | exemption from the requirements of holding non-binding stockholder votes on executive compensation arrangements; and |
▪ | exemption from any rules requiring mandatory audit firm rotation and auditor discussion and analysis and, unless the SEC otherwise determines, any future audit rules that may be adopted by the Public Company Accounting Oversight Board. |
We could be an emerging growth company until the last day of the fiscal year following the fifth anniversary of the consummation of the spin-off, or until the earliest of (i) the last day of the fiscal year in which we have annual gross revenue of $1 billion (subject to adjustment for inflation) or more, (ii) the date on which we have, during the previous three year period, issued more than $1 billion in non-convertible debt or (iii) the date on which we are deemed to be a large accelerated filer under the federal securities laws. We will qualify as a large accelerated filer as of the first day of the first fiscal year after we have (i) more than $700 million in outstanding common equity held by our non-affiliates and (ii) been public for at least 12 months. The value of our outstanding common equity will be measured each year on the last day of our second fiscal quarter.
Under the JOBS Act, emerging growth companies are also permitted to elect to delay adoption of new or revised accounting standards until companies that are not subject to periodic reporting obligations are required to comply, if such accounting standards apply to non-reporting companies. We have made an irrevocable decision to opt out of this extended transition period for complying with new or revised accounting standards.
Changes in laws or regulations or the manner of their interpretation or enforcement could adversely impact our financial performance and restrict our ability to operate our business or execute our strategies.
New laws or regulations, or changes in existing laws or regulations, or the manner of their interpretation or enforcement, could increase our cost of doing business and restrict our ability to operate our business or execute our strategies. In particular, there may be significant changes in U.S. laws and regulations and existing international trade agreements by the current U.S. presidential administration that could affect a wide variety of industries and businesses, including those businesses we own and operate. If the current U.S. presidential administration materially modifies U.S. laws and regulations and international trade agreements, our business, financial condition, and results of operations could be adversely affected.
On December 22, 2017, U.S. tax reform legislation informally known as the Tax Cuts and Jobs Act, or the "2017 Tax Act,” was signed into law. The 2017 Tax Act makes substantial changes to U.S. tax law, including a reduction in the corporate tax rate, a limitation on deductibility of interest expense, a limitation on the use of net operating losses to offset future taxable income, the
20
allowance of immediate expensing of capital expenditures, deemed repatriation of foreign earnings and significant changes to the taxation of foreign earnings going forward. We expect the 2017 Tax Act to have significant effects on us, some of which may be adverse. For example, we would expect impacts on the amount of tax expense and deferred tax assets and liabilities recognized in the financial statements. The extent of the impact remains uncertain at this time and is subject to any other regulatory or administrative developments including any regulations or other guidance promulgated by the U.S. Internal Revenue Service. The 2017 Tax Act contains numerous, complex provisions impacting U.S. multinational companies, and we continue to review and assess the legislative language and its potential impact on us.
Item 1B. Unresolved Staff Comments
Not applicable.
Item 2. Properties
As of December 31, 2017, our operations were conducted through 58 facilities in 21 countries. All of our principal manufacturing facilities are leased. The leases for our manufacturing facilities have initial terms that expire from 2018 through 2027 and are all renewable, at our option, for various terms, provided that we are not in default under the lease agreements. Our corporate headquarters are located in Troy, Michigan under a lease through November 2027. We believe that substantially all of our properties are in generally good condition and there is sufficient capacity to meet current and projected manufacturing, product development and logistics requirements.
The following list identifies, by reportable segment, the location of our principal manufacturing and other facilities as of December 31, 2017:
Horizon Americas | Horizon Asia‑Pacific | Horizon Europe‑Africa | |||
United States: Indiana: South Bend Michigan: Plymouth Ohio: Solon Texas: Dallas McAllen Kansas: Edgerton International: Brazil: Itaquaquecetuba, São Paulo Canada: Mississauga, Ontario Mexico: Reynosa | International: Australia: Keysborough,Victoria New Zealand: Manukau City Thailand: Chon Buri | International: Germany: Hartha Rheda-Wiedenbrück France: Luneray Romania: Braşov South Africa: Pretoria Springs United Kingdom: Deeside | |||
Item 3. Legal Proceedings
We are subject to claims and litigation in the ordinary course of business, but we do not believe that any such claim or litigation is likely to have a material adverse effect on our financial position and results of operations or cash flows.
Item 4. Mine Safety Disclosures
Not applicable.
21
Supplementary Item. Executive Officers of the Company
All executive officers have been employed by us in their current roles since the spin-off. The executive officers of Horizon as of December 31, 2017 are as follows:
A. Mark Zeffiro. Mr. Zeffiro was appointed our president and chief executive officer on June 30, 2015. Mr. Zeffiro served as Co-Chair of our Board from June 29, 2015 to February 14, 2018 and has served as president and a director of Horizon since our incorporation on January 14, 2015. Mr. Zeffiro previously served as group president of Cequent, which was comprised of TriMas’ Cequent Americas and Cequent APEA reporting segments specializing in towing, trailering and cargo management products (“Cequent”), beginning in January 2015. Mr. Zeffiro served as chief financial officer of TriMas from June 2008 to January 2015 and executive vice president of TriMas from May 2013 until January 2015. Prior to joining TriMas, Mr. Zeffiro held various financial management and business positions with General Electric Company, or GE, a diversified technology and financial services company, and Black and Decker Corporation, or Black & Decker, a global manufacturer of quality power tools and accessories, hardware, home improvement products and fastening systems. From 2004 through 2008, during Mr. Zeffiro’s four-year tenure with Black & Decker, he was vice president of finance for the global consumer product group and Latin America. In addition, Mr. Zeffiro was directly responsible for and functioned as general manager of Black & Decker’s factory store business unit. From 2003 to 2004, Mr. Zeffiro was chief financial officer of First Quality Enterprises, a private company producing consumer products for the health care market. From 1988 through 2002, he held a series of operational and financial leadership positions with GE, the most recent of which was chief financial officer of its medical imaging manufacturing division. In April 2015, Mr. Zeffiro was appointed to the board of directors of Atkore International Group, Inc., a manufacturer of electrical raceway solutions. Mr. Zeffiro also serves on the board of directors of the Detroit Institute of Arts, where he chairs the finance committee, and the board of trustees of Walsh College, where he sits on the academic committee. Mr. Zeffiro’s position as president and chief executive officer of Horizon provides him the ability to offer the Board firsthand insight into the operations and strategic vision of the Company. Mr. Zeffiro has extensive knowledge and subject matter expertise in strategic planning, business management, mergers and acquisitions and financial accounting.
David Rice. Mr. Rice was named our chief financial officer on June 30, 2015 in connection with the spin-off from TriMas. From January 14, 2015 through June 29, 2015, Mr. Rice served as vice president and a director of Horizon. Mr. Rice was previously division finance officer for TriMas’ subsidiary Cequent Performance Products, Inc. beginning in 2011. Prior to his appointment in 2011, Mr. Rice held various positions within TriMas, including group controller from 2005 to 2009 and vice president of corporate audit from 2009 to 2011. Before joining TriMas in 2005, Mr. Rice held divisional controller positions with GKN Sinter Metals, a leading supplier of powdered metal precision components, from 2004 to 2005, and Mueller Industries, Inc., a manufacturer and distributor of copper, brass, aluminum and plastic fittings, valves and related tubular flow control and industrial products, from 1998 to 2004. Mr. Rice held positions of increasing financial leadership at The Woodbridge Group from 1994 to 1998, a company offering urethane and bead foam technologies to the automotive and commercial vehicle industries and other business sectors. Mr. Rice began his career in public accounting with Coopers and Lybrand and brings over 30 years of accounting and financial leadership, mergers and acquisitions and management of international operations experience.
Jay Goldbaum. Mr. Goldbaum was named our general counsel effective November 13, 2017 and continues as chief compliance officer and corporate secretary. Mr. Goldbaum served as legal director, chief compliance officer and corporate secretary since June 30, 2015 in connection with the spin-off from TriMas. From January 14, 2015 through June 29, 2015, Mr. Goldbaum served as vice president, corporate secretary and a director of Horizon. Mr. Goldbaum was previously associate general counsel-commercial law for TriMas beginning in January 2014. Mr. Goldbaum joined TriMas in January 2012 and held the position of legal counsel. Before joining TriMas, Mr. Goldbaum was an associate in the corporate and litigation practice groups at the law firm of Jaffe, Raitt, Heuer & Weiss, P.C. from September 2007 to August 2011.
22
PART II
Item 5. Market for Registrant’s Common Equity, Related Stockholder Matters and Issuer Purchases of Equity Securities
Our common stock, par value $0.01 per share, is listed for trading on the New York Stock Exchange, or NYSE, under the symbol “HZN.” As of February 26, 2018, there were 260 holders of record of our common stock.
The high and low sales prices per share of our common stock by quarter, as reported on the New York Stock Exchange through December 31, 2017, are shown below:
Price range of common stock | ||||||||
High Price | Low Price | |||||||
Year ended December 31, 2017 | ||||||||
1st Quarter | $ | 24.75 | $ | 12.26 | ||||
2nd Quarter | $ | 15.59 | $ | 11.80 | ||||
3rd Quarter | $ | 19.26 | $ | 13.34 | ||||
4th Quarter | $ | 18.24 | $ | 13.00 | ||||
Year ended December 31, 2016 | ||||||||
1st Quarter | $ | 12.80 | $ | 8.06 | ||||
2nd Quarter | $ | 13.10 | $ | 10.60 | ||||
3rd Quarter | $ | 20.97 | $ | 10.84 | ||||
4th Quarter | $ | 25.36 | $ | 19.20 | ||||
Year ended December 31, 2015 | ||||||||
2nd Quarter | $ | 16.25 | $ | 15.05 | ||||
3rd Quarter | $ | 15.75 | $ | 8.59 | ||||
4th Quarter | $ | 11.00 | $ | 8.04 | ||||
Horizon does not intend to declare and pay any dividends on its common stock for the foreseeable future. The Company currently intends to invest its future earnings, if any, to fund its growth, to develop its business, for working capital needs and for general corporate purposes. Any payment of dividends will be at the discretion of Horizon’s board of directors and will depend upon various factors then existing, including earnings, financial condition, results of operations, capital requirements, level of indebtedness, contractual restrictions with respect to payment of dividends, restrictions imposed by applicable law, general business conditions and other factors that Horizon’s board of directors may deem relevant.
Performance Graph
The following graph provides a comparison of the cumulative shareholder return on the Company’s common stock to the returns of the Russell 2000 Index and the average performance of the Company’s selected peer group(1) based on total shareholder return from July 1, 2015 (the first day our common stock began regular-way trading on the NYSE) through December 31, 2017. We have assumed that dividends have been reinvested and returns have been weighted-averaged based on market capitalization. The graph assumes that $100 was invested on July 1, 2015 in each of Horizon’s common stock, the stocks comprising the Russell 2000 Index and the stocks comprising the peer group.
23
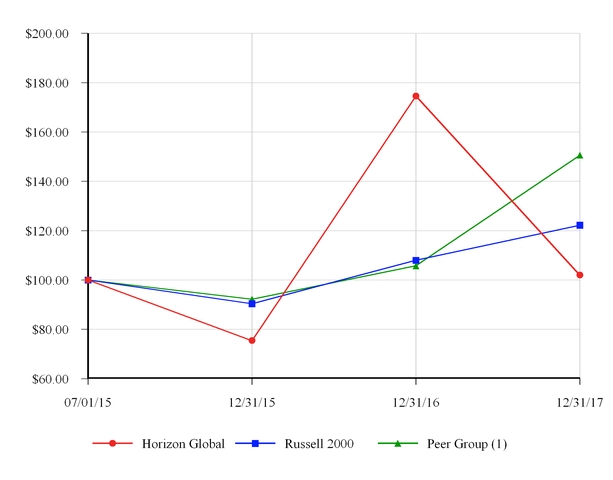
______________
(1) Includes Ametek Inc., Dorman Products Inc., Douglas Dynamics, Inc., LCI Industries, Federal Signal Corporation, Fox Factory Holding Corp., Gentex Corporation, Gentherm Incorporated, Manitex International Inc., Motorcar Parts of America, Inc., Shiloh Industries, Inc., Spartan Motors, Inc., Standard Motor Products, Inc., Stoneridge, Inc., Strattec Security Corporation, Superior Industries International, Inc., Wabash National Corporation and WABCO Holdings Inc.
Issuer Purchases of Equity Securities
The Company’s purchases of its shares of common stock during the fourth quarter of 2017 were as follows:
Period | Total Number of Shares Purchased | Average Price Paid per Share | Total Number of Shares Purchased as Part of Publicly Announced Plans or Programs | Maximum Number of Shares that May Yet be Purchased Under the Plans or Programs (a) | |||||||
October 1 - 31, 2017 | — | — | 813,494 | ||||||||
November 1 - 30, 2017 | — | — | 813,494 | ||||||||
December 1 - 31, 2017 | — | — | 813,494 | ||||||||
Total | — | — | |||||||||
__________________________
(a) The Company has a share repurchase program that was announced in May 2017 to purchase up to 1.5 million shares of the Company’s common stock. At the end of the fourth quarter of 2017, 813,494 shares of common stock remains to be purchased under this program. The share repurchase program expires on May 5, 2020.
24
Item 6. Selected Financial Data
The consolidated financial statements for periods prior to the spin-off include the historical results of operations, assets and liabilities of the legal entities that are considered to comprise Horizon. Our historical results of operations, financial position, and cash flows presented in the consolidated financial statements for periods prior to the separation may not be indicative of what they would have been had we actually been a separate stand-alone public entity during such periods, nor are they necessarily indicative of our future results of operations, financial position and cash flows.
The following data should be read in conjunction with Item 7, “Management’s Discussion and Analysis of Financial Condition and Results of Operations,” and our audited financial statements included in Item 8, “Financial Statements and Supplementary Data,” within this Annual Report on Form 10-K.
Year ended December 31, | ||||||||||||||||||||
2017(a) | 2016(a) | 2015 | 2014 | 2013 | ||||||||||||||||
(dollars in thousands, except per share data) | ||||||||||||||||||||
Statement of Income Data: | ||||||||||||||||||||
Net sales | $ | 892,980 | $ | 649,200 | $ | 575,510 | $ | 611,780 | $ | 588,270 | ||||||||||
Gross profit | 207,600 | 160,350 | 143,040 | 148,090 | 125,010 | |||||||||||||||
Operating profit | 34,760 | 6,300 | 19,570 | 24,460 | 5,670 | |||||||||||||||
Net income (loss) | (4,770 | ) | (12,660 | ) | 8,300 | 15,350 | 9,780 | |||||||||||||
Net (loss) attributable to noncontrolling interest | (1,220 | ) | (300 | ) | — | — | — | |||||||||||||
Net income (loss) attributable to Horizon Global | (3,550 | ) | (12,360 | ) | 8,300 | 15,350 | 9,780 | |||||||||||||
Net income (loss) per share attributable to Horizon Global: | ||||||||||||||||||||
Basic | $ | (0.14 | ) | $ | (0.66 | ) | $ | 0.46 | $ | 0.85 | $ | 0.54 | ||||||||
Diluted | $ | (0.14 | ) | $ | (0.66 | ) | $ | 0.46 | $ | 0.85 | $ | 0.54 | ||||||||
Weighted average common shares outstanding: | ||||||||||||||||||||
Basic | 24,781,349 | 18,775,500 | 18,064,491 | 18,062,027 | 18,062,027 | |||||||||||||||
Diluted | 24,781,349 | 18,775,500 | 18,160,852 | 18,113,416 | 18,098,645 | |||||||||||||||
(a) 2017 and 2016 results include the impact of the Westfalia Group acquisition. Refer to Note 4, “Acquisitions”, in Item 8, “Financial Statements and Supplementary Data,” included within this Annual Report on Form 10-K for additional information.
As of December 31, | ||||||||||||||||||||
2017 | 2016 | 2015 | 2014 | 2013 | ||||||||||||||||
(dollars in thousands) | ||||||||||||||||||||
Balance Sheet Data: | ||||||||||||||||||||
Total assets | $ | 661,030 | $ | 613,370 | $ | 331,580 | $ | 339,500 | $ | 360,680 | ||||||||||
Current maturities, long-term debt | 16,710 | 22,900 | 10,130 | 460 | 1,300 | |||||||||||||||
Long-term debt | 258,880 | 327,040 | 178,610 | 300 | 670 | |||||||||||||||
25
Item 7. Management’s Discussion and Analysis of Financial Condition and Results of Operations
The following discussion and analysis of our financial condition contains forward-looking statements regarding industry outlook and our expectations regarding the performance of our business. These forward-looking statements are subject to numerous risks and uncertainties, including, but not limited to, the risks and uncertainties described under the heading “Forward-Looking Statements,” at the beginning of this Annual Report on Form 10-K. Our actual results may differ materially from those contained in or implied by any forward-looking statements.
The financial information discussed below and included in this Annual Report on Form 10-K for periods prior to the separation may not necessarily reflect what Horizon’s financial condition, results of operations or cash flows would have been had Horizon been a stand-alone public entity during this period or what Horizon’s financial condition, results of operations and cash flows may be in the future. You should read the following discussion together with Item 8, “Financial Statements and Supplementary Data” within this Annual Report on Form 10-K.
Overview
We are a leading designer, manufacturer and distributor of a wide variety of high-quality, custom-engineered towing, trailering, cargo management and other related accessory products on a global basis, serving the automotive aftermarket, retail and OE channels.
Critical factors affecting our ability to succeed include: our ability to realize the expected economic benefits of structural realignment of manufacturing facilities and business units; our ability to quickly and cost-effectively introduce new products; our ability to acquire and integrate companies or products that supplement existing product lines, add new distribution channels and expand our geographic coverage; our ability to manage our cost structure more efficiently via supply base management, internal sourcing and/or purchasing of materials, selective outsourcing and/or purchasing of support functions, working capital management, and leverage of our administrative functions. If we are unable to do any of the foregoing successfully, our financial condition and results of operations could be materially and adversely impacted.
We report shipping and handling expenses associated with our Horizon Americas reportable segment’s distribution network as an element of selling, general and administrative expenses in our consolidated statements of income (loss). As such, gross margins for the Horizon Americas reportable segment may not be comparable to those of our Horizon Europe‑Africa and Horizon Asia‑Pacific segments, which primarily rely on third-party distributors, for which all costs are included in cost of sales.
The acquisition of the Westfalia Group, a European leader in towing products, addressed a geographic gap in our global footprint by strengthening our presence in the European market. The Westfalia Group is included in the results of operations and consolidated financial statements beginning October 1, 2016. The pending acquisition of the Brink Group will further strengthen our global platform and enhance our product portfolio.
26
Segment Information and Supplemental Analysis
The following table summarizes financial information for our three reportable segments:
Year ended December 31, | |||||||||||||||||||||
2017 | As a Percentage of Net Sales | 2016 | As a Percentage of Net Sales | 2015 | As a Percentage of Net Sales | ||||||||||||||||
(dollars in thousands) | |||||||||||||||||||||
Net Sales | |||||||||||||||||||||
Horizon Americas | $ | 439,700 | 49.2 | % | $ | 443,240 | 68.3 | % | $ | 429,310 | 74.6 | % | |||||||||
Horizon Europe‑Africa | 325,970 | 36.5 | % | 104,080 | 16.0 | % | 50,930 | 8.8 | % | ||||||||||||
Horizon Asia‑Pacific | 127,310 | 14.3 | % | 101,880 | 15.7 | % | 95,270 | 16.6 | % | ||||||||||||
Total | $ | 892,980 | 100.0 | % | $ | 649,200 | 100.0 | % | $ | 575,510 | 100.0 | % | |||||||||
Gross Profit | |||||||||||||||||||||
Horizon Americas | $ | 127,990 | 29.1 | % | $ | 131,320 | 29.6 | % | $ | 116,290 | 27.1 | % | |||||||||
Horizon Europe‑Africa | 46,760 | 14.3 | % | 6,560 | 6.3 | % | 7,650 | 15.0 | % | ||||||||||||
Horizon Asia‑Pacific | 32,850 | 25.8 | % | 22,470 | 22.1 | % | 19,100 | 20.0 | % | ||||||||||||
Total | $ | 207,600 | 23.2 | % | $ | 160,350 | 24.7 | % | $ | 143,040 | 24.9 | % | |||||||||
Selling, General and Administrative Expense | |||||||||||||||||||||
Horizon Americas | $ | 83,680 | 19.0 | % | $ | 86,470 | 19.5 | % | $ | 84,190 | 19.6 | % | |||||||||
Horizon Europe‑Africa | 47,750 | 14.6 | % | 17,180 | 16.5 | % | 7,460 | 14.6 | % | ||||||||||||
Horizon Asia‑Pacific | 13,940 | 10.9 | % | 11,210 | 11.0 | % | 11,420 | 12.0 | % | ||||||||||||
Corporate | 26,250 | N/A | 30,290 | N/A | 18,280 | N/A | |||||||||||||||
Total | $ | 171,620 | 19.2 | % | $ | 145,150 | 22.4 | % | $ | 121,350 | 21.1 | % | |||||||||
Net Loss on Disposition of Property and Equipment | |||||||||||||||||||||
Horizon Americas | $ | (240 | ) | (0.1 | )% | $ | (230 | ) | (0.1 | )% | $ | (1,800 | ) | (0.4 | )% | ||||||
Horizon Europe‑Africa | (800 | ) | (0.2 | )% | (280 | ) | (0.3 | )% | (290 | ) | (0.6 | )% | |||||||||
Horizon Asia‑Pacific | (170 | ) | (0.1 | )% | (30 | ) | — | % | (30 | ) | — | % | |||||||||
Corporate | (10 | ) | N/A | — | N/A | — | N/A | ||||||||||||||
Total | $ | (1,220 | ) | (0.1 | )% | $ | (540 | ) | (0.1 | )% | $ | (2,120 | ) | (0.4 | )% | ||||||
Operating Profit (Loss) | |||||||||||||||||||||
Horizon Americas | $ | 44,060 | 10.0 | % | $ | 38,680 | 8.7 | % | $ | 30,300 | 7.1 | % | |||||||||
Horizon Europe‑Africa | (1,790 | ) | (0.5 | )% | (13,320 | ) | (12.8 | )% | (100 | ) | (0.2 | )% | |||||||||
Horizon Asia‑Pacific | 18,740 | 14.7 | % | 11,230 | 11.0 | % | 7,650 | 8.0 | % | ||||||||||||
Corporate | (26,250 | ) | N/A | (30,290 | ) | N/A | (18,280 | ) | N/A | ||||||||||||
Total | $ | 34,760 | 3.9 | % | $ | 6,300 | 1.0 | % | $ | 19,570 | 3.4 | % | |||||||||
Capital Expenditures | |||||||||||||||||||||
Horizon Americas | $ | 10,150 | 2.3 | % | $ | 5,550 | 1.3 | % | $ | 5,970 | 1.4 | % | |||||||||
Horizon Europe‑Africa | 13,190 | 4.0 | % | 4,670 | 4.5 | % | 690 | 1.4 | % | ||||||||||||
Horizon Asia‑Pacific | 2,440 | 1.9 | % | 3,310 | 3.2 | % | 1,360 | 1.4 | % | ||||||||||||
Corporate | 1,510 | N/A | 1,010 | N/A | 300 | N/A | |||||||||||||||
Total | $ | 27,290 | 3.1 | % | $ | 14,540 | 2.2 | % | $ | 8,320 | 1.4 | % | |||||||||
Depreciation and Amortization | |||||||||||||||||||||
Horizon Americas | $ | 10,660 | 2.4 | % | $ | 10,750 | 2.4 | % | $ | 10,750 | 2.5 | % | |||||||||
Horizon Europe‑Africa | 10,110 | 3.1 | % | 3,290 | 3.2 | % | 2,070 | 4.1 | % | ||||||||||||
Horizon Asia‑Pacific | 4,310 | 3.4 | % | 4,090 | 4.0 | % | 4,130 | 4.3 | % | ||||||||||||
Corporate | 260 | N/A | 90 | N/A | 130 | N/A | |||||||||||||||
Total | $ | 25,340 | 2.8 | % | $ | 18,220 | 2.8 | % | $ | 17,080 | 3.0 | % | |||||||||
27
Results of Operations
Year Ended December 31, 2017 Compared with Year Ended December 31, 2016
Overall, net sales increased approximately $243.8 million, or approximately 37.6%, to $893.0 million in 2017, as compared to $649.2 million in 2016. Net sales within our Horizon Europe‑Africa reportable segment increased $221.9 million primarily driven by our fourth quarter 2016 acquisition of the Westfalia Group. Net sales within our Horizon Asia‑Pacific reportable segment increased by $25.4 million due to a regional bolt-on acquisition and net sales to a new customer. Net sales within our Horizon Americas reportable segment decreased $3.5 million driven by decreases in the retail and aftermarket channels, which were partially offset by an increase within the automotive OE, e-commerce, and industrial channels.
Gross profit margin (gross profit as a percentage of net sales) approximated 23.2% and 24.7% in 2017 and 2016, respectively. The overall decline in gross profit margin is the result of a shift in concentration of net sales from our higher margin Horizon Americas reportable segment to our lower margin Horizon Europe‑Africa reportable segment. Further, gross profit margin declined in our Horizon Americas reportable segment as the negative impacts of unfavorable commodity prices more than offset the lower costs and cost savings realized in 2017 from the consolidation of our manufacturing facilities that occurred in 2016. Gross profit margin improved in our Horizon Asia‑Pacific reportable segment as a result of increased sales volumes and productivity initiatives. An increase in gross profit margin in our Horizon Europe‑Africa reportable segment is primarily due to the acquisition of the Westfalia Group.
Operating profit margin (operating profit as a percentage of net sales) approximated 3.9% and 1.0% in 2017 and 2016, respectively. Operating profit increased $28.5 million, or 451.7%, to $34.8 million in 2017 as compared to $6.3 million in 2016, as a result of an operating profit margin improvement across all of our reportable segments. Operating profit margin increased in our Horizon Europe‑Africa reportable segment driven by the Westfalia Group. Operating profit margin was positively impacted by $8.4 million of lower expenses compared to 2016 related to the impairment of intangible assets in our Horizon Americas and Horizon Europe-Africa reportable segments. Increased volumes and operational improvements in our Horizon Asia‑Pacific reportable segment also favorably impacted operating profit margin. Further contributing to the increase in operating profit margin was a decrease in corporate expenses primarily due to lower costs associated with the Westfalia Group acquisition.
Interest expense increased approximately $2.3 million, to $22.4 million in 2017, as compared to $20.1 million in 2016, primarily due to additional interest and non-cash amortization of debt discount and issuance costs related our Convertible Notes (as defined below) issued in early 2017.
Other expense, net remained relatively flat at $2.7 million in 2017 compared to $2.6 million in 2016.
The effective income tax rate for 2017 and 2016 was 195.8% and 22.8%, respectively. The 2017 Tax Cuts and Jobs Act (the “2017 Tax Act”) created an $11.9 million tax charge that was the main driver of change in effective tax rate. This amount largely reflects transition tax but also includes other provisions of the 2017 Tax Act applicable to the Company. Two other main factors influenced both the 2017 and 2016 effective tax rates. First, nondeductible transaction costs associated with foreign acquisitions resulted in additional tax expense of $1.6 million and $2.7 million during December 31, 2017 and 2016, respectively. Second, income tax benefits associated with the release of certain unrecognized tax positions were recognized in 2017 and 2016 for approximately $4.0 million and $1.3 million, respectively.
Net loss decreased approximately $7.9 million to a net loss of $4.8 million in 2017, from a net loss of $12.7 million in 2016. The improvement was primarily the result of a $28.5 million increase in operating profit, partially offset by a $2.3 million increase in interest expense, a $4.6 million loss on extinguishment of debt due to a prepayment made on our Term B Loan (as defined below), and by a $13.5 million increase in income tax expense.
See below for a discussion of operating results by reportable segment.
28
Horizon Americas. Net sales decreased approximately $3.5 million, or 0.8%, to $439.7 million in 2017, as compared to $443.2 million in 2016. Net sales in our retail channel decreased approximately $8.2 million primarily due to point of sale weakness and reductions in inventory levels at our mass merchant retail customers, as well as the sale of our Broom and Brush product line during the fourth quarter of 2017. Further contributing to a net sales shortfall in the channel were inventory management efforts by retailers, lost business with a home improvement customer, as well as delivery delays during the fourth quarter of 2017 as we transitioned to a new distribution facility. Net sales in our aftermarket channel decreased by approximately $5.2 million primarily due to challenges faced during the integration of our ERP system in early 2017, which were partially offset by increased sales with our warehouse distribution partners. Partially offsetting these decreases were increases in our automotive OE, e-commerce, and industrial channels. Net sales in our automotive OE channel increased approximately $4.0 million due to increased volumes on existing programs with major customers, partially offset by higher volumes in 2016 due to the launch of a new program with another major customer that did not reoccur. Net sales in our e-commerce channel increased by approximately $2.9 million as higher demand as we believe the way consumers do business appears to be evolving to online research and purchasing. Partially offsetting this increase was reduced sales to certain customers who did not maintain channel pricing discipline. Net sales in our industrial channel increased approximately $2.4 million as a result of increased demand from trailer manufacturers and increased production levels. The remainder of the change is due to favorable currency exchange as the Brazilian real strengthened in relation to the U.S. dollar.
Horizon Americas’ gross profit decreased approximately $3.3 million to $128.0 million, or 29.1% of net sales, in 2017, from approximately $131.3 million, or 29.6% of net sales, in 2016. Negatively impacting gross profit margin was approximately $6.0 million of unfavorable commodity prices and freight costs, in advance of pricing actions, and approximately $0.3 million of costs associated with upgrading the paintline in our Mexico manufacturing facility. Partially offsetting these decreases was approximately $3.3 million of lower costs due to the consolidation of our manufacturing facilities during 2016 that did not reoccur in 2017. The remainder of the change is a result of lower sales levels and unfavorable currency exchange.
Selling, general and administrative expenses decreased approximately $2.8 million to $83.7 million, or 19.0% of net sales, in 2017, as compared to $86.5 million, or 19.5% of net sales, in 2016. Approximately $3.4 million of the decrease is primarily due to lower incentive compensation as a result of lower segment performance and approximately $1.5 million of the decrease is due to lower legal costs as a result of an award settlement that was received in the fourth quarter of 2017. These decreases were partially offset by approximately $1.7 million of costs associated with a project to optimize our distribution footprint and unfavorable currency exchange.
Horizon Americas’ operating profit increased approximately $5.4 million to $44.1 million, or 10.0% of net sales, in 2017, from $38.7 million, or 8.7% of net sales, in 2016. Operating profit and operating profit margin increased primarily due to approximately $6.0 million of lower expense related to the impairment of intangible assets during 2016. Partially offsetting this decrease were unfavorable commodity prices, higher freight costs, and lower selling, general and administrative expenses.
Horizon Europe-Africa. Net sales increased approximately $221.9 million, or 213.2%, to $326.0 million in 2017, as compared to $104.1 million in 2016, primarily due to the Westfalia Group, acquired in the fourth quarter of 2016. The remainder of the change is primarily due to favorable currency exchange as the strengthening of the euro more than offset the weakening of the British pound in relation to the U.S. dollar.
Horizon Europe‑Africa’s gross profit increased approximately $40.2 million to $46.8 million, or 14.3% of net sales in 2017, from approximately $6.6 million, or 6.3% of net sales, in 2016, driven by the Westfalia Group acquisition. Gross profit margin was negatively impacted by $2.7 million due to restructuring costs and decreased productivity related to the closure of our manufacturing facility in the United Kingdom.
Horizon Europe‑Africa’s selling, general and administrative expenses increased approximately $30.6 million to $47.8 million, or 14.6% of net sales in 2017, as compared to $17.2 million, or 16.5% of net sales in 2016. Selling, general and administrative expenses increased by approximately $23.6 million attributable to the results of the Westfalia Group, which included approximately $6.4 million in incremental depreciation and amortization related to purchase accounting and $3.0 million of higher transaction-related expenditures, including professional fees and severance, compared to 2016. Further negatively impacting selling, general, and administrative expenses were increased costs associated with establishing a management structure in the region.
Horizon Europe‑Africa’s operating loss decreased approximately $11.5 million to an operating loss of $1.8 million, or 0.5% of net sales, in 2017, from an operating loss of $13.3 million, or 12.8% of net sales in 2016, primarily due to the inclusion of the Westfalia Group in results for the full year of 2017 compared to only the fourth quarter of 2016. Further, operating loss decreased due to approximately $2.4 million of lower expense related to the impairment of intangible assets during 2016. These decreases to operating loss were partially offset by increased costs associated with establishing a management structure in the region.
29
Horizon Asia-Pacific. Net sales increased approximately $25.4 million, or 25.0%, to $127.3 million in 2017, as compared to $101.9 million in 2016. A regional bolt-on acquisition, completed in the third quarter of 2017, contributed $10.8 million in net sales. The increase in net sales in our industrial channel of approximately $8.1 million is primarily due to a full year of sales from a new product launched in the fourth quarter of 2016 with a new customer. Net sales in our automotive OE channel, exclusive of this acquisition, increased $1.6 million due to increased volumes on existing programs in our businesses in Australia and Thailand. Net sales in our aftermarket channel increased $1.3 million as a result of strong demand within the region. The remainder of the increase is a result of favorable currency exchange as the Australian dollar, Thai baht, and New Zealand dollar strengthened in relation to the U.S. dollar.
Horizon Asia‑Pacific’s gross profit increased approximately $10.4 million to $32.9 million, or 25.8% of net sales in 2017, from approximately $22.5 million, or 22.1% of net sales, in 2016. The improvement in gross profit was driven by the increased sales volumes mentioned above. Gross profit margin was further positively impacted by the results of productivity initiatives in our Australian business and efficiencies realized in Thailand due to restructuring of operations completed in the second quarter of 2017.
Horizon Asia‑Pacific’s selling, general and administrative expenses increased approximately $2.7 million to $13.9 million, or 10.9% of net sales in 2017, as compared to $11.2 million, or 11.0% of net sales, in 2016. The increase in selling, general and administrative expenses is primarily due to increased people costs in support of growth initiatives and operational restructuring costs. Additionally, selling, general and administrative expenses was increased by acquisition-related costs of $1.2 million. Further negatively impacting selling, general and administrative expenses was $0.4 million in unfavorable currency exchange.
Horizon Asia‑Pacific’s operating profit increased approximately $7.5 million to $18.7 million, or 14.7% of net sales, in 2017, from $11.2 million, or 11.0% of net sales in 2016, primarily due to increased volumes and operational improvements across the region.
Corporate Expenses. Corporate expenses decreased approximately $4.0 million to $26.3 million in 2017, as compared to $30.3 million in 2016. Corporate expenses decreased approximately $6.5 million due to lower expenses related to the acquisition of Westfalia Group and $2.3 million as a result of lower incentive compensation. Partially offsetting these decreases was $1.9 million of expenses related to completed or announced acquisitions in 2017 and the remainder of the change was due to increased professional fees for various human resource, information technology, and compliance initiatives.
Year Ended December 31, 2016 Compared with Year Ended December 31, 2015
Overall, net sales increased approximately $73.7 million, or approximately 12.8%, to $649.2 million in 2016, as compared to $575.5 million in 2015. During the year ended December 31, 2016, net sales increased in all of our reportable segments. Net sales within our Horizon Europe‑Africa reportable segment increased $53.2 million driven by our fourth quarter 2016 acquisition of the Westfalia Group, which added net sales of $54.5 million to Horizon Europe-Africa’s results in 2016. Growth in Horizon Europe-Africa’s automotive OE channel in the legacy businesses in Germany and South Africa were more than offset by declines in legacy businesses elsewhere in Europe and unfavorable currency exchange. Net sales within our Horizon Americas reportable segment were up $13.9 million driven by increases in the automotive OE, e-commerce, and retail channels, which were partially offset by a decline within the aftermarket and industrial channels. Net sales within our Horizon Asia‑Pacific reportable segment increased by $6.6 million primarily due to increases in the automotive OE channel, which were partially offset by unfavorable currency exchange.
Gross profit margin approximated 24.7% and 24.9% in 2016 and 2015, respectively. The overall decrease in gross profit margin primarily relates to our Horizon Europe‑Africa reportable segment, which was negatively impacted by purchase accounting, as well as higher commodity prices, product input costs, and unfavorable currency exchange. The decreases in gross profit margin were partially offset by higher sales volumes in both of our Horizon Americas and Horizon Asia‑Pacific reportable segments. Additionally, margin improvement in our Horizon Americas’ reportable segment and cost savings and productivity initiatives in our Horizon Asia‑Pacific reportable segment partially offset the decline in the gross profit margin.
Operating profit margin approximated 1.0% and 3.4% in 2016 and 2015, respectively. Operating profit decreased $13.3 million, or 67.8%, to $6.3 million in 2016 as compared to $19.6 million in 2015, primarily as a result of the impact of purchase accounting and transaction related expenses within the Horizon Europe-Africa reportable segment. Operating profit margin was also negatively impacted by $6.8 million of incremental expenses related to the impairment of intangible assets and the disposal of property and equipment compared to 2015 in our Horizon Americas and Horizon Europe-Africa reportable segments. Partially offsetting these decreases were favorable product mix and lower input costs in our Horizon Americas reportable segment and cost and productivity initiatives in our Horizon Asia‑Pacific reportable segment.
30
Interest expense increased approximately $11.3 million, to $20.1 million in 2016, as compared to $8.8 million in 2015. As we became a public company, we incurred debt in the form of a Term B Loan and ABL Facility (as defined below). The increase in expense in 2016 is partially due to these instruments being outstanding for twelve months compared to only six months in 2015. We also incurred additional debt in the form of the Incremental Term B Loan that was extended to us in the fourth quarter of 2016 in connection with the acquisition of the Westfalia Group.
Other expense, net increased approximately $1.1 million to $2.6 million in 2016, from $3.7 million in 2015, primarily driven by lower foreign currency transaction losses as the U.S. dollar stabilized in relation to the foreign currencies in which we operate.
The effective income tax rate for 2016 was 22.8%, compared to (18.2)% for 2015. The higher effective tax rate for the year ended December 31, 2016 is primarily driven by incurring non-deductible transaction costs related to the Westfalia Group acquisition, which were partially offset by the recognition of income tax benefits associated with the release of certain unrecognized tax positions. The lower tax rate in 2015 was due to the recognition of a $3.3 million tax benefit due to the release of an unrecognized tax contingency due to the expiration of the statute of limitations, which was offset by $2.9 million of tax charges for spin-off related transaction costs. Additionally, the overall effective tax rate for 2015 was reduced by the recognition of benefits associated with losses in certain jurisdictions with higher statutory tax rates.
Net income decreased approximately $21.0 million to a net loss of $12.7 million in 2016, from net income of $8.3 million in 2015. The decrease was primarily the result of a $13.3 million decrease in operating profit, a $11.3 million increase in interest expense, partially offset by $1.1 million decrease in other expenses, net and by a $2.5 million increase in income tax benefit.
See below for a discussion of operating results by reportable segment.
Horizon Americas. Net sales increased approximately $13.9 million, or 3.2%, to $443.2 million in 2016, as compared to $429.3 million in 2015. Net sales in our automotive OE channel increased approximately $14.8 million, primarily driven by new programs and continued growth with global automotive manufacturers. E-commerce increased by approximately $7.6 million, due to increased consumer promotional activity and increased demand from automotive Internet retailers. Net sales in our retail channel increased approximately $0.8 million, driven by growth with our mass merchant and automotive retail customers in our towing, trailering, and broom and brush categories. These increases were partially offset by decreases within our aftermarket and industrial channels. Net sales in our aftermarket channel decreased approximately $4.6 million due to a consumer shift towards the e-commerce channel, lower sales to smaller regional warehouse distributor customers, and macroeconomic conditions in the Brazilian market, which more than offset sales increases to our national warehouse distributor customers. Net sales in our industrial channel decreased approximately $4.0 million, primarily due to lower demand from our OE and warehouse distributor customers servicing energy and agricultural end markets. The remainder of the change in net sales was primarily due to unfavorable currency exchange as the Brazilian real weakened in relation to the U.S. dollar.
Horizon Americas’ gross profit increased approximately $15.0 million to $131.3 million, or 29.6% of net sales, in 2016, from approximately $116.3 million, or 27.1% of net sales, in 2015, due to margin improvement and higher sales levels. Gross profit margin was positively impacted due to a favorable product sales mix within our automotive OE channel, as sales of our higher margin brake controllers and heavy duty towing products increased year-over-year. Further improving gross profit margin in 2016 were favorable commodity prices, lower labor input costs in our Mexican facilities as a result of a strengthened U.S. dollar in relation to the Mexican peso, and lower freight costs as we benefited from efforts to localize supply chain near our manufacturing facility.
Selling, general and administrative expenses increased approximately $2.3 million to $86.5 million, or 19.5% of net sales, in 2016, as compared to $84.2 million, or 19.6% of net sales, in 2015. Selling, general and administrative costs increased due to approximately $3.1 million in higher people costs primarily related to marketing and product design in support of growth initiatives within our e-commerce and retail channels, as well as $1.0 million in increased health insurance costs and $0.6 million related to the implementation of a new ERP system. These increases were partially offset by approximately $2.4 million of lower costs associated with combining our Cequent Consumer Products and Cequent Performance Products businesses.
Horizon Americas’ operating profit increased approximately $8.4 million to $38.7 million, or 8.7% of net sales, in 2016, from $30.3 million, or 7.1% of net sales, in 2015. Operating profit increased primarily due to favorable product sales mix and lower manufacturing input costs. These effects were partially offset by $4.4 million incremental expense related to the impairment of intangible assets and the disposal of property and equipment compared to 2015.
Horizon Europe‑Africa. Net sales increased approximately $53.2 million, or 104.4%, to $104.1 million in 2016, as compared to $50.9 million in 2015. Approximately $54.5 million of the increase is attributable to the Westfalia Group acquisition in the fourth quarter of 2016. Net sales increased approximately $4.5 million in our legacy Germany and South Africa businesses driven by increased volume on existing programs and new program awards with existing automotive OE customers. These increases were partially offset by a decrease of approximately $0.8 million in the United Kingdom as a result of a strategic decision to
31
discontinue a distribution partnership and a decrease of approximately $1.2 million in Finland due to weak economic conditions. Net sales were further negatively impacted by approximately $3.9 million of unfavorable currency exchange.
Horizon Europe‑Africa’s gross profit decreased approximately $1.1 million to $6.6 million, or 6.3% of net sales in 2016, from approximately $7.7 million, or 15.0% of net sales, in 2015. Gross profit was negatively impacted by approximately $0.6 million of unfavorable foreign currency exchange. Gross profit margin also decreased by $0.5 million in South Africa and the United Kingdom due to higher commodity prices and product input costs. Gross profit was marginally impacted by the Westfalia Group, as the net sales attributable to the Westfalia Group were offset by its cost of sales, which included approximately $6.7 million of amortization expense related to the fair value step-up of inventory as a result of purchase accounting.
Horizon Europe‑Africa’s selling, general and administrative expenses increased approximately $9.7 million to $17.2 million, or 16.5% of net sales in 2016, as compared to $7.5 million, or 14.6% of net sales in 2015. Selling, general and administrative expenses increased by approximately $9.6 million attributable to the results of the Westfalia Group, which included approximately $1.4 million in transaction-related expenditures including professional fees and severance. Increased costs associated with establishing a management structure in the region were partially offset by approximately $0.7 million of favorable foreign currency exchange.
Horizon Europe‑Africa’s operating loss increased approximately $13.2 million to $13.3 million, or 12.8% of net sales, in 2016, from an operation loss of $0.1 million, or 0.2% of net sales in 2015, primarily due to losses of approximately $9.6 million realized in the Westfalia Group resulting from the impacts of purchase accounting and transaction related expenditures. The operating loss was further increased by $2.3 million due to unfavorable foreign currency exchange. Impairment charges of approximately $2.4 million in 2016 more than offset the impacts of higher sales volumes in our legacy Germany and South Africa businesses as discussed above, as well as plant closure costs in Finland in 2015 that did not recur in 2016.
Horizon Asia‑Pacific. Net sales increased approximately $6.6 million, or 6.9%, to $101.9 million in 2016, as compared to $95.3 million in 2015. Net sales were negatively impacted by approximately $0.8 million of unfavorable currency exchange. Net sales increased approximately $6.3 million in Australia, driven by increased volume and new program awards with existing OE customers, which outpaced weaker demand in Western Australia due to declining macroeconomic conditions. The remainder of the net sales increase is due to new program awards with OE customers in our New Zealand and Thailand businesses which more than offset the loss of an existing OE contract in Thailand.
Horizon Asia‑Pacific’s gross profit increased approximately $3.4 million to $22.5 million, or 22.1% of net sales in 2016, from approximately $19.1 million, or 20.0% of net sales, in 2015. The improvement in gross profit year-over-year was driven by the higher sales volumes, cost savings and productivity initiatives in our Australia business. This improvement was partially offset by a large OEM recovery in Thailand during 2015 that did not reoccur in 2016.
Horizon Asia‑Pacific’s selling, general and administrative expenses decreased approximately $0.2 million to $11.2 million, or 11.0% of net sales in 2016, as compared to $11.4 million, or 12.0% of net sales in 2015. Selling, general and administrative expenses decreased by approximately $0.5 million due to lower costs associated with promotional activities compared to 2015, which was partially offset by an increase of $0.3 million in people costs primarily resulting from increased sales levels.
Horizon Asia‑Pacific’s operating profit increased approximately $3.6 million to $11.2 million, or 11.0% of net sales, in 2016, from $7.7 million, or 8.0% of net sales in 2015, primarily due to higher sales volumes and cost savings and productivity initiatives in our Australia business.
Corporate Expenses. Corporate expenses increased approximately $12.0 million to $30.3 million in 2016, as compared to $18.3 million in 2015. Corporate expenses increased approximately $9.4 million due to expenses related to the acquisition of Westfalia Group. The remaining increase is primarily related to the costs of operating as a standalone public company for a full year, versus only six months in 2015. For the first six months of 2015, the consolidated financial statements include expense allocations, related to the spin-off, for certain functions provided by our former parent; however, the allocations may not be comparable to the corporate expenses we incurred as a stand-alone company. Corporate expenses included in operating profit in the accompanying consolidated financial statements include amounts that were allocated to us on the basis of direct usage when identifiable, with the remainder allocated on the basis of revenue or headcount.
Liquidity and Capital Resources
Our capital and working capital requirements are funded through a combination of cash flows from operations, cash on hand and various borrowings and factoring arrangements described below, including our asset-based revolving credit facility (“ABL Facility”). We utilize intercompany loans and equity contributions to fund our worldwide operations. See Note 9, “Long-term Debt” included in Item 8, “Financial Statements and Supplementary Data,” within this Annual Report on Form 10-K. As of December 31, 2017 and 2016, there was $23.7 million and $20.2 million, respectively, of cash held at foreign subsidiaries. There may be country specific regulations which may restrict or result in increased costs in the repatriation of these funds.
32
Based on our current and anticipated levels of operations and the condition in our markets and industry, we believe that our cash on hand, cash flow from operations and availability under our ABL Facility will enable us to meet our working capital, capital expenditures, debt service and other funding requirements. However, our ability to fund our working capital needs, debt payments and other obligations, and to comply with financial covenants, including borrowing base limitations under our ABL Facility, depends on our future operating performance and cash flows and many factors outside of our control, including the costs of raw materials, the state of the automotive accessories market and financial and economic conditions and other factors. Any future acquisitions, joint ventures or other similar transactions will likely require additional capital and there can be no assurance that any such capital will be available to us on acceptable terms, if at all.
On February 1, 2017, the Company completed an underwritten public offering of 4.6 million shares of common stock, which included the exercise in full by the underwriters of their option to purchase 0.6 million shares of common stock, at a public offering price of $18.50 per share (the “Common Stock Offering”). Proceeds from the Common Stock Offering were approximately $79.9 million, net of underwriting discounts, commissions, and offering-related transaction costs.
Concurrently, the Company completed an underwritten public offering of $125.0 million aggregate principal amount of Convertible Notes. The Convertible Notes mature on July 1, 2022 unless earlier converted in accordance with the terms prior to such date, and bears interest at a rate of 2.75% per annum. We used net proceeds from the Convertible Notes offering, along with proceeds from the issuance of common stock, to prepay $177.0 million of the Term B Loan. Additionally, on March 31, 2017, we entered into the Third Amendment to the Term B Loan. This amendment allowed us to repay the existing Original Term B Loan and Incremental Term Loans and provided for the Replacement Term Loan, which reduced the required principal payments by $2.7 million per quarter and reduced the interest rate by 1.5% per annum. Refer to Note 9, “Long-term Debt” included in Item 8, “Financial Statements and Supplementary Data,” within this Annual Report on Form 10-K for additional information.
Cash Flows - Operating Activities
Cash provided by operating activities in 2017 was approximately $14.2 million, as compared to $35.4 million in 2016. In 2017, the Company generated $36.5 million in cash flows, based on the reported net loss of $4.8 million and after considering the effects of non-cash items related to gains and losses on dispositions of property and equipment, depreciation, amortization, stock compensation, loss on extinguishment of debt, amortization of inventory step-up recorded as part of purchase accounting, changes in deferred income taxes, amortization of original issuance discount and debt issuance costs, and other, net. In 2016, the Company generated $20.0 million based on the reported net loss of $12.7 million and after considering the effects of similar non-cash items.
Changes in operating assets and liabilities used approximately $22.3 million of cash in 2017 and generated approximately $15.4 million of cash in 2016. Increases in accounts receivable resulted in a net use of cash of $9.5 million in 2017, while decreases in accounts receivable resulted in a source of cash of $4.7 million in 2016. The increase in accounts receivable in 2017 was primarily driven by an increase in tax-related receivables. The decrease in accounts receivable in 2016 was due to improved collection efforts and timing of sales within the fourth quarter.
Changes in inventory resulted in a net use of cash of $17.7 million in 2017, as compared to a source of cash of $10.7 million in 2016. The increase in inventory in 2017 was primarily due to sales shortfall in our Americas reportable segment in the fourth quarter driven by a system stock take-out by our retail customers and delivery delays related to the transition to a new distribution center. The decrease in inventory in 2016 was primarily the result of improved inventory management, the reduction of safety stock held at December 31, 2015 to support the transition out of Juarez and El Paso facilities, and a manufacturing slow down near the end of the year in anticipation of a new ERP going live.
Changes in prepaid expenses and other assets resulted in a net source of cash of $1.4 million in 2017, as compared to a use of cash of approximately $6.3 million in 2016. The decrease in prepaid expenses and other assets in 2017 was primarily due to a change in the timing of payments as certain large contracts were renewed late in 2016. The increase in prepaid expenses and other assets in 2016 was due to the timing of payments and renewals of contracts.
Changes in accounts payable and accrued liabilities resulted in a net source of cash of $3.5 million in 2017, as compared to a net source of cash of approximately $6.3 million in 2016. The decrease in accounts payable and accrued liabilities in 2017 was primarily due to a reduction in certain compensation accruals related to bonuses as certain performance targets were not met during the year. The increase in accounts payable and accrued liabilities in 2016 was primarily related to the timing of payments made to suppliers, mix of vendors and related terms, as well as increases in certain compensation accruals primarily related to bonuses and severance payments.
33
Cash Flows - Investing Activities
Net cash used for investing activities in 2017 was approximately $40.7 million, as compared to $108.4 million in 2016. During 2017, we acquired Best Bars for total cash consideration paid of $19.8 million. In addition, we invested approximately $27.3 million in capital expenditures, as we have continued our investment in growth, capacity and productivity-related capital projects. Cash received from the disposition of assets was approximately $6.4 million in 2017 and included $4.3 million net cash received from the sale of our Broom and Brush product line. During 2016, we acquired businesses for total cash consideration paid of $94.4 million, net of cash acquired, the largest of which was the acquisition of the Westfalia Group. In addition, we invested approximately $14.5 million in capital expenditures. Cash received from the disposition of assets was approximately $0.5 million.
Cash Flows - Financing Activities
Net cash provided by financing activities was approximately $3.7 million and $100.5 million in 2017 and 2016, respectively. During 2017, we received proceeds of $121.1 million from the issuance of our Convertible Notes, net of issuance costs; $79.9 million from the issuance of common stock, net of offering costs; $20.9 million from the issuance of Warrants; and our net borrowing from our ABL Facility totaled $10.0 million. We used cash of approximately $189.8 million for repayments on our Term B Loan, $29.7 million for payments on Convertible Note Hedges, net of issuance costs, and approximately $10.0 million to repurchase shares as part of our Share Repurchase Program. During 2016, we entered into an amendment to the Original Term B Loan to finance, in part, the acquisition of the Westfalia Group and received proceeds, net of repayments and transaction costs, of $138.2 million. We used $39.0 million of the Incremental Loans to repay Westfalia Group debt that we assumed as part of the acquisition.
Factoring Arrangements
We have factoring arrangements with financial institutions to sell certain accounts receivable under non-recourse agreements. Total receivables sold under the factoring arrangements was approximately $257.5 million and $20.7 million for the years ended December 31, 2017 and December 31, 2016, respectively. We utilize factoring arrangements as part of our financing for working capital. The costs of participating in these arrangements are immaterial to our results. Refer to Note 3, “Summary of Significant Accounting Policies” in Item 8, “Financial Statements and Supplementary Data,” included within this Annual Report report on Form 10-K for additional information.
Our Debt and Other Commitments
We and certain of our subsidiaries are party to the ABL Facility, an asset-based revolving credit facility that provides for $99.0 million of funding on a revolving basis, subject to borrowing base availability. The ABL Facility matures in June 2020 and bears interest on outstanding balances at variable rates as outlined in the credit agreement. On June 30, 2015, we entered into a term loan agreement (the “Original Term B Loan”) under which we borrowed an aggregate amount of $200.0 million. On September 19, 2016, we entered into the First Amendment to the Original Term B Loan (the “Term Loan Amendment”) which provided for incremental commitments in an aggregate principal amount of $152.0 million (the “Incremental Term Loans”). On March 31, 2017, we entered into the Third Amendment to the Original Term B Loan (the “Replacement Term Loan”) which amended the Term B Loan to provide for a new term loan commitment. The proceeds from the Replacement Term Loan were used to repay in full the outstanding principal of the Term B Loan. As part of the amendment, the interest rate was reduced by 1.5% per annum and the quarterly principal payments required under the Original Term B Loan and the Term Loan Amendment of $4.6 million in total were reduced to an aggregate principal payment of $1.9 million. On and after the Replacement Term Loan Amendment effective date, each reference to “Term B Loan” is deemed to be a reference to the Replacement Term Loan. The Term B Loan matures in June 2021 and bears interest at variable rates in accordance with the credit agreement. Refer to Note 9, “Long-term Debt,” in Item 8, “Financial Statements and Supplementary Data,” included within this Annual Report report on Form 10-K for additional information.
On February 1, 2017, the Company completed a public offering of 2.75% Convertible Senior Notes due 2022 (the “Convertible Notes”) in an aggregate principal amount of $125.0 million. Interest is payable on January 1 and July 1 of each year, beginning on July 1, 2017.
At December 31, 2017 there was $10.0 million outstanding on the ABL Facility and $149.6 million outstanding on the Term B Loan bearing interest at 6.07%.
On February 16, 2018, we entered into the Fourth Amendment to the Term B Loan (the “2018 Replacement Term Loan Amendment”) to further amend the Original Term B Loan. The 2018 Replacement Term Loan Amendment provides for a new term loan commitment (the “2018 Replacement Term Loan”) in an original aggregate principal amount of $385.0 million. The proceeds from the 2018 Replacement Term Loan will be used to (i) repay in full the outstanding principal amount of the Term B Loan, (ii) to consummate the acquisition of the Brink Group and pay a portion of the acquisition consideration thereof and the fees and expenses incurred in connection therewith, and (iii) for general corporate purposes. Refer to Note 18, “Subsequent Events,” in
34
Item 8, “Financial Statements and Supplementary Data,” included within this Annual Report report on Form 10-K for additional information.
The agreements governing the ABL Facility and Term B Loan contain various negative and affirmative covenants and other requirements affecting us and our subsidiaries, including restrictions on incurrence of debt, liens, mergers, investments, loans, advances, guarantee obligations, acquisitions, asset dispositions, sale-leaseback transactions, hedging agreements, dividends and other restricted payments, transactions with affiliates, restrictive agreements and amendments to charters, bylaws, and other material documents. The ABL Facility does not include any financial maintenance covenants other than a springing minimum fixed charge coverage ratio of at least 1.00 to 1.00 on a trailing twelve-month basis, which will be tested only upon the occurrence of an event of default or certain other conditions as specified in the agreement. The Term B Loan contains customary negative covenants, and also contains a financial maintenance covenant which requires us to maintain a net leverage ratio not exceeding 5.00 to 1.00 through the fiscal quarter ending March 31, 2018; 4.75 to 1.00 through the fiscal quarter ending September 30, 2018; and thereafter, 4.50 to 1.00. At December 31, 2017, we were in compliance with our financial covenants contained in the ABL Facility and the Term B Loan, respectively.
On July 3, 2017, our Australian subsidiary entered into an new agreement to provide for revolving borrowings up to an aggregate amount of $32.0 million. The agreement includes two sub-facilities: (i) Facility A has a borrowing capacity of $20.3 million, matures on July 3, 2020, and is subject to interest at Bank Bill Swap rate plus a margin determined based on the most recent net leverage ratio; (ii) Facility B has a borrowing capacity of $11.7 million, matures on July 3, 2018 and is subject to interest at Bank Bill Swap rate plus 0.9% per annum. Borrowings under this arrangement are subject to financial and reporting covenants. Financial covenants include maintaining a net leverage ratio not exceeding 2.50 to 1.00 during the period commencing on the date of the agreement and ending on the first anniversary of the date of the agreement; and 2.00 to 1.00 thereafter; working capital coverage ratio (working capital over total debt) greater than 1.75 to 1.00 and a gearing ration (senior debt to senior debt plus equity) not exceeding 50%. As of December 31, 2017, we were in compliance with all covenants.
We are subject to variable interest rates on our Term B Loan and ABL Facility. At December 31, 2017, 1-Month LIBOR and 3-Month LIBOR approximated 1.56% and 1.69%, respectively.
In addition to our long-term debt, we have other cash commitments related to leases. We account for these lease transactions as operating leases and annual rent expense related thereto approximated $20.0 million for the year ended December 31, 2017. We expect to continue to utilize leasing as a financing strategy in the future to meet capital expenditure needs and to reduce debt levels.
35
The following is a reconciliation of net income, as reported, which is a U.S. GAAP measure of our operating results, to Consolidated Bank EBITDA, as defined in our credit agreement, for the year ended December 31, 2017. We present Consolidated Bank EBITDA to show our performance under our financial covenants.
Year ended December 31, 2017 | ||||
(dollars in thousands) | ||||
Net loss attributable to Horizon Global | $ | (3,550 | ) | |
Bank stipulated adjustments: | ||||
Interest expense, net (as defined) | 22,410 | |||
Income tax expense | 9,750 | |||
Depreciation and amortization | 25,340 | |||
Extraordinary charges | 2,520 | |||
Non-cash compensation expense (a) | 3,630 | |||
Other non-cash expenses or losses | 2,180 | |||
Pro forma EBITDA of permitted acquisition | 840 | |||
Interest-equivalent costs associated with any Specified Vendor Receivables Financing | 1,490 | |||
Debt extinguishment costs | 4,640 | |||
Items limited to 25% of consolidated EBITDA: | ||||
Non-recurring expense or costs (b) | 2,440 | |||
Acquisition integration costs (c) | 11,210 | |||
Synergies related to permitted acquisition (d) | 1,480 | |||
EBITDA limitation for non-recurring expenses or costs (e) | — | |||
Consolidated Bank EBITDA, as defined | $ | 84,380 | ||
December 31, 2017 | ||||
(dollars in thousands) | ||||
Total Consolidated Indebtedness | $ | 268,170 | ||
Consolidated Bank EBITDA, as defined | 84,380 | |||
Actual leverage ratio | 3.18 | x | ||
Covenant requirement | 5.00 | x | ||
______________
(a) Non-cash compensation expenses resulting from the grant of restricted units of common stock and common stock options.
(b) Under our credit agreement, costs and expenses related to cost savings projects, including restructuring and severance expenses, are not to exceed $5 million in any fiscal year and $20 million in aggregate, commencing on or after January 1, 2015.
(c)Under our credit agreement, costs and expenses related to the integration of the Westfalia Group acquisition are not to exceed $10 million in any fiscal year and $30 million in aggregate, or other permitted acquisitions are not to exceed $7.5 million in any fiscal year and $20 million in aggregate.
(d)Under our credit agreement, the add back for the amount of reasonably identifiable and factually supportable “run rate” cost savings, operating expense reductions, and other synergies cannot exceed $12.5 million for the Westfalia Group acquisition.
(e) The amounts added to Consolidated Net Income pursuant to items in notes b-d shall not exceed 25% of Consolidated EBITDA, excluding these items, for such period.
Refer to Note 9, “Long-term Debt,” in Item 8, “Financial Statements and Supplementary Data,” included within this Annual Report on Form 10-K for additional information.
Contractual Obligations
Under various agreements, we are obligated to make future cash payments in fixed amounts. These include payments under our long-term debt agreements, rent payments required under operating and capital lease agreements and interest obligations on our term loans and convertible debt.
36
The following table summarizes our contractual obligations over various future periods related to these items as of December 31, 2017.
Payments Due by Periods | ||||||||||||||||||||
Total | Less than One Year | 1 - 3 Years | 3 - 5 Years | More than 5 Years | ||||||||||||||||
(dollars in thousands) | ||||||||||||||||||||
Contractual cash obligations: | ||||||||||||||||||||
ABL Facility | $ | 10,000 | $ | — | $ | 10,000 | $ | — | $ | — | ||||||||||
Term B Loan | 149,610 | 7,770 | 15,540 | 126,300 | — | |||||||||||||||
Convertible Notes | 125,000 | — | — | 125,000 | — | |||||||||||||||
Bank facilities | 22,140 | 7,660 | 1,530 | 180 | 12,770 | |||||||||||||||
Operating and capital lease obligations | 90,880 | 19,390 | 31,620 | 22,470 | 17,400 | |||||||||||||||
Interest obligations | 42,760 | 11,700 | 27,590 | 3,470 | — | |||||||||||||||
Deferred purchase price | 5,690 | 2,080 | 3,610 | — | — | |||||||||||||||
Total contractual obligations | $ | 446,080 | $ | 48,600 | $ | 89,890 | $ | 277,420 | $ | 30,170 | ||||||||||
The liability related to unrecognized tax benefits has been excluded from the contractual obligations table because a reasonable estimate of the timing and amount of cash flows from future tax settlements cannot be determined. For additional information, refer to Note 16, “Income Taxes,” included in Item 8, “Financial Statements and Supplementary Data,” within this Annual Report on Form 10-K.
Credit Rating
We and certain of our outstanding debt obligations are rated by Standard & Poor’s and Moody’s. On January 26, 2018, Moody’s awarded a rating of B2 for our prospective $380 million ($150 million at time of rating, prior to refinancing) senior secured term loan to be issued early in 2018. Moody’s also maintained our corporate family rating of B2 and confirmed our outlook as stable. On January 25, 2018, Standard & Poor’s issued a rating of B for our prospective $380 million ($150 million at the time of the rating, prior to refinancing) senior secured term loan and assigned the Company a negative outlook. Standard & Poor’s maintained our B corporate credit rating and the B- rating of our Convertible Notes. If our credit ratings were to decline, our ability to access certain financial markets may become limited, our cost of borrowings may increase, the perception of us in the view of our customers, suppliers and security holders may worsen and as a result, we may be adversely affected.
Outlook
Our global business remains susceptible to economic conditions that could adversely affect our results. In the near-term, the economies that most significantly affect our demand, including the United States, European Union, and Australia, are expected to continue to grow. The impact of tax reform in the U.S. should continue to drive growth in the near-term; however, the longer-term implications of tax reform on economic growth are not yet fully understood. We continue to monitor the trade policy discussions taking place in Washington, D.C. and the impact any changes could have on our operations. If geopolitical tensions, particularly in East Asia, escalate, it may affect global consumer sentiment affecting the expected economic growth in the near-term.
Our 2017 financial results did not meet our expectations, despite increasing operating profit by $28.5 million. In the fourth quarter of 2017, we experienced performance issues including: manufacturing inefficiencies in our Reynosa, Mexico manufacturing facility, as well as startup inefficiencies in both our new Kansas City distribution facility in the Americas segment and our Romanian manufacturing facility in the Europe-Africa segment. In response to these challenges, we have made organizational changes, enlisted the assistance of manufacturing consultants, and identified additional cost reduction projects, including the closure of two non-manufacturing facilities in our Americas segment. We are focused on executing our targeted action plan we have publicly communicated and we have already initiated many of the projects.
Shortly after the completion of the acquisition of Westfalia in the fourth quarter of 2016, we initiated projects to achieve significant cost reductions and efficiencies in our Europe-Africa segment. In 2017, we were pleased with the results of our efforts to reduce costs and increase efficiencies; however, the costs associated with executing these projects limited their impact on our 2017 results. We expect the positive momentum from these projects, as well as the execution of our targeted action plan, to result in improved margins in both the Americas and Europe-Africa segments in the long-term. In the short-term, the costs associated with executing these initiatives, including severance, unrecoverable lease obligations, and professional service fees, may affect our results and cash flows.
We believe the unique global footprint we enjoy in our market space will benefit us as our OE customers continue to demonstrate a preference for stronger relationships with few suppliers. We believe that our strong brand positions, portfolio of product offerings, and existing customer relationships present a long-term opportunity for us.
While a strong global economy offers opportunities for growth and cost leverage, we are committed to delivering on our internal projects to drive margin improvement. We believe our internal projects, if executed well, will have a positive impact on our margins in future periods.
Our strategic priorities are to improve margins, reduce our leverage, and drive top line growth.
Impact of New Accounting Standards
See Note 2, “New Accounting Pronouncements,” included in Item 8, “Financial Statements and Supplementary Data,” within this Annual Report on Form 10-K.
Critical Accounting Estimates
The following discussion of accounting policies is intended to supplement the accounting policies presented in Note 3, “Summary of Significant Accounting Policies” included in Item 8, “Financial Statements and Supplementary Data,” within this Annual Report on Form 10-K. Certain of our accounting policies require the application of significant judgment by management in selecting the appropriate assumptions for calculating financial estimates. By their nature, these judgments are subject to an inherent degree of uncertainty. These judgments are based on our historical experience, our evaluation of business and macroeconomic trends, and information from other outside sources, as appropriate.
Revenue Recognition. Revenue is recognized when there is evidence of a sale, delivery has occurred or services have been rendered, the sales price is fixed or determinable and the collectability of receivables is reasonably assured. Net sales is comprised of gross revenues less estimates of expected returns, trade discounts and customer allowances, which include incentives such as cooperative advertising agreements, volume discounts and other supply agreements in connection with various programs. Such deductions are recorded during the period the related revenue is recognized.
Sales Related Accruals. Net sales is comprised of gross revenues less estimates of expected returns, trade discounts and customer allowances, which include incentives for items such as cooperative advertising agreements, volume discounts and other supply agreements in connection with various customer programs. On at least a quarterly basis, we perform detailed reviews of our sales related accruals by evaluating specific customer contractual commitments, assessing current incentive programs and other relevant information in order to assess the adequacy of the reserve. Reductions to revenue and estimated accruals are recorded in the period in which revenue is recognized.
Allowance for Doubtful Accounts. We maintain an allowance for doubtful accounts to reflect management’s best estimate of probable credit losses inherent in our accounts receivable balances. Determination of the allowances requires management to exercise judgment about the timing, frequency and severity of credit losses that could materially affect the allowances for doubtful accounts and, therefore, net income. The level of the allowance is based on quantitative and qualitative factors including historical loss experience, delinquency trends, economic conditions and customer credit risk. We perform detailed reviews of our accounts receivable portfolio on at least a quarterly basis to assess the adequacy of the allowance. Over the past two years, the allowance for doubtful accounts has approximated 3.3% to 4.7% of gross accounts receivable. We do not believe that significant credit risk exists due to our diverse customer base.
Impairment of Long-Lived Assets and Definite-Lived Intangible Assets. We review, on at least a quarterly basis, the financial performance of each business unit for indicators of impairment. In reviewing for impairment indicators, we also consider events or changes in circumstances such as business prospects, customer retention, market trends, potential product obsolescence, competitive activities and other economic factors. An impairment loss is recognized when the carrying value of an asset group exceeds the future net undiscounted cash flows expected to be generated by that asset group. The impairment loss recognized is the amount by which the carrying value of the asset group exceeds its fair value.
Goodwill and Indefinite-Lived Intangibles. We assess goodwill and indefinite-lived intangible assets for impairment at the reporting unit level on an annual basis as of October 1, after the annual forecasting process is complete. More frequent evaluations may be required if we experience changes in our business climate or as a result of other triggering events that take place. If the carrying value exceeds fair value, the asset is considered impaired and is reduced to fair value.
In assessing goodwill for impairment, we may choose to initially evaluate qualitative factors to determine if it is more likely than not that the fair value of a reporting unit is less than its carrying amount. If the qualitative assessment is not conclusive, then the impairment analysis for goodwill is performed at the reporting unit level using a quantitative approach. The quantitative test is a comparison of the fair value of the reporting unit, determined using a combination of the income and market approaches, to its recorded amount. If the recorded amount exceeds the fair value, an impairment is recorded to reduce the carrying amount to fair
37
value, but will not exceed the amount of goodwill that is recorded. Indefinite-lived intangible assets are tested for impairment by comparing the fair value, as determined using the relief from royalty method, compared to the carrying amount of the intangible assets.
The process of evaluating goodwill and indefinite-lived intangibles for impairment is subjective and requires significant judgment at many points during the analysis. If we elect to perform an optional qualitative analysis, we consider many factors including, but not limited to, general economic conditions, industry and market conditions, financial performance and key business drivers, long-term operating plans, and potential changes to significant assumptions used in the most recent fair value analysis for either the reporting unit or respective intangible. When performing a quantitative goodwill or indefinite-lived intangibles impairment test, we generally determine fair value using an income-based approach, a market-based approach or a combination of both methods. The fair value determination consists primarily of using significant unobservable inputs (Level 3) under the fair value measurement standards. We believe the most critical assumptions and estimates in determining the estimated fair value of our reporting units or indefinite-lived intangibles include, but are not limited to, the amounts and timing of expected future cash flows which is largely dependent on expected EBITDA margins, the discount rate applied to those cash flows, terminal growth rates and royalty rates. The assumptions used in determining our expected future cash flows consider various factors such as historical operating trends and long-term operating strategies and initiatives. The discount rate used by each reporting unit is based on our assumption of a prudent investor’s required rate of return of assuming the risk of investing in a particular company in a specific country. The terminal growth rate reflects the sustainable operating income a reporting unit could generate in a perpetual state as a function of revenue growth, inflation and future margin expectations.
Goodwill impairment test
Goodwill allocated to our Horizon Europe‑Africa reporting unit was approximately $126.2 million as of December 31, 2017. In connection with our annual goodwill impairment test, we performed a quantitative assessment as of October 1, 2017, utilizing a combination of the income and market approaches, the results of which we weighted evenly. No impairment was indicated as the fair value of the reporting unit substantially exceeded its carrying value. In the fourth quarter of 2017, we experienced a significant decline in our market capitalization. Further, the reporting unit did not perform in-line with expectations during the fourth quarter, driven by a delayed closure and additional costs incurred relating to closing facilities in the United Kingdom and Sweden, delayed realization of price increases and inefficiencies transferring production to lower cost manufacturing sites. Because of the decline in market capitalization and fourth quarter results we identified an indicator of impairment in the fourth quarter. As a result, we performed an interim quantitative assessment as of December 31, 2017, utilizing a combination of the income and market approaches, which we weighted evenly. The results of the quantitative analysis performed indicated the fair value of the reporting unit exceeded the carrying value by approximately 1%. Key assumptions used in the analysis were a discount rate of 13.0%, EBITDA margin and the terminal growth rate of 2.5%. The primary driver in the reduction of the fair value of the reporting unit was a reduction of expected future cash flows. Since the acquisition in the Westfalia Group, we have invested, and intend to continue to invest, in cost savings and productivity initiatives that will drive strong future profitability. While these investments have resulted in lower than projected post-acquisition EBITDA for the reporting unit, we continue to believe these projects will result in significant future earnings. Future events and changing market conditions may, however, lead us to reevaluate the assumptions we have used to test for goodwill impairment, including key assumptions used in our expected EBITDA margins and cash flows, as well as other key assumptions with respect to matters out of our control, such as discount rates, currency exchange rates and market multiple comparables. Based on the results of the quantitative test, we performed sensitivity analysis around the key assumptions used in the analysis, the results of which were: a) a 100 basis point decline in EBITDA margin used to determine expected future cash flows would have resulted in an impairment of approximately $27.5 million, and b) a 50 basis point increase in the discount rate would have resulted in an impairment of approximately $13.5 million.
Goodwill allocated to our Horizon Americas and Horizon Asia‑Pacific reporting units was approximately $5.3 million and $6.8 million, respectively, as of December 31, 2017. We performed a qualitative assessment for goodwill impairment in the Horizon Americas and Horizon Asia‑Pacific reportable segments at October 1, 2017, which was updated as of December 31, 2017 based on the indicators noted above. For our Horizon Americas segment, we performed a quantitative analysis as of October 1, 2016, which resulted in no impairment as the fair value of the reporting unit substantially exceeded the carrying value. Goodwill in the Horizon Asia-Pacific was the result of an acquisition completed in the third quarter of 2017. Based on the results of the qualitative analysis performed we do not believe that it is more likely than not that the fair value of the reporting units is less that the carrying amounts; therefore, we determined a quantitative assessment is not required.
Indefinite-lived intangible asset impairment test
We conducted the annual indefinite-lived intangible asset impairment tests as of October 1, 2017, and as a result of the impairment indicators noted above we performed an interim assessment as of December 31, 2017. Based on the results of our analyses there were certain trade names where the estimated fair values only slightly exceeded the carrying values. Key assumptions used in the analysis were discount rates of 13% to 15.5% and royalty rates ranging from 0.5% to 3.0%. Based on the results of the quantitative test, we performed sensitivity analysis around the key assumptions used in the analysis, the results of which were: a) a 50 basis
38
point increase in the discount rate used during our testing would not have resulted in a material impairment to any of our trade names, and b) a 25 basis point decrease in the royalty rates used during our testing would have resulted in an impairment of approximately $4.7 million to our Westfalia trade name.
Subsequent impairment indicators
Subsequent to December 31, 2017, the Company’s market capitalization has declined, primarily due to a pre-release of our estimated 2017 results that fell short of our previously communicated guidance, which may be an indicator of impairment. As noted above, the revised expectations were included in our interim goodwill impairment assessment. The Company will continue to assess the impact of its market capitalization and any other indicators of potential impairment. It is possible that if the Company’s market capitalization decline is more than temporary, or if other indicators of impairment are identified, an interim impairment analysis may be necessary, which could result in an impairment of goodwill, indefinite-lived intangible assets and other long-lived assets in 2018.
Income Taxes. We compute income taxes using the asset and liability method, whereby deferred income taxes using current enacted tax rates are provided for the temporary differences between the financial reporting basis and the tax basis of assets and liabilities and for operating loss and tax credit carryforwards. We determine valuation allowances based on an assessment of positive and negative evidence on a jurisdiction-by-jurisdiction basis and record a valuation allowance to reduce deferred tax assets to the amount more likely than not to be realized. To make this assessment, we evaluated historical operating results, the existence of cumulative losses in the most recent fiscal years, expectations for future pretax operating income, the time period over which our temporary differences will reverse and the implementation of feasible and prudent tax planning strategies. Recognized income tax positions are measured at the largest amount that is greater than 50% likely of being realized. Changes in recognition or measurement are reflected in the period in which the change in judgment occurs. We record interest and penalties related to unrecognized tax benefits in income tax expense.
The 2017 Tax Act was signed into law on December 22, 2017. The 2017 Tax Act significantly revises the U.S. corporate income tax by, among other things, lowering the statutory corporate tax rate from 35% to 21%, eliminating certain deductions, imposing a mandatory one-time tax on accumulated earnings of foreign subsidiaries as of 2017, introducing new tax regimes, and changing how foreign earnings are subject to U.S. tax. In December 2017, the SEC staff issued Staff Accounting Bulletin No. 118, Income Tax Accounting Implications of the Tax Cuts and Jobs Act (“SAB 118”), which allows us to record provisional amounts during a measurement period not to extend beyond one year of the enactment date. Since the 2017 Tax Act was passed late in the fourth quarter of 2017, we have accounted for the 2017 Tax Act on a provisional basis as of December 31, 2017. Our accounting for certain income tax effects is incomplete, but we have determined reasonable estimates for those effects. Our reasonable estimates are included in our financial statements as of December 31, 2017. We expect to complete our accounting during the one-year measurement period from the enactment date.
Emerging Growth Company
The JOBS Act establishes a class of company called an “emerging growth company,” which generally is a company whose initial public offering was completed after December 8, 2011 and had total annual gross revenues of less than $1.07 billion during its most recently completed fiscal year. We currently qualify as an emerging growth company.
As an emerging growth company, we are eligible to take advantage of certain exemptions from various reporting requirements that are not available to public reporting companies that do not qualify for this classification, including without limitation the following:
▪ | An emerging growth company is exempt from any requirement that may be adopted by the Public Company Accounting Oversight Board regarding mandatory audit firm rotation or a supplement to the auditor’s report providing additional information about the audit and financial statements, commonly known as an “auditor discussion and analysis.” |
▪ | An emerging growth company is not required to hold a nonbinding advisory stockholder vote on executive compensation or any golden parachute payments not previously approved by stockholders. |
▪ | An emerging growth company is not required to comply with the requirement of auditor attestation of management’s assessment of internal control over financial reporting, which is required for other public reporting companies by Section 404 of the Sarbanes-Oxley Act. |
▪ | An emerging growth company is eligible for reduced disclosure obligations regarding executive compensation in its periodic and annual reports, including without limitation exemption from the requirement to provide a compensation discussion and analysis describing compensation practices and procedures. |
39
▪ | A company that is an emerging growth company is eligible for reduced financial statement disclosure in registration statements, which must include two years of audited financial statements rather than the three years of audited financial statements that are required for other public reporting companies. |
For as long as we continue to be an emerging growth company, we expect that we will take advantage of the reduced disclosure obligations available to us as a result of this classification. We will remain an emerging growth company until the earlier of (i) December 31, 2020, the last day of the fiscal year following the fifth anniversary of the date of the first sale of our common stock pursuant to an effective registration statement under the Securities Act; (ii) the last day of the fiscal year in which we have total annual gross revenues of $1.07 billion (subject to further adjustment for inflation) or more; (iii) the date on which we have issued more than $1 billion in nonconvertible debt during the previous three years; or (iv) the date on which we are deemed to be a large accelerated filer under applicable SEC rules. We expect that we will remain an emerging growth company for the foreseeable future, but cannot retain our emerging growth company status indefinitely and will no longer qualify as an emerging growth company on or before December 31, 2020.
Emerging growth companies may elect to take advantage of the extended transition period provided in Section 7(a)(2)(B) of the Securities Act for complying with new or revised accounting standards. This allows an emerging growth company to delay the adoption of certain accounting standards until those standards would otherwise apply to private companies. We have elected to “opt out” of such extended transition period, and, as a result, we will comply with new or revised accounting standards on the relevant dates on which adoption of such standards is required for companies that are not “emerging growth companies.” Section 107 of the JOBS Act provides that our decision to opt out of the extended transition period for complying with new or revised accounting standards is irrevocable.
Item 7A. Quantitative and Qualitative Disclosures About Market Risk
In the normal course of business, we are exposed to market risk associated with fluctuations in interest rates, commodity prices, insurable risks due to property damage, employee and liability claims, and other uncertainties in the financial and credit markets, which may impact demand for our products.
We conduct business in various locations throughout the world and are subject to market risk due to changes in the value of foreign currencies. The functional currencies of our foreign subsidiaries are primarily the local currency in the country of domicile. We manage these operating activities at the local level and revenues and costs are generally denominated in local currencies; however, results of operations and assets and liabilities reported in U.S. dollars will fluctuate with changes in exchange rates between such local currencies and the U.S. dollar. A 10% change in average exchange rates versus the U.S. Dollar would have resulted in an approximate $46.3 million and $21.4 million change to our net sales for the years ended December 31, 2017 and 2016, respectively.
We are exposed to market risk from changes in the interest rates on a significant portion of our outstanding debt. Outstanding balances under our Term B Loan, at the Company’s election, bear interest at variable rates based on a margin over defined LIBOR. Based on the amount outstanding on the Term B Loan as of December 31, 2017 and 2016, a hypothetical unfavorable change of 100 basis points in the LIBOR would result in an approximate $1.5 million and $2.6 million increase, respectively, to our annual interest expense.
We use derivative financial instruments to manage our currency risks. We are also subject to interest risk as it relates to long-term debt, for which we may prospectively employ derivative instruments such as interest rate swaps to mitigate the risk of variable interest rates. See Item 7, “Management’s Discussion and Analysis of Financial Condition and Results of Operations,” for details about our primary market risks, and the objectives and strategies used to manage these risks. Also see Note 9, “Long-term Debt,” and Note 10, “Derivative Instruments,” included in Item 8, “Financial Statements and Supplementary Data,” within this Annual Report on Form 10-K for additional information.
40
Item 8. Financial Statements and Supplementary Data
REPORT OF INDEPENDENT REGISTERED PUBLIC ACCOUNTING FIRM
To the shareholders and Board of Directors of
Horizon Global Corporation
Troy, MI
We have audited the accompanying consolidated balance sheets of Horizon Global Corporation and subsidiaries (the “Company”) as of December 31, 2017 and 2016, the related consolidated statements of income (loss), comprehensive income (loss), cash flows, and shareholders’ equity for each of the three years in the period ended December 31, 2017 and the related notes and the schedule listed in the Index at Item 15 (collectively referred to as the “financial statements”). In our opinion, the financial statements present fairly, in all material respects, the financial position of the Company as of December 31, 2017 and 2016, and the results of its operations and its cash flows for each of the three years in the period ended December 31, 2017, in conformity with accounting principles generally accepted in the United States of America.
Basis for Opinion
These financial statements are the responsibility of the Company's management. Our responsibility is to express an opinion on the Company's financial statements based on our audits. We are a public accounting firm registered with the Public Company Accounting Oversight Board (United States) (PCAOB) and are required to be independent with respect to the Company in accordance with the U.S. federal securities laws and the applicable rules and regulations of the Securities and Exchange Commission and the PCAOB.
We conducted our audits in accordance with the standards of the PCAOB. Those standards require that we plan and perform the audit to obtain reasonable assurance about whether the financial statements are free of material misstatement, whether due to error or fraud. The Company is not required to have, nor were we engaged to perform, an audit of its internal control over financial reporting. As part of our audits, we are required to obtain an understanding of internal control over financial reporting but not for the purpose of expressing an opinion on the effectiveness of the Company’s internal control over financial reporting. Accordingly, we express no such opinion.
Our audits included performing procedures to assess the risks of material misstatement of the financial statements, whether due to error or fraud, and performing procedures that respond to those risks. Such procedures included examining, on a test basis, evidence regarding the amounts and disclosures in the financial statements. Our audits also included evaluating the accounting principles used and significant estimates made by management, as well as evaluating the overall presentation of the financial statements. We believe that our audits provide a reasonable basis for our opinion.
Horizon Global Corporation spin-off to TriMas Corporation Shareholders
As discussed in Note 1 to the consolidated financial statements, prior to June 30, 2015, the accompanying consolidated financial statements have been prepared from the separate records maintained by TriMas Corporation and may not necessarily be indicative of the financial condition, or results of operations and cash flows that would have existed had the Company been operated as a stand-alone company during the period prior to June 30, 2015 presented. For the periods subsequent June 30, 2015, the consolidated financial statements are derived from the historical accounting records of Horizon Global Corporation on a stand-alone basis.
/s/ Deloitte & Touche LLP
Detroit, Michigan
March 1, 2018
We have served as the Company’s auditor since 2014
41
Horizon Global Corporation
Consolidated Balance Sheets
(Dollars in thousands)
December 31, | ||||||||
2017 | 2016 | |||||||
Assets | ||||||||
Current assets: | ||||||||
Cash and cash equivalents | $ | 29,570 | $ | 50,240 | ||||
Receivables, net | 91,770 | 77,570 | ||||||
Inventories | 171,500 | 146,020 | ||||||
Prepaid expenses and other current assets | 10,950 | 12,160 | ||||||
Total current assets | 303,790 | 285,990 | ||||||
Property and equipment, net | 113,020 | 93,760 | ||||||
Goodwill | 138,190 | 120,190 | ||||||
Other intangibles, net | 90,230 | 86,720 | ||||||
Deferred income taxes | 4,290 | 9,370 | ||||||
Other assets | 11,510 | 17,340 | ||||||
Total assets | $ | 661,030 | $ | 613,370 | ||||
Liabilities and Shareholders' Equity | ||||||||
Current liabilities: | ||||||||
Current maturities, long-term debt | $ | 16,710 | $ | 22,900 | ||||
Accounts payable | 138,730 | 111,450 | ||||||
Accrued liabilities | 53,070 | 63,780 | ||||||
Total current liabilities | 208,510 | 198,130 | ||||||
Long-term debt | 258,880 | 327,040 | ||||||
Deferred income taxes | 14,870 | 25,730 | ||||||
Other long-term liabilities | 38,370 | 30,410 | ||||||
Total liabilities | 520,630 | 581,310 | ||||||
Commitments and contingent liabilities | — | — | ||||||
Shareholders' equity: | ||||||||
Preferred stock $0.01 par: Authorized 100,000,000 shares; Issued and outstanding: None | — | — | ||||||
Common stock, $0.01 par: Authorized 400,000,000 shares; 25,625,571 shares issued and 24,939,065 outstanding at December 31, 2017, respectively, and 20,899,959 shares issued and outstanding at December 31, 2016 | 250 | 210 | ||||||
Paid-in capital | 159,490 | 54,800 | ||||||
Treasury stock, at cost: 686,506 shares at December 31, 2017 and no shares at December 31, 2016 | (10,000 | ) | — | |||||
Accumulated deficit | (17,860 | ) | (14,310 | ) | ||||
Accumulated other comprehensive income (loss) | 10,010 | (8,340 | ) | |||||
Total Horizon Global shareholders' equity | 141,890 | 32,360 | ||||||
Noncontrolling interest | (1,490 | ) | (300 | ) | ||||
Total shareholders' equity | 140,400 | 32,060 | ||||||
Total liabilities and shareholders' equity | $ | 661,030 | $ | 613,370 | ||||
The accompanying notes are an integral part of these financial statements.
42
Horizon Global Corporation
Consolidated Statements of Income (Loss)
(Dollars in thousands, except per share amounts)
Year ended December 31, | ||||||||||||
2017 | 2016 | 2015 | ||||||||||
Net sales | $ | 892,980 | $ | 649,200 | $ | 575,510 | ||||||
Cost of sales | (685,380 | ) | (488,850 | ) | (432,470 | ) | ||||||
Gross profit | 207,600 | 160,350 | 143,040 | |||||||||
Selling, general and administrative expenses | (171,620 | ) | (145,150 | ) | (121,350 | ) | ||||||
Net loss on dispositions of property and equipment | (1,220 | ) | (540 | ) | (2,120 | ) | ||||||
Impairment of intangible assets | — | (8,360 | ) | — | ||||||||
Operating profit | 34,760 | 6,300 | 19,570 | |||||||||
Other expense, net: | ||||||||||||
Interest expense | (22,410 | ) | (20,080 | ) | (8,810 | ) | ||||||
Loss on extinguishment of debt | (4,640 | ) | — | — | ||||||||
Other expense, net | (2,730 | ) | (2,610 | ) | (3,740 | ) | ||||||
Other expense, net | (29,780 | ) | (22,690 | ) | (12,550 | ) | ||||||
Income (loss) before income tax | 4,980 | (16,390 | ) | 7,020 | ||||||||
Income tax benefit (expense) | (9,750 | ) | 3,730 | 1,280 | ||||||||
Net income (loss) | (4,770 | ) | (12,660 | ) | 8,300 | |||||||
Less: Net loss attributable to noncontrolling interest | (1,220 | ) | (300 | ) | — | |||||||
Net income (loss) attributable to Horizon Global | $ | (3,550 | ) | $ | (12,360 | ) | $ | 8,300 | ||||
Net income (loss) per share attributable to Horizon Global: | ||||||||||||
Basic | $ | (0.14 | ) | $ | (0.66 | ) | $ | 0.46 | ||||
Diluted | $ | (0.14 | ) | $ | (0.66 | ) | $ | 0.46 | ||||
Weighted average common shares outstanding: | ||||||||||||
Basic | 24,781,349 | 18,775,500 | 18,064,491 | |||||||||
Diluted | 24,781,349 | 18,775,500 | 18,160,852 | |||||||||
The accompanying notes are an integral part of these financial statements.
43
Horizon Global Corporation
Consolidated Statements of Comprehensive Income (Loss)
(Dollars in thousands)
Year ended December 31, | ||||||||||||
2017 | 2016 | 2015 | ||||||||||
Net income (loss) | $ | (4,770 | ) | $ | (12,660 | ) | $ | 8,300 | ||||
Other comprehensive income (loss), net of tax: | ||||||||||||
Foreign currency translation | 17,840 | (10,590 | ) | (9,510 | ) | |||||||
Derivative instruments (Note 10) | 540 | (220 | ) | (640 | ) | |||||||
Total other comprehensive income (loss) | 18,380 | (10,810 | ) | (10,150 | ) | |||||||
Total comprehensive income (loss) | 13,610 | (23,470 | ) | (1,850 | ) | |||||||
Less: Comprehensive loss attributable to noncontrolling interest | (1,190 | ) | (300 | ) | — | |||||||
Comprehensive income (loss) attributable to Horizon Global | $ | 14,800 | $ | (23,170 | ) | $ | (1,850 | ) | ||||
The accompanying notes are an integral part of these financial statements.
44
Horizon Global Corporation
Consolidated Statements of Cash Flows
(Dollars in thousands)
Year ended December 31, | ||||||||||||
2017 | 2016 | 2015 | ||||||||||
Cash Flows from Operating Activities: | ||||||||||||
Net income (loss) | $ | (4,770 | ) | $ | (12,660 | ) | $ | 8,300 | ||||
Adjustments to reconcile net income (loss) to net cash provided by operating activities, net of acquisition impact: | ||||||||||||
Net loss on dispositions of property and equipment | 1,220 | 540 | 2,120 | |||||||||
Impairment of intangible assets | — | 8,360 | — | |||||||||
Depreciation | 14,930 | 10,260 | 9,740 | |||||||||
Amortization of intangible assets | 10,410 | 7,960 | 7,340 | |||||||||
Amortization of original issuance discount and debt issuance costs | 6,940 | 2,090 | 830 | |||||||||
Deferred income taxes | (100 | ) | (8,430 | ) | (4,920 | ) | ||||||
Non-cash compensation expense | 3,630 | 3,860 | 2,530 | |||||||||
Loss on extinguishment of debt | 4,640 | — | — | |||||||||
Amortization of purchase accounting inventory step-up | 420 | 6,680 | — | |||||||||
(Increase) decrease in receivables | (9,540 | ) | 4,740 | (5,460 | ) | |||||||
(Increase) decrease in inventories | (17,710 | ) | 10,650 | (30 | ) | |||||||
(Increase) decrease in prepaid expenses and other assets | 1,410 | (6,300 | ) | 140 | ||||||||
Increase in accounts payable and accrued liabilities | 3,540 | 6,300 | 5,870 | |||||||||
Other, net | (860 | ) | 1,360 | 450 | ||||||||
Net cash provided by operating activities | 14,160 | 35,410 | 26,910 | |||||||||
Cash Flows from Investing Activities: | ||||||||||||
Capital expenditures | (27,290 | ) | (14,540 | ) | (8,320 | ) | ||||||
Acquisition of businesses, net of cash acquired | (19,800 | ) | (94,370 | ) | — | |||||||
Net proceeds from disposition of product line, property and equipment | 6,350 | 470 | 1,510 | |||||||||
Net cash used for investing activities | (40,740 | ) | (108,440 | ) | (6,810 | ) | ||||||
Cash Flows from Financing Activities: | ||||||||||||
Proceeds from borrowing on credit facilities | 52,310 | 41,820 | 119,340 | |||||||||
Repayments of borrowings on credit facilities | (50,910 | ) | (40,200 | ) | (118,890 | ) | ||||||
Proceeds from Term B Loan, net of issuance costs | — | 148,180 | 192,820 | |||||||||
Repayments of borrowings on Term B Loan, including transaction fees | (189,760 | ) | (10,000 | ) | (5,000 | ) | ||||||
Proceeds from ABL Facility, net of issuance costs | 139,100 | 118,430 | 57,120 | |||||||||
Repayments of borrowings on ABL Facility | (129,100 | ) | (118,430 | ) | (59,430 | ) | ||||||
Repayments of Westfalia Group debt | — | (39,000 | ) | — | ||||||||
Repurchase of common stock | (10,000 | ) | — | — | ||||||||
Proceeds from sale of common stock in connection with the Company's equity offering, net of issuance costs | 79,920 | — | — | |||||||||
Proceeds from issuance of Convertible Notes, net of issuance costs | 121,130 | — | — | |||||||||
Proceeds from issuance of Warrants, net of issuance costs | 20,930 | — | — | |||||||||
Payments on Convertible Note Hedges, inclusive of issuance costs | (29,680 | ) | — | — | ||||||||
Cash dividend paid to former parent | — | — | (214,500 | ) | ||||||||
Net transfers from former parent | — | — | 27,630 | |||||||||
Other, net | (240 | ) | (300 | ) | — | |||||||
Net cash provided by (used for) financing activities | 3,700 | 100,500 | (910 | ) | ||||||||
Effect of exchange rate changes on cash | 2,210 | (750 | ) | (1,390 | ) | |||||||
Cash and Cash Equivalents: | ||||||||||||
Increase (decrease) for the year | (20,670 | ) | 26,720 | 17,800 | ||||||||
At beginning of year | 50,240 | 23,520 | 5,720 | |||||||||
At end of year | $ | 29,570 | $ | 50,240 | $ | 23,520 | ||||||
Supplemental disclosure of cash flow information: | ||||||||||||
Cash paid for interest | $ | 14,270 | $ | 17,330 | $ | 7,870 | ||||||
Non-cash investing/financing activities: | ||||||||||||
Non-cash equity issuance for acquisition of businesses | $ | — | $ | 49,960 | $ | — | ||||||
The accompanying notes are an integral part of these financial statements.
45
Horizon Global Corporation
Consolidated Statements of Shareholders’ Equity
(Dollars in thousands)
Common Stock | Paid-in Capital | Treasury Stock | Parent Company Investment | Accumulated Deficit | Accumulated Other Comprehensive Income (Loss) | Total Horizon Global Shareholders' Equity | Noncontrolling Interest | Total Shareholders' Equity | ||||||||||||||||||||||||||||
Balances at December 31, 2014 | $ | — | $ | — | $ | — | $ | 180,800 | $ | — | $ | 7,390 | $ | 188,190 | $ | — | $ | 188,190 | ||||||||||||||||||
Net income | — | — | — | 3,680 | 4,620 | — | 8,300 | — | 8,300 | |||||||||||||||||||||||||||
Other comprehensive loss, net of tax | — | — | — | — | — | (10,150 | ) | (10,150 | ) | — | (10,150 | ) | ||||||||||||||||||||||||
Issuance of common stock | 180 | — | — | (180 | ) | — | — | — | — | — | ||||||||||||||||||||||||||
Net transfers to former parent | — | — | — | 23,670 | — | 5,230 | 28,900 | — | 28,900 | |||||||||||||||||||||||||||
Cash dividend paid to former parent | — | — | — | (214,500 | ) | — | — | (214,500 | ) | — | (214,500 | ) | ||||||||||||||||||||||||
Non-cash compensation expense | — | 1,260 | — | — | — | — | 1,260 | — | 1,260 | |||||||||||||||||||||||||||
Reclassification of net parent investment to accumulated deficit | — | — | — | 6,530 | (6,530 | ) | — | — | — | — | ||||||||||||||||||||||||||
Balances at December 31, 2015 | $ | 180 | $ | 1,260 | $ | — | $ | — | $ | (1,910 | ) | $ | 2,470 | $ | 2,000 | $ | — | $ | 2,000 | |||||||||||||||||
Net loss | — | — | — | — | (12,360 | ) | — | (12,360 | ) | (300 | ) | (12,660 | ) | |||||||||||||||||||||||
Other comprehensive loss, net of tax | — | — | — | — | — | (10,810 | ) | (10,810 | ) | — | (10,810 | ) | ||||||||||||||||||||||||
Issuance of common stock | 30 | 49,930 | — | — | — | — | 49,960 | — | 49,960 | |||||||||||||||||||||||||||
Shares surrendered upon vesting of employees' share based payment awards to cover tax obligations | — | (330 | ) | — | — | — | — | (330 | ) | — | (330 | ) | ||||||||||||||||||||||||
Exercise of stock options | — | 40 | — | — | — | — | 40 | — | 40 | |||||||||||||||||||||||||||
Non-cash compensation expense | — | 3,860 | — | — | — | — | 3,860 | — | 3,860 | |||||||||||||||||||||||||||
Impact of adoption of new accounting guidance related to stock based compensation | — | 40 | — | — | (40 | ) | — | — | — | — | ||||||||||||||||||||||||||
Balances at December 31, 2016 | $ | 210 | $ | 54,800 | $ | — | $ | — | $ | (14,310 | ) | $ | (8,340 | ) | $ | 32,360 | $ | (300 | ) | $ | 32,060 | |||||||||||||||
Net loss | — | — | — | — | (3,550 | ) | — | (3,550 | ) | (1,220 | ) | (4,770 | ) | |||||||||||||||||||||||
Other comprehensive income, net of tax | — | — | — | — | — | 18,350 | 18,350 | 30 | 18,380 | |||||||||||||||||||||||||||
Issuance of common stock, net of issuance costs | 40 | 79,880 | — | — | — | — | 79,920 | — | 79,920 | |||||||||||||||||||||||||||
Repurchase of common stock | — | — | (10,000 | ) | — | — | — | (10,000 | ) | — | (10,000 | ) | ||||||||||||||||||||||||
Shares surrendered upon vesting of employees' share based payment awards to cover tax obligations | — | (260 | ) | — | — | — | — | (260 | ) | — | (260 | ) | ||||||||||||||||||||||||
Exercise of stock options | — | 50 | — | — | — | — | 50 | — | 50 | |||||||||||||||||||||||||||
Non-cash compensation expense | — | 3,630 | — | — | — | — | 3,630 | — | 3,630 | |||||||||||||||||||||||||||
Issuance of Warrants, net of issuance costs | — | 20,930 | — | — | — | — | 20,930 | — | 20,930 | |||||||||||||||||||||||||||
Initial equity component of the 2.75% Convertible Senior Notes due 2022, net of issuance costs and tax | — | 20,010 | — | — | — | — | 20,010 | — | 20,010 | |||||||||||||||||||||||||||
Convertible Note Hedges, net of issuance costs and tax | — | (19,550 | ) | — | — | — | — | (19,550 | ) | — | (19,550 | ) | ||||||||||||||||||||||||
Balances at December 31, 2017 | $ | 250 | $ | 159,490 | $ | (10,000 | ) | $ | — | $ | (17,860 | ) | $ | 10,010 | $ | 141,890 | $ | (1,490 | ) | $ | 140,400 | |||||||||||||||
The accompanying notes are an integral part of these financial statements.
46
HORIZON GLOBAL CORPORATION
NOTES TO CONSOLIDATED FINANCIAL STATEMENTS
1. Basis of Presentation
Horizon Global Corporation (“Horizon,” “Horizon Global” or the “Company”) is a global designer, manufacturer and distributor of a wide variety of high quality, custom-engineered towing, trailering, cargo management and other related accessories. These products are designed to support original equipment manufacturers and original equipment suppliers (collectively, “OEs”), aftermarket and retail customers within the agricultural, automotive, construction, horse/livestock, industrial, marine, military, recreational, trailer and utility markets. The Company groups its operating segments into reportable segments by the region in which sales and manufacturing efforts are focused. The Company’s reportable segments are Horizon Americas, Horizon Europe‑Africa, and Horizon Asia‑Pacific. See Note 15, “Segment Information,” for further information on each of the Company’s reportable segments.
On June 30, 2015, Horizon became an independent company as a result of the distribution by TriMas Corporation (“TriMas” or “former parent”) of 100 percent of the outstanding common shares of Horizon Global to TriMas shareholders (the “spin-off”). Each TriMas shareholder of record as of the close of business on June 25, 2015 (the “Record Date”) received two Horizon Global common shares for every five TriMas common shares held as of the Record Date. The spin-off was completed on June 30, 2015 and was structured to be tax-free to both TriMas and Horizon Global shareholders.
On July 1, 2015, Horizon Global common shares began regular trading on the New York Stock Exchange under the ticker symbol “HZN”. Pursuant to the separation and distribution agreement with TriMas, on June 30, 2015, the Company paid a cash dividend to TriMas of $214.5 million.
The accompanying consolidated financial statements for the period prior to the spin-off are derived from TriMas’ historical accounting records on a carve-out basis. For the periods subsequent to the spin-off, the consolidated financial statements are derived from the historical accounting records of Horizon on a stand-alone basis. As such, the consolidated statements of income (loss), consolidated statement of comprehensive income (loss) and consolidated statement of cash flows for the years ended December 31, 2017 and 2016 consist of the consolidated results of Horizon on a stand-alone basis. The consolidated financial statements for the year ended December 31, 2015 consist of the consolidated results of Horizon on a stand-alone basis for the six months ended December 31, 2015, and the consolidated results of operations of Horizon as historically managed under TriMas, on a carve-out basis, for the six months ended June 30, 2015.
For the period prior to the separation, the consolidated financial statements include expense allocations for certain functions provided by our former parent; however, the allocations may not reflect the expenses the Company would have incurred as an independent, publicly traded company for the period presented. These expenses were allocated to the Company on the basis of direct usage when identifiable, with the remainder allocated on the basis of revenue or headcount. Transactions historically treated as intercompany between the Company and our former parent have been included in these consolidated financial statements and were considered effectively settled for cash at the time of the spin-off.
2. New Accounting Pronouncements
In August 2017, the Financial Accounting Standards Board (“FASB”) issued Accounting Standards Update (“ASU”) 2017-12, “Derivatives and Hedging (Topic 815): Targeted Improvements to Accounting for Hedging Activities” (“ASU 2017-12”). ASU 2017-12 eliminates the requirement to separately measure and report hedge ineffectiveness and generally requires, for qualifying hedges, the entire change in the fair value of a hedging instrument to be presented in the same income statement line as the hedged item. The guidance also modifies the accounting for components excluded from the assessment of hedge effectiveness, eases documentation and assessment requirements and modifies certain disclosure requirements. ASU 2017-12 is effective for fiscal years beginning after December 15, 2018, including interim periods within those annual periods, with early adoption permitted and should be applied on a modified retrospective basis. The Company is in the process of assessing the impact of the adoption of ASU 2017-12 on its consolidated financial statements.
In May 2017, the FASB issued ASU 2017-09, “Compensation-Stock Compensation (Topic 718): Scope of Modification Accounting” (“ASU 2017-09”). ASU 2017-09 amends the scope of modification accounting for share-based payment arrangements and provides guidance on when an entity would be required to apply modification accounting. This guidance is effective for all entities for annual periods beginning after December 15, 2017, including interim periods within those annual periods, with early adoption permitted and should be applied on a prospective basis. The Company will adopt ASU 2017-09 on January, 1, 2018 on a prospective basis.
In January 2017, the FASB issued ASU 2017-04, “Intangibles - Goodwill and Other (Topic 350): Simplifying the Test for Goodwill Impairment” (“ASU 2017-04”). ASU 2017-04 eliminates the requirement to perform a hypothetical purchase price allocation to
47
measure the amount of goodwill impairment. Instead, under ASU 2017-04, the goodwill impairment would be the amount by which a reporting unit’s carrying value exceeds its fair value; however, the loss recognized should not exceed the total amount of goodwill allocated to the reporting unit. ASU 2017-04 is effective for fiscal years, and interim periods within those years, beginning after December 15, 2019 with early adoption permitted. The Company has early adopted ASU 2017-04 for its annual goodwill impairment test during the fourth quarter of 2017 and there was no impact on the consolidated financial statements.
In January 2017, the FASB issued ASU 2017-01, “Business Combinations (Topic 805): Clarifying the Definition of a Business” (“ASU 2017-01”). ASU 2017-01 provides clarification on the definition of a business and adds guidance to assist entities with evaluating whether transactions should be accounted for as acquisitions (or disposals) of assets or businesses. This guidance is effective for public entities for fiscal years beginning after December 15, 2017, including interim periods within those annual periods, and should be applied on a prospective basis. ASU 2017-01 is effective for the Company for any new acquisitions (or disposals) starting on January 1, 2018.
In October 2016, the FASB issued ASU 2016-16, “Income Taxes (Topic 740): Intra-Entity Transfers of Assets Other Than Inventory” (“ASU 2016-16”). ASU 2016-16 provides an amendment to the accounting guidance related to the recognition of income tax consequences of an intra-entity transfer of an asset other than inventory. Under the new guidance, an entity is required to recognize the income tax consequences of an intra-entity transfer of an asset other than inventory when the transfer occurs. Under the current guidance, the income tax effects are deferred until the asset has been sold to an outside party. The Company will adopt ASU 2016-16 on January 1, 2018, on a modified retrospective basis, which will not have a material impact on the financial statements.
In August 2016, the FASB issued ASU 2016-15, “Statement of Cash Flows (Topic 230): Classification of Certain Cash Receipts and Cash Payments (a consensus of the Emerging Issues Task Force)” (“ASU 2016-15”). ASU 2016-15 was issued to reduce differences in practice with respect to how specific transactions are classified in the statement of cash flows. This guidance is effective for public entities for fiscal years beginning after December 15, 2017, including interim periods within those annual periods, with early adoption permitted and should be applied on a retrospective basis. The Company will adopt ASU 2016-15 on January 1, 2018, which will not have a material impact on the financial statements.
In February 2016, the FASB issued ASU 2016-02, “Leases (Topic 842)”, which supersedes the leases requirements in “Leases (Topic 840)” (“ASU 2016-02”). The objective of this update is to establish the principles that lessees and lessors shall apply to report useful information to users of financial statements about the amount, timing, and uncertainty of cash flows arising from a lease. ASU 2016-02 is effective for fiscal years beginning after December 15, 2018, including interim periods within those annual periods, with early adoption permitted. The Company is in the process of assessing the impact of the adoption of ASU 2016-02 on its consolidated financial statements.
In July 2015, the FASB issued ASU 2015-11, “Inventory (Topic 330): Simplifying the Measurement of Inventory.” This guidance provides that inventory not measured using the last-in, first out (“LIFO”) or retail inventory methods should be measured at the lower of cost and net realizable value. Subsequent measurement is unchanged for inventory measured using LIFO or the retail inventory. As of January 1, 2017, the provisions of this ASU became effective for the Company on a prospective basis and did not have a material impact on the Company’s consolidated financial position or results of operations.
Accounting Standards Update 2014-09
In May 2014, the FASB issued ASU 2014-09, “Revenue from Contracts with Customers (Topic 606)” (“ASU 2014-09” or “Topic 606”). ASU 2014-09 supersedes most of the existing guidance on revenue recognition in Accounting Standard Codification (“ASC”) Topic 605, “Revenue Recognition” (“Topic 605”), and establishes a broad principle that would require an entity to recognize revenue to depict the transfer of promised goods or services to customers in an amount that reflects the consideration to which the entity expects to be entitled in exchange for those goods or services. To achieve this principle, an entity identifies the contract with a customer, identifies the separate performance obligations in the contract, determines the transaction price, allocates the transaction price to the separate performance obligations and recognizes revenue when each separate performance obligation is satisfied. The FASB has subsequently issued additional ASUs to clarify certain elements of Topic 606. This guidance is effective for Horizon Global beginning on January 1, 2018 and entities have the option of using either a full retrospective or a modified retrospective approach for the adoption of the new standard. The Company will adopt ASU 2014-09 using the modified retrospective approach whereby a cumulative-effect adjustment to the opening balance of retained earnings is recognized as of the date of adoption.
The Company has drafted its accounting policy for Topic 606 based on its evaluation of the five steps in the new revenue recognition model, which included a detailed review of its business and contracts active during and through the end of 2017. While the Company
48
continues to assess all potential impacts of the new standard, the Company does not expect that the adoption of the new revenue standard will have a material impact on the Company’s revenues, results of operations or financial position.
There are also certain considerations related to internal control over financial reporting that are associated with implementing the new guidance under Topic 606. The Company has evaluated its control framework for revenue recognition and is currently implementing necessary changes to its internal controls to address risks associated with the new standard. Disclosure requirements under the new guidance in Topic 606 have been significantly expanded in comparison to the disclosure requirements under the former guidance. The Company is currently concluding its assessment of the new disclosure requirements and is in process of drafting its disclosures under Topic 606 which will be finalized and incorporated in the Company’s Quarterly Report on Form 10-Q for the quarterly period ending March 31, 2018.
3. Summary of Significant Accounting Policies
Principles of Consolidation. The consolidated financial statements include the assets, liabilities, revenues and expenses of Horizon Global and its subsidiaries as of December 31, 2017 and 2016 and for the years ended December 31, 2017, 2016 and 2015. In addition, the consolidated financial statements include the consolidation of a variable interest entity (“VIE”) that the Company has deemed to be the primary beneficiary of. The consolidated financial statements include the assets and liabilities of the VIE at December 31, 2017 and 2016, and the revenues and expenses of the VIE for the period beginning October 1, 2016. Intercompany transactions have been eliminated.
Use of Estimates. The preparation of financial statements in conformity with accounting principles generally accepted in the United States of America requires management of the Company to make estimates and assumptions that affect the reported amounts of assets and liabilities and the disclosure of contingent assets and liabilities at the date of the financial statements. Such estimates and assumptions also affect the reported amounts of revenues and expenses during the reporting periods. Significant items subject to such estimates and assumptions include the carrying amount of property and equipment, goodwill and other intangibles, valuation allowances for receivables, inventories and deferred income tax assets, valuation of derivatives, estimated future unrecoverable lease costs, estimated unrecognized tax benefits, legal and product liability matters, assets and obligations related to employee benefits and allocated expenses, and the respective allocation methods. Actual results may differ from such estimates and assumptions.
Cash and Cash Equivalents. The Company considers cash on hand and on deposit and investments in all highly liquid debt instruments with initial maturities of three months or less to be cash and cash equivalents.
Account Receivables. Receivables are presented net of allowances for doubtful accounts of approximately $3.1 million and $3.8 million at December 31, 2017 and 2016, respectively. The Company monitors its exposure for credit losses and maintains allowances for doubtful accounts based upon the Company’s best estimate of probable losses inherent in the accounts receivable balances. The Company does not believe that significant credit risk exists due to its diverse customer base.
Account Receivables Factoring. The Company has factoring arrangements with financial institutions to sell certain accounts receivable under non-recourse agreements. Total receivables sold under the factoring arrangements were approximately $257.5 million and $20.7 million as of December 31, 2017 and 2016, respectively. The sales of accounts receivable in accordance with the factoring arrangements are reflected as a reduction of Receivables, net in the consolidated balance sheets as they meet the applicable criteria of ASC 860, “Transfers and Servicing.” The holdback amount due from the factoring institutions was approximately $3.1 million and $3.0 million as of December 31, 2017 and 2016, respectively, and is shown in Receivables, net in the consolidated balance sheets. Cash proceeds from these arrangements are included in the change in receivables under the operating activities section of the consolidated statements of cash flows. The Company pays factoring fees associated with the sale of receivables based on the dollar value of the receivables sold. Total factoring fees were $0.7 million and $0.1 million for the years ended December 31, 2017 and 2016. The Company had no factoring arrangements for the year ended December 31, 2015.
Inventories. Inventories are stated at lower of cost or net realizable value, with cost determined using the first-in, first-out method. Direct materials, direct labor and allocations of variable and fixed manufacturing-related overhead are included in inventory cost.
Property and Equipment. Property and equipment additions, including significant improvements, are recorded at cost. Upon retirement or disposal of property and equipment, the historical cost and accumulated depreciation are removed from the accounts, and any gain or loss is included in the accompanying consolidated statements of income (loss). Repair and maintenance costs are charged to expense as incurred.
49
Depreciation and Amortization. Depreciation is computed principally using the straight-line method over the estimated useful lives of the assets. Annual depreciation rates are as follows: building and land/building improvements 10 to 40 years, and machinery and equipment, three to 15 years. Customer relationship intangibles are amortized over periods ranging from five to 25 years, while technology and other intangibles are amortized over periods ranging from three to 15 years. Capitalized debt issuance costs are amortized over the underlying terms of the related debt.
Impairment of Long-Lived Assets and Definite-Lived Intangible Assets. The Company reviews, on at least a quarterly basis, the financial performance of each business unit for indicators of impairment. In reviewing for impairment indicators, the Company also considers events or changes in circumstances such as business prospects, customer retention, market trends, potential product obsolescence, competitive activities and other economic factors. An impairment loss is recognized when the carrying value of an asset group exceeds the future net undiscounted cash flows expected to be generated by that asset group. The impairment loss recognized is the amount by which the carrying value of the asset group exceeds its fair value.
Goodwill. Goodwill relating to a single business reporting unit is included as an asset of the applicable segment. Goodwill arising from major acquisitions that involve multiple reportable segments is allocated to the reporting units based on the relative fair value of the reporting unit. The Company determines its reporting units at the individual operating segment level, or one level below, when there is discrete financial information available that is regularly reviewed by segment management for evaluating operating results. For purposes of the Company’s 2017 goodwill impairment test, the Company had three reporting units within its three reportable segments, all of which had goodwill.
Goodwill is reviewed by the Company for impairment on a reporting unit basis annually on October 1st or more frequently if indicators are present or changes in circumstances suggest that impairment may exist. During 2017, the Company has elected to early adopt ASU 2017-04, which eliminates the second step of the two-step goodwill impairment test. The Company performs a qualitative assessment (Step Zero) of whether it is more likely than not that a reporting unit’s fair value is less than its carrying amount. If not, no further goodwill impairment testing is performed. If so, the Company performs testing for possible impairment in a one-step quantitative process. The fair value of a reporting unit is compared with its carrying value, including goodwill. If fair value exceeds the carrying value, goodwill is not considered to be impaired. If the fair value of a reporting unit is below the carrying value, then goodwill is considered to be impaired in the amount of the excess of a reporting unit’s carrying value over its fair value, not to exceed the total amount of goodwill allocated to the reporting unit.
The Company prepared a qualitative assessment of the carrying value of goodwill within its Horizon Americas and Horizon Asia‑Pacific reporting units as of our annual testing date at October 1, 2017, using the criteria in ASC 350-20-35-3 to determine whether it is more likely than not that the reporting unit’s fair value is less than its carrying value. As a result of the impairment indicators discussed in detail below, we updated our analysis as of December 31, 2017. Based on the qualitative analysis performed, the Company does not believe that it is more likely than not that the that the fair value of the reporting units is less than the carrying amounts; therefore, the quantitative step is not required for the 2017 goodwill impairment test.
The Company exercised its unconditional option provided by ASC 350-20-35-3B to bypass the qualitative assessment (Step Zero) of goodwill in its Horizon Europe-Africa reporting unit. The Company prepared a quantitative assessment to estimate the fair value of its Horizon Europe-Africa reporting unit at the annual testing date of October 1, 2017 utilizing a weighting of the income approach and the market approach. Based on the Step One analysis performed, the Horizon Europe-Africa reporting unit’s fair value substantially exceeded its carrying value; therefore, there is no goodwill impairment as a result of this 2017 goodwill impairment test.
In the fourth quarter of 2017, the Company experienced a significant decline in its market capitalization. Further, the Horizon Europe‑Africa reporting unit did not perform in-line with expectations during the fourth quarter, driven by delayed closure and additional costs incurred relating to closing facilities in the United Kingdom and Sweden, delayed realization of price increases and inefficiencies transferring production to lower cost manufacturing sites. Because of the decline in market capitalization and fourth quarter results, the Company identified an indicator of impairment in the fourth quarter. As a result of the indicators identified, the Company performed an interim quantitative assessment as of December 31, 2017, utilizing a combination of the income and market approaches, which was weighted evenly. The results of the quantitative analysis performed indicated the fair value of the reporting unit exceeded the carrying value by approximately 1%. Key assumptions used in the analysis were a discount rate of 13%, EBITDA margin and a terminal growth rate of 2.5%. The primary driver in the reduction of the fair value of the reporting unit was a reduction of expected future cash flows. Since the acquisition of the Westfalia Group, as further described in Note 4, “Acquisitions”, the Company has invested, and intends to continue to invest, in cost savings and productivity initiatives that will drive strong future profitability. While these investments have resulted in lower post-acquisition EBITDA, the Company continues to believe these projects will result in significant future earnings. Future events and changing market conditions may, however,
50
lead the Company to reevaluate the assumptions that have been used to test for goodwill impairment, including key assumptions used in the expected EBITDA margins, cash flows and discount rates, as well as other assumptions with respect to matters out of the Company’s control, such as currency exchange rates and market multiple comparables.
Subsequent to December 31, 2017, the Company’s market capitalization has declined, primarily due to a pre-release of our estimated 2017 results that fell short of our previously communicated guidance, which may be an indicator of impairment. As noted above, the revised expectations were included in our interim goodwill impairment assessment. The Company will continue to assess the impact of its market capitalization and any other indicators of potential impairment. It is possible that if the Company’s market capitalization decline is more than temporary, or if other indicators of impairment are identified, an interim impairment analysis may be necessary, which could result in an impairment of goodwill, indefinite-lived intangible assets and other long-lived assets in 2018.
Indefinite-Lived Intangibles. The Company assesses indefinite-lived intangible assets, primarily trademarks and trade names, for impairment annually on October 1st by reviewing relevant quantitative factors. More frequent evaluations may be required if the Company experiences changes in its business climate or as a result of other triggering events that take place.
Indefinite-lived assets are tested for impairment by comparing the fair value of each intangible asset with its carrying value. The value of indefinite-lived assets are based on the present value of projected cash flows using a relief from royalty approach. If the carrying value exceeds fair value, the intangible asset is considered impaired and is reduced to fair value.
We conducted the annual indefinite-lived intangible asset impairment tests as of October 1, 2017, and as a result of the impairment indicators noted above we performed an interim assessment as of December 31, 2017. Based on the results of our analyses there were certain trade names where the estimated fair values only slightly exceeded the carrying values. Key assumptions used in the analysis were discount rates of 13% to 15.5% and royalty rates ranging from 0.5% to 3.0%.
Self-insurance. Horizon has historically, indirectly as a component of TriMas, participated in TriMas’ self-insurance plans and has been allocated a portion of the related expenses and liabilities for the period presented prior to the spin-off. TriMas was generally self-insured for losses and liabilities related to workers’ compensation, health and welfare claims and comprehensive general, product and vehicle liability. Liabilities associated with the risks were estimated by considering historical claims experience and other actuarial assumptions. Following the spin-off, the Company continued to participate in TriMas’ health and welfare plan through December 31, 2015 and reimbursed them for claims paid on its behalf.
Horizon instituted self-insurance plans for losses and liabilities related to workers’ compensation and comprehensive general, product and vehicle liability at the time of spin-off which ran through June 30, 2016. The Company was generally responsible for up to $1.0 million per occurrence under our comprehensive general, product and vehicle liability plan and $0.5 million under our workers’ compensation plan. Beginning on July 1, 2016, Horizon is fully insured for workers’ compensation and retain no liability for claims under the new plan, and are generally responsible for up to $0.8 million per occurrence under our comprehensive general, product and vehicle liability plan. Reserves for claim losses, including an estimate of related litigation defense costs, are recorded based upon the Company’s estimates of the aggregate liability for claims incurred using actuarial assumptions about future events. Changes in assumptions for factors such as actual experience could cause these estimates to change.
Revenue Recognition. Revenues from product sales are recognized when products are shipped or provided to customers, the customer takes ownership and assumes risk of loss, the sales price is fixed and determinable and collectability is reasonably assured. Net sales is comprised of gross revenues less estimates of expected returns, trade discounts and customer allowances, which include incentives such as cooperative advertising agreements, volume discounts and other supply agreements in connection with various programs. Such deductions are recorded during the period the related revenue is recognized.
Cost of Sales. Cost of sales includes material, labor and overhead costs incurred in the manufacture of products sold in the period. Material costs include raw material, purchased components, outside processing and inbound freight costs. Overhead costs consist of variable and fixed manufacturing costs, wages and fringe benefits, and purchasing, receiving and inspection costs.
Selling, General and Administrative Expenses. Selling, general and administrative expenses include the following: costs related to the advertising, sale, marketing and distribution of the Company’s products, shipping and handling costs, amortization of customer intangible assets, costs of finance, human resources, legal functions, executive management costs and other administrative expenses.
Research and Development Costs. Research and development (“R&D”) costs are expensed as incurred. R&D expenses were approximately $15.4 million, $10.4 million and $4.1 million for the years ended December 31, 2017, 2016 and 2015, respectively, and are included in cost of sales in the accompanying consolidated statements of income (loss).
51
Shipping and Handling Expenses. Freight costs are included in cost of sales. Shipping and handling expenses, including those of Horizon Americas’ distribution network, are included in selling, general and administrative expenses in the accompanying consolidated statements of income (loss). Shipping and handling costs were $13.3 million, $9.1 million and $7.6 million for the years ended December 31, 2017, 2016 and 2015, respectively.
Advertising and Sales Promotion Costs. Advertising and sales promotion costs are expensed as incurred. Advertising costs were approximately $6.2 million, $6.1 million and $7.8 million for the years ended December 31, 2017, 2016 and 2015, respectively, and are included in selling, general and administrative expenses in the accompanying consolidated statements of income (loss).
Income Taxes. For the purposes of the consolidated financial statements as of and for the six months ended June 30, 2015, the Company’s income tax expense and deferred income tax balances have been estimated as if the Company filed income tax returns on a stand-alone basis separate from former parent. As a stand-alone entity, deferred income taxes and effective tax rates may differ from those in the historical periods.
Following the spin-off, the Company computes income taxes using the asset and liability method, whereby deferred income taxes are provided for the temporary differences between the financial reporting basis and the tax basis of assets and liabilities and for operating loss and tax credit carryforwards. Under the method, changes in tax rates and laws are recognized in income in the period such changes are enacted. Valuation allowances are determined based on an assessment of positive and negative evidence on a jurisdiction-by-jurisdiction basis and are utilized to reduce deferred tax assets to the amount more likely than not to be realized. The Company recognizes the effect of income tax positions only if those positions are more likely than not of being sustained. Recognized income tax positions are measured at the largest amount that is greater than 50% likely of being realized. Changes in recognition or measurement are reflected in the period in which the change in judgment occurs. The Company records interest and penalties related to unrecognized tax benefits within income tax expense. Accrued interest and penalties are included within the related tax liability line in the consolidated balance sheets.
The provision for federal, foreign, and state and local income taxes is calculated on income before income taxes based on current tax law and includes the cumulative effect of any changes in tax rates from those used previously in determining deferred tax assets and liabilities. Such provision differs from the amounts currently payable because certain items of income and expense are recognized in different reporting periods for financial reporting purposes than for income tax purposes.
Foreign Currency Translation. The financial statements of subsidiaries located outside of the United States are measured using the currency of the primary economic environment in which they operate as the functional currency. When translating into U.S. dollars, income and expense items are translated at average monthly exchange rates and assets and liabilities are translated at exchange rates in effect at the balance sheet date. Translation adjustments resulting from translating the functional currency into U.S. dollars are deferred as a component of accumulated other comprehensive income (loss) in the consolidated statements of shareholders’ equity. Net foreign currency transaction gains or losses were approximately a $0.8 million loss for the year ended December 31, 2017, a $0.5 million gain for the year ended December 31, 2016, and a $1.4 million loss for the year ended December 31, 2015. Net foreign currency transaction gains or losses are included in other expense, net in the accompanying consolidated statements of income (loss).
Derivative Financial Instruments. The Company records all derivative financial instruments at fair value on the balance sheets as either assets or liabilities, and changes in their fair values are immediately recognized in earnings if the derivatives do not qualify as effective hedges. If a derivative is designated as a fair value hedge, then the effective portion of changes in the fair value of the derivative are offset against the changes in the fair value of the underlying hedged item. If a derivative is designated as a cash flow hedge, then the effective portion of the changes in the fair value of the derivative is recognized as a component of other comprehensive income (loss) until the underlying hedged item is recognized in earnings or the forecasted transaction is no longer probable of occurring. When the underlying hedged transaction is realized or the hedged transaction is no longer probable, the gain or loss included in accumulated other comprehensive loss is recorded in earnings and reflected in the consolidated statements of income (loss) through the same line item.
The Company formally documents hedging relationships for all derivative transactions and the underlying hedged items, as well as its risk management objectives and strategies for undertaking the hedge transactions.
52
Fair Value of Financial Instruments. In accounting for and disclosing the fair value of these instruments, the Company uses the following hierarchy:
▪ | Level 1 inputs are quoted prices (unadjusted) in active markets for identical assets or liabilities that the Company has the ability to access at the measurement date; |
▪ | Level 2 inputs are inputs other than quoted prices included within Level 1 that are observable for the asset or liability, either directly or indirectly; and |
▪ | Level 3 inputs are unobservable inputs for the asset or liability. |
Valuation of the Company’s foreign currency forward contracts and cross currency swaps are based on the income approach, which uses observable inputs such as forward currency exchange rates and swap rates. The carrying value of financial instruments reported in the balance sheets for current assets and current liabilities approximates fair value due to the short maturity of these instruments.
Business Combinations. The Company records assets acquired and liabilities assumed from acquisitions at fair value. The fair value of working capital accounts generally approximate book value. The valuation of inventory, property, plant and equipment, and intangible assets require significant assumptions. Inventory is recorded based on the estimated selling price less costs to sell, including completion, disposal and holding period costs with a reasonable profit margin. Property, plant and equipment is recorded at fair value using a combination of both the cost and market approaches for both the real and personal property acquired. Under the cost approach, consideration is given to the amount required to construct or purchase a new asset of equal value at current prices, with adjustments in value for physical deterioration, as well as functional and economic obsolescence. Under the market approach, recent transactions for similar types of assets are used as the basis for estimating fair value. For trademark/trade names and technology and other intangible assets, the estimated fair value is based on projected discounted future net cash flows using the relief-from-royalty method. For customer relationship intangible assets, the estimated fair value is based on projected discounted future cash flows using the excess earnings method. The relief-from-royalty and excess earnings method are both income approaches that utilize key assumptions such as forecasts of revenue and expenses over an extended period of time, royalty rate percentages, tax rates, and estimated costs of debt and equity capital to discount the projected cash flows.
Earnings Per Share. Basic earnings per share (“EPS”) is computed based upon the weighted average number of common shares outstanding for each period. Diluted EPS is computed based on the weighted average number of common shares and common equivalent shares. Common equivalent shares represent the effect of stock-based awards, warrants, and convertible notes during each period presented, which, if exercised, earned, or converted, would have a dilutive effect on earnings per share. On June 30, 2015, 18,062,027 shares of our common stock were distributed to TriMas shareholders of record to complete the spin-off from TriMas. For comparative purposes we have used weighted average shares of 18,062,027 to calculate basic EPS for all periods prior to the spin-off. Dilutive earnings per share are calculated to give effect to stock options and warrants, restricted shares outstanding, and convertible notes during each period.
Environmental Obligations. The Company is subject to increasingly stringent environmental laws and regulations, including those relating to air emissions, wastewater discharges and chemical and hazardous waste management and disposal. Some of these environmental laws hold owners or operators of land or businesses liable for their own and for previous owners’ or operators’ releases of hazardous or toxic substances or wastes. Other environmental laws and regulations require the obtainment and compliance with environmental permits. To date, costs of complying with environmental, health and safety requirements have not been material; however, the Company cannot quantify with certainty the potential impact of future compliance efforts and environmental remediation actions.
While the Company must comply with existing and pending climate change legislation, regulation and international treaties or accords, current laws and regulations have not had a material impact on the Company’s business, capital expenditures or financial position. Future events, including those relating to climate change or greenhouse gas regulation could require the Company to incur expenses related to the modification or curtailment of operations, installation of pollution control equipment or investigation and cleanup of contaminated sites.
Ordinary Course Claims. The Company is subject to claims and litigation in the ordinary course of business, but does not believe that any such claim or litigation is likely to have a material adverse effect on its financial position and results of operations or cash flows.
53
Stock-based Compensation. The Company measures stock-based compensation expense at fair value as of the grant date in accordance with U.S. GAAP and recognizes such expenses over the vesting period of the stock-based employee awards. Stock options are issued with an exercise price equal to the opening market price of Horizon common shares on the date of grant. The fair value of stock options is determined using a Black-Scholes option pricing model, which incorporates assumptions regarding the expected volatility, expected option life, risk-free interest rate and expected dividend yield. In addition, the Company periodically updates its estimate of attainment for each restricted share with a performance factor based on current and forecasted results, reflecting the change from prior estimate, if any, in current period compensation expense.
Other Comprehensive Income (Loss). The Company refers to other comprehensive income (loss) as revenues, expenses, gains and losses that under U.S. GAAP are included in comprehensive income (loss) but are excluded from net earnings as these amounts are recorded directly as an adjustment to accumulated deficit. Other comprehensive income (loss) is comprised of foreign currency translation adjustments and changes in unrealized gains and losses on forward currency contracts and cross currency swaps.
Net transfers (to) from parent. Net transfers (to) from parent in the consolidated statements of cash flows and statements of shareholders’ equity represent the total net effect of the settlement of intercompany transactions with TriMas.
Reclassifications. Certain amounts in prior years’ financial statements have been reclassified to conform to the current presentation.
4. Acquisitions
2017 Acquisition
On July 3, 2017, the Company completed the acquisition of Best Bars Limited (“Best Bars”), within the Horizon Asia-Pacific reportable segment, for total consideration of $19.8 million, subject to a net working capital adjustment which has not been finalized. Best Bars is a provider of towing solutions and automotive accessories to OE and aftermarket customers in New Zealand. The Company believes the acquisition will expand its opportunities for revenue and margin growth, increase its market share and further develop its global OE footprint. Supplemental pro forma disclosures are not included as the amounts are deemed immaterial. Revenues and earnings of the acquiree since the acquisition date included in the Company’s consolidated statements of income (loss) are immaterial.
The following table summarizes the fair value of consideration paid for Best Bars, and the assets acquired and liabilities assumed:
Acquisition Date | ||||
(dollars in thousands) | ||||
Consideration | ||||
Cash paid | $ | 19,800 | ||
Recognized amounts of identifiable assets acquired and liabilities assumed | ||||
Receivables | 2,100 | |||
Inventories | 2,340 | |||
Other intangibles | 7,690 | |||
Prepaid expenses and other current assets | 110 | |||
Property and equipment | 2,250 | |||
Accounts payable and accrued liabilities | (1,680 | ) | ||
Total identifiable net assets | 12,810 | |||
Goodwill | 6,990 | |||
$ | 19,800 | |||
54
2016 Acquisition
On October 4, 2016, the Company completed the acquisition of 100% of the equity interest in Westfalia-Automotive Holding GmbH and TeIJs Holding B.V. (collectively, the “Westfalia Group”). The acquisition was effective October 1, 2016, and was for total consideration of approximately $141.5 million, net of cash acquired. The consideration was in the form of approximately $91.6 million paid in cash, net of cash acquired, and approximately $49.9 million paid through the issuance of 2,704,310 shares of the Company’s common stock. The fair value of the common stock was $18.48, determined based on the price of the Company’s common stock on October 4, 2016, which was $19.87, with a discount applied due to restrictions on marketability.
The Westfalia Group is a leading global towing company. Headquartered in Rheda-Wiedenbrück, Germany, with operating facilities in 11 countries, it manufactures towing and trailering products, including more than 1,700 different types of towbars, wiring kits and carrier systems for cars and light utility vehicles. The Company believes the acquisition will expand its opportunities for revenue and margin growth, increase its market share and augment its global OE footprint with access to new markets and customers.
The following table summarizes the fair value of consideration paid for the Westfalia Group, and the assets acquired and liabilities assumed:
Acquisition Date | ||||
(dollars in thousands) | ||||
Consideration | ||||
Cash paid | $ | 91,580 | ||
Issuance of common stock | 49,960 | |||
Total consideration | $ | 141,540 | ||
Recognized amounts of identifiable assets acquired and liabilities assumed | ||||
Receivables | $ | 19,700 | ||
Inventories | 43,290 | |||
Other intangibles(a) | 47,780 | |||
Prepaid expenses and other current assets | 1,740 | |||
Property and equipment | 47,480 | |||
Accounts payable and accrued liabilities | (54,150 | ) | ||
Long-term debt | (59,140 | ) | ||
Other long-term liabilities | (31,210 | ) | ||
Total identifiable net assets | 15,490 | |||
Goodwill(b) | 126,050 | |||
$ | 141,540 | |||
___________________________
(a) Consists of approximately $33.6 million of customer relationships with an estimated useful life of 16.3 years, $3.4 million of technology and other intangible assets with an estimated useful life of 10 years and $10.8 million of trademark/trade names with an indefinite useful life.
(b) All of the goodwill was assigned to the Company’s Horizon Europe‑Africa reportable segment and is expected to be deductible for tax purposes.
The results of operations of the Westfalia Group are included in the Company’s results beginning October 1, 2016. The actual amounts of net sales and operating loss of the Westfalia Group included in the accompanying consolidated statements of income (loss) for the year ended December 31, 2016 are $54.5 million and $9.6 million, respectively.
55
The following table summarizes the supplemental pro forma results of the combined entity as if the acquisition had occurred on January 1, 2015. The supplemental pro forma information presented below is for informational purposes and is not necessarily indicative of either future results of operations or results that might have been achieved had the acquisition been consummated on January 1, 2015:
Pro forma Combined (a) | ||||||||
Year ended December 31, | ||||||||
2016 | 2015 | |||||||
(dollars in thousands) | ||||||||
Net sales | $ | 811,330 | $ | 787,930 | ||||
Net loss attributable to Horizon Global | $ | (12,780 | ) | $ | (18,350 | ) | ||
Basic earnings (loss) per share attributable to Horizon Global | $ | (0.61 | ) | $ | (0.88 | ) | ||
Diluted earnings (loss) per share attributable to Horizon Global | $ | (0.61 | ) | $ | (0.88 | ) | ||
___________________________
(a) The supplemental pro forma results reflect certain material adjustments, as follows:
1. | Pre-tax pro forma adjustments for inventory step-up of $6.7 million for each of the years ended December 31, 2016 and December 31, 2015, respectively, associated with the acquisition. |
2. | Pre-tax pro forma adjustments for depreciation expense of $1.4 million and $2.0 million for the years ended December 31, 2016 and December 31, 2015, respectively, on the property and equipment associated with the acquisition. |
3. | Pre-tax pro forma adjustments for amortization expense of $1.4 million and $1.5 million for the years ended December 31, 2016 and December 31, 2015, respectively, on the intangible assets associated with the acquisition. |
4. | Pre-tax pro forma adjustments for financing costs of $0.5 million and $0.6 million for the years ended December 31, 2016 and December 31, 2015, respectively, on the incremental debt associated with the acquisition. |
5. | Pre-tax pro forma adjustments for transaction costs of $10.3 million for each of the years ended December 31, 2016 and December 31, 2015, respectively, associated with the acquisition. |
6. | Pre-tax pro forma adjustments of $8.1 million and $10.7 million for the years ended December 31, 2016 and December 31, 2015, respectively, to reflect interest expense incurred on the incremental term loan and revolver borrowings incurred in order to fund the acquisition. |
Total acquisition costs incurred by the Company in connection with its purchase of the Westfalia Group, primarily related to third- party legal, accounting and tax diligence fees, were approximately $10.3 million, all of which were incurred during 2016. These costs are recorded in selling, general and administrative expenses in the accompanying consolidated statements of income (loss).
56
5. Goodwill and Other Intangible Assets
Goodwill
Changes in the carrying amount of goodwill for the years ended December 31, 2017 and 2016 are as follows:
Horizon Americas | Horizon Europe‑Africa | Horizon Asia‑Pacific | Total | |||||||||||||
(dollars in thousands) | ||||||||||||||||
Balances at December 31, 2015 | $ | 4,410 | $ | — | $ | — | $ | 4,410 | ||||||||
Goodwill from acquisitions (a) | — | 126,050 | — | 126,050 | ||||||||||||
Foreign currency translation and other | 960 | (11,230 | ) | — | (10,270 | ) | ||||||||||
Balances at December 31, 2016 | 5,370 | 114,820 | — | 120,190 | ||||||||||||
Goodwill from acquisitions (b) | — | — | 6,990 | 6,990 | ||||||||||||
Foreign currency translation and other | (90 | ) | 11,340 | (240 | ) | 11,010 | ||||||||||
Balances at December 31, 2017 | $ | 5,280 | $ | 126,160 | $ | 6,750 | $ | 138,190 | ||||||||
__________________________
(a) Attributable to the acquisition of the Westfalia Group, as further described in Note 4, “Acquisitions”.
(b) Attributable to the acquisition of Best Bars, as further described in Note 4, “Acquisitions”.
Other Intangible Assets
In May 2016, the Company made a decision to simplify its brand offering in the Horizon Americas’ reportable segment. Based on this decision, the Company no longer expects that the economic benefit of certain indefinite-lived trade names extends beyond the foreseeable future. As a result, in the second quarter of 2016, the Company determined that trade names with an aggregate carrying value of $2.4 million should be assigned finite useful lives. In accordance with ASC 350, “Intangibles - Goodwill and Other,” these trade names were first tested for impairment as indefinite-lived intangible assets resulting in non-cash intangible asset impairment charges of $2.2 million. The remaining $0.2 million was reclassified to amortizable intangible assets during the second quarter of 2016 and amortized within selling, general and administrative costs over the remainder of the year.
During the Company’s annual indefinite-lived impairment testing in the fourth quarter of 2016, due to the macroeconomic conditions in Brazil and declining sales and sales projections as a result of competitive pressures in the United Kingdom, the Company determined that certain trade names with an aggregate carrying value of $6.9 million were impaired. In accordance with ASC 350, “Intangibles - Goodwill and Other,” the indefinite-lived assets were tested for impairment with fair value measurements derived from a relief from royalty method, which considers projected revenue and an estimated royalty rate. It was determined that the carrying value of these trade names exceeded their estimated fair value. As a result, non-cash intangible asset impairment charges of $3.8 million and $2.4 million were recorded in the Horizon Americas and Horizon Europe‑Africa reportable segments, respectively. No impairment charges were recorded during the year ended December 31, 2017. Refer to Note 3, “Summary of Significant Accounting Policies” for further discussion.
57
The gross carrying amounts and accumulated amortization of the Company’s other intangibles as of December 31, 2017 and 2016 are summarized below. The Company amortizes these assets over periods ranging from one to 25 years.
As of December 31, 2017 | As of December 31, 2016 | |||||||||||||||
Intangible Category by Useful Life | Gross Carrying Amount | Accumulated Amortization | Gross Carrying Amount | Accumulated Amortization | ||||||||||||
(dollars in thousands) | ||||||||||||||||
Finite-lived intangible assets: | ||||||||||||||||
Customer relationships, 5 - 25 years | $ | 180,850 | $ | (121,750 | ) | $ | 170,690 | $ | (112,560 | ) | ||||||
Technology and other, 3 - 15 years | 19,950 | (15,260 | ) | 18,410 | (14,560 | ) | ||||||||||
Trademark/Trade names, 1 - 8 years | 730 | (190 | ) | 150 | (150 | ) | ||||||||||
Total finite-lived intangible assets | 201,530 | (137,200 | ) | 189,250 | (127,270 | ) | ||||||||||
Trademark/Trade names, indefinite-lived | 25,900 | — | 24,740 | — | ||||||||||||
Total other intangible assets | $ | 227,430 | $ | (137,200 | ) | $ | 213,990 | $ | (127,270 | ) | ||||||
Amortization expense related to intangible assets as included in the accompanying consolidated statements of income (loss) is summarized as follows:
Year ended December 31, | ||||||||||||
2017 | 2016 | 2015 | ||||||||||
(dollars in thousands) | ||||||||||||
Technology and other, included in cost of sales | $ | 710 | $ | 170 | $ | 190 | ||||||
Customer relationships & Trademark/Trade names, included in selling, general and administrative expenses | 9,700 | 7,790 | 7,150 | |||||||||
Total amortization expense | $ | 10,410 | $ | 7,960 | $ | 7,340 | ||||||
Estimated amortization expense for the next five fiscal years beginning after December 31, 2017 is as follows:
Year ended December 31, | Estimated Amortization Expense | |||
(dollars in thousands) | ||||
2018 | $ | 7,740 | ||
2019 | 7,240 | |||
2020 | 7,040 | |||
2021 | 5,490 | |||
2022 | 5,240 | |||
6. Inventories
Inventories consist of the following components:
December 31, 2017 | December 31, 2016 | |||||||
(dollars in thousands) | ||||||||
Finished goods | $ | 105,070 | $ | 89,410 | ||||
Work in process | 16,590 | 16,270 | ||||||
Raw materials | 49,840 | 40,340 | ||||||
Total inventories | $ | 171,500 | $ | 146,020 | ||||
58
7. Property and Equipment, Net
Property and equipment consists of the following components:
December 31, 2017 | December 31, 2016 | |||||||
(dollars in thousands) | ||||||||
Land and land improvements | $ | 480 | $ | 520 | ||||
Buildings | 23,370 | 20,120 | ||||||
Machinery and equipment | 162,830 | 138,470 | ||||||
186,680 | 159,110 | |||||||
Less: Accumulated depreciation | 73,660 | 65,350 | ||||||
Property and equipment, net | $ | 113,020 | $ | 93,760 | ||||
Depreciation expense as included in the accompanying consolidated statements of income (loss) is as follows:
Year ended December 31, | ||||||||||||
2017 | 2016 | 2015 | ||||||||||
(dollars in thousands) | ||||||||||||
Depreciation expense, included in cost of sales | $ | 13,730 | $ | 8,800 | $ | 8,210 | ||||||
Depreciation expense, included in selling, general and administrative expense | 1,200 | 1,460 | 1,530 | |||||||||
Total depreciation expense | $ | 14,930 | $ | 10,260 | $ | 9,740 | ||||||
8. Accrued and other long-term liabilities
As of December 31, 2017 and 2016, accrued wages and bonus were approximately $9.9 million and $16.7 million, respectively. No other classification of accrued liabilities exceeded 5% of current liabilities as of December 31, 2017 and 2016.
Other long-term liabilities consist of the following components:
December 31, 2017 | December 31, 2016 | |||||||
(dollars in thousands) | ||||||||
Long-term tax liabilities | $ | 13,750 | $ | 9,720 | ||||
Cross currency swap | 7,830 | — | ||||||
Deferred purchase price | 3,350 | 5,070 | ||||||
Other | 13,440 | 15,620 | ||||||
Total other long-term liabilities | $ | 38,370 | $ | 30,410 | ||||
59
9. Long-term Debt
The Company’s long-term debt consists of the following:
December 31, 2017 | December 31, 2016 | |||||||
(dollars in thousands) | ||||||||
ABL Facility | $ | 10,000 | $ | — | ||||
Term B Loan | 149,620 | 337,000 | ||||||
Convertible Notes | 125,000 | — | ||||||
Bank facilities, capital leases and other long-term debt | 25,780 | 21,660 | ||||||
310,400 | 358,660 | |||||||
Less: | ||||||||
Unamortized debt issuance costs and original issuance discount on Term B Loan | 4,940 | 8,720 | ||||||
Unamortized debt issuance costs and discount on the Convertible Notes | 29,870 | — | ||||||
Current maturities, long-term debt | 16,710 | 22,900 | ||||||
Long-term debt | $ | 258,880 | $ | 327,040 | ||||
Convertible Notes
On February 1, 2017, the Company completed a public offering of 2.75% Convertible Senior Notes due 2022 (the “Convertible Notes”) in an aggregate principal amount of $125.0 million. Interest is payable on January 1 and July 1 of each year, beginning on July 1, 2017. The Convertible Notes are convertible into 5,005,000 shares of the Company’s common stock, based on an initial conversion price of $24.98 per share. The Convertible Notes will mature on July 1, 2022 unless earlier converted.
The Convertible Notes are convertible at the option of the holder (i) during any calendar quarter beginning after March 31, 2017, if the last reported sale price of the Company’s common stock for at least 20 trading days (whether or not consecutive) during a period of 30 consecutive trading days ending on the last trading day of the immediately preceding calendar quarter is greater than or equal to 130% of the conversion price on each applicable trading day; (ii) during the five business days after any five consecutive trading day period in which the trading price per $1,000 principal amount of the Convertible Notes for each trading day of such period was less than 98% of the product of the last reported sale price of the Company’s common stock and the conversion rate on each such trading day; (iii) upon the occurrence of specified corporate events; and (iv) on or after January 1, 2022 until the close of business on the second scheduled trading day immediately preceding the maturity date. During the fourth quarter of 2017, no conditions allowing holders of the Convertible Notes to convert have been met. Therefore, the Convertible Notes are not convertible during the fourth quarter of 2017 and are classified as long-term debt. Should conditions allowing holders of the Convertible Notes to convert be met in the fourth quarter of 2017 or a future quarter, the Convertible Notes will be convertible at their holders’ option during the immediately following quarter. As of December 31, 2017, the if-converted value of the Convertible Notes did not exceed the principal value of those Convertible Notes.
Upon conversion by the holders, the Company may elect to settle such conversion in shares of its common stock, cash, or a combination thereof. Because the Company may elect to settle conversion in cash, the Company separated the Convertible Notes into their liability and equity components by allocating the issuance proceeds to each of those components in accordance with Accounting Standards Codification (“ASC”) 470-20, “Debt-Debt with Conversion and Other Options.” The Company first determined the fair value of the liability component by estimating the fair value of a similar liability that does not have an associated equity component. The Company then deducted that amount from the issuance proceeds to arrive at a residual amount, which represents the equity component. The Company accounted for the equity component as a debt discount (with an offset to paid-in capital in excess of par value). The debt discount created by the equity component is being amortized as additional non-cash interest expense using the effective interest method over the contractual term of the Convertible Notes ending on July 1, 2022.
The Company allocated offering costs of $3.9 million to the debt and equity components in proportion to the allocation of proceeds to the components, treating them as debt issuance costs and equity issuance costs, respectively. The debt issuance costs of $2.9 million are being amortized as additional non-cash interest expense using the effective interest method over the contractual term of the Convertible Notes. The Company presents debt issuance costs as a direct deduction from the carrying value of the liability component. The carrying value of the liability component at December 31, 2017, was $95.1 million, including total unamortized
60
debt discount and debt issuance costs of $29.9 million. The $1.0 million portion of offering costs allocated to equity issuance costs was charged to paid-in capital. The carrying amount of the equity component was $20.0 million at December 31, 2017, net of issuance costs and taxes.
Interest expense recognized relating to the contractual interest coupon, amortization of debt discount and amortization of debt issuance costs on the Convertible Notes included in the accompanying consolidated statements of income (loss) are as follows:
Year ended December 31, | ||||||||
2017 | 2016 | |||||||
(dollars in thousands) | ||||||||
Contractual interest coupon on convertible debt | $ | 3,190 | $ | — | ||||
Amortization of debt issuance costs | $ | 490 | $ | — | ||||
Amortization of "equity discount" related to debt | $ | 4,380 | $ | — | ||||
The estimated fair value of the Convertible Notes based on a market approach as of December 31, 2017 was approximately $120.3 million, which represents a Level 2 valuation. The estimated fair value was determined based on the estimated or actual bids and offers of the Convertible Notes in an over-the-counter market on the last business day of the period.
In connection with the issuance of the Convertible Notes, the Company entered into convertible note hedge transactions (the “Convertible Note Hedges”) in privately negotiated transactions with certain of the underwriters or their affiliates (in this capacity, the “option counterparties”). The Convertible Note Hedges provide the Company with the option to acquire, on a net settlement basis, 5,005,000 shares of its common stock, which is equal to the number of shares of common stock that notionally underlie the Convertible Notes, at a strike price of $24.98, which corresponds to the conversion price of the Convertible Notes. The Convertible Note Hedges have an expiration date that is the same as the maturity date of the Convertible Notes, subject to earlier exercise. The Convertible Note Hedges have customary anti-dilution provisions similar to the Convertible Notes. The Convertible Note Hedges have a default settlement method of net-share settlement but may be settled in cash or shares, depending on the Company’s method of settlement for conversion of the corresponding Convertible Notes. If the Company exercises the Convertible Note Hedges, the shares of common stock it will receive from the option counterparties to the Convertible Note Hedges will cover the shares of common stock that it would be required to deliver to the holders of the converted Convertible Notes in excess of the principal amount thereof. The aggregate cost of the Convertible Note Hedges was $29.0 million (or $7.5 million net of the total proceeds from the Warrants sold, as discussed below), before the allocation of issuance costs of approximately $0.7 million. The Convertible Note Hedges are accounted for as equity transactions in accordance with ASC 815-40, “Derivatives and Hedging-Contracts in Entity’s own Equity.”
In connection with the issuance of the Convertible Notes, the Company also sold net-share-settled warrants (the “Warrants”) in privately negotiated transactions with the option counterparties for the purchase of up to 5,005,000 shares of its common stock at a strike price of $29.60 per share, for total proceeds of $21.5 million before the allocation of $0.6 million of issuance costs. The Company also recorded the Warrants within shareholders’ equity in accordance with ASC 815-40. The Warrants have customary anti-dilution provisions similar to the Convertible Notes. As a result of the issuance of the Warrants, the Company will experience dilution to its diluted earnings per share if its average closing stock price exceeds $29.60 for any fiscal quarter. The Warrants expire on various dates from October 2022 through February 2023 and must be net-settled in shares of the Company’s common stock. Therefore, upon exercise of the Warrants, the Company will issue shares of its common stock to the purchasers of the Warrants that represent the value by which the price of the common stock exceeds the strike price stipulated within the particular warrant agreement.
ABL Facility
On December 22, 2015, the Company entered into an amended and restated loan agreement among the Company, Cequent Performance Products, Inc. (“Cequent Performance”), Cequent Consumer Products, Inc. (“Cequent Consumer”), Cequent UK Limited, Cequent Towing Products of Canada Ltd., certain other subsidiaries of the Company party thereto as guarantors, the lenders party thereto and Bank of America, N.A., as agent for the lenders (the “ABL Loan Agreement”), under which the lenders party thereto agreed to provide the Company and certain of its subsidiaries with a committed asset-based revolving credit facility (the “ABL Facility”) providing for revolving loans up to an aggregate principal amount of $99.0 million.
61
The ABL Loan Agreement provides for the increase of the U.S. sub-facility from an aggregate principal amount of $85.0 million to up to $94.0 million (subject to availability under a U.S.-specific borrowing base) (the “U.S. Facility”), and the establishment of two new sub-facilities, (i) a Canadian sub-facility, in an aggregate principal amount of up to $2.0 million (subject to availability under a Canadian-specific borrowing base) (the “Canadian Facility”) and (ii) a U.K. sub-facility in an aggregate principal amount of up to $3.0 million (subject to availability under a U.K.-specific borrowing base) (the “U.K. Facility”). The ABL Facility also includes a $20.0 million letter of credit sub-facility, which matures on June 30, 2020.
Borrowings under the ABL Facility bear interest, at the Company’s election, at either (i) the Base Rate (as defined per the credit agreement, the “Base Rate”) plus the Applicable Margin (as defined per the credit agreement “Applicable Margin”), or (ii) the London Interbank Offered Rate (“LIBOR”) plus the Applicable Margin.
The Company incurs fees with respect to the ABL Facility, including (i) an unused line fee of 0.25% times the amount by which the revolver commitments exceed the average daily revolver usage during any month, (ii) facility fees equal to the applicable margin in effect for LIBOR revolving loans, as defined per the credit agreement, times the average daily stated amount of letters of credit, (iii) a fronting fee equal to 0.125% per annum on the stated amount of each letter of credit and (iv) customary administrative fees.
All of the indebtedness of the U.S. Facility is and will be guaranteed by the Company’s existing and future material domestic subsidiaries and is and will be secured by substantially all of the assets of the Company and such guarantors. In connection with the ABL Loan Agreement, Cequent Performance and certain other subsidiaries of the Company party to the ABL Loan Agreement entered into a foreign facility guarantee and collateral agreement (the “Foreign Collateral Agreement”) in order to secure and guarantee the obligation under the Canadian Facility and the U.K. Facility. Under the Foreign Collateral Agreement, Cequent Performance and the other subsidiaries of the Company party thereto granted a lien on certain of their assets to Bank of America, N.A., as the agent for the lenders and other secured parties under the Canadian Facility and U.K. Facility.
The ABL Loan Agreement contains customary negative covenants, and does not include any financial maintenance covenants other than a springing minimum fixed charge coverage ratio of at least 1.00 to 1.00 on a trailing twelve-month basis, which will be tested only upon the occurrence of an event of default or certain other conditions as specified in the agreement. At December 31, 2017, the Company was in compliance with its financial covenants contained in the ABL Facility.
Debt issuance costs of approximately $2.5 million were incurred in connection with the entry into and amendment of the ABL Facility. These debt issuance costs will be amortized into interest expense over the contractual term of the loan. The Company recognized $0.5 million, $0.5 million and $0.1 million during the years ended December 31, 2017, December 31, 2016 and December 31, 2015, respectively, related to the amortization of debt issuance costs, which is included in the accompanying consolidated statements of income (loss). There were $1.3 million and $1.8 million of unamortized debt issuance costs included in other assets in the accompanying consolidated balance sheet as of December 31, 2017 and December 31, 2016, respectively.
There was $10.0 million outstanding under the ABL Facility as of December 31, 2017 with a weighted average interest rate of 3.6%. As of December 31, 2016 there were no amounts outstanding. Total letters of credit issued at December 31, 2017 and 2016 were $6.3 million and $7.0 million, respectively. The Company had $58.5 million and $68.7 million in availability under the ABL Facility as of December 31, 2017 and 2016, respectively.
Term Loan
On June 30, 2015, the Company entered into a term loan agreement (“Original Term B Loan”) under which the Company borrowed an aggregate of $200.0 million, which matures on June 30, 2021. On September 19, 2016, the Company entered into the First Amendment to the Original Term B Loan (the “Term Loan Amendment”) which amended the Term B Loan to provide for incremental commitments in an aggregate principal amount of $152.0 million (the “Incremental Term Loans”) that were extended to the Company on October 3, 2016. The Original Term B Loan and Incremental Term Loans are collectively referred to as the “Term B Loan”. On March 31, 2017, the Company entered into the Third Amendment to the Term B Loan (the “Replacement Term Loan Amendment”), which amended the Term B Loan to provide for a new term loan commitment (the “Replacement Term Loan”). The proceeds from the Replacement Term Loan were used to repay in full the outstanding principal amount of the Term B Loan. As a result of the Replacement Term Loan Amendment, the interest rate was reduced by 1.5% per annum. Additionally, quarterly principal payments required under the Original Term B Loan and Term Loan Amendment of $2.5 million and $2.1 million, respectively, were reduced to an aggregate quarterly principal payment of $1.9 million. On and after the Replacement Term Loan Amendment effective date, each reference to “Term B Loan” is deemed to be a reference to the Replacement Term Loan.
62
The Term B Loan permits the Company to request incremental term loan facilities, subject to certain conditions, in an aggregate principal amount, together with the aggregate principal amount of incremental equivalent debt incurred by the Company, of up to $75.0 million, plus an additional amount such that the Company’s pro forma first lien net leverage ratio (as defined in the term loan agreement) would not exceed 3.50 to 1.00 as a result of the incurrence thereof.
Borrowings under the Term B Loan bear interest, at the Company’s election, at either (i) the Base Rate plus 3.5% per annum, or (ii) LIBOR, with a 1% floor, plus 4.5% per annum. Principal payments required under the Term B Loan are $1.9 million due each calendar quarter beginning June 2017. Commencing with the fiscal year ending December 31, 2017, and for each fiscal year thereafter, the Company will also be required to make prepayments of outstanding amounts under the Term B Loan in an amount equal to 50.0% of the Company’s excess cash flow for such fiscal year, as defined in the Term B Loan, subject to adjustments based on the Company’s leverage ratio and optional prepayments of term loans and certain other indebtedness.
All of the indebtedness under the Term B Loan is and will be guaranteed by the Company’s existing and future material domestic subsidiaries and is and will be secured by substantially all of the assets of the Company and such guarantors. The Term B Loan contains customary negative covenants, and also contains a financial maintenance covenant which requires the Company to maintain a net leverage ratio not exceeding 5.00 to 1.00 through the fiscal quarter ending March 31, 2018; 4.75 to 1.00 through the fiscal quarter ending September 30, 2018; and thereafter, 4.50 to 1.00. At December 31, 2017, the Company was in compliance with its financial covenants as described in the Term B Loan.
During the first quarter of 2017, the Company used a portion of the net proceeds from the Convertible Notes offering as described above, along with proceeds from the Common Stock Offering as described in Note 12, “Earnings per Share”, to prepay a total of $177.0 million of the Term B Loan. In accordance with ASC 470, “Debt - Modifications and Extinguishments”, the prepayment was determined to be an extinguishment of the existing debt. As a result, the pro-rata share of the unamortized debt issuance costs and original issuance discount related to the prepayment, aggregating to $4.6 million, was recorded as a loss on the extinguishment of debt in the condensed consolidated statements of income (loss). The remaining unamortized debt issuance costs and original issuance discount, including $2.4 million additional transactions fees incurred in connection to the Replacement Term Loan Amendment, was approximately $6.1 million. Both the aggregate debt issuance costs and the original issue discount will be amortized into interest expense over the remaining life of the Term B Loan. The Company recognized $1.6 million, $1.6 million and $0.7 million during the years ended December 31, 2017, December 31, 2016 and December 31, 2015 related to the amortization of debt issuance costs and original issue discount, which is included in the accompanying consolidated statements of income (loss). The Company had an aggregate principal amount outstanding of $149.6 million and $337.0 million as of December 31, 2017 and 2016, respectively, under the Term B Loan bearing interest at 6.1%, and had $4.9 million and $8.7 million as of December 31, 2017 and 2016, respectively, of unamortized debt issuance costs and original issue discount, all of which are recorded as a reduction of the debt balance on the Company’s consolidated balance sheet.
The Company’s Term B Loan traded at approximately 101.4% and 101.6% of par value as of December 31, 2017 and December 31, 2016. The valuation of the Term B Loan was determined based on Level 2 inputs under the fair value hierarchy, as defined in Note 3, “Summary of Significant Accounting Polices.”
Bank facilities
On July 3, 2017, our Australian subsidiaries entered into a new agreement (collectively, the “Australia Loans”) to provide for revolving borrowings with an aggregate principal amount of $32.0 million as of December 31, 2017. The Australia Loans include two sub-facilities: (i) Facility A, with a borrowing capacity of $20.3 million that matures on July 3, 2020 and (ii) Facility B, with a borrowing capacity of $11.7 million that matures on July 3, 2018. There were $6.6 million outstanding under the Australian Loans as for December 31, 2017. As of December 31, 2016, no amounts were outstanding under the old revolving debt facility.
Borrowings under Facility A bear interest at the Bank Bill Swap Bid Rate (“BBSY”) plus a margin determined based on the most recent net leverage ratio (as defined per the Australian credit agreement). The margin is to be determined on the first day of the period as follows: (i) 1.10% per annum if the net leverage ratio is less than 1.50 to 1.00; (ii) 1.20% per annum if the net leverage ratio is less than 2.00 to 1.00 and (iii) 1.30% if the net leverage ratio is less than 2.50 to 1.00. Borrowings under Facility B bear interest at the BBSY plus a margin of 0.9% per annum.
The Australian Loans contain financial covenants, which require our Australian subsidiaries to maintain: (i) a net leverage ratio not exceeding 2.50 to 1.00 during the period commencing on the date of the agreement and ending on the first anniversary of the date of the agreement; and 2.00 to 1.00 thereafter; (ii) a working capital coverage ratio (as defined per the Australian credit agreement) greater than 1.75 to 1.00 at all times; and (iii) a gearing ratio (defined as the ratio of senior debt to senior debt plus equity) not to exceed 50%.
63
Long-term Debt Maturities
Future maturities of the face value of long-term debt at December 31, 2017 are as follows:
Years ending December 31, | Future maturities of long-term debt | |||
(dollars in thousands) | ||||
2018 | $ | 16,970 | ||
2019 | 9,670 | |||
2020 | 19,110 | |||
2021 | 127,950 | |||
2022 | 125,010 | |||
Thereafter | 11,690 | |||
Total | $ | 310,400 | ||
10. Derivative Instruments
Foreign Currency Exchange Rate Risk
As of December 31, 2017, the Company was party to forward contracts to hedge changes in foreign currency exchange rates with notional amounts of approximately $23.0 million. The Company uses foreign currency forward contracts to mitigate the risk associated with fluctuations in currency rates impacting cash flows related to certain payments for contract manufacturing in its lower-cost manufacturing facilities. The foreign currency forward contracts hedge currency exposure between the Mexican peso and the U.S. dollar, the Thai baht and the Australian dollar and the U.S. dollar and the Australian dollar and mature at specified monthly settlement dates through December 2018. At inception, the Company designated the foreign currency forward contracts as cash flow hedges. Upon the performance of contract manufacturing or purchase of certain inventories the Company de-designates the foreign currency forward contract.
On October 4, 2016, the Company entered into a cross currency swap arrangement to hedge changes in foreign currency exchange rates. As of December 31, 2017, the notional amount of the cross currency swap was approximately $115.4 million. The Company uses the cross currency swap to mitigate the risk associated with fluctuations in currency rates impacting cash flows related to a non-U.S. denominated intercompany loan of €110.0 million. The cross currency swap hedges currency exposure between the euro and the U.S. dollar and matures on January 3, 2019. The Company makes quarterly principal payments of €1.4 million, plus interest at a fixed rate of 5.4% per annum, in exchange for $1.5 million, plus interest at a fixed rate of 7.2% per annum. At inception, the Company designated the cross currency swap as a cash flow hedge. Changes in the currency rate result in reclassification of amounts from accumulated other comprehensive income (loss) to earnings to offset the re-measurement gain or loss on the non-U.S. denominated intercompany loan.
On August 16, 2017, the Company’s Australian subsidiary entered into a cross currency swap arrangement to hedge changes in foreign currency exchange rates. As of December 31, 2017, the notional amount of the cross currency was approximately $5.9 million. The Australian subsidiary uses the cross currency swap to mitigate the risk associated with fluctuations in currency rates related to a non-functional currency intercompany loan of NZ$10.0 million. The floating-to-floating cross currency swap hedges currency exposure between the New Zealand dollar and the Australian dollar and matures on June 30, 2020. The Australian subsidiary makes quarterly principal payments of NZ$0.8 million, plus interest at the 3-month Bank Bill Benchmark Rate (“BKBM”) in New Zealand plus a margin of .31% per annum, in exchange for A$0.8 million, plus interest at the 3-month BBSY in Australia per annum. At inception, the cross currency swap was not designated as a hedging instrument.
64
Financial Statement Presentation
As of December 31, 2017 and 2016, the fair value carrying amount of the Company’s derivative instruments were recorded as follows:
Asset / (Liability) Derivatives | ||||||||||
Balance Sheet Caption | December 31, 2017 | December 31, 2016 | ||||||||
(dollars in thousands) | ||||||||||
Derivatives designated as hedging instruments | ||||||||||
Foreign currency forward contracts | Prepaid expenses and other current assets | $ | — | $ | 670 | |||||
Foreign currency forward contracts | Accrued liabilities | (670 | ) | (760 | ) | |||||
Cross currency swap | Other assets | — | 5,720 | |||||||
Cross currency swap | Other long-term liabilities | (7,830 | ) | — | ||||||
Total derivatives designated as hedging instruments | (8,500 | ) | 5,630 | |||||||
Derivatives not designated as hedging instruments | ||||||||||
Foreign currency forward contracts | Prepaid expenses and other current assets | 110 | — | |||||||
Foreign currency forward contracts | Accrued liabilities | (90 | ) | (130 | ) | |||||
Cross currency swap | Other assets | 90 | — | |||||||
Total derivatives de-designated as hedging instruments | 110 | (130 | ) | |||||||
Total derivatives | $ | (8,390 | ) | $ | 5,500 | |||||
The following table summarizes the gain or loss recognized in accumulated other comprehensive income (loss) (“AOCI”) and the amounts reclassified from AOCI into earnings and the amounts recognized directly into earnings as of December 31, 2017 and 2016, and for the years ended December 31, 2017, 2016 and 2015.
Amount of Gain (Loss) Recognized in AOCI on Derivative (Effective Portion, net of tax) | Location of Gain (Loss) Reclassified from AOCI into Earnings (Effective Portion) | Amount of Gain (Loss) Reclassified from AOCI into Earnings | ||||||||||||||||||||
As of December 31, | Year ended December 31, | |||||||||||||||||||||
2017 | 2016 | 2017 | 2016 | 2015 | ||||||||||||||||||
(dollars in thousands) | (dollars in thousands) | |||||||||||||||||||||
Derivative instruments | ||||||||||||||||||||||
Foreign currency forward contracts | $ | (660 | ) | $ | (320 | ) | Cost of sales | $ | 940 | $ | (1,620 | ) | $ | (590 | ) | |||||||
Cross currency swap | $ | 270 | $ | (610 | ) | Other expense, net | $ | (15,820 | ) | $ | 7,510 | $ | — | |||||||||
Over the next 12 months, the Company expects to reclassify approximately $0.7 million of pre-tax deferred losses, related to the foreign currency forward contracts, from AOCI to cost of sales as the contract manufacturing and inventory purchases are settled. Over the next 12 months, the Company expects to reclassify approximately $0.4 million of pre-tax deferred gains, related to the cross currency swap, from AOCI to other expense, net as an offset to the re-measurement gains or losses on the non-U.S. denominated intercompany loan.
Derivatives not designated as hedging instruments
The gain or loss resulting from the change in fair value on de-designated forward contracts is reported within cost of sales on the Company’s consolidated statements of income (loss). There was no gain or loss on de-designated derivatives for the year ended December 31, 2017. The gain and loss on de-designated derivatives amounted to $0.3 million and $0.1 million, respectively, for the years ended December 31, 2016 and 2015, respectively. The gain or loss resulting from the change in fair value on the floating-to-floating cross currency swap is recorded within other expense, net on the Company’s consolidated statements of income (loss). The gain on this cross currency swap was $0.1 million for the year ended December 31, 2017.
65
During 2016, the Company entered into forward contracts to acquire a total of €125 million, or $140.0 million, to hedge changes in foreign currency related to the cash portion of the purchase price and debt acquired of the Westfalia Group acquisition. These forward contracts were sold for approximately $140.1 million; the resulting gain of $0.1 million is included within other expense, net in the Company’s consolidated statements of income (loss) for the year ended December 31, 2016. Additionally, the Company purchased a currency option to buy €55.0 million at a specified exchange rate in connection with the Westfalia Group acquisition. Upon entering the agreement the Company paid a premium of approximately $0.9 million. This option was sold for approximately $0.4 million; the resulting loss of $0.5 million is included within other expense, net in the Company’s consolidated statements of income (loss) for the year ended December 31, 2016.
Fair Value Measurements
The fair value of the Company’s derivatives are estimated using an income approach based on valuation techniques to convert future amounts to a single, discounted amount. The Company’s derivatives are recorded at fair value in its consolidated balance sheets and are valued using pricing models that are primarily based on market observable external inputs, including spot and forward currency exchange rates, benchmark interest rates, and discount rates consistent with the instrument’s tenor, and consider the impact of the Company’s own credit risk, if any. Changes in counterparty credit risk are also considered in the valuation of derivative financial instruments. Fair value measurements and the fair value hierarchy level for the Company’s assets and liabilities measured at fair value on a recurring basis as of December 31, 2017 and December 31, 2016 are shown below.
Frequency | Asset / (Liability) | Quoted Prices in Active Markets for Identical Assets (Level 1) | Significant Other Observable Inputs (Level 2) | Significant Unobservable Inputs (Level 3) | ||||||||||||||
(dollars in thousands) | ||||||||||||||||||
December 31, 2017 | ||||||||||||||||||
Foreign currency forward contracts | Recurring | $ | (650 | ) | $ | — | $ | (650 | ) | $ | — | |||||||
Cross currency swaps | Recurring | $ | (7,740 | ) | $ | — | $ | (7,740 | ) | $ | — | |||||||
December 31, 2016 | ||||||||||||||||||
Foreign currency forward contracts | Recurring | $ | (220 | ) | $ | — | $ | (220 | ) | $ | — | |||||||
Cross currency swap | Recurring | $ | 5,720 | $ | — | $ | 5,720 | $ | — | |||||||||
11. Leases
The Company leases certain equipment and facilities under non-cancellable operating leases. Rental expense for the Company totaled approximately $20.0 million in 2017, $16.8 million in 2016 and $15.8 million in 2015.
Minimum payments for operating leases having initial or remaining non-cancellable lease terms in excess of one year at December 31, 2017 are summarized below (in thousands):
December 31, | Minimum payments | |||
(dollars in thousands) | ||||
2018 | $ | 17,020 | ||
2019 | 15,550 | |||
2020 | 14,360 | |||
2021 | 13,180 | |||
2022 | 7,820 | |||
Thereafter | 17,390 | |||
Total | $ | 85,320 | ||
66
12. Earnings per Share
On June 30, 2015, approximately 18.1 million common shares of Horizon Global were distributed to TriMas shareholders in conjunction with the spin-off. For comparative purposes, and to provide a more meaningful calculation for weighted average shares, this amount was assumed to be outstanding as of the beginning of the 2015 period presented in the calculation of basic weighted average shares.
On February 1, 2017, the Company completed an underwritten public offering of 4.6 million shares of common stock, which includes the exercise in full by the underwriters of their option to purchase 0.6 million shares of common stock, at a public offering price of $18.50 per share (the “Common Stock Offering”). Proceeds from the Common Stock Offering were approximately $79.9 million, net of underwriting discounts, commissions, and offering-related transaction costs.
Basic earnings per share is computed using net income attributable to Horizon Global and the number of weighted average shares outstanding. Diluted earnings per share is computed using net income attributable to Horizon Global and the number of weighted average shares outstanding, adjusted to give effect to the assumed exercise of outstanding stock options and warrants, vesting of restricted shares outstanding, and conversion of the Convertible Notes.
Due to net losses for the years ended December 31, 2017 and 2016, the effect of potentially dilutive securities had an antidilutive effect and therefore were excluded from the computation of diluted loss per share.
The following table sets forth the reconciliation of the numerator and the denominator of basic earnings per share attributable to Horizon Global and diluted earnings per share attributable to Horizon Global for the years ended December 31, 2017, 2016 and 2015:
Year Ended December 31, | ||||||||||||
2017 | 2016 | 2015 | ||||||||||
(dollars in thousands, except for per share amounts) | ||||||||||||
Numerator: | ||||||||||||
Net income (loss) attributable to Horizon Global | $ | (3,550 | ) | $ | (12,360 | ) | $ | 8,300 | ||||
Denominator: | ||||||||||||
Weighted average shares outstanding, basic | 24,781,349 | 18,775,500 | 18,064,491 | |||||||||
Dilutive effect of stock-based awards | — | — | 96,361 | |||||||||
Weighted average shares outstanding, diluted | 24,781,349 | 18,775,500 | 18,160,852 | |||||||||
Basic earnings (loss) per share attributable to Horizon Global | $ | (0.14 | ) | $ | (0.66 | ) | $ | 0.46 | ||||
Diluted earnings (loss) per share attributable to Horizon Global | $ | (0.14 | ) | $ | (0.66 | ) | $ | 0.46 | ||||
67
The effect of certain potentially dilutive securities were excluded from the computation of weighted average diluted shares outstanding for years ended December 31, 2017, 2016 and 2015, as inclusion would have resulted in anti-dilution. A summary of these anti-dilutive common stock equivalents is provided in the table below:
Year Ended December 31, | |||||||||
2017 | 2016 | 2015 | |||||||
Number of options | 343,782 | 331,485 | 212,088 | ||||||
Exercise price of options | $9.20 - $11.29 | $9.20 - $11.29 | $9.20 - $11.29 | ||||||
Restricted stock units | 584,335 | 526,751 | — | ||||||
Convertible Notes | 4,566,205 | — | — | ||||||
Warrants | 4,566,205 | — | — | ||||||
For purposes of determining diluted earnings per share, the Company has elected a policy to assume that the principal portion of the Convertible Notes, as described in Note 9, “Long-term Debt,” is settled in cash and the conversion premium is settled in shares. Therefore, the Company has adopted a policy of calculating the diluted earnings per share effect of the Convertible Notes using the treasury stock method. As a result, the dilutive effect of the Convertible Notes is limited to the conversion premium, which is reflected in the calculation of diluted earnings per share as if it were a freestanding written call option on the Company’s shares. Using the treasury stock method, the Warrants issued in connection with the issuance of the Convertible Notes are considered to be dilutive when they are in the money relative to the Company’s average common stock price during the period. The Convertible Note Hedges purchased in connection with the issuance of the Convertible Notes are always considered to be anti-dilutive and therefore do not impact the Company’s calculation of diluted earnings per share.
13. Equity Awards
Description of the Plan
Horizon employees and non-employee directors participate in the Horizon Global Corporation 2015 Equity and Incentive Compensation Plan (as amended and restated, the “Horizon 2015 Plan”). The Horizon 2015 Plan authorizes the Compensation Committee of the Horizon Board of Directors to grant stock options (including “incentive stock options” as defined in Section 422 of the U.S. Internal Revenue Code), restricted shares, restricted stock units, performance shares, performance stock units, cash incentive awards, and certain other awards based on or related to our common stock to Horizon employees and non-employee directors. No more than 2.0 million Horizon common shares may be delivered under the Horizon 2015 Plan.
Stock Options
The following table summarizes Horizon stock option activity from December 31, 2016 to December 31, 2017:
Number of Stock Options | Weighted Average Exercise Price | Average Remaining Contractual Life (Years) | Aggregate Intrinsic Value | ||||||||||
Outstanding at December 31, 2016 | 347,585 | $ | 10.37 | ||||||||||
Granted | — | — | |||||||||||
Exercised | (6,593 | ) | 10.26 | ||||||||||
Canceled, forfeited | (2,643 | ) | 10.08 | ||||||||||
Expired | — | — | |||||||||||
Outstanding at December 31, 2017 | 338,349 | $ | 10.38 | 7.8 | $ | 1,231,917 | |||||||
As of December 31, 2017, there was $0.1 million in unrecognized compensation costs related to stock options that is expected to be recognized over a weighted average period of 0.5 years. The Company recognized approximately $0.3 million, $0.8 million and $0.2 million of stock-based compensation expense related to stock options for the years ended December 31, 2017, 2016 and 2015, respectively. Stock-based compensation expense is included in selling, general and administrative expenses in the accompanying consolidated statements of income.
68
Restricted Units
During 2017, the Company granted an aggregate of 185,423 restricted stock units and performance stock units to certain key employees and non-employee directors. The total grants consisted of: (i) 22,449 time-based restricted stock units that vest ratably on (1) March 1, 2018, (2) March 1, 2019 and (3) March 1, 2020; (ii) 50,416 time-based restricted stock units that vest ratably on (1) March 1, 2018, (2) March 1, 2019, (3) March 1, 2020 and (4) March 1, 2021; (iii) 72,865 market-based performance stock units that vest on March 1, 2020; (iv) 33,426 time-based restricted stock units that vest on July 1, 2018, and (v) 6,267 time-based restricted stock units that vest on July 1, 2019.
The performance criteria for the market-based performance stock units is based on the Company’s total shareholder return (“TSR”) relative to the TSR of the common stock of a pre-defined industry peer group, measured over a period beginning January 1, 2017 and ending December 31, 2019. TSR is calculated as the Company’s average closing stock price for the 20-trading days at the end of the performance period plus Company dividends, divided by the Company’s average closing stock price for the 20-trading days prior to the start of the performance period. Depending on the performance achieved, the amount of shares earned can vary from 0% of the target award to a maximum of 200% of the target award. The Company estimated the grant-date fair value of the awards subject to a market condition using a Monte Carlo simulation model, using the following weighted average assumptions: risk-free interest rate of 1.52% and annualized volatility of 38.5%. Due to the lack of adequate stock price history of Horizon common stock, the expected volatility is based on the historical volatility of the common stock of the peer group. The grant date fair value of the performance stock units was $18.41.
The grant date fair value of restricted stock units is expensed over the vesting period. Restricted stock unit fair values are based on the closing trading price of the Company’s common stock on the date of grant. Changes in the number of restricted stock units outstanding for the year ended December 31, 2017 were as follows:
Number of Restricted Shares | Weighted Average Grant Date Fair Value | ||||||
Outstanding at December 31, 2016 | 557,563 | $ | 11.90 | ||||
Granted | 185,423 | 17.49 | |||||
Vested | (153,086 | ) | 12.52 | ||||
Canceled, forfeited | (7,289 | ) | 12.21 | ||||
Outstanding at December 31, 2017 | 582,611 | $ | 13.51 | ||||
As of December 31, 2017, there was $3.1 million in unrecognized compensation costs related to unvested restricted stock units that is expected to be recognized over a weighted average period of 0.8 years.
The Company recognized approximately $3.3 million, $3.0 million and $2.3 million of stock-based compensation expense related to restricted shares during the years ended December 31, 2017, 2016 and 2015, respectively. Stock-based compensation expense is included in selling, general and administrative expenses in the accompanying consolidated statements of income.
14. Shareholders’ Equity
Preferred Stock
The Company is authorized to issue 100,000,000 shares of Horizon Global preferred stock, par value of $0.01 per share. There were no preferred shares outstanding at December 31, 2017 or December 31, 2016.
Common Stock
The Company is authorized to issue 400,000,000 shares of Horizon Global common stock, par value of $0.01 per share. At December 31, 2017, there were 25,625,571 shares of common stock issued and 24,939,065 shares of common stock outstanding. At December 31, 2016, there were 20,899,959 shares of common stock issued and outstanding.
Share Repurchase Program
In April 2017, the Board of Directors authorized a share repurchase program of up to 1.5 million shares of the Company’s issued and outstanding common stock during the period beginning on May 5, 2017 and ending May 5, 2020 (the “Share Repurchase Program”). The Share Repurchase Program provides for share purchases in the open market or otherwise, depending on share
69
price, market conditions and other factors, as determined by the Company. In addition, the Company’s ABL Faciliy and Replacement Term Loan Amendment place certain limitations on the Company’s ability to repurchase its common stock. As of December 31, 2017, cumulative shares purchased totaled 686,506 at an average purchase price per share of $14.55, excluding commissions. The repurchased shares are presented as treasury stock, at cost, on the consolidated balance sheets.
Accumulated Other Comprehensive Income
Changes in AOCI attributable to Horizon Global by component, net of tax, for the years ended December 31, 2017, 2016, and 2015 are summarized as follows:
Derivative Instruments | Foreign Currency Translation | Total | ||||||||||
(dollars in thousands) | ||||||||||||
Balances at December 31, 2014 | $ | (70 | ) | $ | 7,460 | $ | 7,390 | |||||
Net transfer from former parent | — | 5,230 | 5,230 | |||||||||
Net unrealized losses arising during the period (a) | (1,310 | ) | (9,510 | ) | (10,820 | ) | ||||||
Less: Net realized losses reclassified to net income (b) | (670 | ) | — | (670 | ) | |||||||
Net current-period change | (640 | ) | (4,280 | ) | (4,920 | ) | ||||||
Balances at December 31, 2015 | (710 | ) | 3,180 | 2,470 | ||||||||
Net unrealized gains (losses) arising during the period (a) | 3,170 | (10,590 | ) | (7,420 | ) | |||||||
Less: Net realized gains reclassified to net income (b) | 3,390 | — | 3,390 | |||||||||
Net current-period change | (220 | ) | (10,590 | ) | (10,810 | ) | ||||||
Balances at December 31, 2016 | (930 | ) | (7,410 | ) | (8,340 | ) | ||||||
Net unrealized gains (losses) arising during the period (a) | (8,810 | ) | 17,810 | 9,000 | ||||||||
Less: Net realized losses reclassified to net income (b) | (9,350 | ) | — | (9,350 | ) | |||||||
Net current-period change | 540 | 17,810 | 18,350 | |||||||||
Balances at December 31, 2017 | $ | (390 | ) | $ | 10,400 | $ | 10,010 | |||||
(a) Derivative instruments, net of income tax benefit (expense) of $5.2 million, $(2.5) million, and $0.1 million for the years ended December 31, 2017, 2016, and 2015, respectively. See Note 10, “Derivative Instruments,” for further details.
(b) Derivative instruments, net of income tax benefit (expense) of $5.5 million, $(2.5) million, and $(0.8) million for the years ended December 31, 2017, 2016, and 2015, respectively. See Note 10, “Derivative Instruments,” for further details.
15. Segment Information
Horizon groups its operating segments into reportable segments by the region in which sales and manufacturing efforts are focused. Each operating segment has discrete financial information evaluated regularly by the Company’s chief operating decision maker in determining resource allocation and assessing performance. The Company reports the results of its business in three reportable segments: Horizon Americas, Horizon Europe‑Africa, and Horizon Asia‑Pacific. Horizon Americas is comprised of the Company’s North American and South American operations. Horizon Europe‑Africa is comprised of the European and South African operations, while Horizon Asia‑Pacific is comprised of the Australia, Thailand, and New Zealand operations. See below for further information regarding the types of products and services provided within each reportable segment.
Horizon Americas - A market leader in the design, manufacture and distribution of a wide variety of high-quality, custom engineered towing, trailering and cargo management products and related accessories. These products are designed to support OEMs, OESs, aftermarket and retail customers in the agricultural, automotive, construction, industrial, marine, military, recreational vehicle, trailer and utility end markets. Products include brake controllers, cargo management, heavy-duty towing products, jacks and couplers, protection/securing systems, trailer structural and electrical components, tow bars, vehicle roof racks, vehicle trailer hitches and additional accessories.
Horizon Europe‑Africa - With a product offering similar to Horizon Americas, Horizon Europe‑Africa focuses its sales and manufacturing efforts in the Europe and Africa regions of the world.
70
Horizon Asia‑Pacific - With a product offering similar to Horizon Americas, Horizon Asia‑Pacific focuses its sales and manufacturing efforts in the Asia-Pacific region of the world.
Segment activity is as follows:
Year ended December 31, | ||||||||||||
2017 | 2016 | 2015 | ||||||||||
(dollars in thousands) | ||||||||||||
Net Sales | ||||||||||||
Horizon Americas | $ | 439,700 | $ | 443,240 | $ | 429,310 | ||||||
Horizon Europe‑Africa | 325,970 | 104,080 | 50,930 | |||||||||
Horizon Asia‑Pacific | 127,310 | 101,880 | 95,270 | |||||||||
Total | $ | 892,980 | $ | 649,200 | $ | 575,510 | ||||||
Operating Profit (Loss) | ||||||||||||
Horizon Americas | $ | 44,060 | $ | 38,680 | $ | 30,300 | ||||||
Horizon Europe‑Africa | (1,790 | ) | (13,320 | ) | (100 | ) | ||||||
Horizon Asia‑Pacific | 18,740 | 11,230 | 7,650 | |||||||||
Corporate | (26,250 | ) | (30,290 | ) | (18,280 | ) | ||||||
Total | $ | 34,760 | $ | 6,300 | $ | 19,570 | ||||||
Capital Expenditures | ||||||||||||
Horizon Americas | $ | 10,150 | $ | 5,550 | $ | 5,970 | ||||||
Horizon Europe‑Africa | 13,190 | 4,670 | 690 | |||||||||
Horizon Asia‑Pacific | 2,440 | 3,310 | 1,360 | |||||||||
Corporate | 1,510 | 1,010 | 300 | |||||||||
Total | $ | 27,290 | $ | 14,540 | $ | 8,320 | ||||||
Depreciation and Amortization | ||||||||||||
Horizon Americas | $ | 10,660 | $ | 10,750 | $ | 10,750 | ||||||
Horizon Europe‑Africa | 10,110 | 3,290 | 2,070 | |||||||||
Horizon Asia‑Pacific | 4,310 | 4,090 | 4,130 | |||||||||
Corporate | 260 | 90 | 130 | |||||||||
Total | $ | 25,340 | $ | 18,220 | $ | 17,080 | ||||||
As of December 31, | ||||||||
2017 | 2016 | |||||||
(dollars in thousands) | ||||||||
Total Assets | ||||||||
Horizon Americas | $ | 209,210 | $ | 197,840 | ||||
Horizon Europe - Africa | 341,750 | 299,500 | ||||||
Horizon Asia‑Pacific | 88,210 | 61,920 | ||||||
Corporate | 21,860 | 54,110 | ||||||
Total | $ | 661,030 | $ | 613,370 | ||||
71
The following tables present the Company’s net sales for each of the three years ended December 31, 2017, 2016, and 2015; and net fixed assets at each year ended December 31, 2017 and 2016, attributed to each subsidiary’s continent of domicile. Australia and Germany are the only non-U.S. countries for which net sales were significant to the consolidated net sales of the Company. Australia, Germany, and the United Kingdom are the only countries in which property and equipment - net are significant to the consolidated property and equipment - net of the Company.
Year ended December 31, | ||||||||||||
2017 | 2016 | 2015 | ||||||||||
(dollars in thousands) | ||||||||||||
Net Sales | ||||||||||||
Total U.S. | $ | 423,090 | $ | 428,770 | $ | 412,500 | ||||||
Non-U.S. | ||||||||||||
Australia | 69,760 | 60,020 | 73,640 | |||||||||
Germany | 194,120 | 52,350 | 14,680 | |||||||||
Other Europe | 114,940 | 39,520 | 24,810 | |||||||||
Asia | 58,140 | 41,940 | 21,630 | |||||||||
Africa | 16,320 | 12,130 | 11,440 | |||||||||
Other Americas | 16,610 | 14,470 | 16,810 | |||||||||
Total non-U.S | 469,890 | 220,430 | 163,010 | |||||||||
Total | $ | 892,980 | $ | 649,200 | $ | 575,510 | ||||||
As of December 31, | ||||||||
2017 | 2016 | |||||||
(dollars in thousands) | ||||||||
Property and equipment - net | ||||||||
Total U.S. | $ | 5,770 | $ | 4,700 | ||||
Non-U.S. | ||||||||
Australia | 10,730 | 11,120 | ||||||
Germany | 48,400 | 41,940 | ||||||
United Kingdom | 22,920 | 17,450 | ||||||
Other Europe | 9,830 | 5,690 | ||||||
Asia | 7,720 | 5,220 | ||||||
Africa | 5,260 | 4,970 | ||||||
Other Americas | 2,390 | 2,670 | ||||||
Total non-U.S | 107,250 | 89,060 | ||||||
Total | $ | 113,020 | $ | 93,760 | ||||
The Company’s export sales from the U.S. approximated $34.6 million, $32.6 million and $33.8 million for the years ended 2017, 2016 and 2015, respectively.
72
The following table presents the Company’s net sales contributed by product group for the years ended December 31, 2017, 2016 and 2015.
Year ended December 31, | |||||||||
2017 | 2016 | 2015 | |||||||
Towing | 70.3 | % | 62.7 | % | 58.1 | % | |||
Trailering | 16.8 | % | 21.5 | % | 23.8 | % | |||
Cargo Management | 6.3 | % | 8.9 | % | 9.5 | % | |||
Other | 6.6 | % | 6.9 | % | 8.6 | % | |||
100.0 | % | 100.0 | % | 100.0 | % | ||||
16. Income Taxes
The Company’s income before income taxes, by tax jurisdiction, consisted of the following:
Year ended December 31, | ||||||||||||
2017 | 2016 | 2015 | ||||||||||
(dollars in thousands) | ||||||||||||
Income (loss) before income taxes: | ||||||||||||
Domestic | $ | (3,880 | ) | $ | (14,630 | ) | $ | (9,750 | ) | |||
Foreign | 8,860 | (1,760 | ) | 16,770 | ||||||||
Income (loss) before income taxes | $ | 4,980 | $ | (16,390 | ) | $ | 7,020 | |||||
Current income tax benefit (expense): | ||||||||||||
Federal | $ | (7,680 | ) | $ | (1,170 | ) | $ | 550 | ||||
State and local | (240 | ) | (970 | ) | (610 | ) | ||||||
Foreign | (2,190 | ) | (2,560 | ) | (3,580 | ) | ||||||
Total current income tax expense | (10,110 | ) | (4,700 | ) | (3,640 | ) | ||||||
Deferred income tax benefit (expense): | ||||||||||||
Federal | (3,000 | ) | 3,800 | 3,840 | ||||||||
State and local | (390 | ) | 450 | (40 | ) | |||||||
Foreign | 3,750 | 4,180 | 1,120 | |||||||||
Total deferred income tax benefit | 360 | 8,430 | 4,920 | |||||||||
Income tax benefit (expense) | $ | (9,750 | ) | $ | 3,730 | $ | 1,280 | |||||
73
The components of deferred taxes at December 31, 2017 and 2016 are as follows:
As of December 31, | ||||||||
2017 | 2016 | |||||||
(dollars in thousands) | ||||||||
Deferred tax assets: | ||||||||
Receivables, net | $ | 460 | $ | 1,440 | ||||
Inventories | 3,280 | 6,300 | ||||||
Accrued liabilities and other long-term liabilities | 10,600 | 13,670 | ||||||
Tax loss and credit carryforwards | 12,930 | 6,070 | ||||||
Gross deferred tax asset | 27,270 | 27,480 | ||||||
Valuation allowances | (10,560 | ) | (7,220 | ) | ||||
Net deferred tax asset | 16,710 | 20,260 | ||||||
Deferred tax liabilities: | ||||||||
Property and equipment, net | (4,300 | ) | (5,230 | ) | ||||
Goodwill and other intangibles, net | (19,710 | ) | (30,250 | ) | ||||
Other | (3,280 | ) | (1,140 | ) | ||||
Gross deferred tax liability | (27,290 | ) | (36,620 | ) | ||||
Net deferred tax (liability) asset | $ | (10,580 | ) | $ | (16,360 | ) | ||
The Company has an on-going analysis against certain deferred tax assets in the U.S. Based on positive evidence and economic outlook, the Company maintains it is more likely than not the U.S. deferred tax assets will be realized and therefore does not require a valuation allowance as of December 31, 2017.
The following is a reconciliation of our provision for income taxes to income tax expense computed at the U.S. federal statutory rate:
Year ended December 31, | ||||||||||||
2017 | 2016 | 2015 | ||||||||||
(dollars in thousands) | ||||||||||||
U.S. federal statutory rate | 35 | % | 35 | % | 35 | % | ||||||
Tax at U.S. federal statutory rate | $ | 1,740 | $ | (5,730 | ) | $ | 2,460 | |||||
State and local taxes, net of federal tax benefit | 340 | 340 | 650 | |||||||||
Differences in statutory foreign tax rates | (3,680 | ) | (1,230 | ) | (4,350 | ) | ||||||
Unrecognized tax benefits | (3,950 | ) | (1,260 | ) | (2,950 | ) | ||||||
Tax holiday(1) | (950 | ) | (460 | ) | (1,190 | ) | ||||||
Withholding taxes | 300 | 300 | 590 | |||||||||
Tax credits | (590 | ) | 70 | (300 | ) | |||||||
Net change in valuation allowance | 3,020 | 1,600 | 1,480 | |||||||||
Spin-off related restructuring costs | — | — | 2,450 | |||||||||
Transaction Costs | 1,610 | 2,670 | — | |||||||||
Tax Reform | 11,850 | — | — | |||||||||
Other, net | 60 | (30 | ) | (120 | ) | |||||||
Income tax expense (benefit) | $ | 9,750 | $ | (3,730 | ) | $ | (1,280 | ) | ||||
__________________________
(1) Tax holiday related to Thailand which expired on December 31, 2017.
The Company has recorded deferred tax assets on $0.6 million of various state operating loss carryforwards and $44.9 million of various foreign operating loss carryforwards. The majority of the state tax loss carryforwards expire between 2029 - 2037 and
74
the majority of foreign losses have indefinite carryforward periods.
The Company made cash payments for federal and state income taxes of $1.0 million and $2.2 million for the years ended December 31, 2017 and 2016, respectively. Cash payments made for foreign income taxes of $6.7 million and $2.6 million, for the years ended December 31, 2017 and 2016, respectively.
In general, it is the practice and intention of the Company to reinvest the earnings of its non-U.S. subsidiaries in those operations, that position has not changed following incurring the transition tax under the 2017 Tax Cuts and Jobs Act. No deferred taxes have been provided for withholding taxes or other taxes that would result upon repatriation of our foreign investments to the United States. Furthermore, in light of provisions in the Tax Cuts and Jobs Act (the “Act”), the financial reporting over tax basis in our foreign investments is insignificant as of December 31, 2017.
Unrecognized Tax Benefits
The Company has approximately $7.3 million and $8.9 million of unrecognized tax benefits (“UTBs”) as of December 31, 2017 and 2016, respectively. If the unrecognized tax benefits were recognized, the impact to the Company’s effective tax rate would be to reduce reported income tax expense for the years ended December 31, 2017 and 2016 approximately $7.3 million and $8.9 million, respectively.
A reconciliation of the change in the UTBs and related accrued interest and penalties for the years ended December 31, 2017 and 2016 is as follows:
Unrecognized Tax Benefits | ||||
(dollars in thousands) | ||||
Balance at December 31, 2015 | $ | 4,570 | ||
Tax positions related to current year: | ||||
Additions | 1,690 | |||
Reductions | — | |||
Tax positions related to prior years: | ||||
Additions | 2,870 | |||
Reductions | — | |||
Lapses in the statutes of limitations | (1,120 | ) | ||
Cumulative Translation Adjustment | 840 | |||
Balance at December 31, 2016 | $ | 8,850 | ||
Tax positions related to current year: | ||||
Additions | — | |||
Reductions | — | |||
Tax positions related to prior years: | ||||
Additions | 50 | |||
Reductions | (30 | ) | ||
Settlements | — | |||
Lapses in the statutes of limitations | (2,110 | ) | ||
Cumulative Translation Adjustment | 550 | |||
Balance at December 31, 2017 | $ | 7,310 | ||
The Company recognizes interest accrued related to UTBs and penalties as income tax expense. Related to the unrecognized tax benefits noted above, the Company has accrued penalties and interest of $2.1 million during 2017 and recognized a liability for interest and penalties of $3.4 million as of December 31, 2017. During 2016, the Company has accrued penalties and interest of $(0.2) million and recognized a liability for interest and penalties of $5.6 million.
75
The decrease in UTBs and liabilities for interest and penalties for tax positions related to prior years is primarily related to the roll-off of certain statutes of limitations and changes in currency exchange rates during 2017.
Income tax returns are filed in multiple domestic and foreign jurisdictions, which are subject to examinations by taxing authorities. As of December 31, 2017, the Company is subject to U.S. federal tax examination for tax years 2015 through 2017. The Company is subject to state, local, and foreign income tax examinations for tax years 2010 through 2017. The Company does not believe that the results of these examinations will have a significant impact on the Company’s tax position or its effective tax rate.
Management monitors changes in tax statutes and regulations and the issuance of judicial decisions to determine the potential impact to unrecognized tax benefits. As of December 31, 2017, the Company estimated that approximately $7.4 million of unrecognized tax benefits in foreign jurisdictions is expected to be released in the next twelve months.
Other Matters
On December 22, 2017, the Tax Cuts and Jobs Act (the “Act”) was signed into law. The Act changed many aspects of corporate income taxation, including the reduction of the corporate income tax rate from 35% to 21% and imposition of a one-time tax on deemed repatriated earnings of foreign subsidiaries.
The SEC issued a Staff Accounting Bulletin No. 118 (“SAB 118”), which allows a provisional estimate when a registrant does not have the necessary information available, prepared, or analyzed in reasonable detail to complete the accounting for certain income tax effects of the Act. SAB 118 allows for adjustments to provisional amounts during a measurement period of up to one year. In accordance with SAB 118, the Company has made reasonable estimates related to the liability associated with the transition tax, the remeasurement of U.S. deferred tax balances and other deferred tax adjustments based on provisions of the Act. As a result, the Company has recognized income tax expense of $11.9 million associated with these items in 2017.
The Company is continuing to evaluate how the provisions of the Act will be accounted for under ASC 740, “Income Taxes”. The analysis is provisional and is subject to change due to the additional time required to accurately calculate and review the complex tax law. The Company will assess any regulatory guidance that may be issued which could have an impact on the provisional estimates. The Company will continue to gather information and perform additional analysis on these estimates, including, but not limited to, the amount of earnings and profits subject to the transition tax, the calculation of foreign tax credits, remeasurement of U.S deferred taxes and other deferred tax adjustments until the filing of its associated federal and state income tax returns. Any measurement period adjustments will be reported as a component of provision for incomes taxes in the reporting period the amounts are determined.
76
17. Summary Quarterly Financial Data
Three months ended | ||||||||||||||||
March 31, 2017 | June 30, 2017 | September 30, 2017 | December 31, 2017 | |||||||||||||
(unaudited, dollars in thousands, except for per share data) | ||||||||||||||||
Net sales | $ | 203,280 | $ | 253,590 | $ | 240,120 | $ | 195,990 | ||||||||
Gross profit | $ | 45,390 | $ | 67,670 | $ | 58,420 | $ | 36,120 | ||||||||
Net income (loss) | $ | (10,160 | ) | $ | 19,970 | $ | 6,560 | $ | (21,140 | ) | ||||||
Net income (loss) attributable to Horizon Global | $ | (9,860 | ) | $ | 20,260 | $ | 6,890 | $ | (20,840 | ) | ||||||
Net income (loss) per share attributable to Horizon Global: | ||||||||||||||||
Basic | $ | (0.41 | ) | $ | 0.80 | $ | 0.28 | $ | (0.84 | ) | ||||||
Diluted | $ | (0.41 | ) | $ | 0.79 | $ | 0.27 | $ | (0.84 | ) | ||||||
Three months ended | ||||||||||||||||
March 31, 2016 | June 30, 2016 | September 30, 2016 | December 31, 2016 | |||||||||||||
(unaudited, dollars in thousands, except for per share data) | ||||||||||||||||
Net sales | $ | 146,110 | $ | 167,760 | $ | 151,720 | $ | 183,610 | ||||||||
Gross profit | $ | 37,610 | $ | 45,710 | $ | 42,510 | $ | 34,520 | ||||||||
Net income (loss) | $ | 2,190 | $ | 7,330 | $ | 370 | $ | (22,550 | ) | |||||||
Net income (loss) attributable to Horizon Global | $ | 2,190 | $ | 7,330 | $ | 370 | $ | (22,250 | ) | |||||||
Net income (loss) per share attributable to Horizon Global: | ||||||||||||||||
Basic | $ | 0.12 | $ | 0.40 | $ | 0.02 | $ | (1.07 | ) | |||||||
Diluted | $ | 0.12 | $ | 0.40 | $ | 0.02 | $ | (1.07 | ) | |||||||
18. Subsequent Events
On February 16, 2018, the Company entered into the Fourth Amendment to the Term B Loan (the “2018 Replacement Term Loan Amendment”) to further amend the Original Term B Loan, dated as of June 30, 2015. The 2018 Replacement Term Loan Amendment provides for a new term loan commitment (the “2018 Replacement Term Loan”) in an original aggregate principal amount of $385.0 million, and extended the maturity date to the sixth anniversary of the 2018 Replacement Term Loan Amendment effective date. As a result of the 2018 Replacement Term Loan Amendment, borrowings under the 2018 Replacement Term Loan will bear interest, at the Company’s election, at either (i) the Base Rate plus 4% per annum, or (ii) LIBOR, with a 1% floor, plus 5% per annum. Principal payments required under the 2018 Replacement Term Loan will be approximately $2.4 million per quarter for the first eight quarters following the date the 2018 Replacement Term Loan Amendment becomes effective, and approximately $4.8 million per quarter thereafter.
The proceeds from the 2018 Replacement Term Loan will be used to (i) repay in full the outstanding principal amount of the existing term loans, (ii) to consummate the acquisition of Brink International B.V. and its subsidiaries, expected to close in the second quarter of 2018, and pay a portion of the acquisition consideration thereof and the fees and expenses incurred in connection therewith, and (iii) for general corporate purposes.
77
Item 9. Changes in and Disagreements with Accountants on Accounting and Financial Disclosure
Not applicable.
Item 9A. Controls and Procedures
Evaluation of disclosure controls and procedures
As of the end of the period covered by this Annual Report on Form 10-K, our management carried out an evaluation, under the supervision and with the participation of the Company’s chief executive officer and chief financial officer, of the effectiveness of the design and operation of the Company’s disclosure controls and procedures as defined in Exchange Act Rule 13a-15(e). Based upon that evaluation, the chief executive officer and chief financial officer concluded that the Company’s disclosure controls and procedures were effective as of the end of the period covered by this Annual Report on Form 10-K.
Management’s Annual Report on Internal Control Over Financial Reporting
Management is responsible for establishing and maintaining adequate internal control over financial reporting, as such term is defined in Exchange Act Rules 13a-15(f) and 15d-15(f), for the Company. Under the supervision of the chief executive officer and chief financial officer, management conducted an evaluation of the effectiveness of the Company’s internal control over financial reporting as of December 31, 2017 based on the framework set forth by the Committee of Sponsoring Organizations of the Treadway Commission (COSO) in “Internal Control-Integrated Framework (2013).” Based on its evaluation, management has concluded that the Company’s internal control over financial reporting was effective as of December 31, 2017.
Changes in Internal Control Over Financial Reporting
During the fiscal quarter ended December 31, 2017, the Company implemented a plan that called for modifications and additions to the Company’s internal control over financial reporting related to the accounting for revenue as a result of the new revenue recognition standard, ASU 2014-09, “Revenue from Contracts with Customers (Topic 606)”. Although the new revenue standard is expected to have an immaterial impact on our ongoing net income, the Company is currently modifying and adding new controls designed to address risks associated with recognizing revenue under the new standard. The Company is therefore augmenting internal control over financial reporting as follows:
▪ | Enhancing the risk assessment process to take into account risks associated with the new revenue recognition standard. |
▪ | Adding controls that address risks associated with the five-step model for recording revenue, including the revision of the Company’s contract review controls. |
There were no other changes in the Company’s internal control over financial reporting that occurred during the fiscal quarter ended December 31, 2017, that have materially affected, or is reasonably likely to materially affect, its internal control over financial reporting.
Item 9B. Other Information
Not applicable.
78
PART III
Item 10. Directors, Executive Officers and Corporate Governance
The information required by Item 10 regarding our directors and corporate governance matters is incorporated by reference herein to the proxy statement for the Company’s 2018 Annual Meeting of Stockholders (the “Proxy Statement”) sections entitled “Proposal 1 - Election of Directors” and “Corporate Governance.” The information required by Item 10 regarding our executive officers appears as a supplementary item following Item 4 under Part I of this Annual Report on Form 10-K under the title “Executive Officers of the Company.” The information required by Item 10 regarding compliance with Section 16(a) of the Securities Exchange Act of 1934, as amended, is incorporated by reference herein to the Proxy Statement section entitled “Section 16(a) Beneficial Ownership Reporting Compliance.”
The Spirit and The Letter. Effective as of July 1, 2015, the Board adopted the Company’s code of conduct, titled “The Spirit and The Letter”, that applies to all directors and employees, including the Company’s principal executive officer, principal financial officer, and other persons performing similar executive management functions. The Spirit and The Letter is posted on the Company’s website, www.horizonglobal.com, in the Corporate Governance subsection of the Investor Relations section. All amendments to The Spirit and The Letter, if any, will be also posted on the Company’s website, along with all waivers, if any, of The Spirit and The Letter involving senior officers.
Item 11. Executive Compensation
The information required by Item 11 is incorporated by reference herein to the Proxy Statement section entitled “Executive Compensation.”
Item 12. Security Ownership of Certain Beneficial Owners and Management and Related Stockholder Matters
The information required by Item 12 is incorporated by reference herein to the Proxy Statement section entitled “Security Ownership of Certain Beneficial Owners and Management and Related Stockholder Matters.”
Item 13. Certain Relationships and Related Transactions, and Director Independence
The information required by Item 13 is incorporated by reference herein to the Proxy Statement section entitled “Transactions with Related Persons” and “Corporate Governance”.
Item 14. Principal Accountant Fees and Services
The information required by Item 14 is incorporated by reference herein to the Proxy Statement section entitled “Fees Paid to Independent Auditor.”
79
PART IV
Item 15. Exhibits and Financial Statement Schedules
(a) Listing of Documents
(1) Financial Statements
The Company’s consolidated financial statements included in Item 8 hereof, as required at December 31, 2017 and December 31, 2016, and for the periods ended December 31, 2017, December 31, 2016 and December 31, 2015, consist of the following:
Consolidated Balance Sheets
Consolidated Statements of Income (Loss)
Consolidated Statements of Comprehensive Income (Loss)
Consolidated Statements of Cash Flows
Consolidated Statements of Shareholders’ Equity
Notes to Consolidated Financial Statements
(2) Financial Statement Schedules
Financial Statement Schedule of the Company appended hereto, as required for the periods ended December 31, 2017, December 31, 2016 and December 31, 2015, consists of the following:
Valuation and Qualifying Accounts
All other schedules are omitted because they are not applicable, not required, or the information is otherwise included in the financial statements or the notes thereto.
80
(3) Exhibits
Exhibits Index:
2.1(c)* | |
2.2(i)* | |
2.3* | |
3.1(d) | |
3.2(b) | |
4.1(j) | |
4.2(j) | |
10.1(c) | |
10.2(c) | |
10.3(c) | |
10.4(c) | |
10.5(c) | |
10.6(f) | |
10.7(f) | |
10.8(i) | |
10.9(l) | |
10.10(c) | |
10.11(i) | |
10.12(l) | |
10.13(k)* | |
10.14(d)** | |
II-1
10.15(e)** | |
10.16(a) | |
10.17(e)** | |
10.18(e)** | |
10.19(e)** | |
10.20(e)** | |
10.21(e)** | |
10.22(e)** | |
10.23(e)** | |
10.24(g)** | |
10.25(g)** | |
10.26(g)** | |
10.27(g)** | |
10.28(g)** | |
10.29(h)** | |
10.30(i) | |
10.31(j) | |
10.32(j) | |
10.33(j) | |
10.34(j) | |
10.35(j) | |
10.36(j) | |
10.37(j) | |
10.38(j) | |
10.39(j) | |
10.40(j) | |
10.41(j) | |
10.42(j) | |
21.1 | |
23.1 | |
II-2
31.1 | |
31.2 | |
32.1 | |
32.2 | |
101.INS | XBRL Instance Document. |
101.SCH | XBRL Taxonomy Extension Schema Document. |
101.CAL | XBRL Taxonomy Extension Calculation Linkbase Document. |
101.DEF | XBRL Taxonomy Extension Definition Linkbase Document. |
101.LAB | XBRL Taxonomy Extension Label Linkbase Document. |
101.PRE | XBRL Taxonomy Extension Presentation Linkbase Document. |
_________________________
(a) | Incorporated by reference to the Exhibits filed with our Registration Statement on Form S-1 filed on March 31, 2015 (Reg. No. 333-203138). | |
(b) | Incorporated by reference to the Exhibits filed with our Registration Statement on Form S-1/A filed on June 11, 2015 (Reg. No. 333-203138). | |
(c) | Incorporated by reference to the Exhibits filed with our Current Report on Form 8-K filed on July 6, 2015 (File No. 001-37427). | |
(d) | Incorporated by reference to the Exhibits filed with our Quarterly Report on Form 10-Q filed on August 11, 2015 (File No. 001-37427). | |
(e) | Incorporated by reference to the Exhibits filed with our Quarterly Report on Form 10-Q filed on November 10, 2015 (File No. 001-37427). | |
(f) | Incorporated by reference to the Exhibits filed with our Current Report on Form 8-K filed on December 23, 2015 (File No. 001-37427). | |
(g) | Incorporated by reference to the Exhibits filed with our Quarterly Report on Form 10-Q filed on May 3, 2016 (File No. 001-37427). | |
(h) | Incorporated by reference to the Exhibits filed with our Current Report on Form 8-K filed on May 23, 2016 (File No. 001-37427). | |
(i) | Incorporated by reference to the Exhibits filed with our Current Report on Form 8-K filed on October 11, 2016 (File No. 001-37427). | |
(j) | Incorporated by reference to the Exhibits filed with our Current Report on Form 8-K filed on February 1, 2017 (File No. 001-37427). | |
(k) | Incorporated by reference to the Exhibits filed with our Current Report on Form 8-K filed on April 6, 2017 (File No. 001-37427). | |
(l) | Incorporated by reference to the Exhibits filed with our Annual Report on Form 10-K filed on March 10, 2017 (File No. 001-37427). | |
* Certain exhibits and schedules were omitted in the original filing pursuant to Item 601(b)(2) of Regulation S-K, and the Company agrees to furnish supplementally to the Securities and Exchange Commission a copy of any omitted exhibits and schedules upon request.
** Management contracts and compensatory plans or arrangement required to be filed as an exhibit pursuant Item 15(b) of Form 10-K.
II-3
Item 16. Form 10-K Summary
None.
II-4
SIGNATURES
Pursuant to the requirements of Section 13 or 15(d) of the Securities Exchange Act of 1934, the Registrant has duly caused this report to be signed on its behalf by the undersigned, thereunto duly authorized.
HORIZON GLOBAL CORPORATION (Registrant) | |||||
BY: | /s/ A. MARK ZEFFIRO | ||||
DATE: | March 1, 2018 | Name: A. Mark Zeffiro Title: President and Chief Executive Officer | |||
Pursuant to the requirements of the Securities Exchange Act of 1934, this Report has been signed below by the following persons on behalf of the Registrant and in the capacities and on the dates indicated.
Name | Title | Date | ||
/s/ A. MARK ZEFFIRO | President and Chief Executive Officer and Director | March 1, 2018 | ||
A. Mark Zeffiro | (Principal Executive Officer) | |||
/s/ DAVID G. RICE | Chief Financial Officer | March 1, 2018 | ||
David G. Rice | (Principal Financial and Accounting Officer) | |||
/s/ DENISE ILITCH | Chair of the Board of Directors | March 1, 2018 | ||
Denise Ilitch | ||||
/s/ DAVID C. DAUCH | Director | March 1, 2018 | ||
David C. Dauch | ||||
/s/ RICHARD L. DEVORE | Director | March 1, 2018 | ||
Richard L. DeVore | ||||
/s/ SCOTT G. KUNSELMAN | Director | March 1, 2018 | ||
Scott G. Kunselman | ||||
/s/ RICHARD D. SIEBERT | Director | March 1, 2018 | ||
Richard D. Siebert | ||||
/s/ SAMUEL VALENTI III | Director | March 1, 2018 | ||
Samuel Valenti III | ||||
II-5
SCHEDULE II
PURSUANT TO ITEM 15(a)(2)
OF FORM 10-K VALUATION AND QUALIFYING ACCOUNTS FOR THE YEARS ENDED
December 31, 2017, 2016 AND 2015
(Dollars in thousands)
ADDITIONS | ||||||||||||||||||||
DESCRIPTION | BALANCE AT BEGINNING OF PERIOD | CHARGED TO COSTS AND EXPENSES | CHARGED (CREDITED) TO OTHER ACCOUNTS(1) | DEDUCTIONS(2) | BALANCE AT END OF PERIOD | |||||||||||||||
Allowance for doubtful accounts deducted from accounts receivable in the balance sheet | ||||||||||||||||||||
Year ended December 31, 2017 | $ | 3,810 | $ | 640 | $ | (1,340 | ) | $ | 10 | $ | 3,100 | |||||||||
Year ended December 31, 2016 | $ | 2,960 | $ | 910 | $ | 50 | $ | 110 | $ | 3,810 | ||||||||||
Year ended December 31, 2015 | $ | 3,230 | $ | 470 | $ | 320 | $ | 1,060 | $ | 2,960 | ||||||||||
______________
(1) Allowance of companies acquired, and other adjustments, net.
(2) Deductions, representing uncollectible accounts written-off, less recoveries of amounts written-off in prior years.
II-6