Attached files
| file | filename |
|---|---|
| 8-K - 8-K - ZIONS BANCORPORATION, NATIONAL ASSOCIATION /UT/ | a20150803-8xkxcoverpagexmi.htm |
2015 Mid-Cycle Stress Test Dodd-Frank Act Company-Run Stress Test Disclosure July 24, 2015

Introduction Zions Bancorporation (“the Company” or “Zions”) is one of the nation’s premier financial services companies, consisting of a collection of great banks in select western U.S. markets with combined total assets exceeding $57 billion. Zions operates its banking businesses under local management teams and community identities in 11 western and southwestern states: Arizona, California, Colorado, Idaho, Nevada, New Mexico, Oregon, Texas, Utah, Washington and Wyoming. The Company is a national leader in Small Business Administration lending and public finance advisory services and is a consistent recipient of numerous Greenwich Excellence awards in banking. In addition, Zions is included in the S&P 500 and NASDAQ Financial 100 indices. In accordance with section 165(i)(2) of the Dodd-Frank Wall Street Reform and Consumer Protection Act (“Dodd-Frank Act”) and the implementation of this act under 12 CFR 252.148, Bank Holding Companies (BHC’s) with total consolidated assets of $50 billion or more (“Covered Companies”) are required to submit semi-annually stress tests, and also participate annually in the Comprehensive Capital Analysis and Review (CCAR) as conducted by Federal Reserve. In November 2011, the Federal Reserve issued a final ruling requiring a Covered Company to submit a capital plan (“Capital Plan”) for objection or non- objection as part of the CCAR process. The proposed capital actions in the Capital Plan are presented on a pro-forma basis with forward-looking projections of revenues, expenses, and losses through several baseline and stressed macroeconomic scenarios. The process and results of these stress tests are used by Zions and the Federal Reserve to evaluate the financial condition, risk profile, and capital adequacy of the Company, and assess the proposed Capital Plan, under adverse economic conditions. The following is a disclosure of the results of the stress test of Zions Bancorporation. Included is a discussion of the macroeconomic scenarios, a summary of results, risks accounted for, and methodologies used in development of the stress test. The quantitative output included herein should not be viewed as forecasts of expected outcomes of capital ratios or as a measure of the Company’s solvency or actual financial performance or condition. Macroeconomic Scenario It is important to note that the hypothetical scenario developed by Zions and used in the Company-run stress test differs significantly from the Severely Adverse scenario provided by the Federal Reserve for use in CCAR 2015 and the associated Dodd-Frank Act stress test; the scenario used was designed by Zions to be even more severe than the Federal Reserve’s assumptions and contains assumptions designed to test and analyze risks that are unique to Zions. The Company’s Board of Directors approved the scenario as an appropriate test to demonstrate the Company’s ability to withstand a deep and severe economic scenario and maintain a significant level of excess capital. In developing its internal severely adverse macroeconomic scenario, Zions incorporates multiple variables, including the unemployment rate, various measures of domestic output (e.g., gross domestic product), home price indices (HPI), commercial real estate price indices, capital markets price changes, and many others. Interest rate projections include overnight federal funds rate, LIBOR, swap rates, and mortgage rates, among others. The variables selected demonstrate a relatively strong correlation with historical financial results. The scenarios are hypothetical and are assumed to begin on March 31, 2015; in the Severely Adverse scenario, the most sensitive assumptions include: • A decline in various interest rate indices; for example, the US 10-year Treasury rate declines to 1.83% from 2.25% • A significant widening of credit spreads, using an index of bonds rated Baa2 by Moody’s, to 4.64% from 2.56% • A sharp increase in unemployment to 10.23% from the recent 5.63%
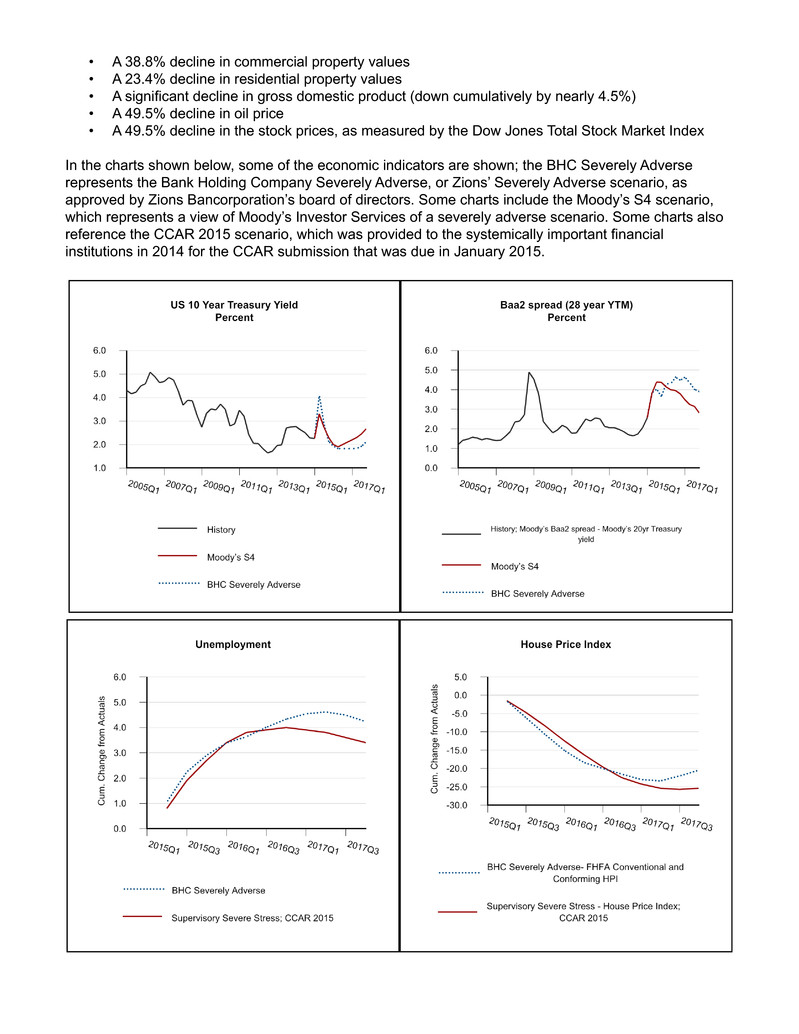
• A 38.8% decline in commercial property values • A 23.4% decline in residential property values • A significant decline in gross domestic product (down cumulatively by nearly 4.5%) • A 49.5% decline in oil price • A 49.5% decline in the stock prices, as measured by the Dow Jones Total Stock Market Index In the charts shown below, some of the economic indicators are shown; the BHC Severely Adverse represents the Bank Holding Company Severely Adverse, or Zions’ Severely Adverse scenario, as approved by Zions Bancorporation’s board of directors. Some charts include the Moody’s S4 scenario, which represents a view of Moody’s Investor Services of a severely adverse scenario. Some charts also reference the CCAR 2015 scenario, which was provided to the systemically important financial institutions in 2014 for the CCAR submission that was due in January 2015.


Summary of Results The following data are the stress test results submitted by Zions in its 2015 mid-cycle stress test submission for the BHC Severely Adverse scenario. These results represent estimates of Zions’ capital as of 2Q17 under this scenario, although this scenario is considered highly unlikely to occur. As such, these estimates do not represent forecasts of expected results. The economic assumptions used to arrive at these results involve an economic outcome that is significantly more adverse than current market expectations for the economy generally or for Zions specifically. Projected Capital Ratios as of June 30, 2017 in the BHC Severely Adverse scenario1 BHC Severely Adverse Stress Scenario Starting point for Mid-Cycle Stress Test As of June 30, 2017 Minimum ratio during projection period Tier 1 Common Capital Ratio 12.1% 8.0% 8.0% Common Equity Tier 1 Ratio 12.0% 8.0% 8.0% Tier 1 Leverage Ratio 11.8% 6.9% 6.9% Tier 1 Capital Ratio 14.2% 9.3% 9.3% Total Risk-Based Capital Ratio 16.2% 11.5% 11.5% Projected loan losses by category March 31, 2015 through June 30, 2017 in the BHC Severely Adverse scenario (in billions) Cumulative Amount Loss Rates, not annualized Loan Losses $1.80 4.5% Domestic closed-end first-lien mortgages 0.12 2.0% Domestic junior lien mortgages and home equity lines of credit 0.06 2.5% Commercial and industrial 0.49 4.1% Commercial real estate 1.05 6.2% Credit card exposures 0.01 6.4% Other consumer 0.02 5.2% Other loans 0.05 2.7% 1 A Tier 1 Common Capital Ratio number for the starting point of the 9-quarter period was calculated as an estimate for illustrative purposes. Zions has not published an official Tier 1 Common Capital Ratio since General Risk-Based Capital Rules were replaced on December 31, 2014. Subsequent to conducting the stress test , the Company provided updated information on 2015.Q1 capital ratios during its Q2 earnings call. The estimated 3/31 capital ratios for (subject to change) Common equity tier 1 Capital, Tier 1 Leverage, Tier 1 risk- based capital, and Total risk-based capital were 11.8%, 11.8%, 13.9%, and 16.0%, respectively.

Earnings Impact on Regulatory Capital March 31, 2015 through June 30, 2017 in the BHC Severely Adverse scenario (in billions) Cumulative 9-Quarter Amount Net Interest Income $4.08 Plus: Non-Interest Income 0.97 Less: Operational Risk Expense 0.09 OREO Expense 0.20 Other Noninterest Expense 4.12 Equals: Pre-provision net revenue (PPNR) 0.64 Less: Provision for loan and lease losses 2.56 Trading and counterparty losses — Realized losses/(gains) on AFS/HTM securities 0.17 Equals: Net Income before taxes and extraordinary items (1) (2.09) Income tax benefit (0.17) Total Impact on Regulatory Capital from Net Income (1.92) Goodwill impairment (2) 1.01 (1) Excludes goodwill impairment charges (2) No impact to regulatory capital In the Severely Adverse scenario, the Company’s capital position declines significantly from the impact of the following: Loan loss provision During 2014, the Company recorded a negative provision for loan losses of $98 million. In the BHC Severely Adverse scenario, the Company modeled an annualized provision of $1.1 billion, or a cumulative $2.6 billion for the nine-quarter scenario period. Such modeled provisions were primarily attributable to modeled net loan losses of $1.8 billion, or an annualized $802 million. This compares to actual 2014 net charge-offs of only $42 million. Securities Losses Zions eliminated the risk inherent in its CDO portfolio by selling all remaining securities during 2015.Q2, resulting in a realization of an actual pre-tax loss on sale of $137 million. This loss exceeds stress projections of other-than-temporary impairment (OTTI) that Zions calculated in its CCAR 2015 Submission and therefore has a negative impact on projected capital levels compared to that submission. Pre-Provision Net Revenue (PPNR) Zions’ PPNR for 2014 was $499 million (adjusts income before taxes by including the effect of the provision for loan losses and net losses on securities). Adjusted for the favorable impact of the
cancellation of its Total Return Swap (related to Zions’ CDO portfolio) and debt extinguishment costs, the adjusted PPNR for 2014 would have been $552 million, or a nine-quarter equivalent $1.2 billion. Under the Mid-Cycle Company-run hypothetical Severely Adverse scenario, Zions’ PPNR equaled an annualized $284 million or $640 million for the nine-quarter period, which reflected: • Higher net interest income attributable to higher spreads in loan pricing and reduced interest expense from sub debt maturity. In 2014, Zions recorded net interest income of $1.7 billion; under the BHC Severely Adverse scenario, Zions projected annualized net interest income of $1.8 billion. Zions projected that while loan balances would decline materially under a severe adverse stress scenario, interest income on loans would initially improve due to widening spreads, but would then start to decline due to the shrinking portfolio. By the end of 2015, Zions will also allow approximately $235 million in subordinated debt to mature without refinancing or re-issuing the debt. • Lower noninterest income. Excluding net impairment losses on investment securities in 2014, Zions realized $485 million of noninterest income. In the BHC Severely Adverse scenario, Zions projected annualized noninterest income of $433 million, showing a slight decline from the current run rate under adverse economic conditions. • Higher noninterest expenses. In 2014, excluding other real estate owned and credit-related expenses and debt extinguishment expenses, Zions recognized $1.6 billion of noninterest expenses. Under the BHC Severely Adverse scenario, Zions projected annualized noninterest expense, excluding those same items, of $1.8 billion, showing an increase in expenses from the current run rate under adverse economic conditions. • Higher other real estate owned and credit-related expenses. Compared to the $27 million of expense recognized in 2014, Zions estimated such expenses would run an annualized $150 million during the 9-quarter period, primarily reflecting higher credit related expenses due to an adverse economic conditions. Deferred Tax Asset (DTA) The disallowance of the DTA is triggered by hypothetical earnings losses under severely adverse scenarios, and is driven primarily by high provisions for loan losses, securities impairment charges, and changes in AOCI. The DTA valuation allowance in the BHC Severely Adverse scenario was projected to be $632 million. Additionally, hypothetical projected losses subsequent to the DTA disallowance affected the Company significantly more than would be expected under a milder economic scenario, wherein the DTA would not grow as rapidly and therefore would not likely be subject to disallowance or impairment. Risk-Weighted Assets In accordance with the loan losses discussed above, overall loan balances declined by $1.7 billion. Loan balances and the sale of highly risk-weighted CDOs were the primary contributors to the decline in risk weighted assets from $46.4 billion to $42.3 billion over the forecast period. Capital Actions Zions’ mid-cycle stress test included proposed capital actions that were contained in its 2015 CCAR submission, such as modest dividend increases.Were capital actions to be removed, there would have been an immaterial increase to capital ratios.

Significant Drivers of Changes to the Projected Tier 1 Common Ratio under the Zions’ Severely Adverse Scenario The chart below shows material impacts to earnings including the provision for loan and lease losses ($2.6B), partially offset by $640MM of pre-provision net revenue. Risks Zions administers its Company-run stress tests through its Capital Adequacy Process (CAP). The CAP identifies and quantifies the Company’s material risks under different hypothetical risk events prescribed by the Zions Severely Adverse Scenario. Zions considers all risks in stress testing that have been determined to be material based upon sensitivity analysis; in addition it has considered whether certain risks deemed individually to be immaterial could collectively be material. These risks range from idiosyncratic risks (geographical footprint and industry concentrations in credit portfolios) to broad economic, political, regulatory, and compliance risks that Zions believes could impact the Company. Zions’ stress testing models and other estimation techniques attempt to capture substantially all of these risks and their potential effects on the performance of the bank’s portfolios and revenue generating activities. Credit risk includes obligor default risk, counterparty credit risk, guarantor non-performance, credit risk of securities held, and collateral management risk. Zions believes credit risk is its primary risk. Zions’ business is subject to periodic fluctuations based on national, regional and local economic conditions. These fluctuations are not predictable, cannot be controlled, and may have a material adverse impact on Zions’ operations and financial condition even if other favorable events occur. Zions’ banking operations are locally oriented and predominantly community-based. Accordingly, Zions is dependent on local business conditions as well as conditions in the local residential and commercial real estate markets it serves. For example, an increase in unemployment, a decrease in real estate values or increases in interest rates, as well as other factors, could weaken the economies of the communities Zions serves. Weakness in Zions’ market area could depress its earnings and its financial condition. Any of the above scenarios could require Zions to charge off a higher percentage of loans and/or increase provisions for credit losses, which would reduce Zions’ net income. For example, while the
credit conditions that Zions experienced from 2007 through 2010 have improved considerably, the challenges in the economy still present credit deterioration risks for Zions in light of the slow pace of general economic recovery. Any further credit deterioration would result in increased loan charge-offs and higher provisions for credit losses, which would negatively impact Zions’ net income. There continues to be concern regarding the possibility of a return to recessionary conditions, as well as increased turmoil or volatility in the financial system. A systemic lack of available credit, a lack of confidence in the financial sector, continued volatility in the financial markets and/or reduced business activity could have a materially adverse effect on Zions’ business, financial condition and results of operations. Market risk includes risk arising from changes in interest rate levels, equity prices, commodity prices, and credit spreads. Zions’ earnings and financial condition are largely dependent on net interest income, which is the difference between interest earned from loans and investments and interest paid on deposits and borrowings. The narrowing of interest rate spreads could adversely affect Zions’ earnings and financial condition. Zions cannot control or predict changes in interest rates. Regional and local economic conditions, competitive pressures and the policies of regulatory authorities, including monetary policies of the Board of Governors of the Federal Reserve System, affect interest income and interest expense. Zions has ongoing policies and procedures designed to manage the risks associated with changes in market interest rates; however, changes in interest rates still may have an adverse effect on Zions’ profitability. For example, high interest rates could adversely affect Zions’ mortgage banking business as clients would apply for fewer mortgages; higher interest rates may also increase credit risk. Funding/liquidity risk may arise from such things as the inability to access funding sources (e.g., deposits), funding maturity mismatches, off-balance sheet commitments, deteriorating earnings performance, public or market perception, and obstacles to cash movement among subsidiaries. Liquidity is essential to Zions’ businesses. Market disruption and volatility could materially impair Zions’ ability to access capital and funding. Economic losses sustained as a result of market disruption or poor general economic conditions would likely lead to higher loan and securities losses and reduced fee income, primarily from slower economic activity. General economic condition risk results from changes in national, regional and local economic conditions and deterioration in the geographic and financial markets in which Zions operates. These could lead to higher loan charge-offs, deposit run-off, reduced fee income and higher operating costs, which would reduce Zions’ net income level and growth. Operational risk includes such things as internal fraud; external fraud; inadequate employment practices and workplace safety; inability to meet some contractual and/or fiduciary obligations; damage to physical assets; business disruption and/or systems failures; failures in execution, delivery, and process management. Legal and compliance risk includes such things as capital management and stress testing regulations; failure to comply with laws, rules, regulations, or accounting and financial reporting laws; prescribed practices; internal policies and procedures; exposure to litigation; failure to identify and properly communicate regulatory and legal requirements; and situations where the laws or rules may be ambiguous or untested. Reputational risk includes such things as unethical or deceptive business practices; high-profile litigation; poor financial performance; violations of laws, regulations, or controls (e.g., conflicts of interest); customer dissatisfaction and complaints (e.g., privacy breach); and public communication.
Strategic risk includes such things as adverse business decisions; poor implementation of business decisions; and lack of responsiveness to changes in the industry and operating environment. Model (including data) risk includes such things as fundamental errors leading to inaccurate model output and incorrect or inappropriate model usage. Methodologies The Company projects the impact of its key exposures and material risks in three Company-defined scenarios using a variety of modeling techniques. Methodologies used include: 1. The Company models credit losses using separate loan-level loss models for Commercial & Industrial (C&I) including small business, residential real estate (RRE), and commercial real estate (CRE); portfolio level models for other loan categories including auto and credit card; credit and prepayment models for CDO TruPS, municipal securities, and Small Business Administration securities; and the counterparty credit risk model. 2. Market risk is captured through interest rates used in PPNR models; equity prices through PPNR and credit models, and the private equity model; energy commodity prices are indirectly stressed through specific sector employment in the C&I model; credit spreads impact the loan growth and pricing models; and real estate prices are used in PPNR, CRE, RRE, and C&I models. 3. Liquidity risk is measured through liquidity stress test scenarios and the parent liquidity model; asset/liability model; unfunded commitments included in credit loss models; earnings impacts through PPNR projections; capital buffers; and affiliate liquidity levels. 4. Operational risk is captured in scenario analysis as well as through an operational loss model. 5. Legal risk is captured through scenario analysis, the operational loss model, and specific litigation expense buffers. 6. Reputational and strategic risks are difficult to quantify; however, their potential impacts on capital are quantified using scenario analysis and other techniques. 7. Model risk is captured through a model risk buffer. Forward-Looking Statement This disclosure contains statements relating to a stress test and analysis undertaken by Zions Bancorporation pursuant to regulatory requirements. The stress test results are based upon the hypothetical impact of assumed future economic conditions on our capital, financial condition, and earnings under certain financial models. The stress test results are not intended to reflect our expectations about actual future conditions. Factors that might cause our understanding of the stress test results to change include detailed analyses of the multiple factors involved in the stress test and changes to the underlying economic assumptions that drive the stress test results. Accordingly, the statements contained in this disclosure are based on facts and circumstances as understood by management of the Company on the date of this disclosure, which may change in the future. Except as required by law, Zions disclaims any obligation to update any statements or to publicly announce the results of any revisions to any of the forward-looking statements included herein to reflect future events, developments, determinations, or understandings.
