Attached files
| file | filename |
|---|---|
| EX-99.1 - EXHIBIT 99.1 - United Financial Bancorp, Inc. | ex991earningspresentatio.htm |
| 8-K/A - 8-K/A - United Financial Bancorp, Inc. | a8-kasubmissionxkbwconfere.htm |
Create Your Balance NASDAQ: UBNK KBW 2015 Community Bank Investor Conference
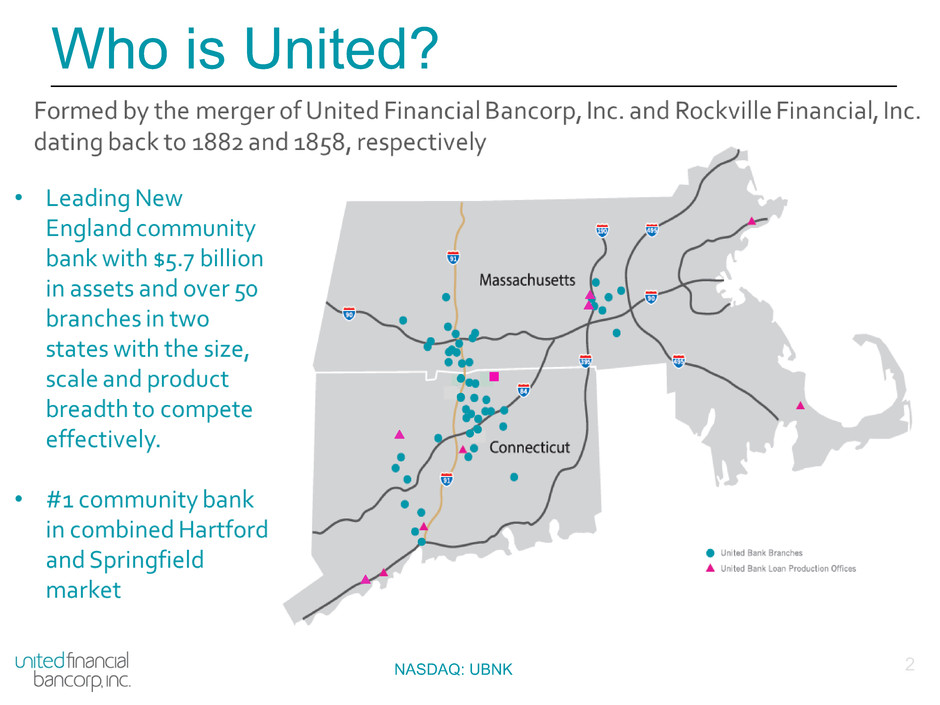
2 Who is United? NASDAQ: UBNK
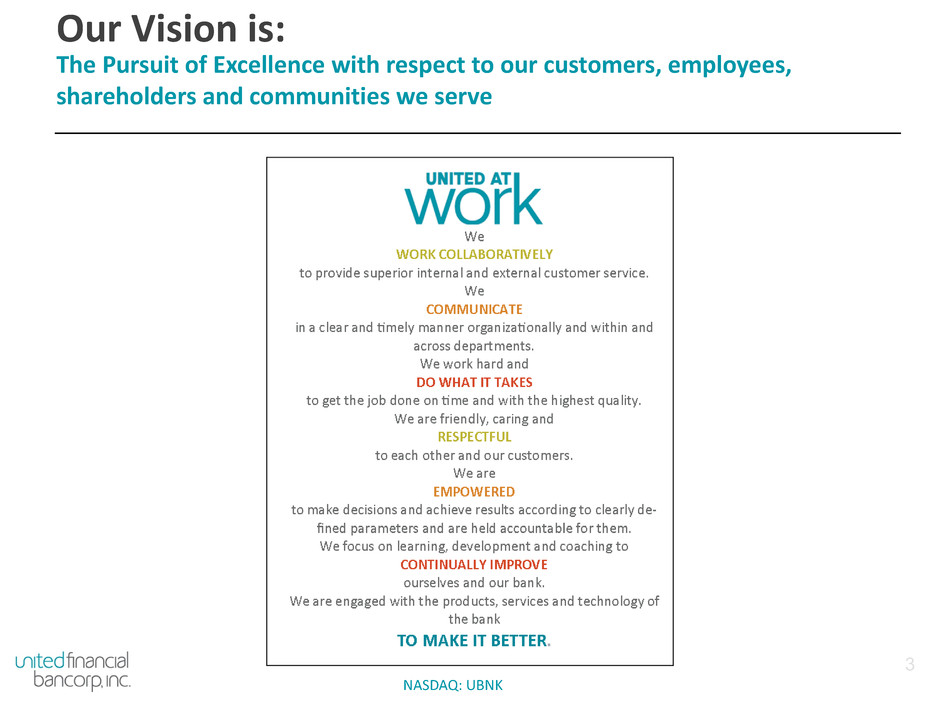
Our Vision is: The Pursuit of Excellence with respect to our customers, employees, shareholders and communities we serve NASDAQ: UBNK 3
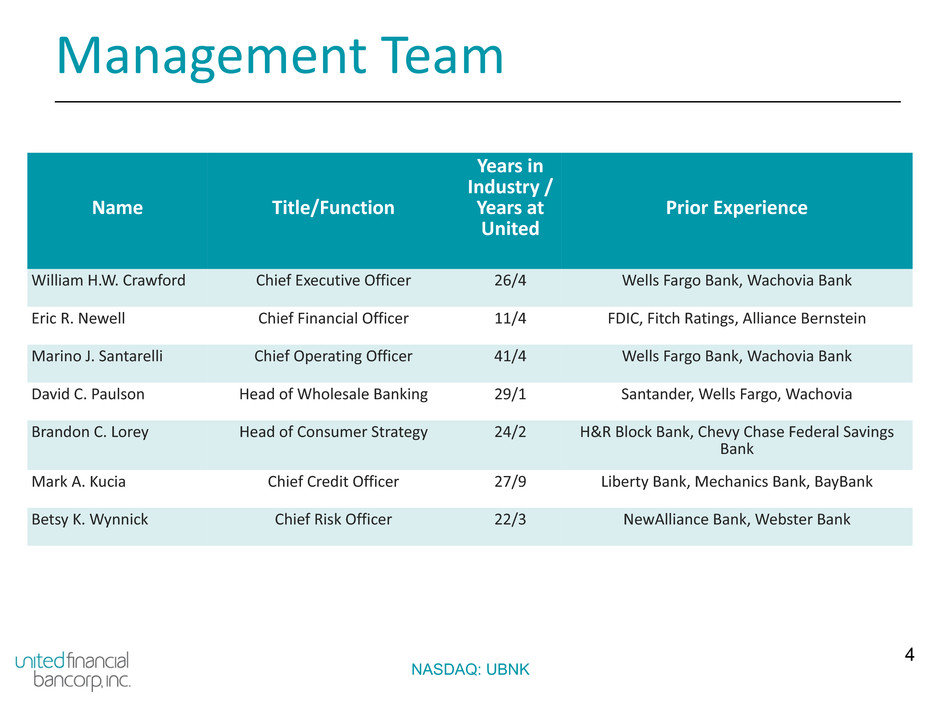
4 Management Team Name Title/Function Years in Industry / Years at United Prior Experience William H.W. Crawford Chief Executive Officer 26/4 Wells Fargo Bank, Wachovia Bank Eric R. Newell Chief Financial Officer 11/4 FDIC, Fitch Ratings, Alliance Bernstein Marino J. Santarelli Chief Operating Officer 41/4 Wells Fargo Bank, Wachovia Bank David C. Paulson Head of Wholesale Banking 29/1 Santander, Wells Fargo, Wachovia Brandon C. Lorey Head of Consumer Strategy 24/2 H&R Block Bank, Chevy Chase Federal Savings Bank Mark A. Kucia Chief Credit Officer 27/9 Liberty Bank, Mechanics Bank, BayBank Betsy K. Wynnick Chief Risk Officer 22/3 NewAlliance Bank, Webster Bank NASDAQ: UBNK
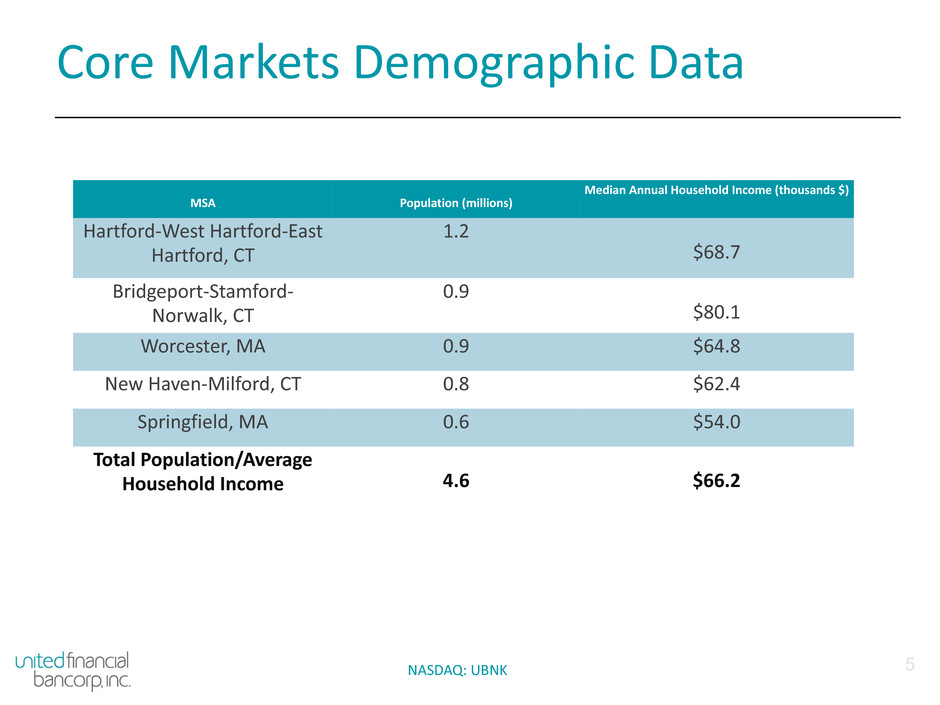
5 Core Markets Demographic Data NASDAQ: UBNK MSA Population (millions) Median Annual Household Income (thousands $) Hartford-West Hartford-East Hartford, CT 1.2 $68.7 Bridgeport-Stamford- Norwalk, CT 0.9 $80.1 Worcester, MA 0.9 $64.8 New Haven-Milford, CT 0.8 $62.4 Springfield, MA 0.6 $54.0 Total Population/Average Household Income 4.6 $66.2
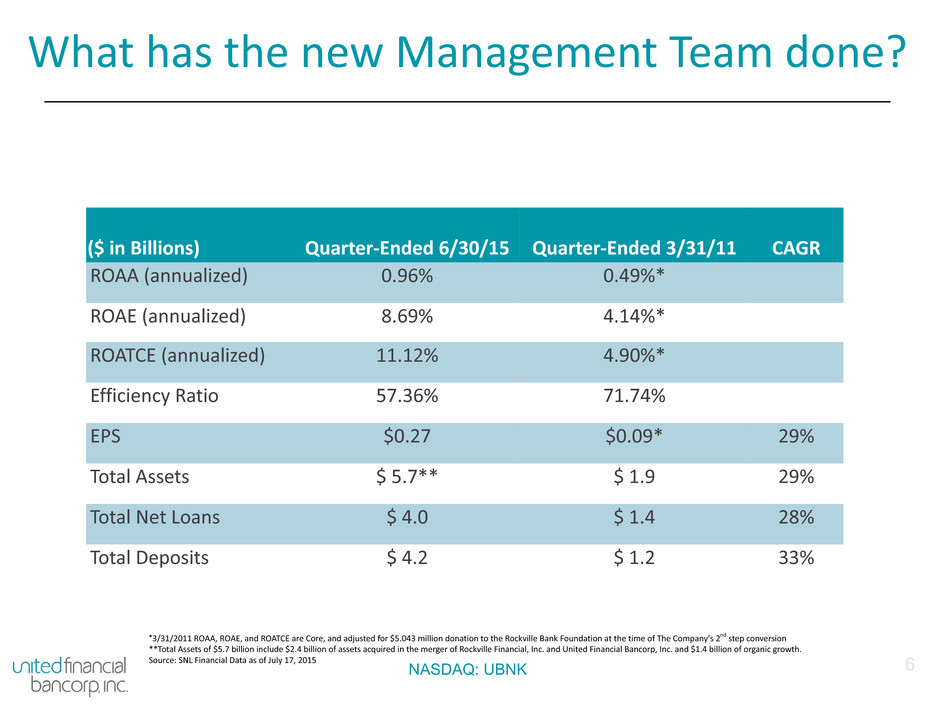
What has the new Management Team done? *3/31/2011 ROAA, ROAE, and ROATCE are Core, and adjusted for $5.043 million donation to the Rockville Bank Foundation at the time of The Company’s 2nd step conversion **Total Assets of $5.7 billion include $2.4 billion of assets acquired in the merger of Rockville Financial, Inc. and United Financial Bancorp, Inc. and $1.4 billion of organic growth. Source: SNL Financial Data as of July 17, 2015 ($ in Billions) Quarter-Ended 6/30/15 Quarter-Ended 3/31/11 CAGR ROAA (annualized) 0.96% 0.49%* ROAE (annualized) 8.69% 4.14%* ROATCE (annualized) 11.12% 4.90%* Efficiency Ratio 57.36% 71.74% EPS $0.27 $0.09* 29% Total Assets $ 5.7** $ 1.9 29% Total Net Loans $ 4.0 $ 1.4 28% Total Deposits $ 4.2 $ 1.2 33% NASDAQ: UBNK 6
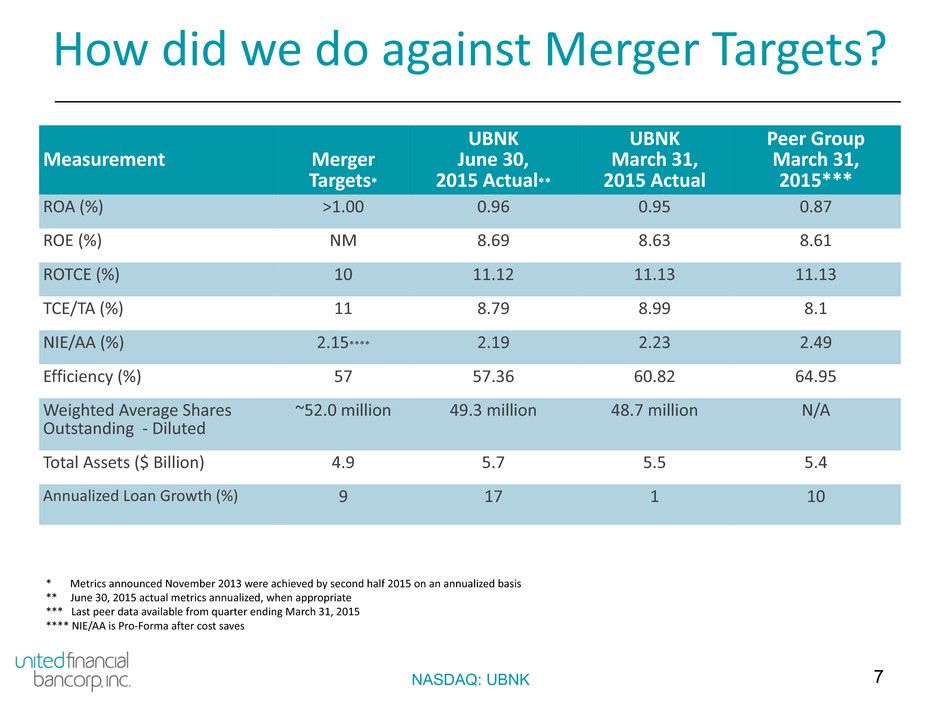
7NASDAQ: UBNK Measurement Merger Targets* UBNK June 30, 2015 Actual** UBNK March 31, 2015 Actual Peer Group March 31, 2015*** ROA (%) >1.00 0.96 0.95 0.87 ROE (%) NM 8.69 8.63 8.61 ROTCE (%) 10 11.12 11.13 11.13 TCE/TA (%) 11 8.79 8.99 8.1 NIE/AA (%) 2.15**** 2.19 2.23 2.49 Efficiency (%) 57 57.36 60.82 64.95 Weighted Average Shares Outstanding - Diluted ~52.0 million 49.3 million 48.7 million N/A Total Assets ($ Billion) 4.9 5.7 5.5 5.4 Annualized Loan Growth (%) 9 17 1 10 How did we do against Merger Targets? * Metrics announced November 2013 were achieved by second half 2015 on an annualized basis ** June 30, 2015 actual metrics annualized, when appropriate *** Last peer data available from quarter ending March 31, 2015 **** NIE/AA is Pro-Forma after cost saves
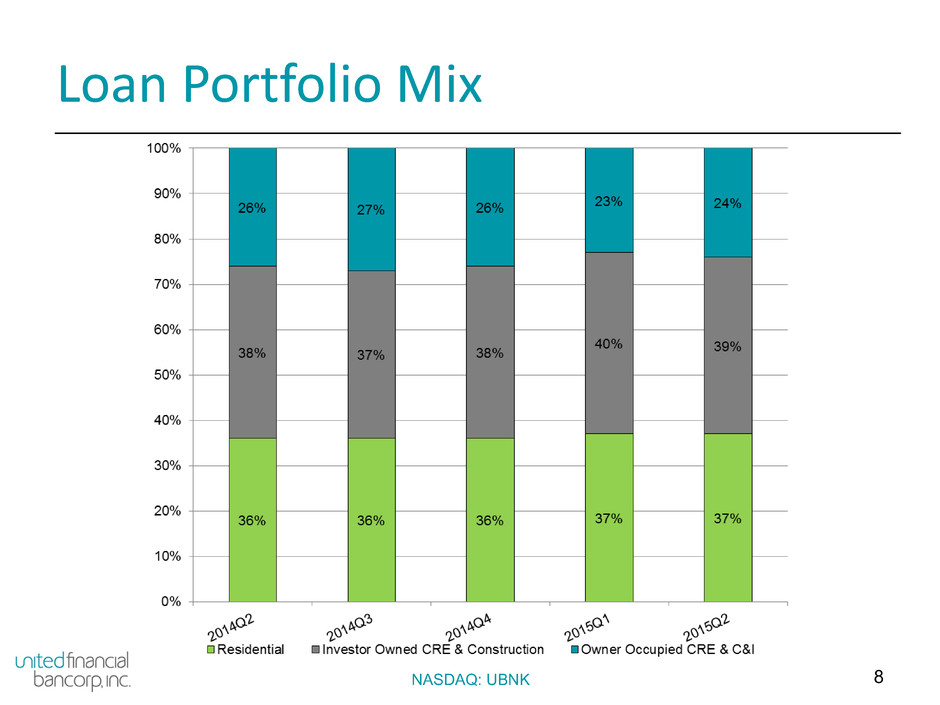
8NASDAQ: UBNK Loan Portfolio Mix
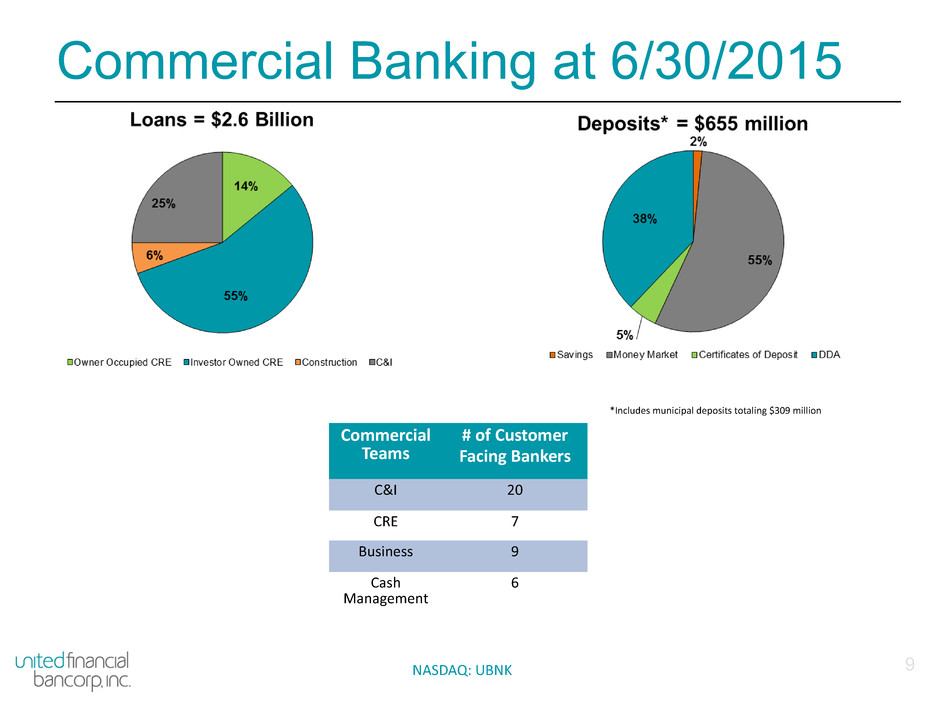
9 Commercial Banking at 6/30/2015 NASDAQ: UBNK Commercial Teams # of Customer Facing Bankers C&I 20 CRE 7 Business 9 Cash Management 6 *Includes municipal deposits totaling $309 million
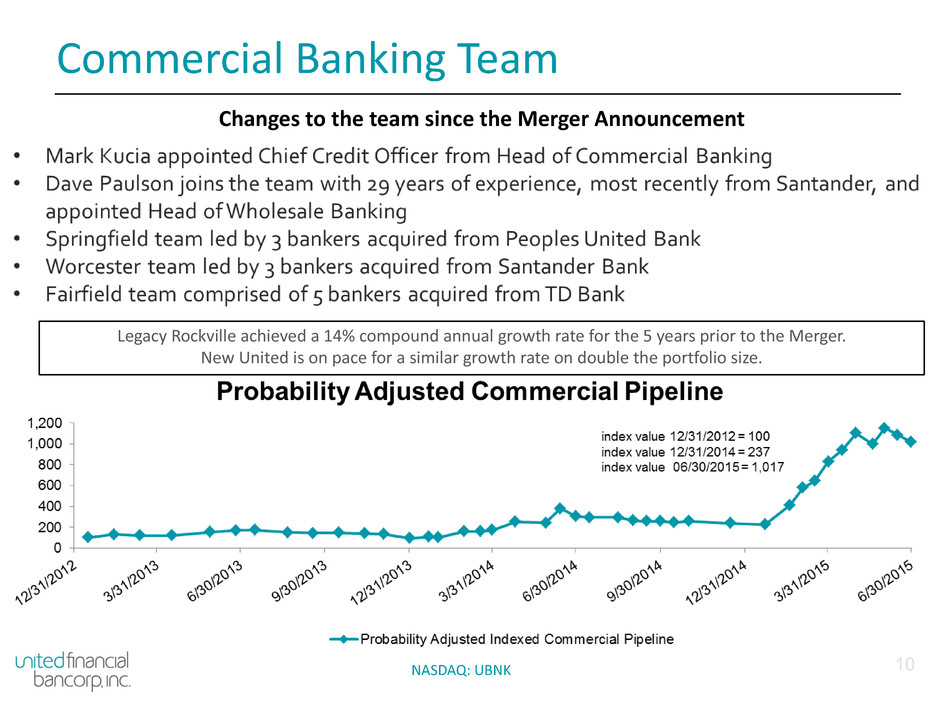
10 Commercial Banking Team NASDAQ: UBNK Changes to the team since the Merger Announcement Legacy Rockville achieved a 14% compound annual growth rate for the 5 years prior to the Merger. New United is on pace for a similar growth rate on double the portfolio size.
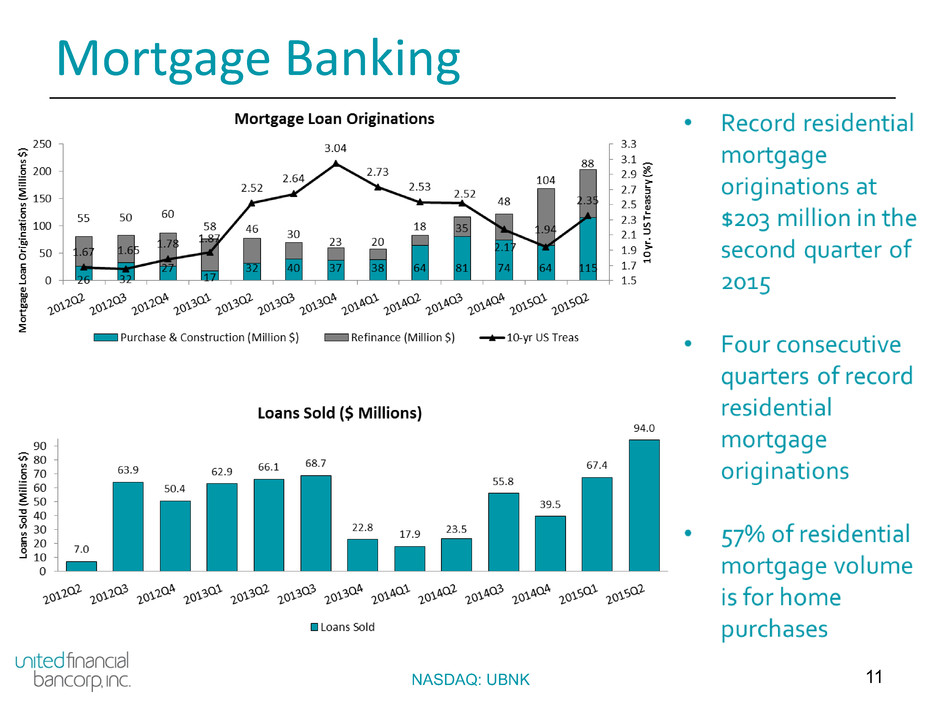
11NASDAQ: UBNK Mortgage Banking
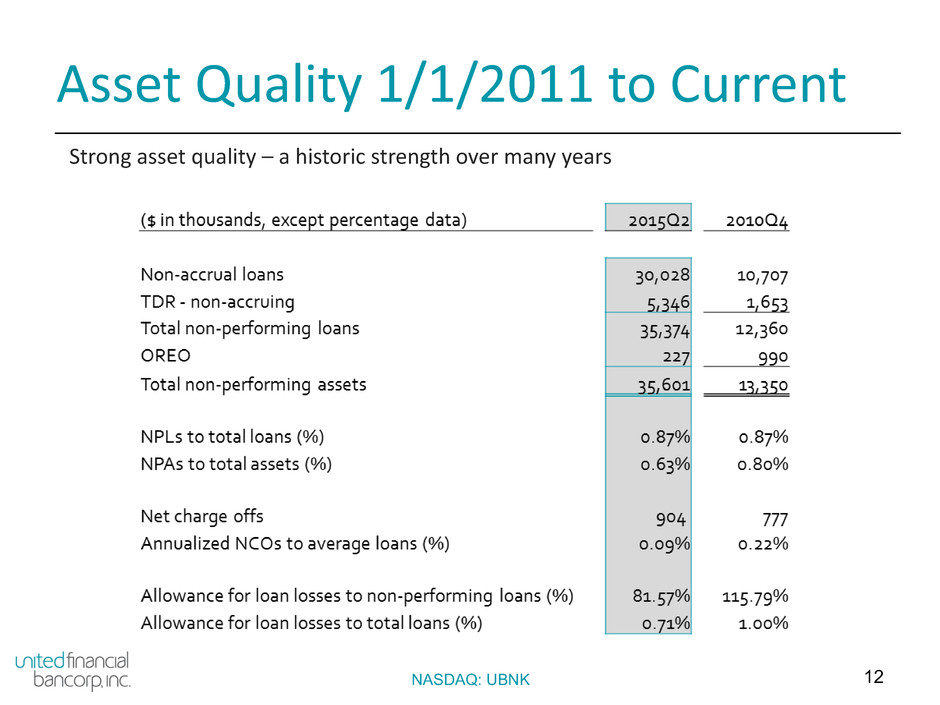
12NASDAQ: UBNK Asset Quality 1/1/2011 to Current Strong asset quality – a historic strength over many years
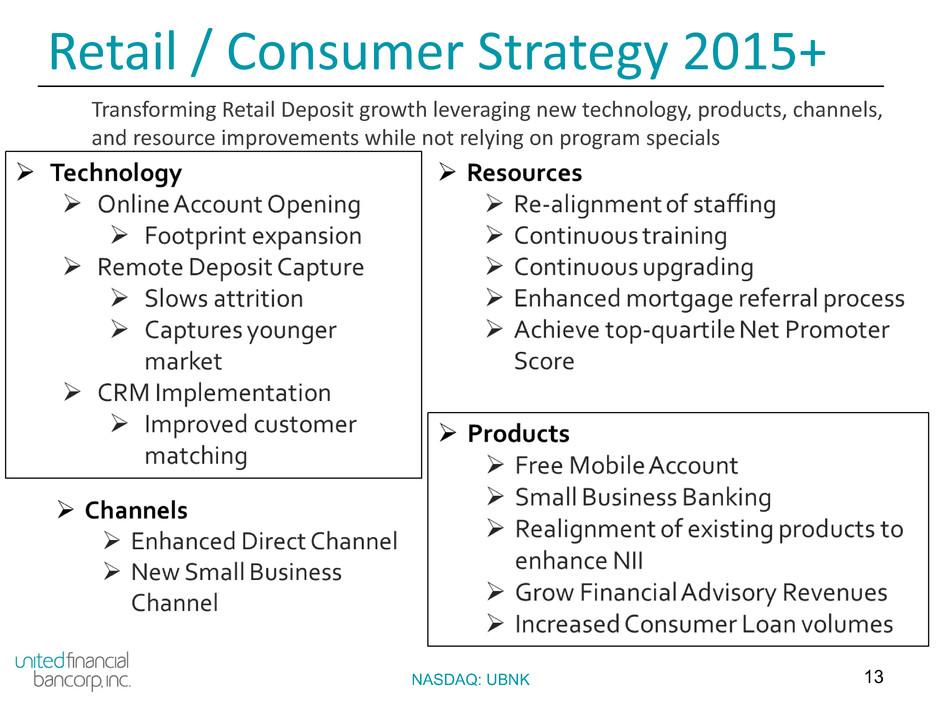
13NASDAQ: UBNK Retail / Consumer Strategy 2015+ Transforming Retail Deposit growth leveraging new technology, products, channels, and resource improvements while not relying on program specials
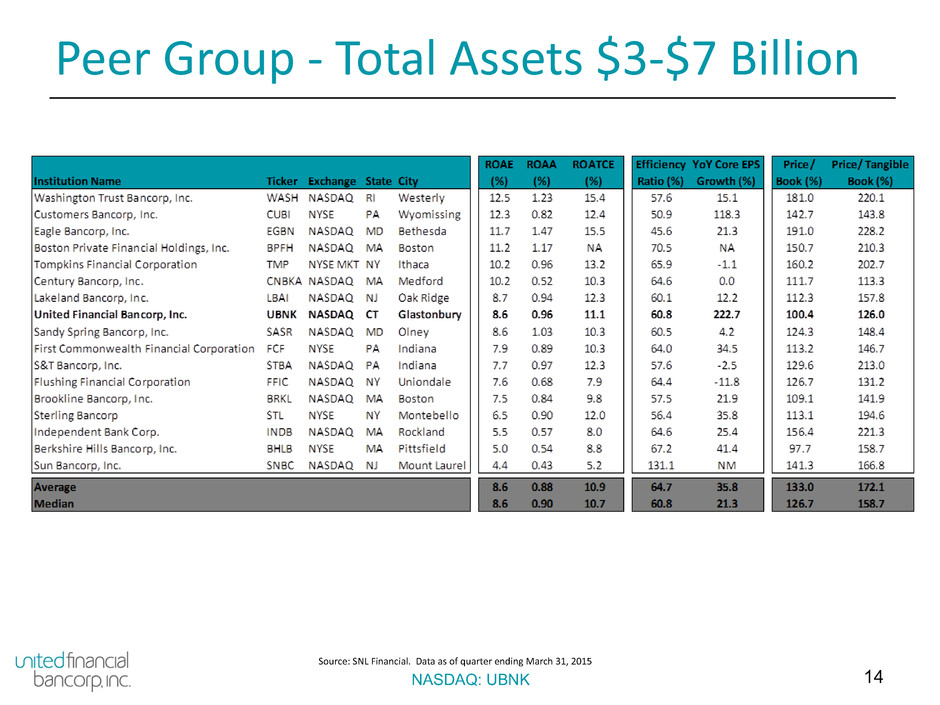
14NASDAQ: UBNK Peer Group - Total Assets $3-$7 Billion Source: SNL Financial. Data as of quarter ending March 31, 2015
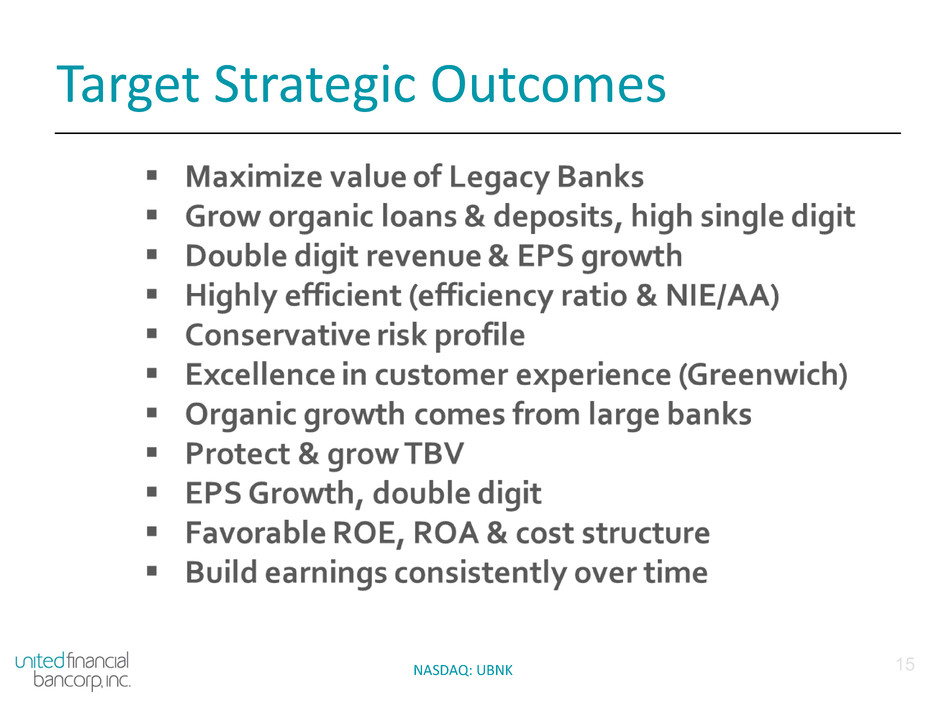
15 Target Strategic Outcomes NASDAQ: UBNK
