Attached files
| file | filename |
|---|---|
| 8-K - FORM 8-K - COMMUNITY FINANCIAL CORP /MD/ | v416550_8k.htm |
Exhibit 99.1

1 Parent of: Investor Presentation July 2015
2 Certain statements contained in this presentation are “forward - looking statements” within the meaning of the protections of Section 27 A of the Securities Act of 1933 , as amended, and Section 21 E of the Securities Exchange Act of 1934 , as amended . These forward - looking statements are covered by the safe harbor provisions for forward - looking statements contained in the Private Securities Litigation Reform Act of 1995 , and we are including this statement for purposes of invoking these safe harbor provisions . Forward - looking statements are made based on our management’s expectations and beliefs concerning future events impacting our company and are subject to uncertainties and factors relating to our operations and economic environment, all of which are difficult to predict and many of which are beyond our control . You can identify these statements from our use of the words “estimate,” “project,” “believe,” “intend,” “anticipate,” “expect,” “target,” “may” and similar expressions . These forward - looking statements may include, among other things : ▪ statements relating to projected growth, anticipated improvements in earnings, earnings per share , asset quality, and other financial performance measures, and management’s long - term performance goals ; ▪ statements relating to the anticipated effects on results of operations or our financial condition from expected developments or events ; ▪ statements relating to our business and growth strategies ; and ▪ any other statements which are not historical facts . Forward - looking statements involve known and unknown risks, uncertainties and other important factors that could cause our actual results, performance or achievements to differ materially from our expectations of future results, performance or achievements, or industry results, expressed or implied by these forward - looking statements . These forward - looking statements may not be realized due to a variety of factors, including without limitation : ▪ the effects of future economic, business and market conditions ; ▪ changes in interest rates ; ▪ governmental monetary and fiscal policies ; ▪ changes in prices and values of real estate ; ▪ legislative and regulatory changes, including changes in banking, securities and tax laws and regulations and their application by our regulators, including changes in the cost and scope of FDIC insurance ; ▪ the failure of assumptions regarding the levels of non - performing assets and the adequacy of the allowance for loan losses ; ▪ weaker than anticipated market conditions in our primary market areas ; ▪ the effects of competition in our market areas ; ▪ liquidity risks through an inability to raise funds through deposits, borrowings or other sources, or to maintain sufficient liquidity at the Company separate from the Bank’s liquidity ; ▪ volatility in the capital and credit markets ; and ▪ the other risk factors discussed from time to time in the periodic reports that we file with the SEC, including our Annual Report on Form 10 - K for the year ended December 31 , 2014 . You should not place undue reliance on any forward - looking statement . Forward - looking statements speak only as of the date made . We undertake no obligation to update any forward - looking statement to reflect events or circumstances after the date of this presentation or to reflect the occurrence of unanticipated events . NOTE REGARDING NON - GAAP FINANCIAL MEASURES This presentation contains financial information determined by methods other than those prescribed by accounting principles generally accepted in the United States of America ("GAAP") . These non - GAAP financial measures include the following : efficiency ratio, tangible common equity, tangible book value per common share, tangible common equity to tangible assets and tangible equity to tangible assets . Management uses these non - GAAP financial measures because it believes that they are useful for evaluating our operations and performance over periods of time, as well as in managing and evaluating our business and in discussions about our operations and performance . Management believes these non - GAAP financial measures provide users of our financial information with meaningful measures for assessing our financial results, as well as comparison to financial results for prior periods . These non - GAAP financial measures should not be considered as a substitute for financial measures determined in accordance with GAAP and may not be comparable to other similarly titled financial measures used by other companies . For a reconciliation of the differences between our non - GAAP financial measures and the most comparable GAAP measures, please refer to the Appendix of this presentation . Forward Looking Information
3 Corporate Overview

4 The Community Financial Corporation x The Community Financial Corporation (NASDAQ: TCFC) is the bank holding company for Community Bank of the Chesapeake (the “Bank”) x $1.1 billion in assets and market capitalization of approximately $100 Million (1) x Headquartered in Waldorf, MD with 15 locations in Maryland and Virginia • Branches: 10 in the Southern Maryland counties of Calvert, Charles and St. Mary’s and 2 in Virginia in King George county and the City of Fredericksburg • Loan Production Offices (LPOs): 4 in Maryland (Annapolis, La Plata, Prince Frederick and Leonardtown) and 1 in Virginia (Fredericksburg) x Opened Annapolis, MD LPO in October 2014 x 2 nd branch to open in Fredericksburg market in early 2016 x Relationship banking focus; high touch with direct access to senior decision makers x Current platform has capacity to support future organic growth x ~17% insider ownership (2) Geographic Footprint Source: SNL Financial and Management. Note: Fredericksburg and Leonardtown branch locations and LPOs are co - located. (1) Market data as of 7/17/15. (2) Includes ESOP ownership. Branches LPOs

5 Financial Highlights Source: SNL Financial, company regulatory and SEC filings. TCFC has had no intangible assets in all presented periods. Gross loa ns presented net of deferred loan fees. (1) Non - GAAP financial measures. Refer to Appendix to this presentation for a reconciliation. (2) NPLs include nonaccrual loans, loans 90+ days past due and accruing TDRs. NPAs include NPLs and OREO. (3) Efficiency Ratio = Noninterest expense before OREO valuation allowance and OREO expense and amortization of impairment of intangibles / interest income + noninterest revenues (excludes securities gains, OREO gains and losses, and nonrecurring items). Refer to Appendix to this presentation for a reconciliation of the efficiency ratio. (4) In October 2013, the Company issued 1,591,300 shares of common stock at a price of $18.75 per share resulting in net proceeds of $27.4 million after commissions and related offering expenses. x Nearly 20% increase year over year increase in EPS x Net interest margin stability x Linked quarter average annualized loan growth of more than 10% x 2015 YTD ROAA 0.66% x YTD NCOs less than 10 bps of average loans Recent Financial Highlights 2012 FY 2013 FY 2014 FY 2014 YTD 2015 YTD ($000s except per share) 12/31/12 12/31/13 12/31/14 6/30/14 6/30/15 Balance Sheet Total Assets 981,639$ 1,023,824$ 1,082,878$ 1,034,707$ 1,126,736$ Total Gross Loans 755,888 807,268 870,890 845,177 894,671 Total Deposits 820,231 821,295 869,384 818,544 900,385 Tangible Common Equity (1) 59,047 90,730 96,559 93,226 99,084 Consolidated Capital (%) Tier 1 Risk Based Ratio 11.76 % 14.66 % 14.26 % 14.45 % 11.65 % Risk-Based Capital Ratio 12.84 15.62 15.21 15.38 14.97 TBV Per Share (1)(4) 19.34 19.52 20.53 19.89 21.01 Asset Quality (%) NPAs/ Assets (2) 2.50 % 2.60 % 2.71 % 2.09 % 2.96 % NCOs/ Avg Loans 0.27 0.14 0.28 0.21 0.07 Reserves/ NPLs (2) 46.7 41.1 36.1 53.4 32.5 8247 8138 8481 Profitability Net Income to Common 4,790$ 6,451$ 6,290$ 2,956$ 3,509$ ROAA 0.52 % 0.69 % 0.63 % 0.61 % 0.66 % ROACE 8.3 9.4 6.7 6.4 7.1 Net Interest Margin 3.31 3.56 3.68 3.62 3.63 Efficiency Ratio (1)(3) 67.7 66.8 66.6 68.4 66.3 Diluted EPS (4) 1.57$ 1.88$ 1.35$ 0.63$ 0.75$
6 Investment Highlights x Strong Fundamental Operating Trends • 28 consecutive years of profitability • Net interest margin improvement driven by stable loan yields and improving funding costs x Robust Lending Pipeline x Strong Market Share and Brand Recognition • Top community bank aggregate deposit market share in operating counties in Southern Maryland and the Northern Neck of Virginia • Successful results in new markets through local hiring, community outreach and grassroots marketing x Excellent Regional Demographics Driven by Proximity to Department of Defense (“DoD”) Headquarters, Homeland Security and Other Federal Agencies x Increasing Regional I mportance in Natural Gas Distribution (Dominion Power – Cove Point Liquefied Natural Gas Terminal) x Experienced Senior Management Team with Strong Track Record • Average of 29 years in banking and 16 years with the Company • Proven ability to grow organically through recent economic cycle

7 Major Market Demographics x Positioned in demographically attractive markets x Diversified economy including military, federal and state governments, research and development , technology, education , energy import/export, healthcare and professional services x Strong demographics and household income metrics, with below average unemployment rates Unemployment Rate (May 2015) (1) Note: Weighted average by deposits. (1) Source: SNL Financial; not seasonally adjusted. (2) Source: SNL Financial. Population Change (2015 – 2020) (2 ) Median 2015 HH Income (2) 4.9% 5.5% 0.0% 1.0% 2.0% 3.0% 4.0% 5.0% 6.0% 7.0% Weighted Avg. Franchise USA 4.9% 3.5% 0.0% 1.0% 2.0% 3.0% 4.0% 5.0% 6.0% Weighted Avg. Franchise USA $94,191 $53,706 $0 $20,000 $40,000 $60,000 $80,000 $100,000 Weighted Avg. Franchise USA

8 Complementary New Market Demographics x Expanded branch franchise into Fredericksburg, VA market in July 2014 to support existing successful LPO x 2 nd branch to open in Fredericksburg in early 2016 x Annapolis LPO opened in October 2014 x Economies and demographics for new markets strongly mirror those of the legacy TCFC franchise Unemployment Rate (May 2015) (1) Note: Weighted average by county population . Fredericksburg market assumed to include Fredericksburg City, Spotsylvania and Stafford counties in Virginia. (1) Source : SNL Financial; not seasonally adjusted . (2) Source : SNL Financial . Population Change (2015 – 2020) (2) Median HH Income (2) 4.9% 5.5% 0.0% 1.0% 2.0% 3.0% 4.0% 5.0% 6.0% 7.0% Weighted Avg. Franchise (Incl. Fredericksburg & Anne Arundel) USA $92,076 $53,706 $0 $20,000 $40,000 $60,000 $80,000 $100,000 Weighted Avg. Franchise (Incl. Fredericksburg & Anne Arundel) USA 5.2% 3.5% 0.0% 1.0% 2.0% 3.0% 4.0% 5.0% 6.0% Weighted Avg. Franchise (Incl. Fredericksburg & Anne Arundel) USA

9 Significant In - Market Federal Agency Presence x Department of Defense in - market presence: • National Energetics Center – Naval Support Facility at Indian Head (Charles County) • Naval Surface Warfare – Naval Support Facility at Dahlgren (King George County) • Air Force One – Andrews AFB (Prince Georges County) • US Marines – Quantico (Prince William County) • Defense Intelligence Agency & Defense Intelligence Analysis Center – Joint Base Anacostia - Bolling (Prince Georges County) • Naval Air Station Patuxent River (St. Mary’s County) − Annual county economic impact more than $2 billion x Additional major in - market Federal Agency presence: • Federal Aviation Administration (FAA) Unmanned Aerial Vehicle (UAV) Drones Program • Homeland Security • FBI & DEA – Quantico (Prince William County)

10 $174 $198 $201 $221 $292 $373 $426 $458 $548 $624 $662 $718 $756 $807 $871 $895 $168 $183 $203 $228 $267 $363 $418 $445 $525 $640 $725 $827 $820 $821 $869 $900 $- $100 $200 $300 $400 $500 $600 $700 $800 $900 $1,000 2000 2001 2002 2003 2004 2005 2006 2007 2008 2009 2010 2011 2012 2013 2014 2015 YTD Gross Loans ($MM) Deposits ($MM) Gross Loan CAGR: 11.5% (1) Over a Decade of Loan Growth Source: SNL Financial and company filings. Gross loans presented net of deferred loan fees. (1) Represents the period from 12/31/00 – 6/30/15. x 2005 & 2007 – Strategic hires from Mercantile Bancshares x 2012 & 2013 – Open a branch and a loan production office in Virginia x 2014 – Expansion into Annapolis in October 2014

11 Steady Growth After Financial Crisis Source: Uniform Bank Performance Report and Company Financial Statements. Peers represent commercial banks with assets $300 million to $1.0 billion through 2013 . Peers represent commercial banks with assets $1 billion to $3 billion for 2014 and 2015 YTD. MD peers represent all FDIC - insured depository institutions located in Maryland. Company 2015 loan growth based on year to date June 30, 2015 results (annualized). Peer and MD peer net loan and lease growth based on UBPR March 31, 2015 data (annualized). Indexed Loan Growth Since 12/31/2007 Versus Peers 201 148 153 100 120 140 160 180 200 220 2007 2008 2009 2010 2011 2012 2013 2014 2015 YTD Loan Growth Rate - CBTC Loan Growth Rate - UPBR Peer Loan Growth Rate - MD Peer

12 Residential & Consumer 19% Construction 4% CRE & C&I 77% Migration into a True Commercial Bank Loan Composition (12/31/2000) $174 M illion Loan Composition (6/30/2015) Source: Management and company filings. Gross loans presented net of deferred loan fees . $895 Million 57% 1 - 4 family real estate and consumer loans >75% commercial real estate and commercial & industrial loans CRE and C&I 33% Residential & Consumer 57% Construction 10% YTD Yield: 4.76%

13 NIM Consistent With Peers Net Interest Margin Source SNL Financial regulatory data, Management and company filings. Peers include all BHCs headquartered in Maryland, Virginia or Washington DC with assets between $500 million and $1.5 billion as of 3/31/15. Excludes H Bancorp LLC and acquisition targets. Yield on Earning Assets TCFC Δ - 16 bps Peer Δ - 59 bps TCFC Δ +32 bps Peer Δ - 14 bps 3.28% 3.28% 3.54% 3.52% 3.47% 3.60% 3.67% 3.60% 3.63% 3.74% 3.73% 3.67% 3.60% 3.87% 3.96% 3.84% 3.78% 3.79% 3.84% 3.88% 3.60% 3.63% 3.80% 3.77% 3.73% 3.00% 3.50% 4.00% 4.50% 2012Q2 2012Q3 2012Q4 2013Q1 2013Q2 2013Q3 2013Q4 2014Q1 2014Q2 2014Q3 2014Q4 2015Q1 2015Q2 TCFC Regional BHC Peer Median 4.51% 4.41% 4.54% 4.41% 4.38% 4.43% 4.43% 4.34% 4.35% 4.43% 4.39% 4.35% 4.35% 4.89% 4.67% 4.71% 4.48% 4.42% 4.42% 4.47% 4.20% 4.21% 4.27% 4.31% 4.30% 4.00% 4.20% 4.40% 4.60% 4.80% 5.00% 2012Q2 2012Q3 2012Q4 2013Q1 2013Q2 2013Q3 2013Q4 2014Q1 2014Q2 2014Q3 2014Q4 2015Q1 2015Q2 TCFC Regional BHC Peer Median

14 Deposit Franchise Cost of Funding x Continue to shift deposit mix away from CDs. At June 30, 2015 the Bank’s deposit funding consisted of approximately 57% transaction accounts compared to less than 45% at December 31, 2011 x Increased average balance of noninterest bearing transaction accounts by $20.2 million, or 21.5%, over last twelve months (1) x Cost of deposits continues to decline; YTD cost of funds impacted by issuance of $23.0 million of 6.25% subordinated debt during the first quarter of 2015 Source: Management and company filings. (1) Comparison reflects six month average balance as of 6/30/15 as compared to six month average balance as of 6/30/14. 2.35% 1.78% 1.59% 1.21% 0.88% 0.74% 0.74% 2.11% 1.61% 1.43% 1.05% 0.71% 0.56% 0.48% 0.00% 0.50% 1.00% 1.50% 2.00% 2.50% 3.00% 2009Y 2010Y 2011Y 2012Y 2013Y 2014Y 2015 YTD Cost of Funds Cost of Deposits Deposit Composition (6/30/2015) $900 Million Time Deposits 43% NIB Transaction 15% IB Transaction 42%
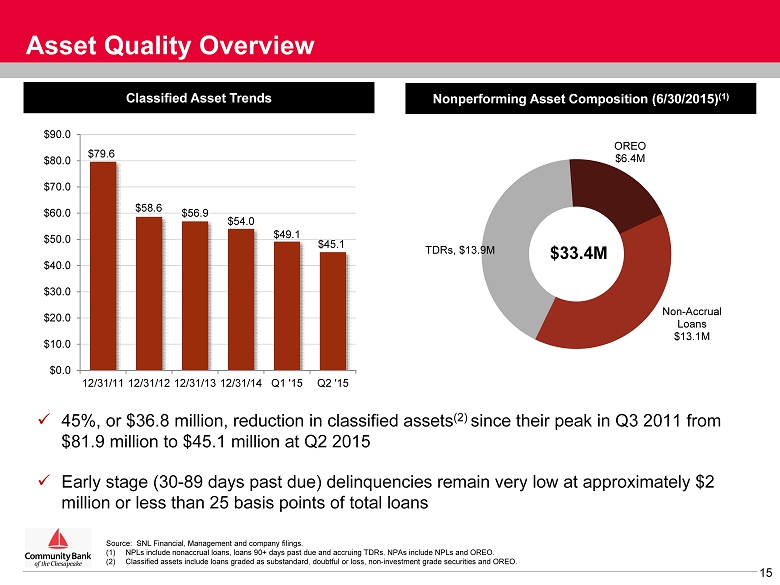
15 Asset Quality Overview Source: SNL Financial, Management and company filings. (1) NPLs include nonaccrual loans, loans 90+ days past due and accruing TDRs. NPAs include NPLs and OREO. (2) Classified assets include loans graded as substandard, doubtful or loss, non - investment grade securities and OREO . Classified Asset Trends Nonperforming Asset Composition (6/30/2015) (1) x 45%, or $36.8 million, reduction in classified assets (2) since their peak in Q3 2011 from $81.9 million to $45.1 million at Q2 2015 x Early stage (30 - 89 days past due) delinquencies remain very low at approximately $2 million or less than 25 basis points of total loans $79.6 $58.6 $56.9 $54.0 $49.1 $45.1 $0.0 $10.0 $20.0 $30.0 $40.0 $50.0 $60.0 $70.0 $80.0 $90.0 12/31/11 12/31/12 12/31/13 12/31/14 Q1 '15 Q2 '15 Non - Accrual Loans $13.1M TDRs , $13.9M OREO $6.4M $33.4M

16 Significant Organic Growth Opportunities Ahead x Fredericksburg & Annapolis Areas • Opened loan production office in Fredericksburg in Q3 2013 • Branch opened in Fredericksburg in July 2014. Second Fredericksburg branch to open in early 2016 • Two seasoned lenders hired in Q2 2014 to develop Annapolis LPO service area. Annapolis LPO opened in October 2014 x Contiguous Market Area Strategy • Entry into new markets initially through loan production offices • Opportunistic expansion of deposit franchise TCFC Branch TCFC LPO Existing Branch Footprint Fredericksburg LPO Service Area Annapolis LPO Service Area Source: SNL Financial and Management. Note: Fredericksburg and Leonardtown branch locations and LPOs are co - located.

17 8.79% 0.0% 2.0% 4.0% 6.0% 8.0% 10.0% 12.0% 14.0% 16.0% TCE Ratio Leverage Ratio Tier 1 Risk- Based Ratio Total Risk- Based Capital Ratio 6/30/15 Capital Ratios TruPS Sub Debt 10.26% 11.65% 14.97% Pro Forma Capital Position 6/30/2015 Pro Forma Consolidated Capital Ratios (%) x Redeemed $20 million of SBLF in February 2015 with proceeds of $23 million subordinated debt offering x Subordinated debt interest rate of 6.25% fixed for five years, floating at 3 Month LIBOR + 479 bps after that x $5 million of trust preferred yielding 3 Month LIBOR + 170 bps and $7 million of trust preferred yielding 3 Month LIBOR + 260 bps x Regulatory capital levels are well above “well - capitalized” levels and fully phased in Basel III thresholds Source: Management and company filings as of 6/30/15. (1) Measure is a non - GAAP financial measure. Refer to Appendix to this presentation for a reconciliation . (1)

18 Concluding Remarks x Profitable Franchise x Organic Growth Capacity x Positioned in Demographically Attractive Markets x Appealing Competitive Dynamics x Strong, Experienced Management Team
19 Appendix

20 $8.93 $10.02 $10.48 $10.98 $12.06 $13.09 $14.28 $16.79 $17.23 $17.43 $18.25 $18.32 $19.34 $19.52 $20.53 $21.01 $- $5.00 $10.00 $15.00 $20.00 $25.00 2000 2001 2002 2003 2004 2005 2006 2007 2008 2009 2010 2011 2012 2013 2014 2015 YTD Tangible Book Value Per Share Consistent Shareholder Value Creation Source: SNL Financial and company filings. Note: Tangible book value per share is a non - GAAP financial measure. Refer to Appendix to this presentation for a reconciliation. In October 2013, the Company issued 1,591,300 shares of common stock at a price of $18.75 per share resulting in net proceeds of $27.4 million after commissions and related offering expenses. The additional shares outstanding impacted year to year comparability of per share book value amounts beginning with the year end ed December 31, 2013.

21 Asset Quality Trends NPAs & 90+PD / Assets (1) Allowance for Loan Losses / Loans Allowance for Loan Losses / NPLs (2) NCOs / Avg. Loans Source: SNL Financial and company filings. Peers include all BHCs headquartered in Maryland, Virginia or Washington DC with total assets between $500 million and $1.5 billion as of 3/31/15. Excludes H Bancorp LLC and acquisition targets. (1) Nonperforming Assets = Nonaccrual + accruing TDRs + 90 day past due + OREO. (2) Nonperforming Loans = Nonaccrual + accruing TDRs + 90 day past due. 4.58% 2.61% 2.50% 2.60% 2.71% 2.82% 2.96% 2.71% 1.48% 2.04% 2.17% 1.49% 1.40% 1.73% 0.00% 1.00% 2.00% 3.00% 4.00% 5.00% 2010Y 2011Y 2012Y 2013Y 2014Y 2015 Q1 2015 Q2 TCFC TCFC Excl. TDRs Regional BHC Peer Median 1.16% 1.07% 1.09% 1.01% 0.97% 0.97% 0.98% 0.00% 0.50% 1.00% 1.50% 2.00% 2.50% 2010Y 2011Y 2012Y 2013Y 2014Y 2015 Q1 2015 Q2 TCFC Regional BHC Peer Median 56.7% 80.5% 62.8% 52.7% 82.6% 102.2% 67.1% 25.5% 37.1% 46.7% 41.1% 36.1% 36.1% 32.5% 0% 20% 40% 60% 80% 100% 120% 2010Y 2011Y 2012Y 2013Y 2014Y 2015 Q1 2015 Q2 TCFC Excl. TDRs TCFC Regional BHC Peer Median 0.61% 0.61% 0.27% 0.14% 0.28% 0.02% 0.12% 0.00% 0.25% 0.50% 0.75% 1.00% 2010Y 2011Y 2012Y 2013Y 2014Y 2015 Q1 2015 Q2 TCFC Regional BHC Peer Median

22 Financial Summary Source: SNL Financial and company filings. TCFC has had no intangible assets in all presented periods. Gross loans presented net of deferred loan fees . (1) Non - GAAP financial measures. Refer to Appendix to this presentation for a reconciliation. (2) Texas Ratio = NPAs / Tangible Common Equity + ALLL. (3) NPLs include nonaccrual loans, loans 90+ days past due and accruing TDRs. (4) NPAs include NPLs as defined above and OREO. (5) In October 2013, the Company issued 1,591,300 shares of common stock at a price of $18.75 per share resulting in net proceeds of $27.4 million after all commissions and related offering expenses. 2010 FY 2011 FY 2012 FY 2013 FY 2014 FY 2014 FQ3 2014 FQ4 2015 FQ1 2015 FQ2 ($ in thousands except per share data) 12/31/10 12/31/11 12/31/12 12/31/13 12/31/14 9/30/14 12/31/14 3/31/15 6/30/15 Balance Sheet Total Assets 885,936$ 983,480$ 981,639$ 1,023,824$ 1,082,878$ 1,042,481$ 1,082,878$ 1,089,171$ 1,126,736$ Total Gross Loans 662,119 717,744 755,888 807,268 870,890 845,253 870,890 889,134 894,671 Total Deposits 724,582 827,253 820,231 821,295 869,384 829,820 869,384 854,491 900,385 Tangible Common Equity (1) 54,788 55,454 59,047 90,730 96,559 94,765 96,559 98,295 99,084 Profitability (%) Net Income Avail. to Common ($000) 3,919$ 2,489$ 4,790$ 6,451$ 6,290$ 1,839$ 1,495$ 1,798$ 1,711$ ROAA 0.57 % 0.35 % 0.52 % 0.69 % 0.63 % 0.73 % 0.59 % 0.68 % 0.63 % ROACE 7.2 4.5 8.3 9.4 6.7 7.8 6.2 7.3 6.9 Net Interest Margin 3.32 3.21 3.31 3.56 3.68 3.74 3.73 3.67 3.60 Efficiency Ratio (1) 60.2 64.7 67.7 66.8 66.6 64.1 65.8 67.2 65.5 Balance Sheet Ratios / Consolidated Capital (%) Loans/ Deposits 91.4 % 86.8 % 92.2 % 98.3 % 100.2 % 101.9 % 100.17 % 104.05 % 99.37 % Tangible Equity/ Tangible Assets 8.03 7.67 8.05 10.82 10.76 11.01 10.76 9.02 8.79 Tangible Common Equity/ Tang Assets (1) 6.18 5.64 6.02 8.86 8.92 9.09 8.92 9.02 8.79 Tier 1 Risk Based Ratio 11.84 11.65 11.76 14.66 14.26 14.50 14.26 11.76 11.65 Total Risk Based Capital Ratio 12.94 12.69 12.84 15.62 15.21 15.45 15.21 15.13 14.97 Leverage Ratio 9.44 9.17 9.39 12.50 12.24 12.28 12.24 10.36 10.26 Texas Ratio (2) 65.0 40.6 36.5 26.9 28.0 19.8 28.0 28.8 31.0 Asset Quality (%) NPLs/ Loans (3) 4.54 % 2.87 % 2.34 % 2.45 % 2.70 % 1.66 % 2.70 % 2.69 % 3.01 % NPAs/ Assets (4) 4.58 2.61 2.50 2.60 2.71 1.96 2.71 2.82 2.96 NCOs/ Avg Loans 0.61 0.61 0.27 0.14 0.28 0.08 0.62 0.02 0.12 Reserves/ Loans 1.16 1.07 1.09 1.01 0.97 0.98 0.97 0.97 0.98 Reserves/ NPLs (3) 25.5 37.1 46.7 41.1 36.1 58.8 36.1 36.1 32.5 Reserves/ NPAs (4) 18.9 29.8 33.6 30.6 28.9 40.5 28.9 28.0 26.2 7669 7655 8247 8138 8481 8273 8481 NA Per Share Data Book Value Per Share 18.25$ 18.32$ 19.34$ 19.52$ 20.53$ 20.21$ 20.53$ 20.78$ 21.01$ Tangible Book Value Per Share (1)(5) 18.25 18.32 19.34 19.52 20.53 20.21 20.53 20.78 21.01 Earnings Per Share (5) 1.30 0.82 1.57 1.88 1.35 0.39 0.32 0.38 0.37 Common Dividends Per Share 0.40 0.40 0.40 0.40 0.40 0.10 0.10 0.10 0.10

23 Non - GAAP Reconciliation Tangible Book Value Per Share & Tangible Common Equity / Tangible Assets ‘‘Tangible book value per share’’ is defined as tangible stockholders’ equity less preferred equity and intangible assets divided by total common shares outstanding. We believe that this measure is important to many investors in the marketplace who are interested in changes from period to period in book value per common share exclusive of changes in intangible assets. Source: Management and company filings. (dollars in thousands, except share data) For the Years Ended 2000 2001 2002 2003 2004 2005 2006 2007 2008 2009 Stockholders' Equity 23,430$ 25,586$ 26,873$ 27,912$ 31,124$ 34,578$ 37,729$ 48,847$ 67,114$ 68,190$ Intangible Assets - - - - - - - - - - Preferred Equity - - - - - - - - (16,317) (16,317) Tangible Common Equity 23,430$ 25,586$ 26,873$ 27,912$ 31,124$ 34,578$ 37,729$ 48,847$ 50,797$ 51,873$ Shares Outstanding 2,624,670 2,554,218 2,564,252 2,542,314 2,580,444 2,641,487 2,642,288 2,909,974 2,947,759 2,976,041 Tangible Book Value per Share 8.93$ 10.02$ 10.48$ 10.98$ 12.06$ 13.09$ 14.28$ 16.79$ 17.23$ 17.43$ (dollars in thousands, except share data) For the Years Ended For the Quarter Ended For the Quarter Ended 2010 2011 2012 2013 2014 6/30/2014 9/30/2014 12/31/2014 3/31/2015 6/30/2015 Stockholders' Equity 71,105$ 75,454$ 79,047$ 110,730$ 116,559$ 113,226$ 114,765$ 116,559$ 98,295$ 99,084$ Intangible Assets - - - - - - - - - - Preferred Equity (16,317) (20,000) (20,000) (20,000) (20,000) (20,000) (20,000) (20,000) - - Tangible Common Equity 54,788$ 55,454$ 59,047$ 90,730$ 96,559$ 93,226$ 94,765$ 96,559$ 98,295$ 99,084$ Total Assets 885,936$ 983,480$ 981,639$ 1,023,824$ 1,082,878$ 1,034,707$ 1,042,481$ 1,082,878$ 1,089,171$ 1,126,736$ Intangible Assets - - - - - - - - - - Tangible Assets 885,936$ 983,480$ 981,639$ 1,023,824$ 1,082,878$ 1,034,707$ 1,042,481$ 1,082,878$ 1,089,171$ 1,126,736$ Shares Outstanding 3,002,616 3,026,557 3,052,416 4,647,407 4,702,715 4,687,766 4,688,152 4,702,715 4,730,314 4,715,212 Tangible Book Value per Share 18.25$ 18.32$ 19.34$ 19.52$ 20.53$ 19.89$ 20.21$ 20.53$ 20.78$ 21.01$ Tangible Common Equity / Tang. Assets 6.18% 5.64% 6.02% 8.86% 8.92% 9.01% 9.09% 8.92% 9.02% 8.79%

24 Non - GAAP Reconciliation Efficiency Ratio ‘‘Efficiency ratio’’ is defined as recurring non - interest expense less foreclosed real estate (OREO) expenses and valuation allowances, less amortization of intangible assets divided by operating revenue. Operating revenue is equal to net interest income plus non - interest income excluding gains and losses on securities and foreclosed real estate. In our judgment, the adjustments made to non - interest expense and operating revenue allow investors and analysts to better assess our operating expenses in relation to our core operating revenue by removing the volatility that is associated with certain one - time items and other discrete items that are unrelated to our core business. Source: Management and company filings. (dollars in thousands) For the Years Ended For the Quarter Ended Year to Date 2010 2011 2012 2013 2014 9/30/2014 12/31/2014 3/31/2015 6/30/2015 6/30/2014 6/30/2015 Non-Interest Expense 18,195$ 22,249$ 23,804$ 24,844$ 26,235$ 6,485$ 6,652$ 6,943$ 6,888$ 13,098$ 13,831$ OREO Valuation Allowance (416) (2,452) (674) (601) (234) - - (125) (249) (234) (374) OREO Operating Expenses - - (97) (186) (152) (37) (55) (94) (85) (60) (179) Non-Recurring Expense - - - - - - - - - - - Adjusted Non-Interest Expense (Numerator) 17,779$ 19,797$ 23,033$ 24,057$ 25,849$ 6,448$ 6,597$ 6,724$ 6,554$ 12,804$ 13,278$ Net Interest Income 25,957$ 26,838$ 29,689$ 32,032$ 35,061$ 9,004$ 9,053$ 9,063$ 9,033$ 17,004$ 18,096$ Non-Interest income 3,580 4,193 4,410 4,174 4,093 1,118 1,225 962 962 1,750 1,924 (Gains) / Losses on OREO Disposals - (454) (89) (179) (322) (56) (262) - 18 (4) 18 Realized (Gain) / Loss on Other Assets - - - - (7) - - (18) (1) (7) (19) Realized (Gain) / Loss on Securities - - - - (19) - 5 1 - (24) 1 Operating Revenue (Denominator) 29,537$ 30,577$ 34,010$ 36,027$ 38,806$ 10,066$ 10,021$ 10,008$ 10,012$ 18,719$ 20,020$ Efficiency Ratio 60.2% 64.7% 67.7% 66.8% 66.6% 64.1% 65.8% 67.2% 65.5% 68.4% 66.3%

25 Executive Management Team William J. Pasenelli Michael L. Middleton x Executive Chairman x Joined in 1973 x President and Chief Executive Officer (1979 - 2014) x EVP and Chief Risk Officer x Joined in 2005 x Former EVP and Senior Loan Officer at Mercantile Southern Maryland Bank x President and Chief Executive Officer x Joined in 2000 x Former CFO of Acacia Federal Savings Bank (1987 - 2000) James M. Burke Todd L. Capitani x EVP and Chief Financial Officer x Joined in 2009 x Former Senior Finance Manager with Deloitte Consulting and CFO of Ruesch International, Inc.

26 Executive Management Team Rebecca J. Henderson Christy M. Lombardi x Chief Administrative Officer and EVP x Joined in 1998 x Oversees human resources and shareholder relations x EVP and Director of Sales for Retail Operations and Wealth Management x Joined in 2006 x Former VP, Commercial Lender at Mercantile Southern Maryland Bank Gregory Cockerham x EVP and Chief Lending Officer x Joined in 1988 x Former Executive with Maryland National Bank James F. Di Misa x EVP and Chief Operating Officer x Joined in 2005 x Former EVP at Mercantile Southern Maryland Bank