Attached files
| file | filename |
|---|---|
| 8-K - FORM 8-K - UMB FINANCIAL CORP | d87989d8k.htm |
| EX-99.1 - EX-99.1 - UMB FINANCIAL CORP | d87989dex991.htm |
 Strength in Balance. July 28, 2015 UMB Financial Exhibit 99.2 |
 2 Cautionary Notice about Forward-Looking Statements This presentation contains, and our other communications may contain, forward-looking statements within the meaning of the Private
Securities Litigation Reform Act of 1995. These statements can be
identified by the fact that they do not relate strictly to historical or
current facts—such as our statements about expected cost savings.
Forward-looking statements often use words such as “believe,”
“expect,” “anticipate,” “intend,” “estimate,”
“project,” “outlook,” “forecast,” “target,” “trend,” “plan,” “goal,” or other words of comparable meaning or future-tense or conditional verbs such as “may,” “will,” “should,” “would,” or
“could.” Forward-looking statements convey our
expectations, intentions, or forecasts about future events, circumstances, results, or
aspirations. All forward-looking statements are subject to
assumptions, risks, and uncertainties, which may change over time and many of which are beyond our control. You should not rely on any forward-looking statement as a prediction or guarantee about the future. Our actual future
objectives, strategies, plans, prospects, performance, condition, or
results may differ materially from those set forth in any forward-
looking statement. Some of the factors that may cause actual results or other future events, circumstances, or aspirations to differ from those in forward-looking statements are described in our Annual Report on Form 10-K for the year ended December 31, 2014, our
subsequent Quarterly Reports on Form 10-Q or Current Reports on Form
8-K, or other applicable documents that are filed or furnished with
the Securities and Exchange Commission (SEC). Any forward-looking
statement made by us or on our behalf speaks only as of the date that it was made. We do not undertake to update any forward-looking statement to reflect the impact of events, circumstances, or results that arise after the date that the statement was
made. You, however, should consult further disclosures (including
disclosures of a forward-looking nature) that we may make in any
subsequent Annual Report on Form 10-K, Quarterly Report on Form 10-Q, Current
Report on Form 8-K, or other applicable document that is filed or
furnished with the SEC. |
 2Q
2015 Performance Highlights |
 $ in
thousands, except per-share data; unaudited 4
2Q'15 2Q'14 1Q'15 vs. 2Q'14 vs. 1Q'15 Net Interest Income 97,360 $ 86,170 $ 90,358 $ 13.0 7.7 Noninterest Income 119,550 134,001 125,207 (10.8) (4.5) Pre-Provision Net Revenue 216,910 220,171 215,565 (1.5) 0.6 Noninterest Expense 171,964 166,201 164,413 3.5 4.6 Income Before Provision & Taxes 44,946 53,970 51,152 (16.7) (12.1) Provision for loan losses 5,000 5,000 3,000 - 66.7 Income before Taxes 39,946 48,970 48,152 (18.4) (17.0) Income Tax Provision 9,732 14,298 14,387 (31.9) (32.4) Net Income 30,214 $ 34,672 $ 33,765 $ (12.9) (10.5) Diluted EPS 0.65 $ 0.76 $ 0.74 $ (14.5) (12.2) Dividends per share 0.235 0.225 0.235 4.4 0.0 WASO (diluted) 46,611,096 45,421,148 45,437,654 2.6 2.6 % variance Earnings Summary – 2Q 2015
|
 Key
Performance Metrics 5
*Tier 1 Capital calculated under Basel III requirements beginning in
1Q’15. 2Q'15
1Q'15 4Q'14 3Q'14 2Q'14 ROAE 6.95% 8.18% 6.47% 8.77% 8.77% ROAA 0.70% 0.81% 0.66% 0.90% 0.89% Efficiency Ratio 76.41% 75.67% 77.46% 72.25% 73.18% Net Interest Margin 2.59% 2.46% 2.52% 2.53% 2.53% Noninterest Income % of revenue 55.1% 58.1% 55.9% 59.1% 60.9% Avg. Loan/Deposit Ratio 60.1% 56.3% 57.0% 55.9% 56.2% Assets Under Mgmt. (billions) 42.5 $ 42.3 $ 42.8 $ 42.1 $ 43.7 $ Tier 1 Capital Ratio 12.77%* 12.91%* 13.29% 13.72% 13.81% Diluted EPS 0.65 $ 0.74 $ 0.59 $ 0.78 $ 0.76 $ |
 Select
Balance Sheet Items 6
$ in thousands, average balances; unaudited
Three Months Ended vs. June '14 vs. Mar '15 Avg. Balance Avg. Balance Avg. Balance Assets Loans, net of unearned interest 8,071,991 $ 3.55 6,897,840 $ 3.51 7,470,101 $ 3.49 17.0 8.1 Total securities 7,419,490 1.93 6,977,233 1.97 7,153,018 1.94 6.3 3.7 Total earning assets 15,974,980 2.70 14,526,859 2.63 15,765,321 2.56 10.0 1.3 Allowance for loan losses (77,667) (75,929) (76,574) 2.3 1.4 Total assets 17,413,000 $ 15,618,192 $ 16,831,955 $ 11.5 3.5 Liabilities and Shareholders' Equity Interest-bearing deposits 7,924,696 $ 0.18 7,126,614 $ 0.17 7,602,258 $ 0.16 11.2 4.2 Total interest-bearing liabilities 9,690,359 0.19 8,725,371 0.17 9,321,497 0.16 11.1 4.0 Noninterest-bearing demand deposits 5,504,333 5,152,980 5,660,893 6.8 (2.8) Shareholders' Equity 1,744,632 1,585,612 1,674,761 10.0 4.2 Total liabilities and shareholders' equity 17,413,000 $ 15,618,192 $ 16,831,955 $ 11.5 3.5 Net interest spread 2.51 2.46 2.40 Net interest margin 2.59 2.53 2.46 % variance June 30, 2015 June 30, 2014 March 31, 2015 Avg Yield / Rate % Avg Yield / Rate % Avg Yield / Rate % |
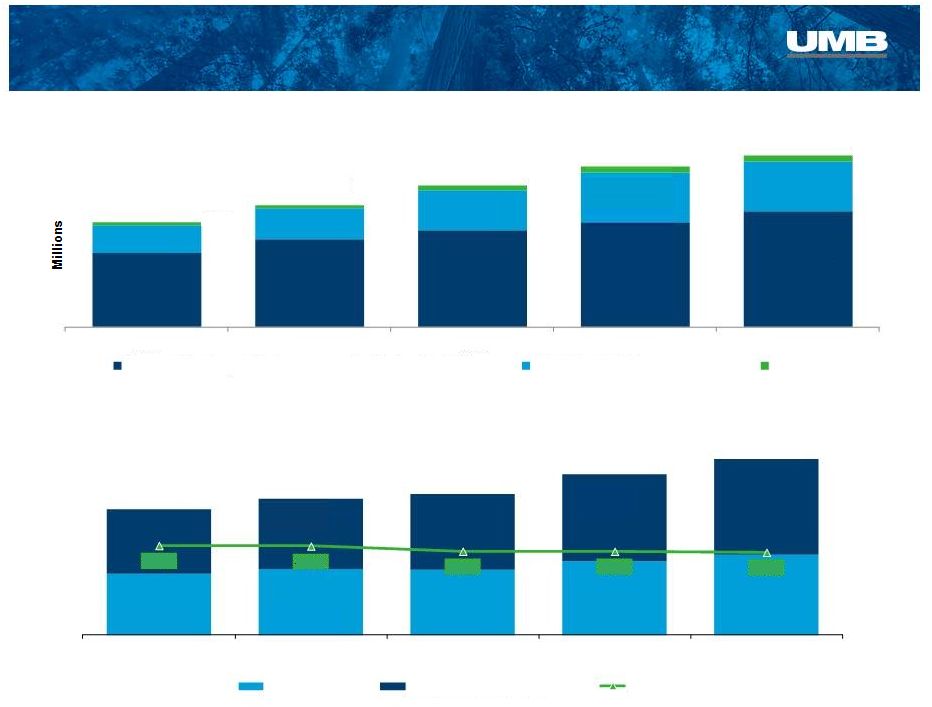
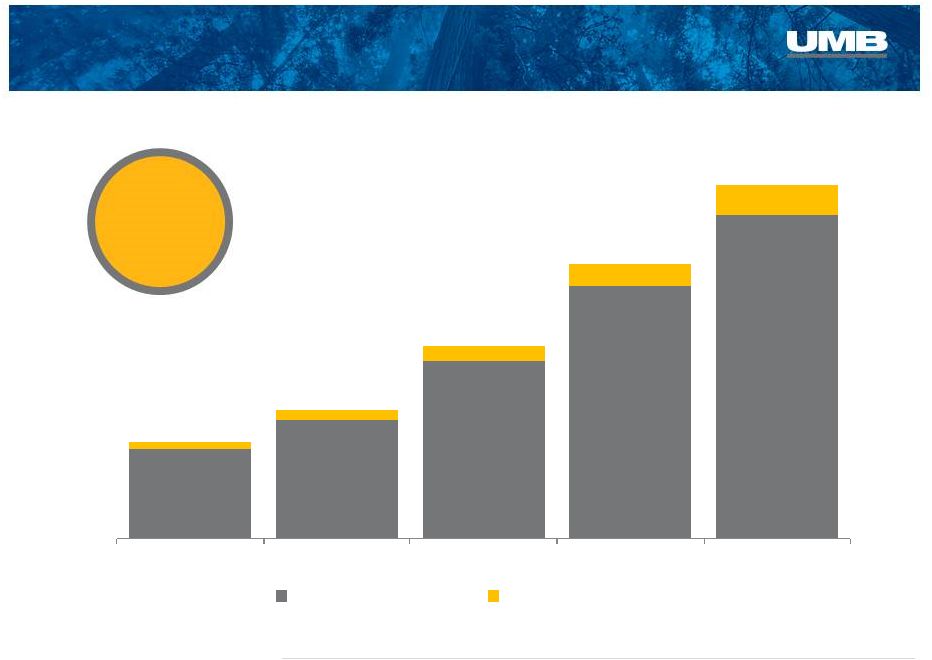
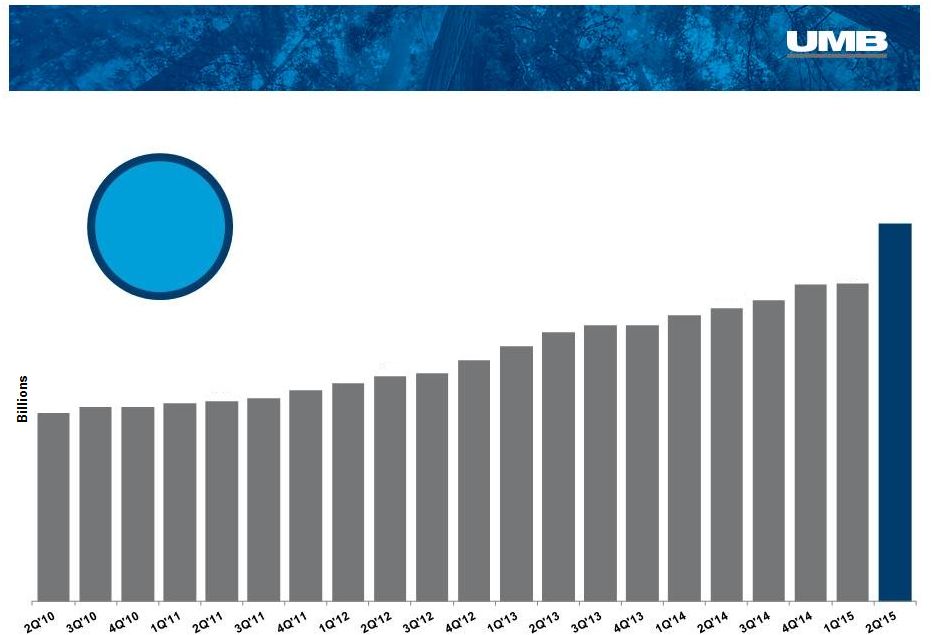 Consistent Loan Growth
7 End-of-Period Total Loans *On May 31, 2015, we closed the acquisition of Marquette Financial Companies and loans with an acquired value of $980.3 million were added to
the UMB portfolio. At June 30, the acquired loans plus production in the
legacy Marquette channels totaled $1.0 billion. *
$7.5 2Q’15 Total Loans +28.8% vs. 2Q’14 $4.4 $4.7 $5.3 $6.3 $6.9 $8.9 UMBF |
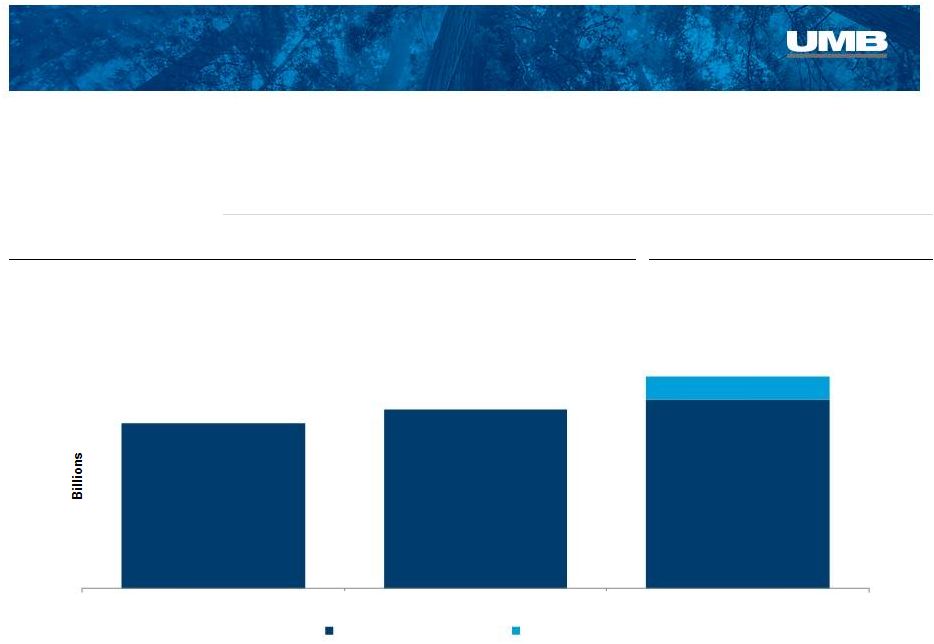 UMB and
Marquette Loans 8
$8.9 Legacy Marquette Loans (000s) June 30, 2014 March 31, 2015 May 31, 2015* June 30, 2015 vs. June '14 vs. Mar '15 vs. May '15 Legacy UMB Loans 6,920,683 7,498,308 - 7,916,178
14.4% 5.6% n/a Legacy Marquette Loans - -
980,250 999,950 n/a n/a 2.0% Total 6,920,683 7,498,308 n/a 8,916,128 28.8% 18.9% *acquisition value of Marquette loans at close Legacy UMB
Loans $7.9 $6.9 $7.5 2Q'14 1Q'15 2Q'15 Legacy UMB Legacy Marquette $1.0 |
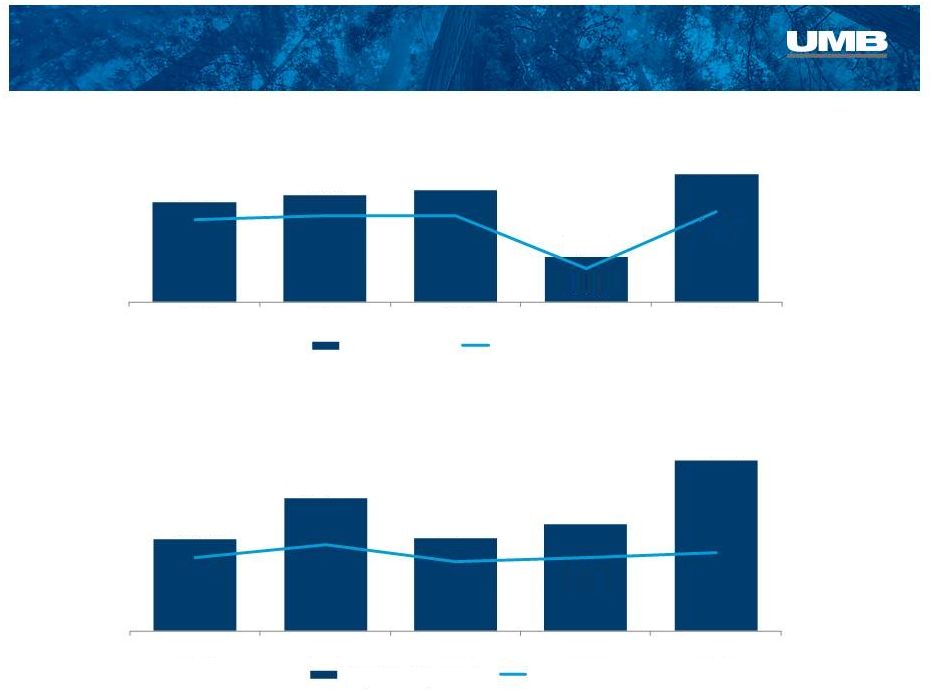 Quality
Credit Metrics Net Charge-Offs
$000’s 9 Nonperforming Loans $000’s $3,713 $3,985 $4,176 $1,661 $4,758 0.22% 0.23% 0.23% 0.09% 0.24% 2Q'14 3Q'14 4Q'14 1Q'15 2Q'15 NCOs/Avg. Loans $27,175 $32,662 $27,382 $29,187 $37,649 0.39% 0.46% 0.37% 0.39% 0.42% 2Q'14 3Q'14 4Q'14 1Q'15 2Q'15 Nonperforming Loans NPLs/Loans Net Charge-offs |
    2 Quarter 2015 Average Balance, AFS: $6.9 billion Average Yield: 1.81% Investment Mix Securities Available for Sale $6.9 billion June 30, 2015 Agencies High Quality Investment Portfolio 10 Corporates Municipals Mortgage-Backed Securities Treasuries AFS Portfolio Statistics Roll off Purchased ($ millions) Yield ($ millions) Yield 3Q'14 $244 1.98% $311 1.45% 4Q'14 $285 2.12% $382 1.55% 1Q'15 $333 2.02% $709 1.89% 2Q'15 $299 1.98% $498 1.90% Scheduled Cash Flow 3Q'15 $247 1.76% Next 12 months $1,267 1.53% Duration/Life
(in months) at 06/30/15 at 03/31/15 Avg. Life Total 45.83 43.67 Duration Total 39.29 37.57 Securities Gains $ in thousands 2Q'14 2,569 $ 3Q'14 26 $
4Q'14 62 $
1Q'15 7,336 $ 2Q'15 967 $
50.9% 31.1% 11.7% 5.1% 1.2% nd |
 38.5% 40.8% 41.7% 44.4% 40.6% $0.0 $3.0 $6.0 $9.0 $12.0 $15.0 Deposit Growth Deposits & Percent of Free Funds Actual EOP Balances; $ billions 11 2Q 2015 Cost of Interest-Bearing Liabilities 0.19% Including DDA 0.12% $9.9 $11.7 $10.3 $12.2 $14.5 Interest Bearing Non-Interest Bearing |
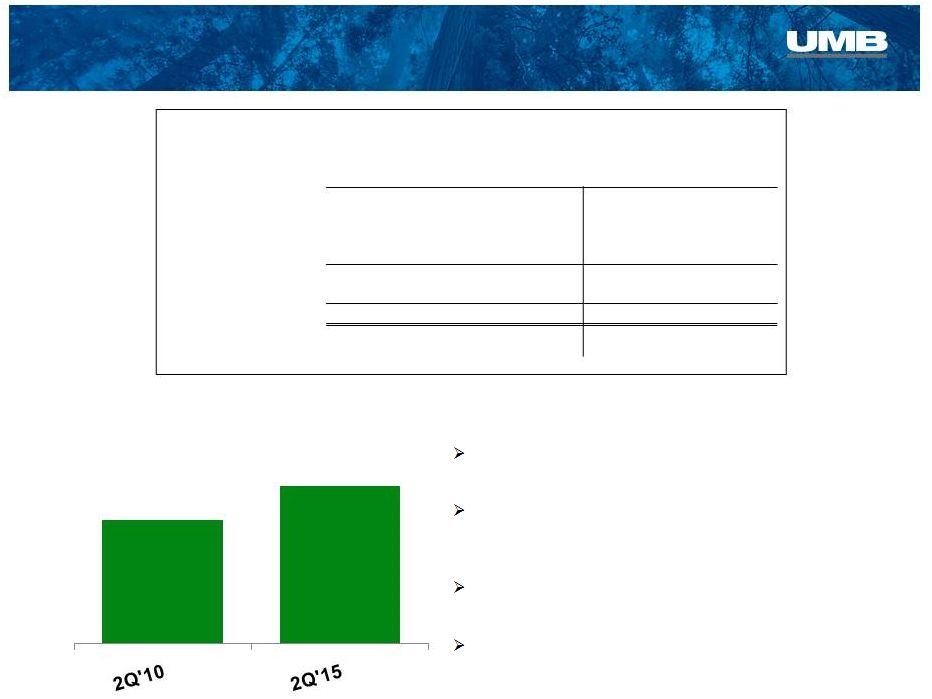
  11.92 14.43 14.04 13.77 11.05 13.61 13.29 12.77 6.81 8.41 8.72 9.56 12.64 2012 2013 2014 2Q'15* 13.07% 12.64% Industry Median Common Equity Tier 1 Ratio vs. Industry 2Q 2015 12 $1.05 $1.74 2Q'10 2Q'15 Average Equity ($ billions) Capital Ratio Trends Industry Median as of 1Q15; Source: SNL Financial *2Q’15 ratios calculated under Basel III requirements Total Risk-Based Capital Tier 1 Capital Tier 1 Leverage Common Equity Tier 1 Balance Sheet – Strong Capital Position |
 Noninterest Income 13 Noninterest income decreased $14.5 million, or 10.8%, compared to 2Q’14 Trust and securities processing income fell by $6 million, or 8.1%, to $67.4 million Equity earnings on alternative investments decreased $4.6 million compared to 2Q’14, due to a decline in unrealized gains on PCM equity method investments “Other” noninterest income decreased $3.0 million, due primarily to a gain on the sale of a branch property of $2.8 million recorded in 2Q’14 Gains on sales of securities of $967 thousand represented a decrease of $1.6 million compared to 2Q’14 2 nd Quarter ‘15 Highlights 000's 2Q'15 1Q'15 4Q'14 3Q'14 2Q'14 Trust and securities processing 67,381 67,299 69,072 74,062 73,357 Trading and investment banking 5,568 6,122 4,840 3,826 6,409 Service charges on deposits 21,625 21,541 21,480 21,634 20,627 Insurance fees and commisions 586 570 765 911 732 Brokerage fees 2,936 2,854 2,595 3,276 3,075 Bankcard fees 18,035 16,183 17,321 17,121 17,185 Gains on sales of securities 967 7,336 62 26 2,569 Equity earnings on alt. investments (1,125) (842) (4,487) 2,470 3,462 Other 3,577 4,144 3,600 3,149 6,585 Total noninterest income 119,550 $ 125,207 $ 115,248 $ 126,475 $ 134,001 $ |
 Bankcard Fees Trust & Securities Processing Revenue Trust & Securities Processing Composition:
Deposit Service Charges
Trust & Securities Processing
Brokerage Fees Trading & Investment Banking Other Gains on Sale of Securities ($ millions) Insurance Fees 14 Source of income: 2Q'15 2Q'14 Institutional Investment Mgmt. $25.7 $33.8 Asset Servicing $22.9 $22.4 Bank (inst. & personal asset mgmt.) $18.8 $17.2 $67.4 $73.4 Excludes ($1.1MM) from Equity Earnings on Alternative Investments, which represents (0.9%) of noninterest income
$38.6 $53.6 $55.8 $63.5 $73.4 $67.4 56.4% 18.1% 15.1% 4.6% 3.0% 2.4% 0.8% 0.5% Noninterest Income Composition – 2Q 2015
|
 Noninterest Expense 15 Noninterest expense increased $5.8 million, or 3.5%, compared to 2Q’14. Salaries and employee benefits expense increased $10.1 million, or 11.2%, year- over-year; Marquette added approximately $3.4 million in 2Q’15 Equipment expense increased $2.5 million, or 19.3%, due to software maintenance and amortization expense Regulatory environment Cyber security Modernization of systems Processing fees decreased 14.6% or $2.2 million, primarily due to lower fees paid to the distributors of the Scout Funds 2Q’14 included $5.3 million of contingency reserve expense related to the earn-out amount and related incentive bonus compensation for PCM employees 2 nd Quarter ’15 Highlights 000's 2Q'15 1Q'15 4Q'14 3Q'14 2Q'14 Salaries and employee benefits 99,585 98,537 90,115 90,041 89,532 Occupancy, net 10,312 10,010 10,312 10,475 9,705 Equipment 15,410 14,172 14,618 13,408 12,920 Supplies, postage and telephone 4,603 4,325 5,403 4,817 5,554 Marketing and business dev 6,530 4,618 7,182 6,057 6,307 Processing fees 12,654 12,783 13,496 14,085 14,817 Legal and consulting 5,917 4,378 7,907 4,496 4,632 Bankcard 4,953 4,768 6,812 4,097 4,997 Amortization of other intangibles 2,569 2,755 2,974 3,043 3,074 Regulatory fees 2,873 2,756 2,643 2,577 2,709 Contingency reserve - - - - 5,272 Other 6,558 5,311 5,251 8,365 6,682 Total noninterest expense 171,964 $ 164,413 $ 166,713 $ 161,461 $ 166,201 $ |
 Prairie
Capital Management Summary 16
Select Components of Noninterest Income and Expense Related to PCM
***Represents contingent consideration changes related to the settlement agreement for
specific private equity funds. **Represents contingent consideration
changes related to operational performance and hedge fund performance fees.
* Represents a contingency reserve related to the calculation of the earn-out
amount and related incentive bonus compensation to PCM employees. A
settlement agreement was executed on June 30, 2014 and subsequent entries are included in the Contingent Consideration Expense – Private Equity Unrealized Gains (or Losses) (unaudited) 2Q'14 1Q'15 2Q'15 Related Component of Noninterest Income - Equity Earnings on Alternative Investments
Hedge Fund Performance Fees / Investment Returns
(2) 15,559 223,789 Private Equity Unrealized Gains (or Losses) 3,461,584 (857,783) (1,348,228) Equity Earnings on Alternative Investments 3,461,582 (842,224) (1,124,439) Related Components of Noninterest Expense - Contingency Reserve Expense and Other
Contingency Reserve Expense*
(5,272,422) - - Other - Contingent Consideration Expense - PCM Purchase
Agreement** (196,251)
262,802 (56,241) Other - Contingent Consideration Expense - Private Equity Unrealized (Gains) or Losses***
- 772,005 1,213,405 Sum of These Components of Noninterest Expense (5,468,673) 1,034,807 1,157,164 |
 Business Segment Updates -
2Q 2015 |
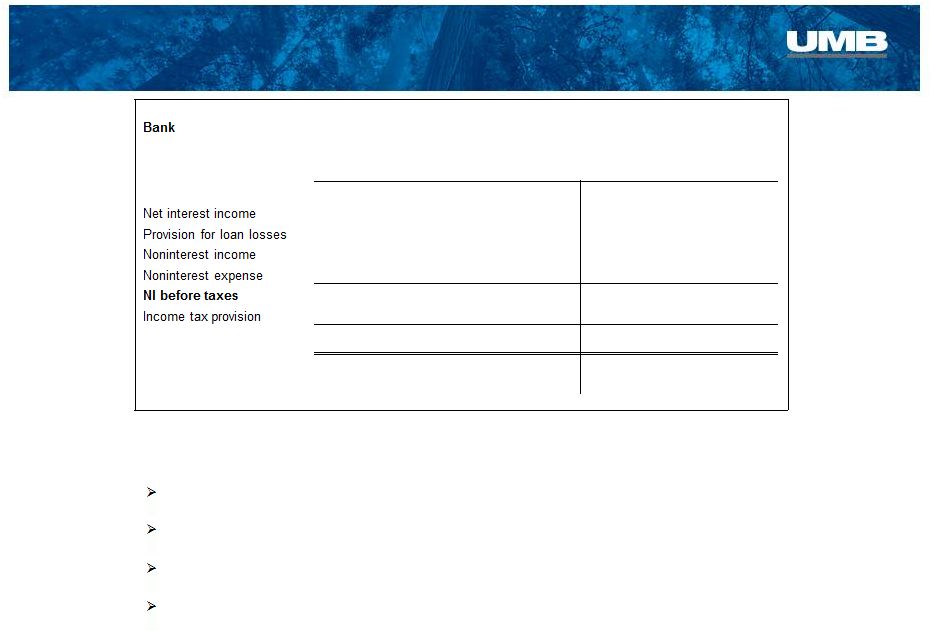 Bank 18 Loans at June 30, 2015 stood at $8.9 billion, an increase of 28.8% year-over-year
Total deposits at June 30 increased 19.1% vs. a year ago to $14.5 billion
Private banking average loans increased 32.2% year-over-year to $475.7
million HELOC’s continue to grow, standing at $698.8 million, a
16.6% increase vs. June 30, 2014 Highlights
Segment Results $ in 000s, unaudited 3 mos Ended % Change 3 mos Ended % Change June 30, Y/Y March 31, LQ 2015 2014 2015 $ 82,758 $ 72,481 14.2% $ 75,327 9.9% 2,612 2,686 -2.8% 1,600 63.3% 47,548 56,024 -15.1% 51,551 -7.8% 107,293 100,788 6.5% 100,748 6.5% 20,401 25,031 -18.5% 24,530 -16.8% 4,915 7,482 -34.3% 7,344 -33.1% Net income $ 15,486 $ 17,549 -11.8% $ 17,186 -9.9% pre-tax profit margin 15.7% 19.5% 19.3% |
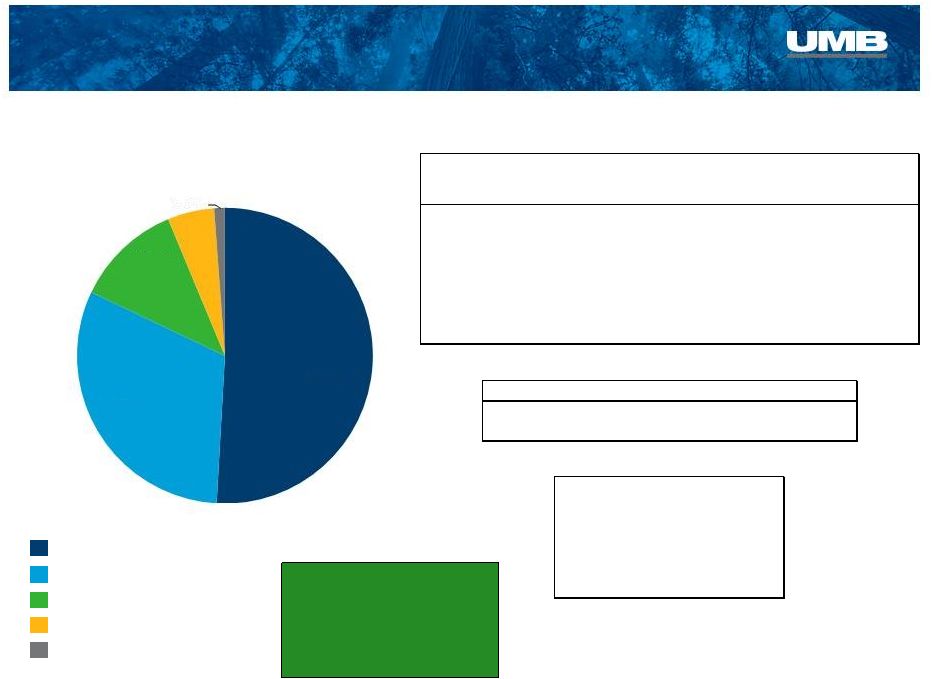
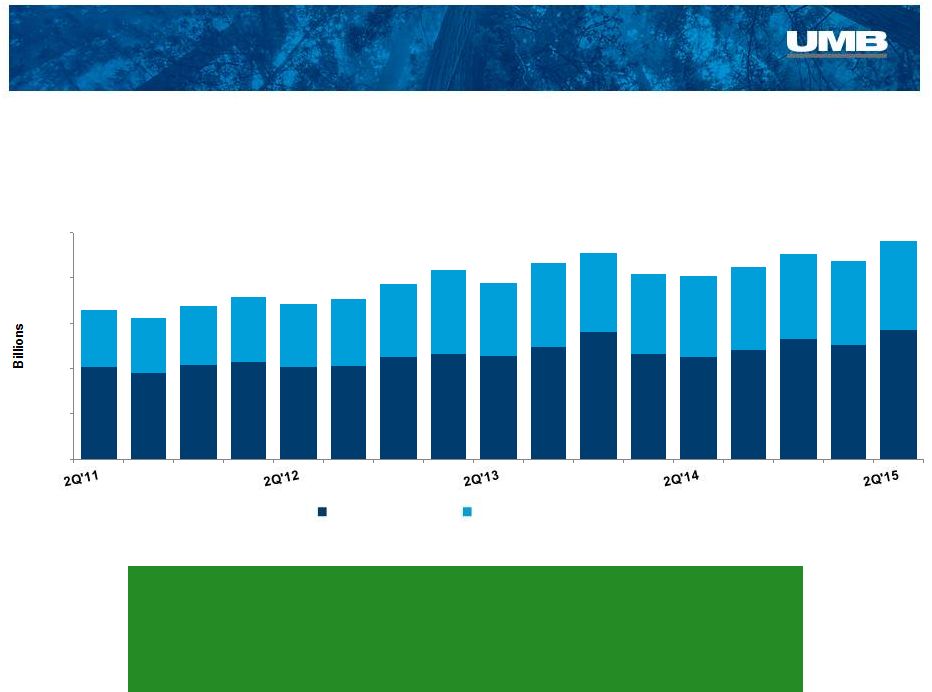
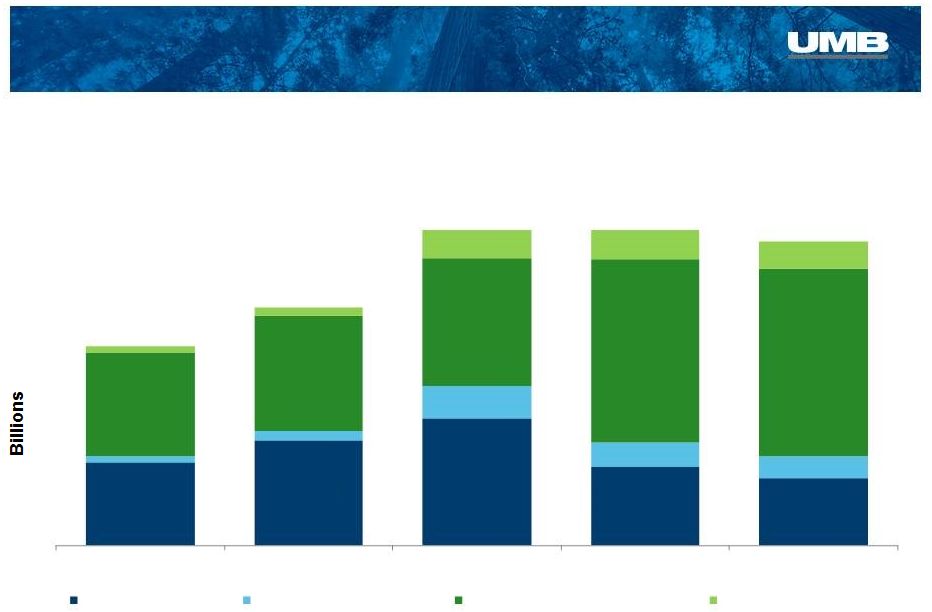
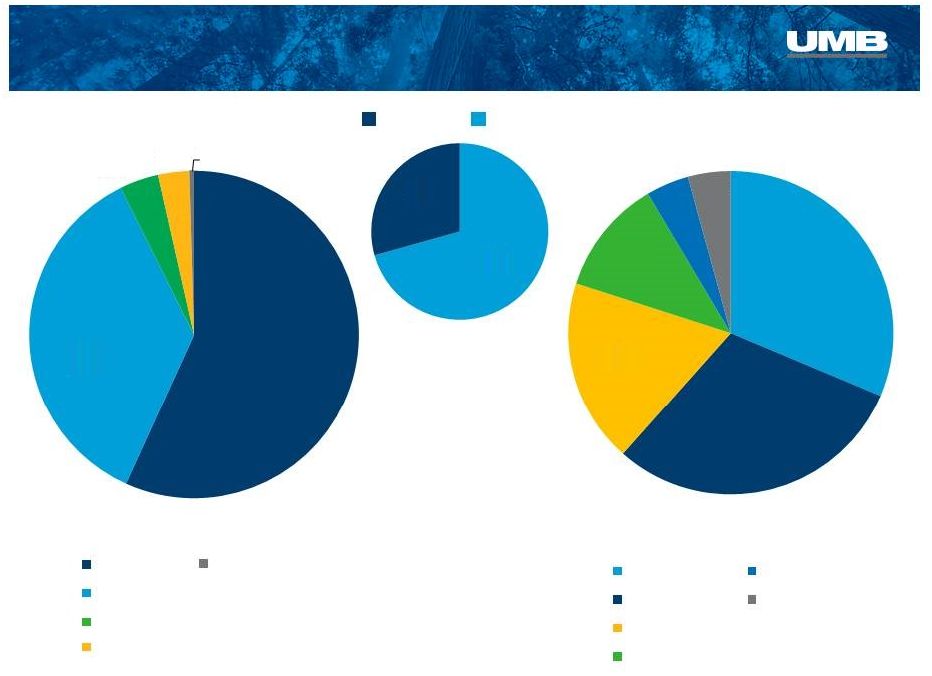
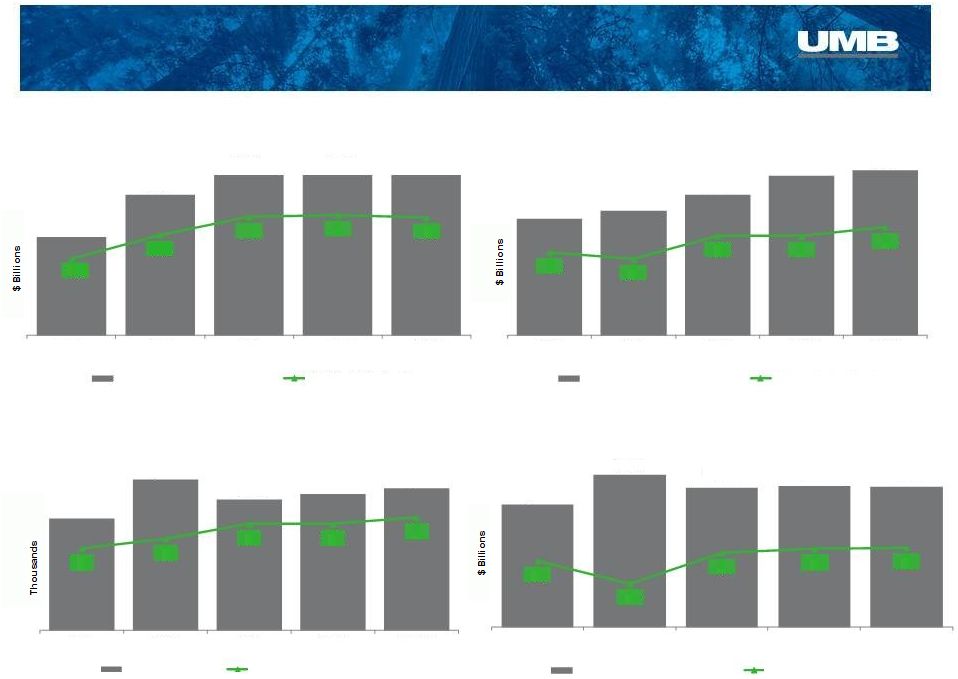
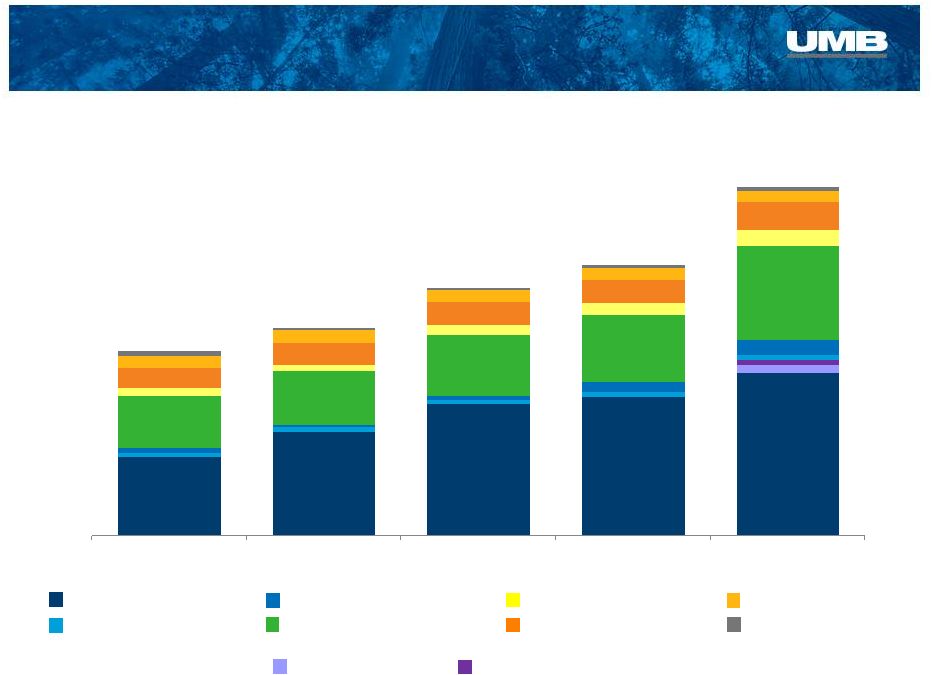 42.6% 49.9% 53.0% 51.5% 46.8% 2.4% 3.4% 4.4% 28.3% 25.4% 24.8% 25.0% 26.8% 4.2% 3.7% 3.9% 4.3% 4.9% 10.6% 10.5% 9.0% 8.7% 7.8% 6.7% 6.0% 4.9% 4.4% 3.2% 2.8% 1.0% 0.9% 1.0% 1.1% 2Q'11 2Q'12 2Q'13 2Q'14 2Q'15 Bank – Loan Composition 19 Diverse Loan Book (Actual Loan Balances at June 30) $4.7B $5.3B $6.3B $6.9B $8.9B Commercial Credit Card Commercial & Industrial* HELOC Residential Real Estate Real Estate Construction Commercial Real Estate Consumer Credit Card Consumer Other 1.4% 1.2% 1.7% 1.7% 1.8% 1.5% 2.0% 2.8% 2.0% Factoring Loans Asset Based Loans *Includes Leases |
 Bank
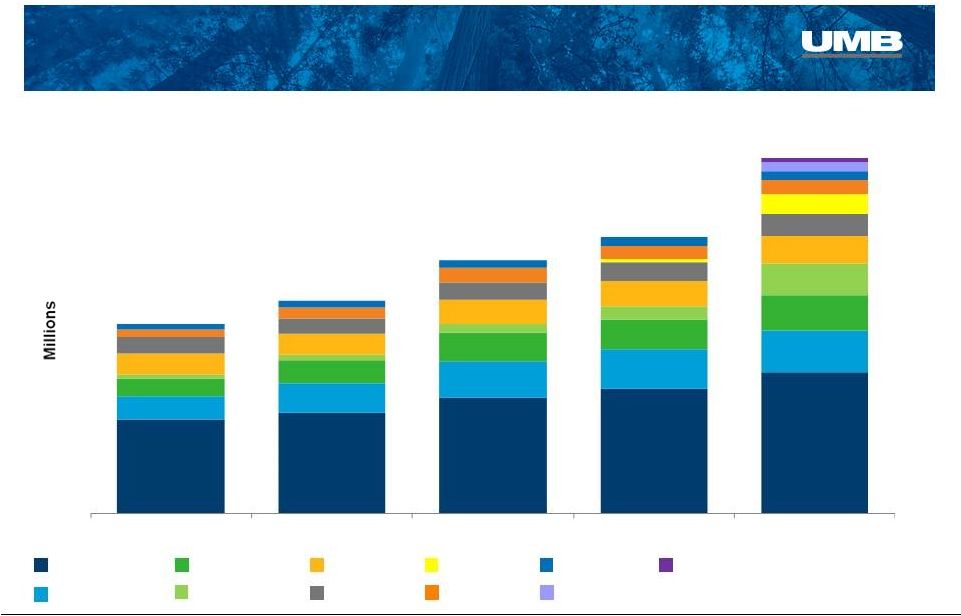
–Lending High Growth Regions
2Q’15 vs. 2Q’14
20 Texas +96% Kansas +22% Arizona +32% Loans by Region (Actual Loan Balances at June 30) $111.4 $205.8 $109.1 $145.9 $146.1 $189.2 $229.8 $201.8 $88.5 $223.1 $4.7B $5.3B $6.3B $6.9B $8.9B Colorado Kansas City Kansas Greater MO St. Louis Arizona Texas Oklahoma Marquette Transportation Fin (Natl. Sales) Nebraska Marquette Business Credit (Natl. Sales) $219.4 $107.4 ** Arizona loan balances include $448.2MM legacy UMB loans and $346.1MM legacy Marquette loans.
* Texas loan balances include $173.8 MM legacy UMB loans and $327.1MM legacy Marquette
loans. * ** $2,353.4 $2,544.3 $2,913.9 $3,127.3 $3,559.0 $582.2 $730.2 $899.6 $979.0 $1,023.7 $460.9 $557.3 $723.2 $748.9 $889.9 $340.1 $794.3 $503.0 $509.3 $591.1 $637.9 $692.0 $405.5 $404.6 $437.0 $452.2 $550.7 $277.9 $355.1 $345.0 $355.7 2Q'11 2Q'12 2Q'13 2Q'14 2Q'15 $500.9 |
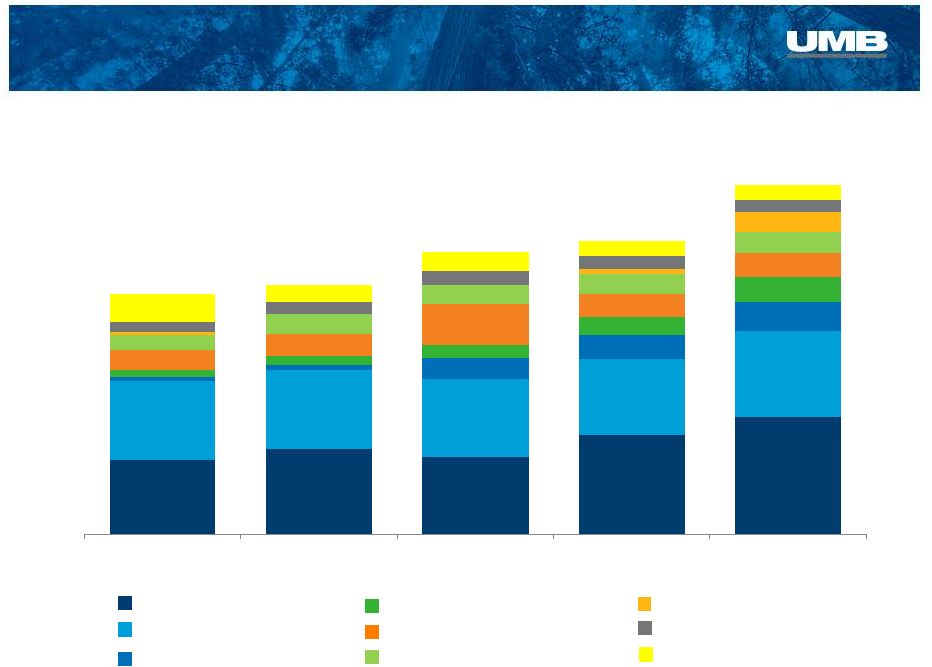 30.7% 34.1% 27.2% 33.6% 33.5% 33.4% 31.7% 27.6% 25.9% 24.8% 7.4% 8.2% 7.9% 3.8% 4.7% 6.2% 7.4% 8.2% 8.9% 14.1% 7.6% 6.7% 6.3% 7.6% 7.0% 7.2% 6.0% 5.8% 11.5% 7.2% 7.4% 5.4% 4.3% 4.2% 4.7% 4.5% 4.6% 3.6% 2Q'11 2Q'12 2Q'13 2Q'14 2Q'15 21 Diverse Sources of Deposits (Actual Deposits at June 30) $9.9B $10.3B $11.7B $12.2B $14.5B Commercial Asset Servicing Healthcare Small Business Other 2.6% 1.9% 0.1% 1.3% 1.3% 0.1% 1.8% Personal Banking - Consumer
Institutional - IAM
Institutional - IBIS Personal
Banking - Private Wealth Bank – Deposits |
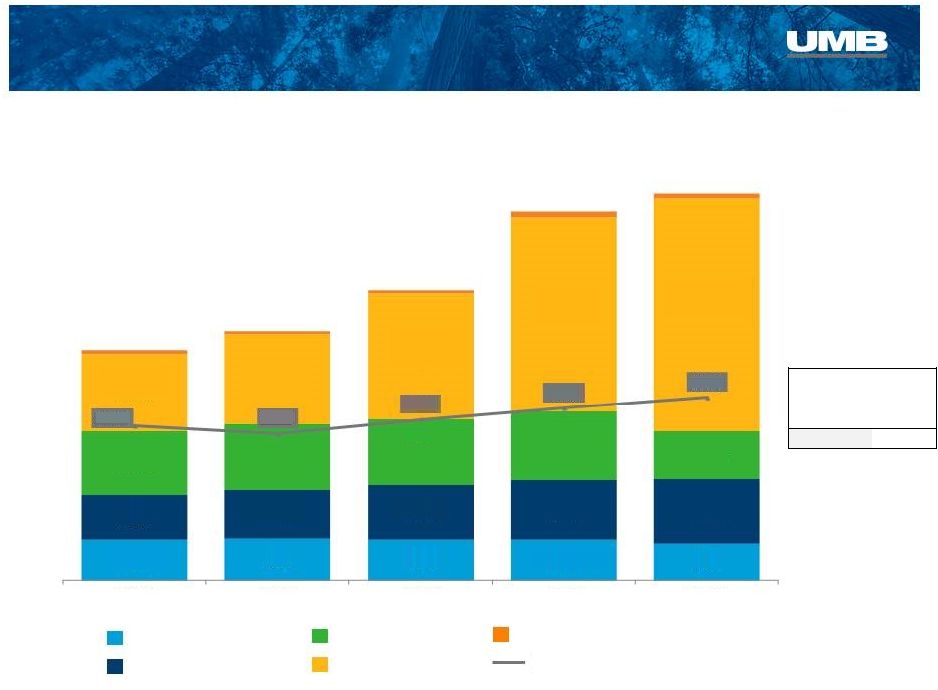
 $5,366
$6,390 $7,044 $7,610 $8,370 $2,035 $2,219 $2,853 $3,603 $3,677 $188 $226 $351 $419 $432 2011 2012 2013 2014 2Q'15 Prairie Capital Management Brokerage 22 $7.6B $8.8B $10.2B $11.6B $12.5B $1.1B $1.2B $1.2B $1.4B $1.5B Home Equity Lines of Credit $ in millions Assets Under Management $ in millions Bank – Asset Mgmt. & Home Equity Lending * *Includes $736.4 million from Marquette Asset Management $533 $574 $566 $644 $699 $559 $608 $663 $755 $836 48.8% 48.5% 46.1% 46.0% 45.5% 2011 2012 2013 2014 2Q'15 Balances Unused Commitments Utilization Personal Banking - Private Wealth & Institutional - IAM
|
 Institutional Investment Management
23 Highlights Institutional Investment Management Segment Results $ in 000s, unaudited 3 mos Ended % Change 3 mos Ended % Change June 30, Y/Y March 31, LQ 2015 2014 2015 Net Interest income $ - $ (1) 100.0% $ 1
-100.0% Noninterest income 25,684 33,999 -24.5% 27,084 -5.2% Noninterest expense 18,285 22,053 -17.1% 17,973 1.7% NI before taxes 7,399 11,945 -38.1% 9,112 -18.8% Income tax provision 1,785 3,389 -47.3% 2,717 -34.3% Net income $ 5,614 $ 8,556 -34.4% $ 6,395 -12.2% pre-tax profit margin 28.8% 35.1% 33.6% Scout assets under management now stand at $30.0 billion; 71% fixed income / 29% equity Net flows for 2Q were +$262.6 million fixed income and -$682.1 million equity |
 Total
AUM $30.0B
$19.7B $23.5B Institutional Investment Management 24 $31.2B $31.2B $8.2 $10.4 $12.6 $7.8 $6.7 $0.6 $0.9 $3.2 $2.4 $2.1 $10.3 $11.4 $12.6 $18.1 $18.5 $0.6 $0.8 $2.8 $2.9 $2.7 2011 2012 2013 2014 2Q'15 Equity Mutual Funds Equity Institutional & Other Fixed Income Institutional & Other Fixed Income Mutual Funds |
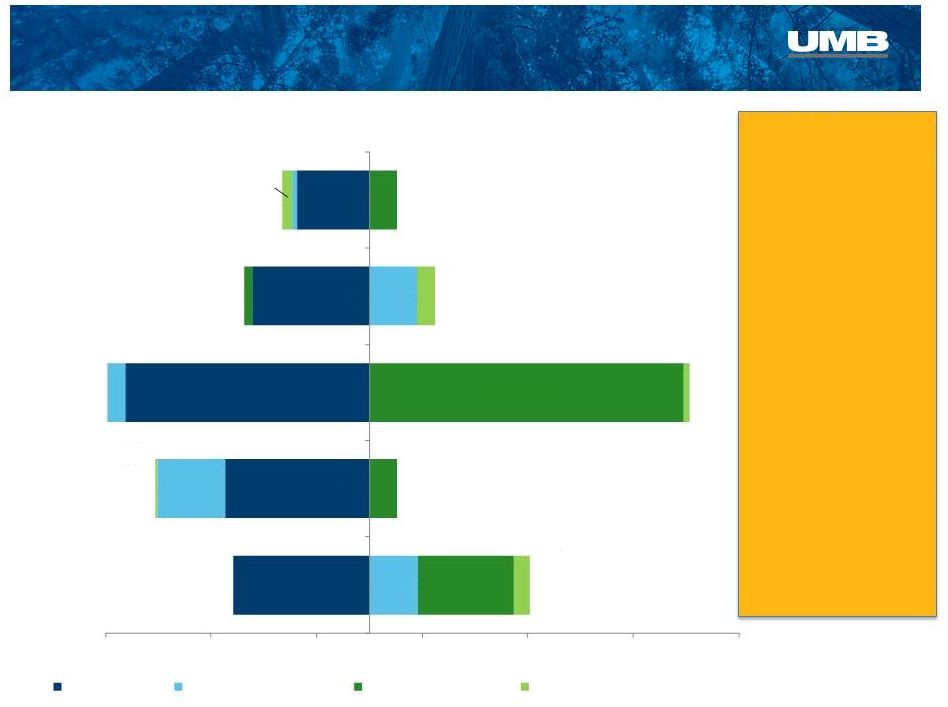 AUM
Drivers $ in millions
Institutional Investment Management
25 2Q’15 1Q’15 4Q’14 3Q’14 2Q’14 ($1,287.0) ($1,366.6) ($2,314.6) ($1,111.0) ($682.1) $455.4 ($645.6) ($166.3) $447.5 ($51.0) $908.9 $263.8 $2,976.0 ($79.3) $262.6 $153.4 ($18.6) $55.6 $172.0 ($97.2) -$2,500 -$1,500 -$500 $500 $1,500 $2,500 $3,500 $550.7 ($1,767.0) Total Change ($millions) $31,178.1 $30,627.3 Total AUM ($millions) $230.7 $32,394.3 ($570.7) $30,607.4 ($567.7) $30,039.7 Equity Flows Equity Market Impact Fixed Income Flows Fixed Income Market Impact |
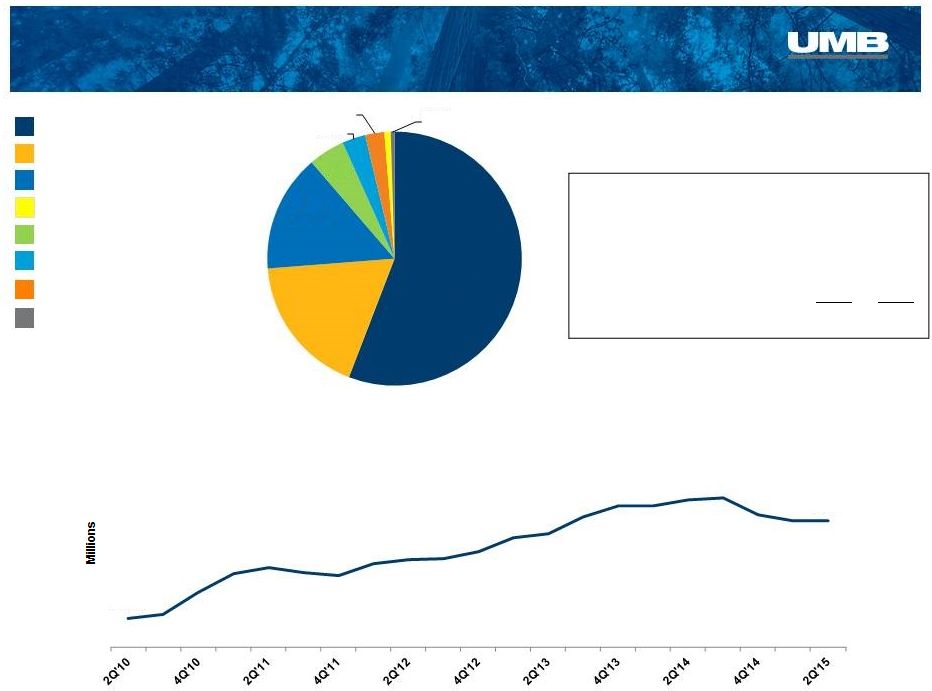
 AUM by
Strategy – As of June 30, 2015
Equity Strategies International Mid Cap International ADR Emerging Markets Global Small Cap Other: 26 Fixed Income Strategies Core Plus Low Duration Long Duration Intermediate Core Unconstrained Real Return Equity Fixed Income Other: Equity Opportunity Global Aggregate 3.8% 0.5% 35.9% 56.8% 3.0% 71% 29% 31.3% 30.2% 18.4% 11.5% 4.3% 4.3% |
 Payment
Solutions 27
Highlights Payment Solutions Segment Results $ in 000s, unaudited
3 mos Ended % Change 3 mos Ended % Change June 30, Y/Y March 31, LQ 2015 2014 2015 Net interest income $ 13,599 $ 12,390 9.8% $ 14,033 -3.1% Provision for loan losses 2,388 2,314 3.2% 1,400 70.6% Noninterest income 23,293 21,201 9.9% 23,138 0.7% Noninterest expense 26,399 24,506 7.7% 24,396 8.2% NI before taxes 8,105 6,771 19.7% 11,375 -28.7% Income tax provision 2,046 1,931 6.0% 3,406 -39.9% Net income $ 6,059 $ 4,840 25.2% $ 7,969 -24.0% pre-tax profit margin 22.0% 20.2% 30.6% Credit and debit card purchase volume for the second quarter was $2.3 billion,
generating $19.6 million in interchange revenue
The number of HSA accounts reached 621 thousand, for a nearly 35 percent
year- over-year growth rate
Successfully launched Apple Pay in the second quarter
Launched a general purpose reloadable card pilot program with a NetSpend branded “ReCharge Card” |
 Payment
Solutions Total Card Purchase Volume
& Interchange Revenue
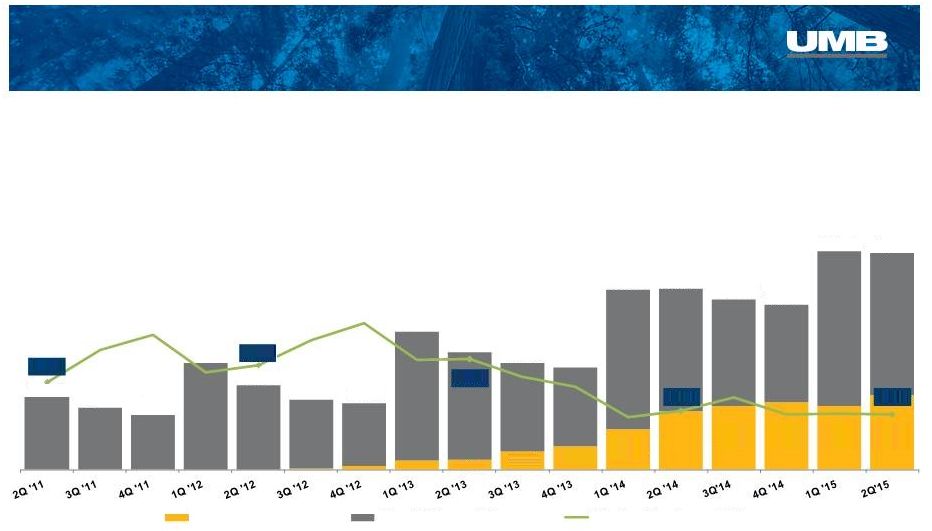
28 Commercial Credit Consumer Credit Consumer Debit Healthcare Debit Institutional Banking – IBIS Debit Interchange ($millions) $2.3B $1.4B $1.5B $1.7B $2.2B 1.5% 1.3% 1.1% 1.6% 1.4% Interchange Sources 2Q'15 ($millions) Credit 13.1 Debit 2.6 Healthcare 3.9 TOTAL $ 19.6 17.5% 16.4% 14.0% 11.0% 9.3% 19.5% 19.7% 18.8% 16.2% 16.8% 27.7% 26.3% 22.6% 18.5% 12.3% 33.8% 36.3% 43.5% 52.7% 60.2% $16.5 $15.6 $17.1 $18.4 $19.6 2Q '11 2Q '12 2Q '13 2Q '14 2Q '15 |
 29 Healthcare Purchase Volume Trends $millions * Interchange revenue from Healthcare cards divided by purchase volume on Healthcare cards
8.9% 16.9% 23.4% 22.7% 32.5% 37.7% 41.0% 29.0% 34.3% $461.2 $393.8 $350.0 $682.2 $536.4 $448.0 $421.4 $881.3 $748.6 $680.2 $649.1 $1,150.0 $1,152.1 $1,082.9 $1,052.3 $1,393.0 $1,379.7 0.33% 0.36% 0.36% 0.29% 0.28% Virtual Card Volume Other Healthcare Volume Effective Interchange Rate * Payment Solutions – Healthcare Services
|
 $298.4 $399.6 $595.0 $841.7 $1,078.5 $24.9 $30.9 $47.4 $75.8 $99.4 2011 2012 2013 2014 2Q'15 HSA Deposits HSA Investment Assets Payment Solutions – Healthcare Services 30 Healthcare Deposits and Assets $millions $323.3 $430.5 $642.4 $917.5 $1,177.9 Investment assets as a 2011 2012 2013 2014 2Q'15 % of total healthcare deposits & assets 7.7% 7.2% 7.4% 8.3% 8.4% Healthcare provided 7.4% of Total Deposits in 2Q’15 |
 Asset
Servicing 31
$159.5 $203.1 Assets Under Administration $billions Added 52 net new funds as transfer agent clients in the past 12 months Added 12 net new funds and increased assets under administration by 18.3% in the alternative space in the past 12 months UMB Fund Services named Top Workplace by Milwaukee Journal Sentinel for 6th straight year Fund Services ranks as the top Transfer Agent in US for Registered Closed-End Funds in the 2015 Mutual Fund Guide (ranking based on number of shareholders) Highlights Asset Servicing Segment Results $ in 000s, unaudited 3 mos Ended % Change 3 mos Ended % Change June 30, Y/Y March 31, LQ 2015 2014 2015 Net interest income $ 1,003 $ 1,300 -22.8% $ 997
0.6% Noninterest income 23,025 22,777 1.1% 23,434 -1.7% Noninterest expense 19,987 18,854 6.0% 21,296 -6.1% NI before taxes 4,041 5,223 -22.6% 3,135 28.9% Income tax provision 986 1,496 -34.1% 920 7.2% Net income $ 3,055 $ 3,727 -18.0% $ 2,215 37.9% pre-tax profit margin 16.8% 21.7% 12.8% |
 Asset
Servicing 32
Fund Accounting & Administration
Alternative Asset Servicing
Custody Transfer Agency $54.9 $68.0 $62.4 $63.1 $62.7 443 411 454 459 461 2012 2013 2014 1Q'15 2Q'15 Assets Under Administration # of Custody Accounts $26.3 $27.9 $31.5 $35.8 $37.1 532 514 579 579 604 2012 2013 2014 1Q'15 2Q'15 Assets Under Administration # of Funds Serviced 946.8 1,280.1 1,111.2 1,157.7 1,205.9 270 301 349 349 370 2012 2013 2014 1Q'15 2Q'15 # of Shareholders # of Funds Serviced $44.1 $63.0 $72.1 $72.0 $71.9 179 219 249 252 248 2012 2013 2014 1Q'15 2Q'15 Assets Under Administration # of Funds Serviced |
 Appendix UMB Financial Corporation Second Quarter 2015 |
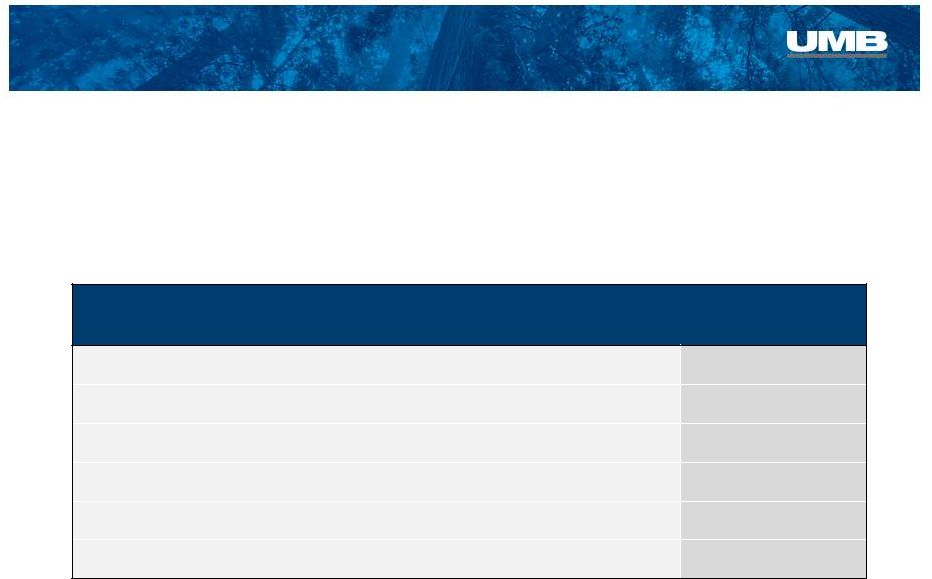 Non-GAAP Reconciliation
Price to MFC Tangible Book Value at May 31, 2015 GAAP Total Shareholders’ Equity (1) $127,277 Deduct: Goodwill and Other Intangibles ($7,626) Tangible Book Value $119,651 Total Consideration (2) $179,737 Price to Tangible Book Value 150% Price to GAAP Total Shareholders’ Equity 141% Note: Unaudited. Dollars in thousands. 34 (1) Source: MFC financial statements as of May 31, 2015. (2) Based on UMBF 05/29/15 closing share price of $51.79 and consideration of 3.47 million shares of UMBF stock,
subject to post-closing adjustments.
We provide information using the tangible book value (TBV) of Marquette Financial
Companies (MFC). This information supplements the results that are
reported according to generally accepted accounting principles (GAAP) and
should not be viewed in isolation from, or as a substitute for, GAAP
results. The difference between the TBV of MFC and the comparable GAAP measure is reconciled in this slide. We believe that this information and the reconciliation may be useful to
investors because TBV is commonly used by investors as an additional measure of a
company’s total value and the strength and adequacy of its
capital-management strategies. |
 Strength in balance –
today and tomorrow. Second Quarter 2015 UMB Financial |