Attached files
| file | filename |
|---|---|
| 8-K - 8-K - VISA INC. | d86330d8k.htm |
| EX-99.1 - EX-99.1 - VISA INC. | d86330dex991.htm |
 Visa
Inc. Fiscal Third Quarter 2015
Financial Results July 23, 2015 Exhibit 99.2 |
| Fiscal
Third Quarter 2015 Financial Results 2
This presentation contains forward-looking statements within the meaning of the U.S.
Private Securities Litigation Reform Act of 1995. Forward-looking
statements generally are identified by words such as "estimates,"
"expectation,“ “outlook,” "will," "continued" and other similar expressions. Examples of forward-looking statements include, but are not limited to, statements we make about our revenue, client incentives, operating margin, tax
rate, earnings per share, free cash flow, and the growth of those
items. By their nature, forward-looking statements: (i) speak only as
of the date they are made; (ii) are not statements of historical fact or guarantees of future performance; and (iii) are subject to risks, uncertainties, assumptions or changes in circumstances that are difficult to predict or quantify.
Therefore, actual results could differ materially and adversely from our
forward-looking statements due to a variety of factors, including the following: •the impact of laws, regulations and marketplace barriers, including: •rules capping debit interchange reimbursement rates and expanding financial institutions’ and merchants’ choices among debit
payments networks promulgated under the Dodd-Frank Wall Street Reform
and Consumer Protection Act; •increased regulation in jurisdictions
outside of the United States and in other product categories;
•increased government support of national payments networks outside the United
States; and •increased regulation of consumer privacy, data use and
security; •developments in litigation and government enforcement,
including those affecting interchange reimbursement fees, antitrust and tax; •new lawsuits, investigations or proceedings, or changes to our potential exposure in connection with pending lawsuits, investigations or
proceedings; •economic factors, such as:
•economic fragility in the Eurozone and in the United States;
•general economic, political and social conditions in mature and emerging markets
globally; •general stock market fluctuations, which may impact
consumer spending; •material changes in cross-border activity,
foreign exchange controls and fluctuations in currency exchange rates;
•volatility in market prices for oil and natural gas; and
•material changes in our financial institution clients' performance compared to
our estimates; •industry
developments, such as competitive pressure, rapid technological developments and disintermediation from our payments network; •system developments, such as: •disruption of our transaction processing systems or the inability to process transactions efficiently;
•account data breaches or increased fraudulent or other illegal activities
involving Visa-branded cards or payment products; and •failure
to maintain systems interoperability with Visa Europe; •any
prospective transaction with Visa Europe may not be agreed to or implemented; •costs arising if we become obligated to purchase all of Visa Europe’s outstanding capital stock;
•the loss of organizational effectiveness or key employees;
•the failure to integrate acquisitions successfully or to effectively develop new
products and businesses; •natural disasters, terrorist attacks,
military or political conflicts, and public health emergencies; and
various other factors, including those contained in our Annual Report on Form 10-K
for the year ended September 30, 2014, and our other filings with the U.S. Securities and Exchange Commission. You should not place undue
reliance on such statements. Except as required by law, we do not intend to
update or revise any forward–looking statements as a result of new information,
future developments or otherwise. Forward-Looking
Statements |
 Fiscal
Third Quarter 2015 Financial Results 3
Solid Fiscal Third Quarter Results
Solid operating revenues of $3.5 billion, up 12% over prior
year Repurchased 15.5 million shares of class A common stock in the open market at an average price of $68.05 per share, using $1.1 billion of cash on hand Continued positive secular trends and spending momentum contributed to growth in key underlying business drivers Adjusted quarterly net income of $1.8 billion and diluted earnings per share of $0.74 Note: See appendix for reconciliation of adjusted non-GAAP measures to the closest comparable GAAP measures.
|
 Fiscal
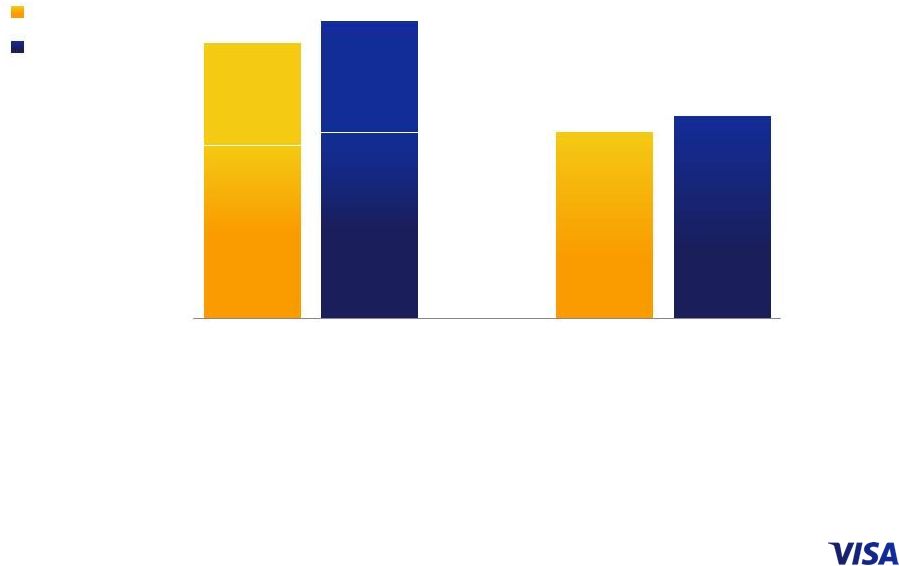
Third Quarter 2015 Financial Results 4
Quarter ended March Payments Volume US$ in billions, nominal, except percentages INTL 540 INTL 428 INTL 115 INTL 111 U.S. 575 U.S. 269 U.S. 305 1,108 1,168 687 731 421 437 INTL = International Total Visa Inc. Credit Debit INTL = International YOY Change (constant) 11% 13% 8% YOY Change (nominal) 6% 4% 5% Note: Figures may not recalculate exactly due to rounding. Percentage changes are calculated based on unrounded numbers. On occasion,
previously submitted volume information may be updated to reflect revised
client submissions or other adjustments. Prior period updates are not
material. Constant dollar growth rates exclude the impact of foreign currency
fluctuations against the U.S. dollar in measuring performance.
2014 2015 INTL 533 INTL 417 U.S. 628 U.S. 303 U.S. 325 |
 Fiscal
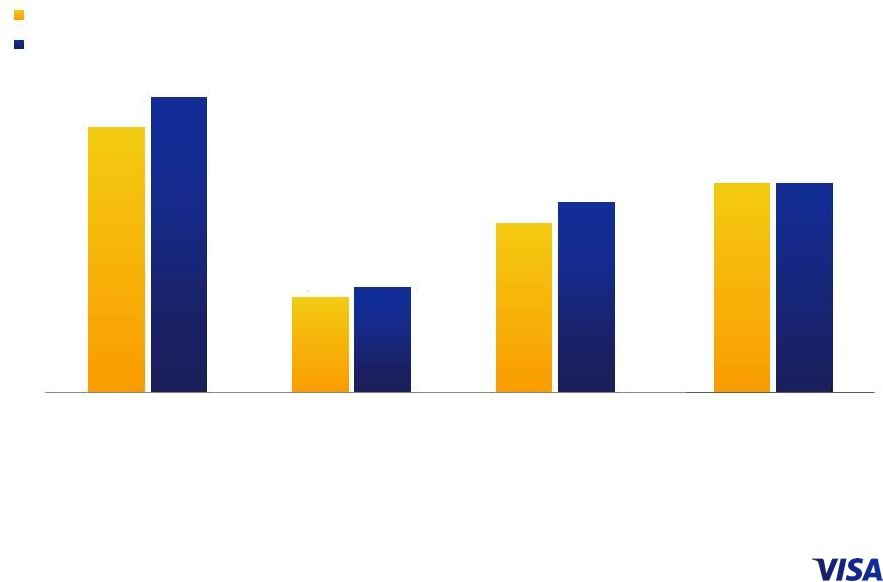
Third Quarter 2015 Financial Results 5
Quarter ended June Payments Volume US$ in billions, nominal, except percentages YOY Change (constant) 11% 13% 7% YOY Change (nominal) 6% 3% 5% Note: Current quarter payments volume and other select metrics are provided in the operational performance data supplement in the press release
to provide more recent operating data. Service revenues continue to be recognized based on payments volume in the prior quarter. On occasion, reported payments volume information may be updated to reflect revised client submissions or other adjustments. Prior period updates are not
material. Figures may not recalculate exactly due to rounding. Percentage
changes are calculated based on unrounded numbers. Constant dollar growth
rates exclude the impact of foreign currency fluctuations against the U.S. dollar in measuring performance. INTL 569 INTL 453 INTL 123 INTL 117 U.S. 683 U.S. 339 U.S. 344 1,191 1,252 744 791 448 461 INTL = International Total Visa Inc. Credit Debit 2014 2015 INTL 563 INTL 440 U.S. 628 U.S. 303 U.S. 325 |
 Fiscal
Third Quarter 2015 Financial Results 6
YOY Change 10% 8% Quarter ended June Transactions in millions, except percentages Note: Processed transactions represent transactions involving Visa, Visa Electron, Interlink and Plus cards processed on Visa’s networks. As
a result of recent changes in Russian National Payment System law, we
have transitioned the processing of Russian domestic transactions to the Russian National Payment Card System during the third quarter of fiscal 2015. The number of transactions processed by our VisaNet system does not reflect Russian domestic transactions processed after transition. Total transactions represent payments and cash transactions as reported by Visa clients on their operating certificates. On occasion, previously
submitted transaction information may be updated to reflect revised
client submissions or other adjustments. Prior period updates are not material. Figures may not recalculate exactly due to rounding. Percentage changes are calculated based on unrounded numbers.
2014 2015 37% Credit 63% Debit 24,542 26,961 16,662 18,024 Processed Transactions Total Transactions 38% Credit 62% Debit |
 Fiscal
Third Quarter 2015 Financial Results 7
Quarter ended March Total Cards in millions, except percentages 2,253 817 1,437 2,420 864 1,556 Visa Inc. Credit Debit Note: The data presented is based on results reported quarterly by Visa clients on their operating certificates. Estimates may be utilized if
data is unavailable. On occasion, previously submitted card information
may be updated to reflect revised client submissions or other adjustments. Prior period updates are not material. Figures may not recalculate exactly due to rounding. Percentage changes are calculated based on unrounded numbers. YOY Change 6% 8% 7% 2014 2015 |
 Fiscal
Third Quarter 2015 Financial Results 8
YOY Change 5% 12% 10% Revenue – Q3 2015 US$ in millions, except percentages Note: Figures may not recalculate exactly due to rounding. Percentages are calculated based on unrounded numbers.
Fiscal 2015 % of Gross Revenues 16% 84% 3,793 (638) 3,155 4,188 (670) 3,518 Gross Revenues Client Incentives Net Operating Revenues Fiscal 2014 Fiscal 2015 |
 Fiscal
Third Quarter 2015 Financial Results 9
Revenue Detail – Q3 2015 US$ in millions, except percentages Note: Figures may not recalculate exactly due to rounding. Percentage changes are calculated based on unrounded numbers.
1,417 1,321 860 195 1,550 1,400 1,039 199 Service Revenues Data Processing Revenues International Transaction Revenues Other Revenues Fiscal 2014 Fiscal 2015 YOY Change 6% 21% 9% 2% |
 Fiscal
Third Quarter 2015 Financial Results 10
Operating Margin – Q3 2015 US$ in millions, except percentages Note: Operating margin is calculated as operating income divided by net operating revenues. Figures may not recalculate exactly due to rounding.
Percentages are calculated based on unrounded numbers.
YOY Change 11% 12% 12% — 3,155 1,135 2,020 3,518 1,256 2,262 Net Operating Revenues Total Operating Expenses Operating Income Fiscal 2014 Fiscal 2015 64% 64% Operating Margin |
 Fiscal
Third Quarter 2015 Financial Results 11
Operating Expenses – Q3 2015 US$ in millions, except percentages Note: Figures may not recalculate exactly due to rounding. Percentage changes are calculated based on unrounded numbers.
463 228 127 82 109 126 566 224 117 82 130 137 Personnel Marketing Network & Processing Professional Fees Depreciation & Amortization General & Administrative Fiscal 2014 Fiscal 2015 YOY Change (8%) — 22% 8% 19% (1%) |
| Fiscal
Third Quarter 2015 Financial Results 12
Other Financial Results • Cash, cash equivalents and available-for-sale investment securities of $8.0
billion at the end of the fiscal third quarter
• Free cash flow of $2.1 billion for the fiscal third quarter • Capital expenditures of $74 million during the fiscal third quarter |
               Fiscal
Third Quarter 2015 Financial Results 13
Financial Metrics for Fiscal Year 2015
• Constant dollar revenue growth of low double digits • Negative 2.5 ppts foreign currency impact Annual net revenue growth • Low-end of the 17.5% - 18.5% range Client incentives as % of gross revenues • Mid 60s Annual operating margin Annual operating margin • 29% to 30% range Tax rate Tax rate • Mid-teens range Annual adjusted diluted class A common stock earnings per share growth • Greater than $6 billion Annual free cash flow Annual free cash flow Note: Fiscal full-year 2015 annual adjusted diluted earnings per share growth assumes an adjusted basis for fiscal full-year
2014. |
 Appendix * * * * |
 Fiscal
Third Quarter 2015 Financial Results Reconciliation of Non-GAAP
Financial Results US$ in millions, except per share data
A-1 2015 2014 2015 2014 2015 2014 2015 2014 As reported 1,697 $ 1,360 $ 0.69 $ 0.54 $ 4,816 $ 4,365 $ 1.96 $ 1.72 $ Revaluation of Visa Europe put option 110 — 0.04 — 110 — 0.04 — As adjusted 1,807 $ 1,360 $ 0.74 $ 0.54 $ 4,926 $ 4,365 $ 2.00 $ 1.72 $ Diluted weighted-average shares outstanding 2,448 2,511 2,462 2,533 (1) Figures in the table may not recalculate exactly due to rounding. Diluted earnings per share figures are calculated based on unrounded numbers.
Prior period amounts have been retroactively adjusted for the
four-for-one split of class A common stock that was effected in the second quarter of fiscal 2015. Net Income Diluted Earnings per Share (1) Three Months Ended June 30, Nine Months Ended June 30, Net Income Diluted Earnings per Share (1) During the third quarter of fiscal 2015, we recorded an increase of $110 million in the fair value of the Visa Europe put option, resulting in
the recognition of non- cash, non-operating expense that we do
not believe is indicative of our operating performance. As such, we believe the presentation of adjusted financial results provides a clearer understanding of our operating performance for the current periods presented. This amount is not subject to income tax and
therefore has no impact on our reported income tax provision. There
were no comparable adjustments recorded for the three and nine months ended June 30, 2014. Net income, as adjusted, and diluted earnings per share, as adjusted, are non-GAAP financial measures and should not be relied upon as substitutes for
measures calculated in accordance with U.S. GAAP. The following
table reconciles our as-reported net income and diluted earnings per share, which are calculated in accordance with U.S. GAAP, to our net income, as adjusted, and diluted earnings per share, as adjusted, for the periods presented:
|
 Fiscal
Third Quarter 2015 Financial Results Calculation of Free Cash
Flow US$ in millions
A-2 (1) Includes changes in client incentives, trade receivable/payable, settlement receivable/payable and personnel incentives.
Additions (+) / Reductions (-) to Net Income Net income (as reported) 1,697 4,816 Capital Assets + Depreciation and amortization 130 375 - Capital expenditures (74) (276) 56 99 Litigation + Litigation provision — 3 - Settlement payments (38) (362) + Settlement payments funded by litigation escrow 34 355 (4) (4) Share-based Compensation + Share-based compensation 46 139 Pension + Pension expense 3 14 - Pension contribution — (2) 3 12 Taxes + Income tax provision 471 1,896 - Income taxes paid (516) (1,892) (45) 4 Visa Europe Put Option + Revaluation 110 110 Changes in Working Capital (1) +/- Changes in other working capital accounts 260 (178) Total Free Cash Flow 2,123 4,998 Three Months Ended June 30, 2015 Nine Months Ended June 30, 2015 |