Attached files
| file | filename |
|---|---|
| 8-K - 8-K - HD Supply Holdings, Inc. | a15-15710_18k.htm |
Exhibit 99.1
|
|
Power Solutions Sale Transaction July 16, 2015 Overview and Update |
|
|
Disclaimers Forward-Looking Statements This presentation includes “forward-looking statements” within the meaning of Section 27A of the Securities Act and Section 21E of the Exchange Act. Forward-looking statements are subject to known and unknown risks and uncertainties, many of which may be beyond our control. We caution you that the forward-looking information presented herein is not a guarantee of future events, and that actual events may differ materially from those made in or suggested by the forward-looking information contained in this presentation. In addition, forward-looking statements generally can be identified by the use of forward-looking terminology such as “may,” “plan,” “seek,” “comfortable with,” “will,” “expect,” “intend,” “estimate,” “anticipate,” “believe” or “continue” or the negative thereof or variations thereon or similar terminology. A number of important factors could cause actual events to differ materially from those contained in or implied by the forward-looking statements, including those factors discussed in our filings with the U.S. Securities & Exchange Commission (the “SEC”), including our annual report on Form 10-K, for the fiscal year ended February 1, 2015 and those described from time to time in our other filings with the SEC, which can be found at the SEC’s website www.sec.gov. Any forward-looking information presented herein is made only as of the date of this presentation, and we do not undertake any obligation to update or revise any forward-looking information to reflect changes in assumptions, the occurrence of unanticipated events, or otherwise. Non-GAAP Financial Measures HD Supply supplements its reporting net income (loss) with non-GAAP measurements, including Adjusted EBITDA, Adjusted net income (loss) and Adjusted net income (loss) per share. This supplemental information should not be considered in isolation or as a substitute for the GAAP measurements. Additional information regarding Adjusted EBITDA, Adjusted net income (loss) and Adjusted net income (loss) per share referred to in this presentation is included at the end of this presentation under “Reconciliation of Non-GAAP Measures.” |
|
|
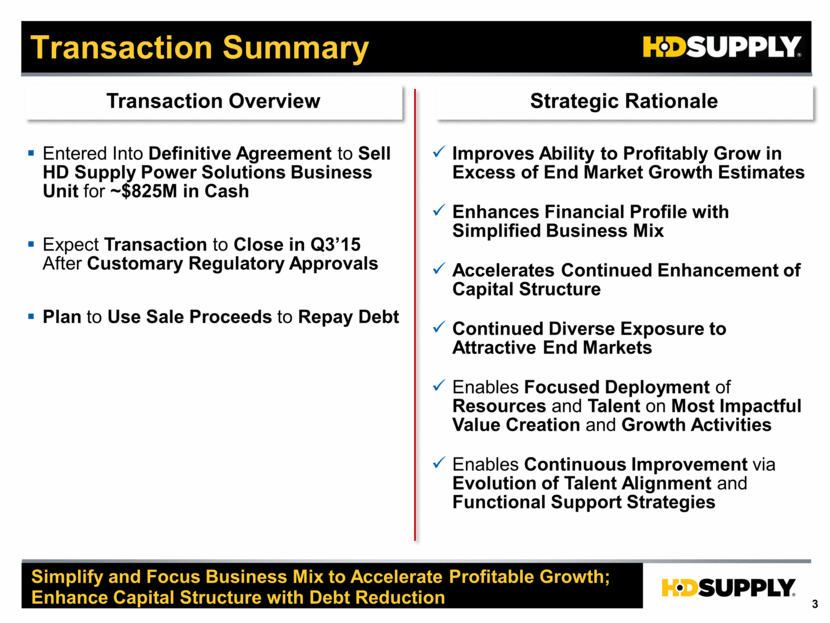
Transaction Summary Simplify and Focus Business Mix to Accelerate Profitable Growth; Enhance Capital Structure with Debt Reduction Transaction Overview Strategic Rationale Entered Into Definitive Agreement to Sell HD Supply Power Solutions Business Unit for ~$825M in Cash Expect Transaction to Close in Q3’15 After Customary Regulatory Approvals Plan to Use Sale Proceeds to Repay Debt Improves Ability to Profitably Grow in Excess of End Market Growth Estimates Enhances Financial Profile with Simplified Business Mix Accelerates Continued Enhancement of Capital Structure Continued Diverse Exposure to Attractive End Markets Enables Focused Deployment of Resources and Talent on Most Impactful Value Creation and Growth Activities Enables Continuous Improvement via Evolution of Talent Alignment and Functional Support Strategies |
|
|
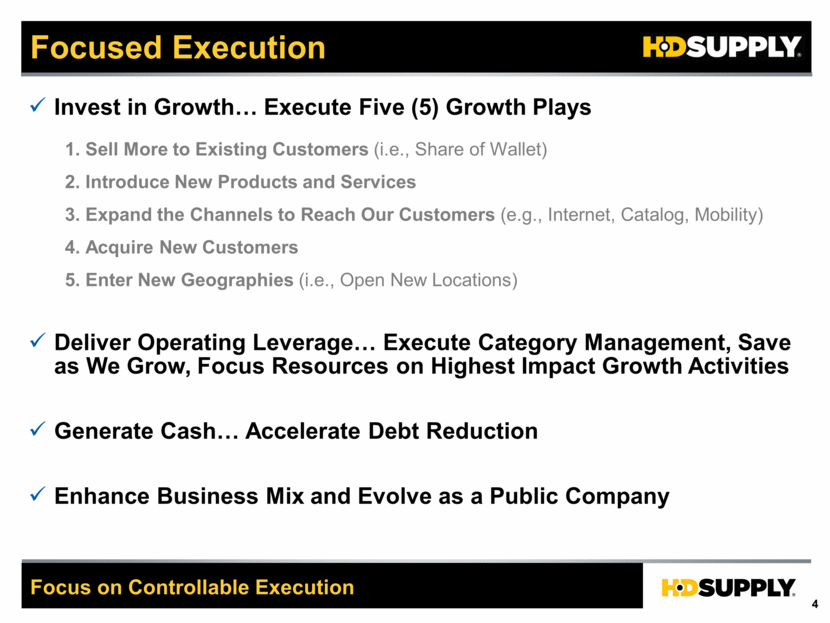
Focused Execution Focus on Controllable Execution Invest in Growth Execute Five (5) Growth Plays Sell More to Existing Customers (i.e., Share of Wallet) Introduce New Products and Services Expand the Channels to Reach Our Customers (e.g., Internet, Catalog, Mobility) Acquire New Customers Enter New Geographies (i.e., Open New Locations) Deliver Operating Leverage Execute Category Management, Save as We Grow, Focus Resources on Highest Impact Growth Activities Generate Cash Accelerate Debt Reduction Enhance Business Mix and Evolve as a Public Company |
|
|
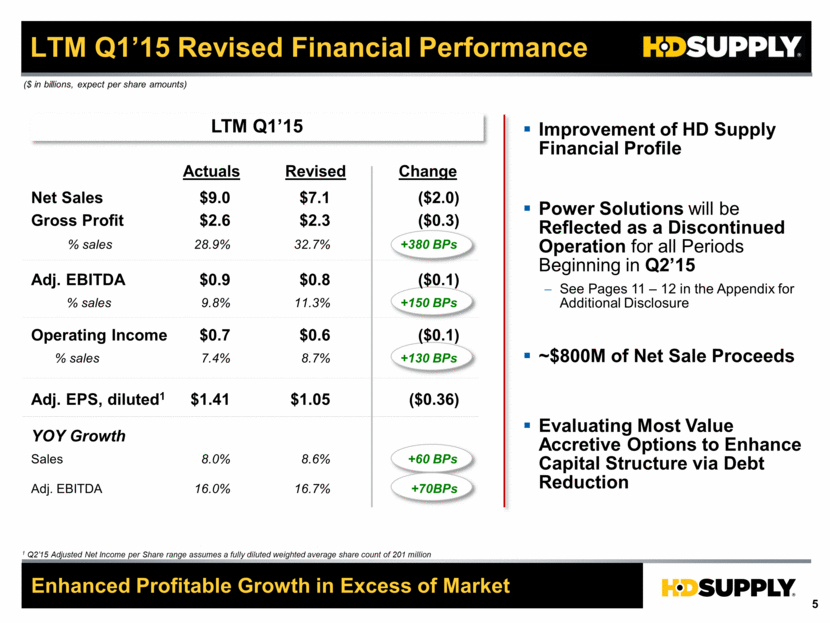
LTM Q1’15 Revised Financial Performance Enhanced Profitable Growth in Excess of Market ($ in billions, expect per share amounts) LTM Q1’15 Improvement of HD Supply Financial Profile Power Solutions will be Reflected as a Discontinued Operation for all Periods Beginning in Q2’15 See Pages 11 – 12 in the Appendix for Additional Disclosure ~$800M of Net Sale Proceeds Evaluating Most Value Accretive Options to Enhance Capital Structure via Debt Reduction Gross Profit Net Sales % sales Adj. EBITDA Operating Income Adj. EPS, diluted1 % sales % sales YOY Growth Sales Adj. EBITDA Actuals $9.0 $2.6 28.9% $0.9 9.8% $0.7 7.4% $1.41 8.0% 16.0% Revised $7.1 $2.3 32.7% $0.8 11.3% $0.6 8.7% $1.05 8.6% 16.7% Change ($2.0) ($0.3) +380 BPs ($0.1) +150 BPs ($0.1) +130 BPs ($0.36) +60 BPs +70BPs 1 Q2’15 Adjusted Net Income per Share range assumes a fully diluted weighted average share count of 201 million |
|
|
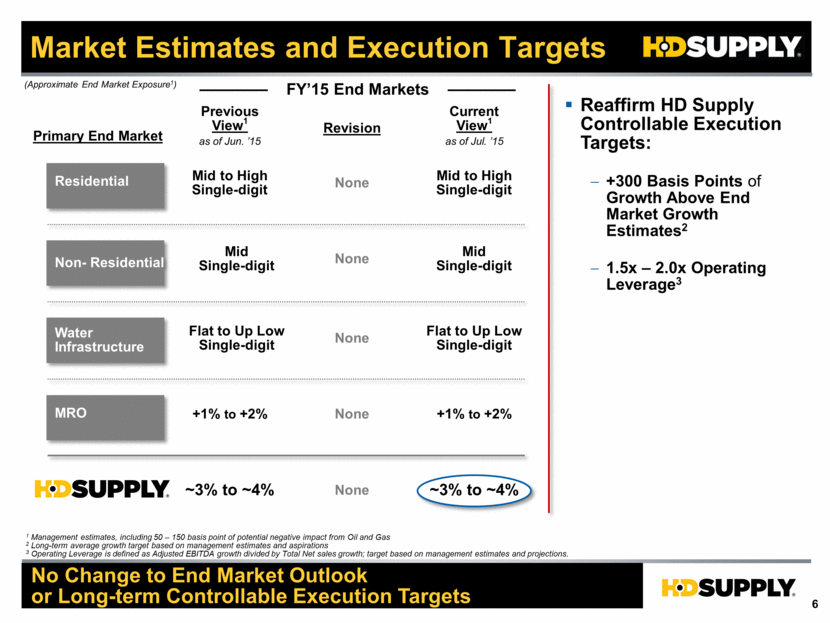
Market Estimates and Execution Targets No Change to End Market Outlook or Long-term Controllable Execution Targets 1 Management estimates, including 50 – 150 basis point of potential negative impact from Oil and Gas 2 Long-term average growth target based on management estimates and aspirations 3 Operating Leverage is defined as Adjusted EBITDA growth divided by Total Net sales growth; target based on management estimates and projections. (Approximate End Market Exposure1) Residential Water Infrastructure MRO Primary End Market Flat to Up Low Single-digit Non- Residential ~3% to ~4% FY’15 End Markets +1% to +2% Previous View1 as of Jun. ’15 +1% to +2% Current View1 as of Jul. ’15 Mid to High Single-digit Mid Single-digit Mid Single-digit Mid to High Single-digit Flat to Up Low Single-digit ~3% to ~4% Revision None None None None None Reaffirm HD Supply Controllable Execution Targets: +300 Basis Points of Growth Above End Market Growth Estimates2 1.5x – 2.0x Operating Leverage3 |
|
|
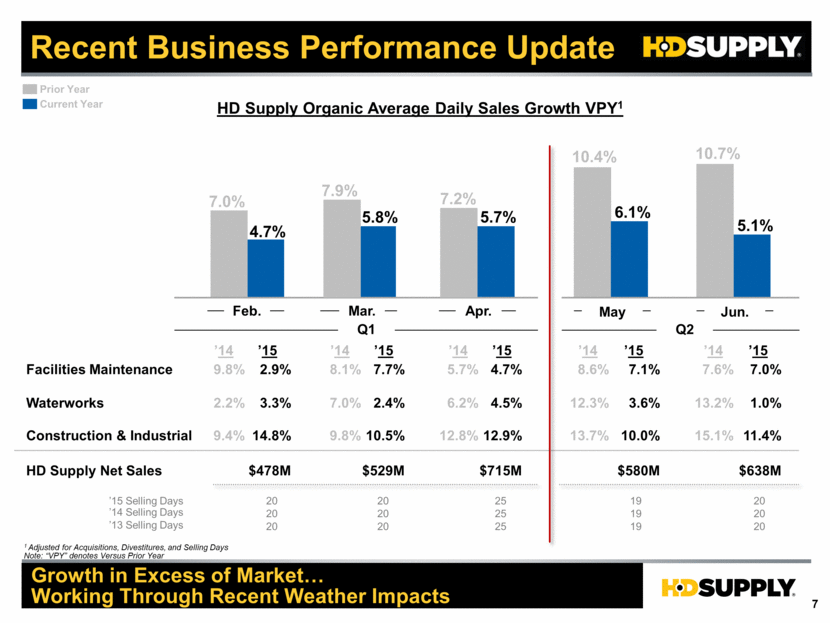
Recent Business Performance Update HD Supply Organic Average Daily Sales Growth VPY1 Growth in Excess of Market Working Through Recent Weather Impacts 1 Adjusted for Acquisitions, Divestitures, and Selling Days Note: “VPY” denotes Versus Prior Year May ’15 Selling Days 25 19 20 4.7% 5.8% 5.7% 20 7.0% 10.4% 6.1% Feb. Mar. Apr. Prior Year 7.9% 7.2% ’14 Selling Days 25 19 20 20 Q1 Jun. 20 5.1% $715M $580M $529M HD Supply Net Sales $478M $638M 20 10.7% ’13 Selling Days 25 19 20 20 20 4.7% 7.1% 7.7% Facilities Maintenance 2.9% 7.0% 8.6% 7.6% 4.5% 3.6% 2.4% Waterworks 3.3% 1.0% 12.3% 13.2% 12.9% 10.0% 10.5% Construction & Industrial 14.8% 11.4% 13.7% 15.1% Current Year ’15 ’14 ’15 ’14 Q2 8.1% 5.7% 7.0% 6.2% 9.8% 12.8% ’14 ’14 ’15 ’15 9.8% 2.2% 9.4% ’14 ’15 |
|
|
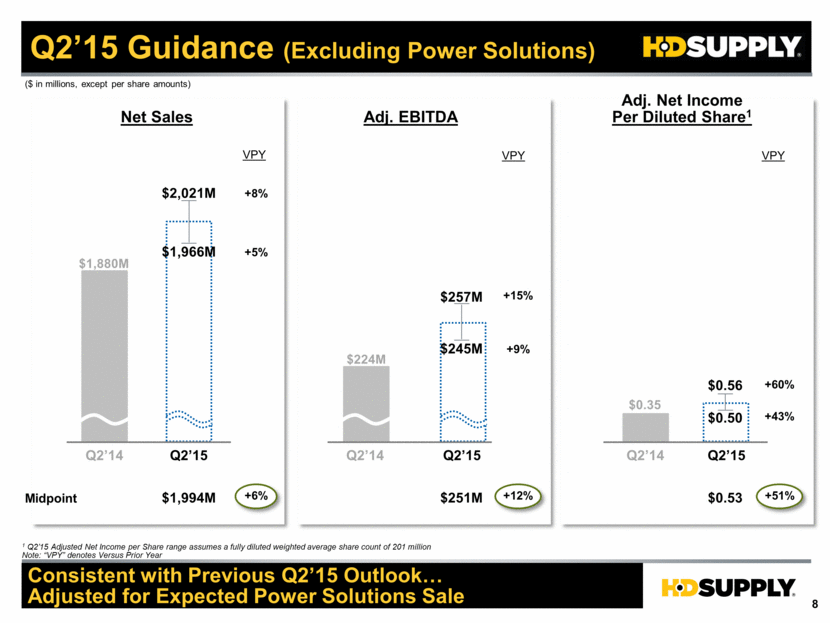
+15% +9% +8% +5% Q2’15 Guidance (Excluding Power Solutions) Consistent with Previous Q2’15 Outlook Adjusted for Expected Power Solutions Sale $2,021M $1,966M $224M $1,880M $257M $245M VPY Q2’14 Q2’15 Q2’14 Q2’15 Q2’15 Net Sales Adj. EBITDA Adj. Net Income Per Diluted Share1 VPY 1 Q2’15 Adjusted Net Income per Share range assumes a fully diluted weighted average share count of 201 million Note: “VPY” denotes Versus Prior Year $0.56 $0.50 VPY ($ in millions, except per share amounts) $0.35 . . . . Q2’14 +60% +43% Midpoint $1,994M +6% $251M +12% $0.53 +51% |
|
|
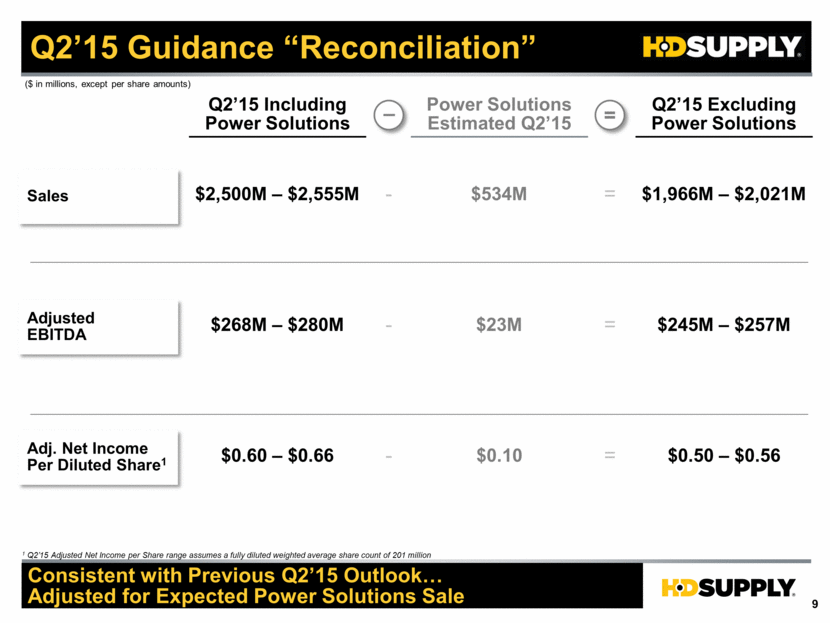
Q2’15 Guidance “Reconciliation” Consistent with Previous Q2’15 Outlook Adjusted for Expected Power Solutions Sale Sales Adjusted EBITDA 1 Q2’15 Adjusted Net Income per Share range assumes a fully diluted weighted average share count of 201 million Adj. Net Income Per Diluted Share1 Q2’15 Including Power Solutions Q2’15 Excluding Power Solutions $2,500M – $2,555M $268M – $280M $1,966M – $2,021M $245M – $257M $0.60 – $0.66 $0.50 – $0.56 Power Solutions Estimated Q2’15 $534M $23M $0.10 - = - = - = ($ in millions, except per share amounts) = – |
|
|
Q&A We Supply the Products and Services to Build Your City and Keep it Running |
|
|
Appendix |
|
|
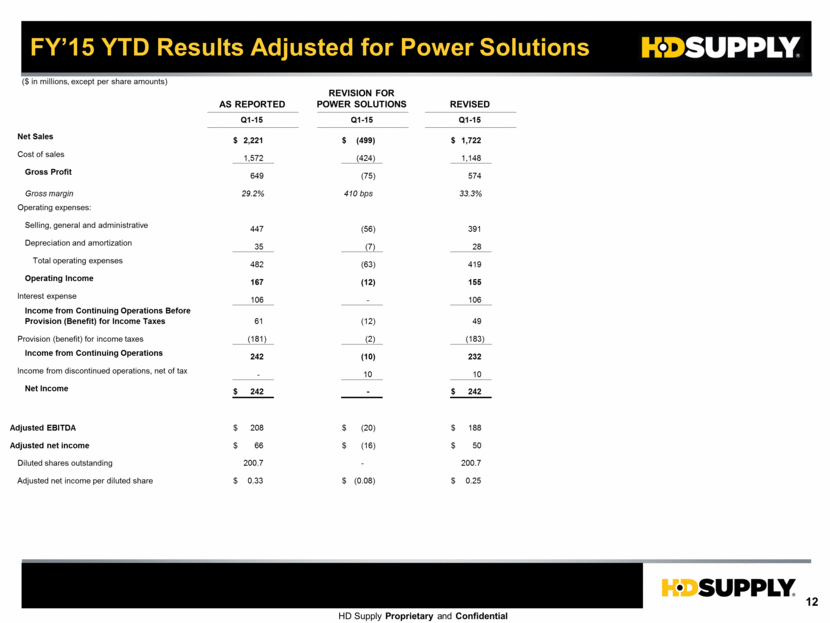
FY’15 YTD Results Adjusted for Power Solutions ($ in millions, except per share amounts) Net Sales Cost of sales Gross Profit Gross margin Operating expenses: Selling, general and administrative Depreciation and amortization Total operating expenses Operating Income Interest expense Income from Continuing Operations Before Provision (Benefit) for Income Taxes Provision (benefit) for income taxes Income from Continuing Operations Income from discontinued operations, net of tax Net Income Adjusted EBITDA Adjusted net income Diluted shares outstanding Adjusted net income per diluted share 2,221 1,572 649 29.2% 447 35 482 167 106 61 (181) 242 - 242 208 66 200.7 0.33 $ $ $ $ $ AS REPORTED Q1-15 REVISION FOR POWER SOLUTIONS (499) (424) (75) 410 bps (56) (7) (63) (12) - (12) (2) (10) 10 - (20) (16) - (0.08) $ $ $ $ Q1-15 1,722 1,148 574 33.3% 391 28 419 155 106 49 (183) 232 10 242 188 50 200.7 0.25 $ $ $ $ $ REVISED Q1-15 |
|
|
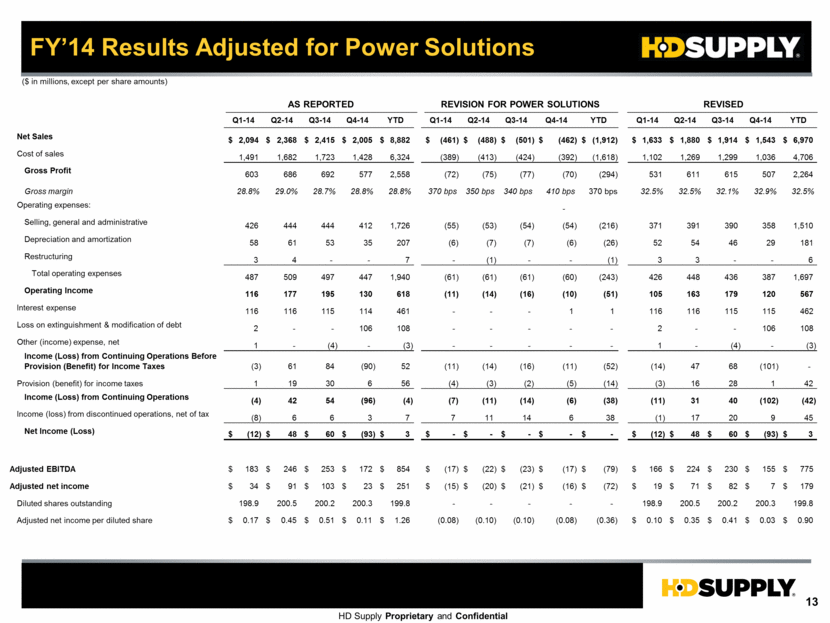
FY’14 Results Adjusted for Power Solutions ($ in millions, except per share amounts) AS REPORTED REVISION FOR POWER SOLUTIONS REVISED Q1-14 Q2-14 Q3-14 Q4-14 YTD Q1-14 Q2-14 Q3-14 Q4-14 YTD Q1-14 Q2-14 Q3-14 Q4-14 YTD Net Sales 2,094 $ 2,368 $ 2,415 $ 2,005 $ 8,882 $ (461) $ (488) $ (501) $ (462) $ (1,912) $ 1,633 $ 1,880 $ 1,914 $ 1,543 $ 6,970 $ Cost of sales 1,491 1,682 1,723 1,428 6,324 (389) (413) (424) (392) (1,618) 1,102 1,269 1,299 1,036 4,706 Gross Profit 603 686 692 577 2,558 (72) (75) (77) (70) (294) 531 611 615 507 2,264 Gross margin 28.8% 29.0% 28.7% 28.8% 28.8% 370 bps 350 bps 340 bps 410 bps 370 bps 32.5% 32.5% 32.1% 32.9% 32.5% Operating expenses: - Selling, general and administrative 426 444 444 412 1,726 (55) (53) (54) (54) (216) 371 391 390 358 1,510 Depreciation and amortization 58 61 53 35 207 (6) (7) (7) (6) (26) 52 54 46 29 181 Restructuring 3 4 - - 7 - (1) - - (1) 3 3 - - 6 Total operating expenses 487 509 497 447 1,940 (61) (61) (61) (60) (243) 426 448 436 387 1,697 Operating Income 116 177 195 130 618 (11) (14) (16) (10) (51) 105 163 179 120 567 Interest expense 116 116 115 114 461 - - - 1 1 116 116 115 115 462 Loss on extinguishment & modification of debt 2 - - 106 108 - - - - - 2 - - 106 108 Other (income) expense, net 1 - (4) - (3) - - - - - 1 - (4) - (3) Income (Loss) from Continuing Operations Before Provision (Benefit) for Income Taxes (3) 61 84 (90) 52 (11) (14) (16) (11) (52) (14) 47 68 (101) - Provision (benefit) for income taxes 1 19 30 6 56 (4) (3) (2) (5) (14) (3) 16 28 1 42 Income (Loss) from Continuing Operations (4) 42 54 (96) (4) (7) (11) (14) (6) (38) (11) 31 40 (102) (42) Income (loss) from discontinued operations, net of tax (8) 6 6 3 7 7 11 14 6 38 (1) 17 20 9 45 Net Income (Loss) (12) $ 48 $ 60 $ (93) $ 3 $ - $ - $ - $ - $ - $ (12) $ 48 $ 60 $ (93) $ 3 $ Adjusted EBITDA 183 $ 246 $ 253 $ 172 $ 854 $ (17) $ (22) $ (23) $ (17) $ (79) $ 166 $ 224 $ 230 $ 155 $ 775 $ Adjusted net income 34 $ 91 $ 103 $ 23 $ 251 $ (15) $ (20) $ (21) $ (16) $ (72) $ 19 $ 71 $ 82 $ 7 $ 179 $ Diluted shares outstanding 198.9 200.5 200.2 200.3 199.8 - - - - - 198.9 200.5 200.2 200.3 199.8 Adjusted net income per diluted share 0.17 $ 0.45 $ 0.51 $ 0.11 $ 1.26 $ (0.08) (0.10) (0.10) (0.08) (0.36) 0.10 $ 0.35 $ 0.41 $ 0.03 $ 0.90 $ |
|
|
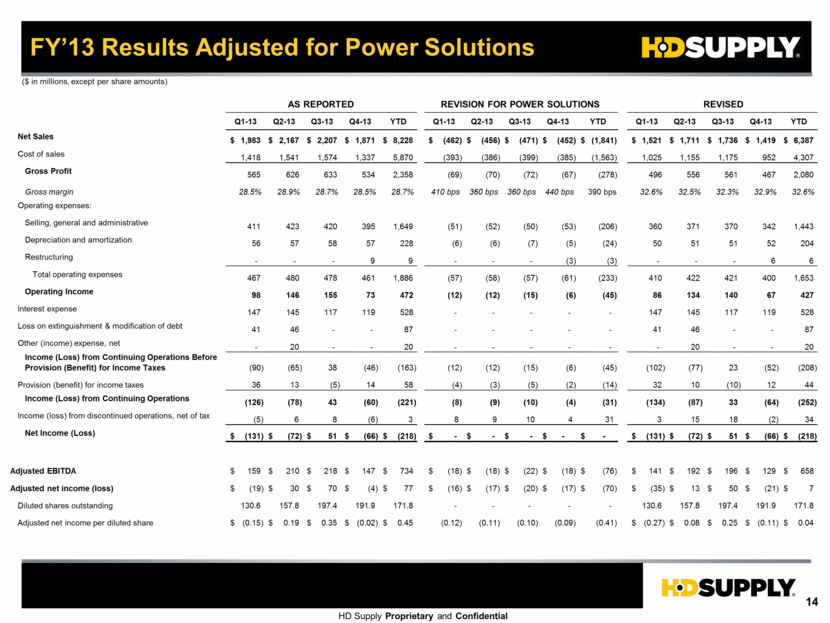
FY’13 Results Adjusted for Power Solutions ($ in millions, except per share amounts) Q1-13 Q2-13 Q3-13 Q4-13 YTD Q1-13 Q2-13 Q3-13 Q4-13 YTD Q1-13 Q2-13 Q3-13 Q4-13 YTD AS REPORTED REVISION FOR POWER SOLUTIONS REVISED Net Sales 1,983 $ 2,167 $ 2,207 $ 1,871 $ 8,228 $ (462) $ (456) $ (471) $ (452) $ (1,841) $ 1,521 $ 1,711 $ 1,736 $ 1,419 $ 6,387 $ Cost of sales 1,418 1,541 1,574 1,337 5,870 (393) (386) (399) (385) (1,563) 1,025 1,155 1,175 952 4,307 Gross Profit 565 626 633 534 2,358 (69) (70) (72) (67) (278) 496 556 561 467 2,080 Gross margin 28.5% 28.9% 28.7% 28.5% 28.7% 410 bps 360 bps 360 bps 440 bps 390 bps 32.6% 32.5% 32.3% 32.9% 32.6% Operating expenses: Selling, general and administrative 411 423 420 395 1,649 (51) (52) (50) (53) (206) 360 371 370 342 1,443 Depreciation and amortization 56 57 58 57 228 (6) (6) (7) (5) (24) 50 51 51 52 204 Restructuring - - - 9 9 - - - (3) (3) - - - 6 6 Total operating expenses 467 480 478 461 1,886 (57) (58) (57) (61) (233) 410 422 421 400 1,653 Operating Income 98 146 155 73 472 (12) (12) (15) (6) (45) 86 134 140 67 427 Interest expense 147 145 117 119 528 - - - - - 147 145 117 119 528 Loss on extinguishment & modification of debt 41 46 - - 87 - - - - - 41 46 - - 87 Other (income) expense, net - 20 - - 20 - - - - - - 20 - - 20 Income (Loss) from Continuing Operations Before Provision (Benefit) for Income Taxes (90) (65) 38 (46) (163) (12) (12) (15) (6) (45) (102) (77) 23 (52) (208) Provision (benefit) for income taxes 36 13 (5) 14 58 (4) (3) (5) (2) (14) 32 10 (10) 12 44 Income (Loss) from Continuing Operations (126) (78) 43 (60) (221) (8) (9) (10) (4) (31) (134) (87) 33 (64) (252) Income (loss) from discontinued operations, net of tax (5) 6 8 (6) 3 8 9 10 4 31 3 15 18 (2) 34 Net Income (Loss) (131) $ (72) $ 51 $ (66) $ (218) $ - $ - $ - $ - $ - $ (131) $ (72) $ 51 $ (66) $ (218) $ Adjusted EBITDA 159 $ 210 $ 218 $ 147 $ 734 $ (18) $ (18) $ (22) $ (18) $ (76) $ 141 $ 192 $ 196 $ 129 $ 658 $ Adjusted net income (loss) (19) $ 30 $ 70 $ (4) $ 77 $ (16) $ (17) $ (20) $ (17) $ (70) $ (35) $ 13 $ 50 $ (21) $ 7 $ Diluted shares outstanding 130.6 157.8 197.4 191.9 171.8 - - - - - 130.6 157.8 197.4 191.9 171.8 Adjusted net income per diluted share (0.15) $ 0.19 $ 0.35 $ (0.02) $ 0.45 $ (0.12) (0.11) (0.10) (0.09) (0.41) (0.27) $ 0.08 $ 0.25 $ (0.11) $ 0.04 $ |
|
|
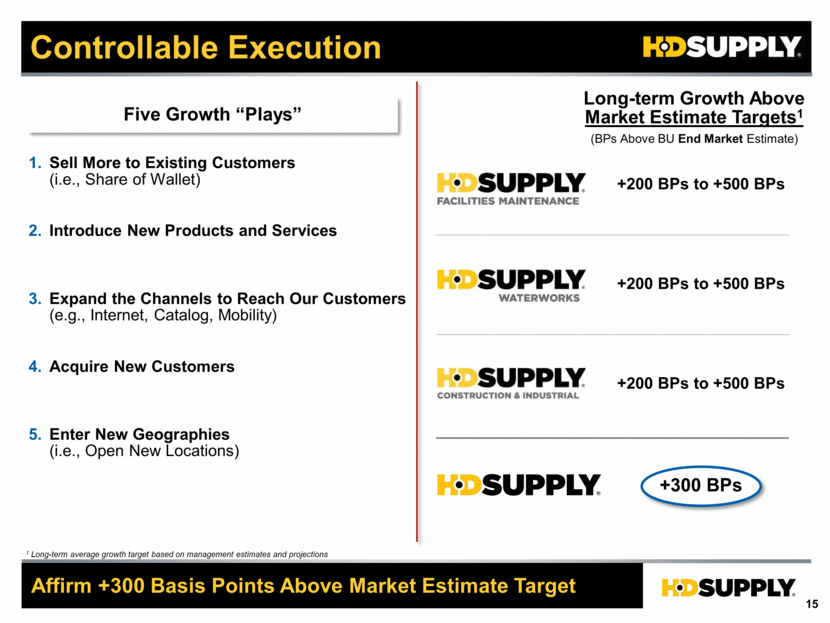
Controllable Execution Affirm +300 Basis Points Above Market Estimate Target 1 Long-term average growth target based on management estimates and projections +200 BPs to +500 BPs +300 BPs Long-term Growth Above Market Estimate Targets1 +200 BPs to +500 BPs +200 BPs to +500 BPs (BPs Above BU End Market Estimate) Sell More to Existing Customers (i.e., Share of Wallet) Introduce New Products and Services Expand the Channels to Reach Our Customers (e.g., Internet, Catalog, Mobility) Acquire New Customers Enter New Geographies (i.e., Open New Locations) Five Growth “Plays” |
|
|
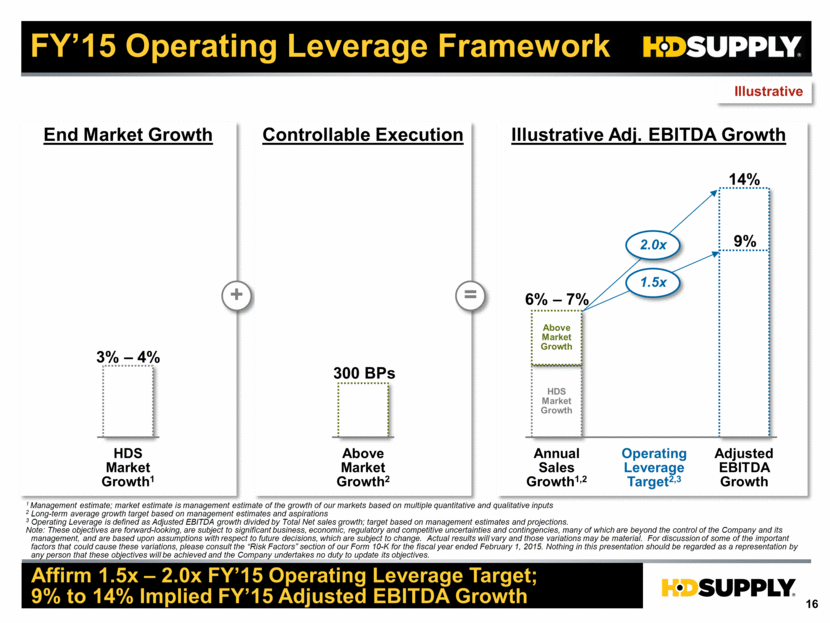
FY’15 Operating Leverage Framework Affirm 1.5x – 2.0x FY’15 Operating Leverage Target; 9% to 14% Implied FY’15 Adjusted EBITDA Growth HDS Market Growth1 Illustrative 3% – 4% + Above Market Growth2 300 BPs = End Market Growth Controllable Execution Annual Sales Growth1,2 Illustrative Adj. EBITDA Growth Adjusted EBITDA Growth 14% HDS Market Growth 9% 6% – 7% 2.0x 1.5x Operating Leverage Target2,3 1 Management estimate; market estimate is management estimate of the growth of our markets based on multiple quantitative and qualitative inputs 2 Long-term average growth target based on management estimates and aspirations 3 Operating Leverage is defined as Adjusted EBITDA growth divided by Total Net sales growth; target based on management estimates and projections. Note: These objectives are forward-looking, are subject to significant business, economic, regulatory and competitive uncertainties and contingencies, many of which are beyond the control of the Company and its management, and are based upon assumptions with respect to future decisions, which are subject to change. Actual results will vary and those variations may be material. For discussion of some of the important factors that could cause these variations, please consult the “Risk Factors” section of our Form 10-K for the fiscal year ended February 1, 2015. Nothing in this presentation should be regarded as a representation by any person that these objectives will be achieved and the Company undertakes no duty to update its objectives. Above Market Growth |
|
|
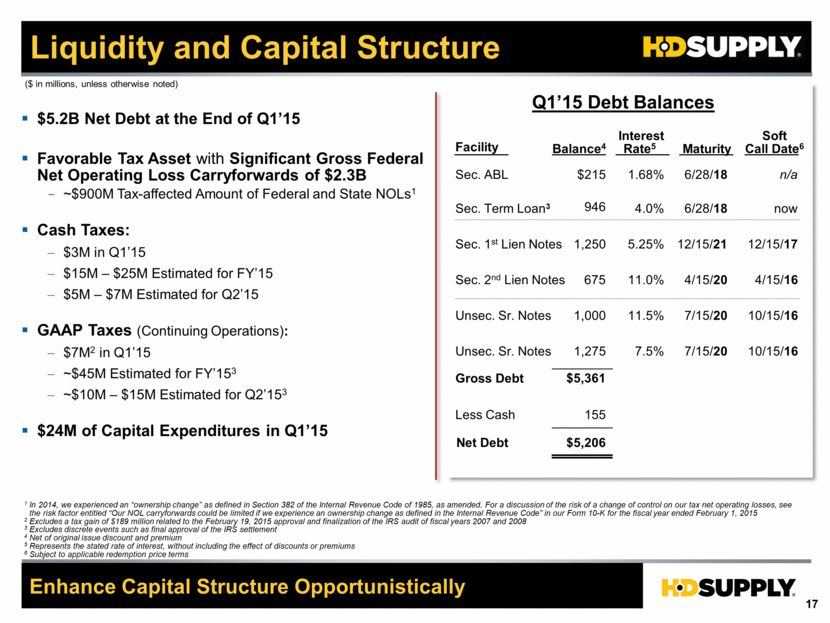
Liquidity and Capital Structure Q1’15 Debt Balances Sec. ABL Sec. Term Loan3 Sec. 1st Lien Notes Sec. 2nd Lien Notes Unsec. Sr. Notes Unsec. Sr. Notes $215 1,250 675 1,000 1,275 6/28/18 6/28/18 12/15/21 4/15/20 7/15/20 7/15/20 Gross Debt Less Cash Net Debt $5,206 155 $5,361 Facility Balance4 Maturity 1 In 2014, we experienced an “ownership change” as defined in Section 382 of the Internal Revenue Code of 1985, as amended. For a discussion of the risk of a change of control on our tax net operating losses, see the risk factor entitled “Our NOL carryforwards could be limited if we experience an ownership change as defined in the Internal Revenue Code” in our Form 10-K for the fiscal year ended February 1, 2015 2 Excludes a tax gain of $189 million related to the February 19, 2015 approval and finalization of the IRS audit of fiscal years 2007 and 2008 3 Excludes discrete events such as final approval of the IRS settlement 4 Net of original issue discount and premium 5 Represents the stated rate of interest, without including the effect of discounts or premiums 6 Subject to applicable redemption price terms Enhance Capital Structure Opportunistically ($ in millions, unless otherwise noted) 1.68% 4.0% 5.25% 11.0% 11.5% 7.5% Interest Rate5 946 n/a now 12/15/17 4/15/16 10/15/16 10/15/16 Soft Call Date6 $5.2B Net Debt at the End of Q1’15 Favorable Tax Asset with Significant Gross Federal Net Operating Loss Carryforwards of $2.3B ~$900M Tax-affected Amount of Federal and State NOLs1 Cash Taxes: $3M in Q1’15 $15M – $25M Estimated for FY’15 $5M – $7M Estimated for Q2’15 GAAP Taxes (Continuing Operations): $7M2 in Q1’15 ~$45M Estimated for FY’153 ~$10M – $15M Estimated for Q2’153 $24M of Capital Expenditures in Q1’15 |
|
|
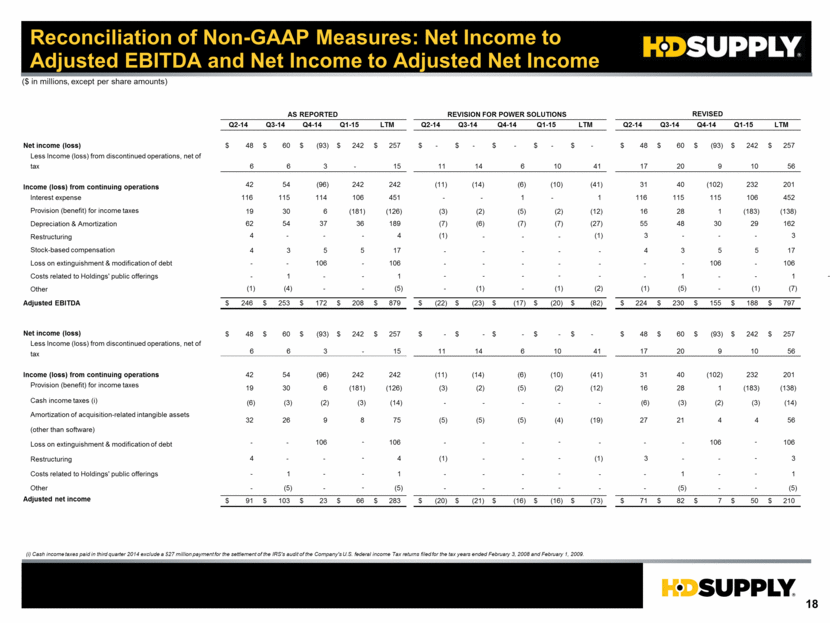
Reconciliation of Non-GAAP Measures: Net Income to Adjusted EBITDA and Net Income to Adjusted Net Income ($ in millions, except per share amounts) (i) Cash income taxes paid in third quarter 2014 exclude a $27 million payment for the settlement of the IRS's audit of the Company's U.S. federal income Tax returns filed for the tax years ended February 3, 2008 and February 1, 2009. Q2-14 Q3-14 Q4-14 Q1-15 LTM Q2-14 Q3-14 Q4-14 Q1-15 LTM Q2-14 Q3-14 Q4-14 Q1-15 LTM Net income (loss) 48 $ 60 $ (93) $ 242 $ 257 $ - $ - $ - $ - $ - $ 48 $ 60 $ (93) $ 242 $ 257 $ Less Income (loss) from discontinued operations, net of tax 6 6 3 - 15 11 14 6 10 41 17 20 9 10 56 Income (loss) from continuing operations 42 54 (96) 242 242 (11) (14) (6) (10) (41) 31 40 (102) 232 201 Interest expense 116 115 114 106 451 - - 1 - 1 116 115 115 106 452 Provision (benefit) for income taxes 19 30 6 (181) (126) (3) (2) (5) (2) (12) 16 28 1 (183) (138) Depreciation & Amortization 62 54 37 36 189 (7) (6) (7) (7) (27) 55 48 30 29 162 Restructuring 4 - - - 4 (1) - - - (1) 3 - - - 3 Stock-based compensation 4 3 5 5 17 - - - - - 4 3 5 5 17 Loss on extinguishment & modification of debt - - 106 106 - - - - - - 106 106 Costs related to Holdings' public offerings - 1 - 1 - - - - - 1 - 1 Other (1) (4) - - (5) - (1) - (1) (2) (1) (5) - (1) (7) Adjusted EBITDA 246 $ 253 $ 172 $ 208 $ 879 $ (22) $ (23) $ (17) $ (20) $ (82) $ 224 $ 230 $ 155 $ 188 $ 797 $ Net income (loss) 48 $ 60 $ (93) $ 242 $ 257 $ - $ - $ - $ - $ - $ 48 $ 60 $ (93) $ 242 $ 257 $ Less Income (loss) from discontinued operations, net of tax 6 6 3 - 15 11 14 6 10 41 17 20 9 10 56 Income (loss) from continuing operations 42 54 (96) 242 242 (11) (14) (6) (10) (41) 31 40 (102) 232 201 Provision (benefit) for income taxes 19 30 6 (181) (126) (3) (2) (5) (2) (12) 16 28 1 (183) (138) Cash income taxes (i) (6) (3) (2) (3) (14) - - - - - (6) (3) (2) (3) (14) Amortization of acquisition-related intangible assets (other than software) 32 26 9 8 75 (5) (5) (5) (4) (19) 27 21 4 4 56 Loss on extinguishment & modification of debt - - 106 106 - - - - - - 106 106 Restructuring 4 - - 4 (1) - - (1) 3 - - 3 Costs related to Holdings' public offerings - 1 - 1 - - - - - 1 - 1 Other - (5) - (5) - - - - - (5) - (5) Adjusted net income 91 $ 103 $ 23 $ 66 $ 283 $ (20) $ (21) $ (16) $ (16) $ (73) $ 71 $ 82 $ 7 $ 50 $ 210 $ REVISION FOR POWER SOLUTIONS AS REPORTED REVISED - - - - - - - - - - - - - - - - - - - |
|
|
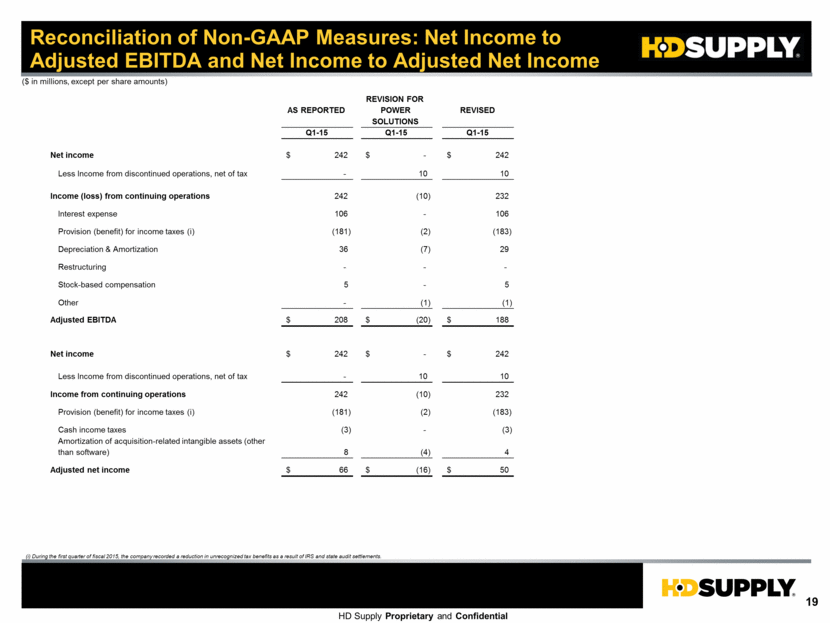
Reconciliation of Non-GAAP Measures: Net Income to Adjusted EBITDA and Net Income to Adjusted Net Income ($ in millions, except per share amounts) (i) During the first quarter of fiscal 2015, the company recorded a reduction in unrecognized tax benefits as a result of IRS and state audit settlements. AS REPORTED REVISION FOR POWER SOLUTIONS REVISED Q1-15 Q1-15 Q1-15 Net income 242 $ - $ 242 $ Less Income from discontinued operations, net of tax - 10 10 Income (loss) from continuing operations 242 (10) 232 Interest expense 106 - 106 Provision (benefit) for income taxes (i) (181) (2) (183) Depreciation & Amortization 36 (7) 29 Restructuring - - - Stock-based compensation 5 - 5 Other - (1) (1) Adjusted EBITDA 208 $ (20) $ 188 $ Net income 242 $ - $ 242 $ Less Income from discontinued operations, net of tax - 10 10 Income from continuing operations 242 (10) 232 Provision (benefit) for income taxes (i) (181) (2) (183) Cash income taxes (3) - (3) Amortization of acquisition-related intangible assets (other than software) 8 (4) 4 Adjusted net income 66 $ (16) $ 50 $ |
|
|
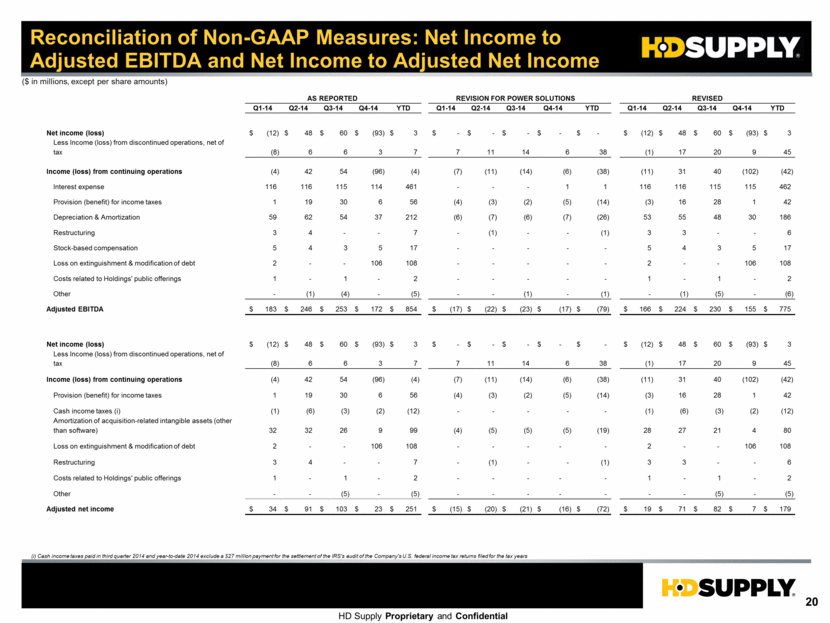
Reconciliation of Non-GAAP Measures: Net Income to Adjusted EBITDA and Net Income to Adjusted Net Income ($ in millions, except per share amounts) (i) Cash income taxes paid in third quarter 2014 and year-to-date 2014 exclude a $27 million payment for the settlement of the IRS's audit of the Company's U.S. federal income tax returns filed for the tax years AS REPORTED REVISED Q1-14 Q2-14 Q3-14 Q4-14 YTD Q1-14 Q2-14 Q3-14 Q4-14 YTD Q1-14 Q2-14 Q3-14 Q4-14 YTD Net income (loss) (12) $ 48 $ 60 $ (93) $ 3 $ - $ - $ - $ - $ - $ (12) $ 48 $ 60 $ (93) $ 3 $ Less Income (loss) from discontinued operations, net of tax (8) 6 6 3 7 7 11 14 6 38 (1) 17 20 9 45 Income (loss) from continuing operations (4) 42 54 (96) (4) (7) (11) (14) (6) (38) (11) 31 40 (102) (42) Interest expense 116 116 115 114 461 - - - 1 1 116 116 115 115 462 Provision (benefit) for income taxes 1 19 30 6 56 (4) (3) (2) (5) (14) (3) 16 28 1 42 Depreciation & Amortization 59 62 54 37 212 (6) (7) (6) (7) (26) 53 55 48 30 186 Restructuring 3 4 - - 7 - (1) - - (1) 3 3 - - 6 Stock-based compensation 5 4 3 5 17 - - - - - 5 4 3 5 17 Loss on extinguishment & modification of debt 2 - - 106 108 - - - - - 2 - - 106 108 Costs related to Holdings' public offerings 1 - 1 - 2 - - - - - 1 - 1 - 2 Other - (1) (4) - (5) - - (1) - (1) - (1) (5) - (6) Adjusted EBITDA 183 $ 246 $ 253 $ 172 $ 854 $ (17) $ (22) $ (23) $ (17) $ (79) $ 166 $ 224 $ 230 $ 155 $ 775 $ Net income (loss) (12) $ 48 $ 60 $ (93) $ 3 $ - $ - $ - $ - $ - $ (12) $ 48 $ 60 $ (93) $ 3 $ Less Income (loss) from discontinued operations, net of tax (8) 6 6 3 7 7 11 14 6 38 (1) 17 20 9 45 Income (loss) from continuing operations (4) 42 54 (96) (4) (7) (11) (14) (6) (38) (11) 31 40 (102) (42) Provision (benefit) for income taxes 1 19 30 6 56 (4) (3) (2) (5) (14) (3) 16 28 1 42 Cash income taxes (i) (1) (6) (3) (2) (12) - - - - - (1) (6) (3) (2) (12) Amortization of acquisition-related intangible assets (other than software) 32 32 26 9 99 (4) (5) (5) (5) (19) 28 27 21 4 80 Loss on extinguishment & modification of debt 2 - - 106 108 - - - - - 2 - - 106 108 Restructuring 3 4 - - 7 - (1) - - (1) 3 3 - - 6 Costs related to Holdings' public offerings 1 - 1 - 2 - - - - - 1 - 1 - 2 Other - - (5) - (5) - - - - - - - (5) - (5) Adjusted net income 34 $ 91 $ 103 $ 23 $ 251 $ (15) $ (20) $ (21) $ (16) $ (72) $ 19 $ 71 $ 82 $ 7 $ 179 $ REVISION FOR POWER SOLUTIONS |
|
|
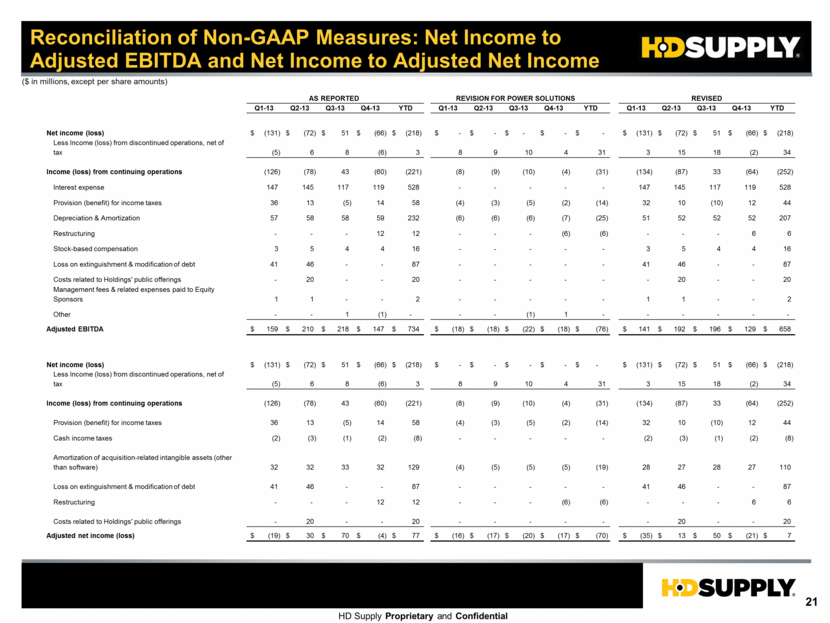
Reconciliation of Non-GAAP Measures: Net Income to Adjusted EBITDA and Net Income to Adjusted Net Income ($ in millions, except per share amounts) AS REPORTED REVISED Q1-13 Q2-13 Q3-13 Q4-13 YTD Q1-13 Q2-13 Q3-13 Q4-13 YTD Q1-13 Q2-13 Q3-13 Q4-13 YTD Net income (loss) (131) $ (72) $ 51 $ (66) $ (218) $ - $ - $ - $ - $ - $ (131) $ (72) $ 51 $ (66) $ (218) $ Less Income (loss) from discontinued operations, net of tax (5) 6 8 (6) 3 8 9 10 4 31 3 15 18 (2) 34 Income (loss) from continuing operations (126) (78) 43 (60) (221) (8) (9) (10) (4) (31) (134) (87) 33 (64) (252) Interest expense 147 145 117 119 528 - - - - - 147 145 117 119 528 Provision (benefit) for income taxes 36 13 (5) 14 58 (4) (3) (5) (2) (14) 32 10 (10) 12 44 Depreciation & Amortization 57 58 58 59 232 (6) (6) (6) (7) (25) 51 52 52 52 207 Restructuring - - - 12 12 - - - (6) (6) - - - 6 6 Stock-based compensation 3 5 4 4 16 - - - - - 3 5 4 4 16 Loss on extinguishment & modification of debt 41 46 - - 87 - - - - - 41 46 - - 87 Costs related to Holdings' public offerings - 20 - - 20 - - - - - - 20 - - 20 Management fees & related expenses paid to Equity Sponsors 1 1 - - 2 - - - - - 1 1 - - 2 Other - - 1 (1) - - - (1) 1 - - - - - - Adjusted EBITDA 159 $ 210 $ 218 $ 147 $ 734 $ (18) $ (18) $ (22) $ (18) $ (76) $ 141 $ 192 $ 196 $ 129 $ 658 $ Net income (loss) (131) $ (72) $ 51 $ (66) $ (218) $ - $ - $ - $ - $ - $ (131) $ (72) $ 51 $ (66) $ (218) $ Less Income (loss) from discontinued operations, net of tax (5) 6 8 (6) 3 8 9 10 4 31 3 15 18 (2) 34 Income (loss) from continuing operations (126) (78) 43 (60) (221) (8) (9) (10) (4) (31) (134) (87) 33 (64) (252) Provision (benefit) for income taxes 36 13 (5) 14 58 (4) (3) (5) (2) (14) 32 10 (10) 12 44 Cash income taxes (2) (3) (1) (2) (8) - - - - - (2) (3) (1) (2) (8) Amortization of acquisition-related intangible assets (other than software) 32 32 33 32 129 (4) (5) (5) (5) (19) 28 27 28 27 110 Loss on extinguishment & modification of debt 41 46 - - 87 - - - - - 41 46 - - 87 Restructuring - - - 12 12 - - - (6) (6) - - - 6 6 Costs related to Holdings' public offerings - 20 - - 20 - - - - - - 20 - - 20 Adjusted net income (loss) (19) $ 30 $ 70 $ (4) $ 77 $ (16) $ (17) $ (20) $ (17) $ (70) $ (35) $ 13 $ 50 $ (21) $ 7 $ REVISION FOR POWER SOLUTIONS |


