Attached files
| file | filename |
|---|---|
| EX-10.1 - EX-10.1 - Walter Energy, Inc. | a15-15699_1ex10d1.htm |
| EX-99.1 - EX-99.1 - Walter Energy, Inc. | a15-15699_1ex99d1.htm |
| 8-K - 8-K - Walter Energy, Inc. | a15-15699_18k.htm |
Exhibit 99.2
|
|
Project Diamond July 2015 Lender Presentation Confidential Subject to Change |
|
|
Table of Contents I. Situation Overview 3 II. Strategic Overview 8 III. Restructuring Considerations 20 A. Capital / Legal Structure 21 B. Union Considerations 25 C. Tax Attributes 29 Appendix 31 |
|
|
Disclaimer The Presentation Materials are only being provided to holders of first lien debt claims who have become restricted (the “Steering Committee”) by executing an appropriate confidentiality agreement with Walter Energy, Inc. (the “Confidentiality Agreements”). The Presentation Materials are subject to the Confidentiality Agreements in all respects and may not be used or disseminated in any way contrary to such agreements. By furnishing these Presentation Materials, Blackstone does not undertake any obligation with respect to the recipients’ compliance with the Confidentiality Agreements. Blackstone makes no representation or warranty, express or implied, as to the accuracy or completeness of the information obtained from the Company, and nothing contained herein is, or shall be relied on as a promise or representation, whether as to the past or the future. Blackstone has not independently verified information obtained from the Sources. These Presentation Materials are solely for the information of the Steering Committee on the understanding that no dissemination of the contents hereof is permissible to anyone other than the recipient without the written permission of Blackstone. These Presentation Materials are confidential and may not be photocopied, reproduced or distributed to any other person at any time. If any person receives this document in breach of these restrictions then it should be immediately returned to Blackstone. Blackstone retains the right to request the return of this document at any time. |
|
|
I. Situation Overview |

|
|
Introduction Leading “pure-play” metallurgical coal producer In 2014, Walter produced 9.3 million metric tons of met coal, nearly 90% of which was hard coking coal with the remainder comprised of low-volatility PCI Core operations produce high quality metallurgical (“met”) coal Coal from Walter’s Alabama underground mining operations (mines No. 4 and No. 7) consistently realizes prices close to benchmark Stable and high quality customer base of major steel manufacturers Low-cost producer anchored by longwall mines 76% of 2014 metallurgical coal production from efficient underground longwall mines Operating margins of both No. 4 and No. 7 mines are well positioned on global cost curve Asset base positions the Company to capitalize on rebound in met coal pricing Blue Creek Energy mine development to add meaningful longwall capacity to core Alabama mining operations Brazion and Wolverine mining complexes can provide access to growing Asian markets through Ridley Terminals Value-added coke and gas businesses complement core mining operations Walter Coke, strategically located near Walter’s hard coking coal mines in Birmingham, AL, has the capacity to produce 400,000 metric tons of metallurgical coke for furnace and foundry applications Walter Gas provides degasification of the Blue Creek coal seam, enhancing safety and productivity of underground mining operations while monetizing gas reserves I. Situation Overview Walter Energy, Inc. (“Walter” or the “Company”) is a leading producer and exporter of metallurgical coal for the global steel industry with mineral reserves in the U.S., Canada and the United Kingdom. |
|
|
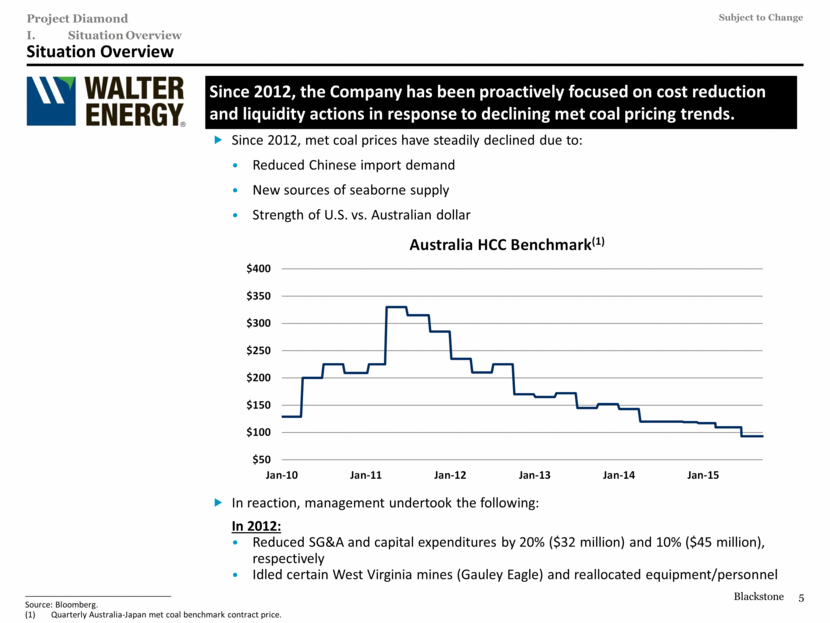
Since 2012, met coal prices have steadily declined due to: Reduced Chinese import demand New sources of seaborne supply Strength of U.S. vs. Australian dollar In reaction, management undertook the following: In 2012: Reduced SG&A and capital expenditures by 20% ($32 million) and 10% ($45 million), respectively Idled certain West Virginia mines (Gauley Eagle) and reallocated equipment/personnel Situation Overview Since 2012, the Company has been proactively focused on cost reduction and liquidity actions in response to declining met coal pricing trends. I. Situation Overview ________________________________________________ Source: Bloomberg. Quarterly Australia-Japan met coal benchmark contract price. $50 $100 $150 $200 $250 $300 $350 $400 Jan-10 Jan-11 Jan-12 Jan-13 Jan-14 Jan-15 Australia HCC Benchmark (1) |
|
|
In 2013: Reduced met cash cost of sales per MT by 14% Further reduced SG&A and capital expenditures by 25% ($33 million) and 61% ($238 million), respectively Idled/closed North River, Reid School and Swann’s Crossing mines in Alabama Reduced cash dividend by 92% In 2014: Further reduced met cash cost of sales per MT by 13% Further reduced SG&A and capital expenditures by 28% ($28 million) and ~40% ($61 million), respectively Idled Canadian operations Sold Blue Creek Coal Terminal for $25 million, Flat Top reserve for $6 million In 2015: Suspended cash dividend Renegotiated take-or-pay contract for Ridley Terminal Partially idling #7 West in 2015, saving ~$25 million per year Idling UK and Maple operations Other Liquidity Actions: Throughout the years, the Company has also sold excess assets to enhance liquidity Management undertook numerous financing transactions to further boost liquidity Raised in excess of $1.3 billion of 2nd lien and unsecured indebtedness Entered into numerous debt/equity exchanges Capital expenditures have been reduced to maintenance levels except as necessary to maintain productivity and access reserves (i.e., North Portal, longwall shields, and Cassidy expansion) Situation Overview (Cont’d) I. Situation Overview |
|
|
Objectives As part of the recapitalization, the Company must: Substantially delever to eliminate interest burden Renegotiate collective bargaining agreements and retiree health care obligations Evaluate mining plan and cost structure to maximize liquidity I. Situation Overview The Company is now focused on implementing a recapitalization of its balance sheet in light of what is likely a continued prolonged downturn in met coal pricing. |
|
|
II. Strategic Overview |

|
|
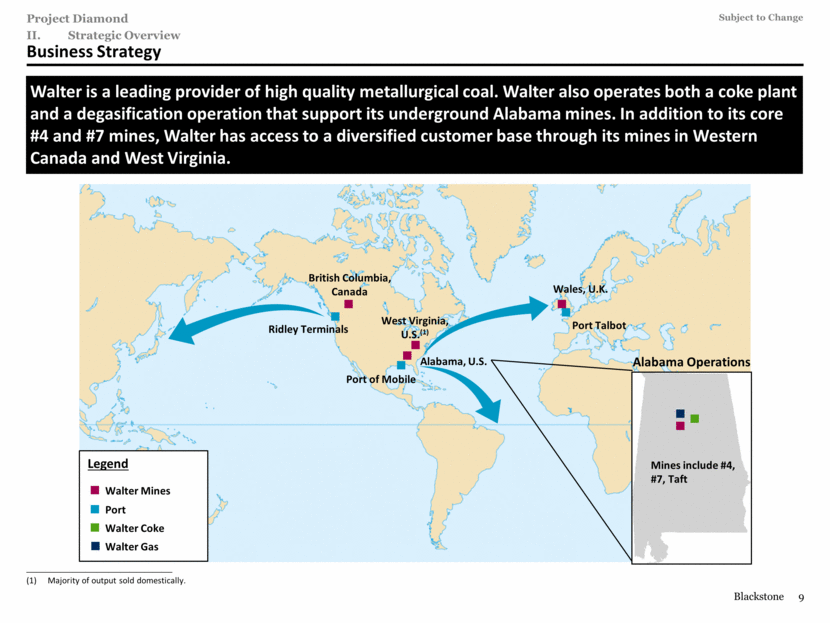
Legend Business Strategy Walter is a leading provider of high quality metallurgical coal. Walter also operates both a coke plant and a degasification operation that support its underground Alabama mines. In addition to its core #4 and #7 mines, Walter has access to a diversified customer base through its mines in Western Canada and West Virginia. British Columbia, Canada Ridley Terminals Port of Mobile West Virginia, U.S.(1) Alabama, U.S. Wales, U.K. Port Talbot Port Walter Mines Alabama Operations Walter Coke Walter Gas II. Strategic Overview ________________________________________________ Majority of output sold domestically. Mines include #4, #7, Taft |
|
|
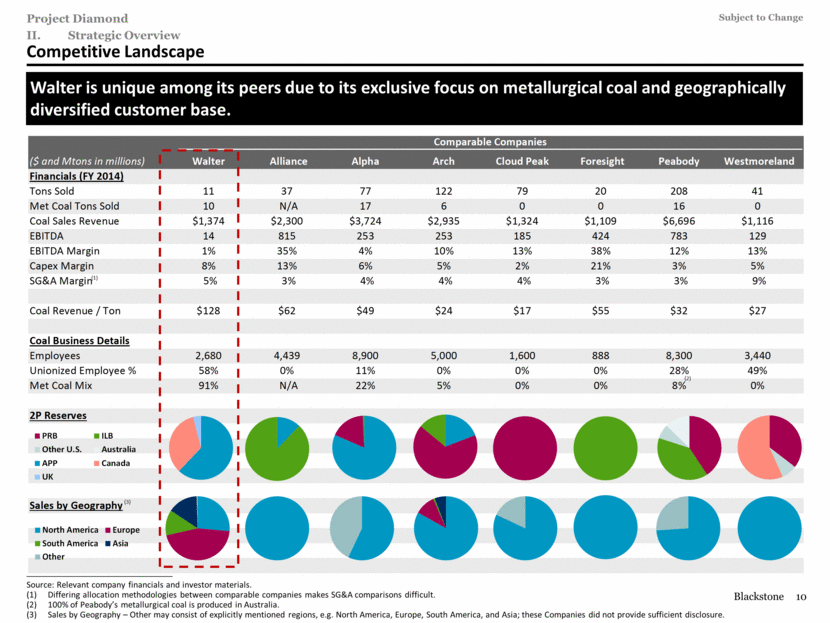
Walter is unique among its peers due to its exclusive focus on metallurgical coal and geographically diversified customer base. Competitive Landscape II. Strategic Overview (3) ________________________________________________ Source: Relevant company financials and investor materials. Differing allocation methodologies between comparable companies makes SG&A comparisons difficult. 100% of Peabody’s metallurgical coal is produced in Australia. Sales by Geography – Other may consist of explicitly mentioned regions, e.g. North America, Europe, South America, and Asia; these Companies did not provide sufficient disclosure. (2) (1) Comparable Companies ($ and Mtons in millions) Walter Alliance Alpha Arch Cloud Peak Foresight Peabody Westmoreland Financials (FY 2014) Tons Sold 11 37 77 122 79 20 208 41 Met Coal Tons Sold 10 N/A 17 6 0 0 16 0 Coal Sales Revenue $1,374 $2,300 $3,724 $2,935 $1,324 $1,109 $6,696 $1,116 EBITDA 14 815 253 253 185 424 783 129 EBITDA Margin 1% 35% 4% 10% 13% 38% 12% 13% Capex Margin 8% 13% 6% 5% 2% 21% 3% 5% SG&A Margin 5% 3% 4% 4% 4% 3% 3% 9% Coal Revenue / Ton $128 $62 $49 $24 $17 $55 $32 $27 Coal Business Details Employees 2,680 4,439 8,900 5,000 1,600 888 8,300 3,440 Unionized Employee % 58% 0% 11% 0% 0% 0% 28% 49% Met Coal Mix 91% N/A 22% 5% 0% 0% 8% 0% 2P Reserves Sales by Geography PRB 5.0% ILB 5.0% Other U.S. 5.0% Australia 5.0% APP 5.0% Canada 5.0% UK 5.0% PRB ILB Other U.S. Australia APP Canada UK North America Europe South America Asia Other |
|
|
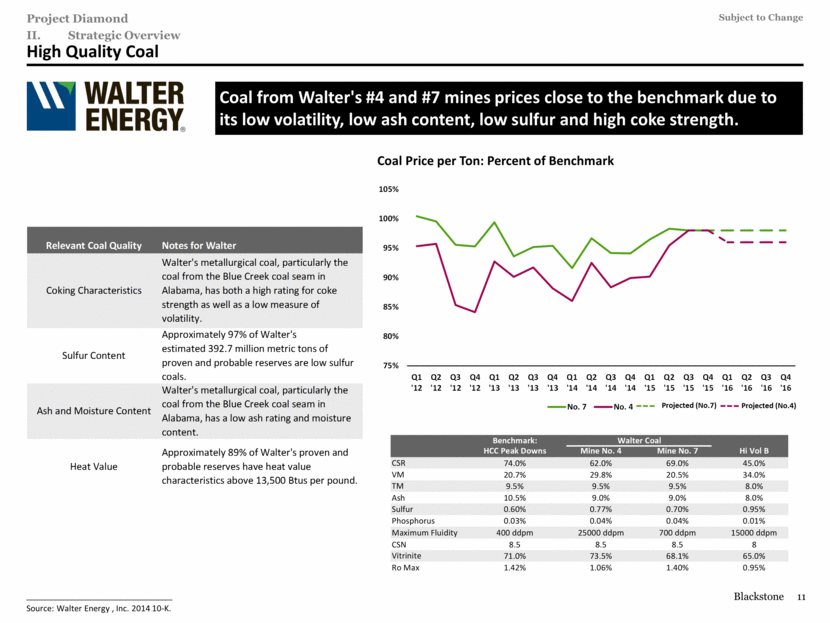
High Quality Coal Coal from Walter's #4 and #7 mines prices close to the benchmark due to its low volatility, low ash content, low sulfur and high coke strength. II. Strategic Overview Coal Price per Ton: Percent of Benchmark ________________________________________________ Source: Walter Energy , Inc. 2014 10-K. Projected (No.4) Projected (No.7) Benchmark: Walter Coal HCC Peak Downs Mine No. 4 Mine No. 7 Hi Vol B CSR 74.0% 62.0% 69.0% 45.0% VM 20.7% 29.8% 20.5% 34.0% TM 9.5% 9.5% 9.5% 8.0% Ash 10.5% 9.0% 9.0% 8.0% Sulfur 0.60% 0.77% 0.70% 0.95% Phosphorus 0.03% 0.04% 0.04% 0.01% Maximum Fluidity 400 ddpm 25000 ddpm 700 ddpm 15000 ddpm CSN 8.5 8.5 8.5 8 Vitrinite 71.0% 73.5% 68.1% 65.0% Ro Max 1.42% 1.06% 1.40% 0.95% Notes for Walter Coking Characteristics Walter's metallurgical coal, particularly the coal from the Blue Creek coal seam in Alabama, has both a high rating for coke strength as well as a low measure of volatility. Relevant Coal Quality Heat Value Approximately 89% of Walter's proven and probable reserves have heat value characteristics above 13,500 Btus per pound. Approximately 97 % of Walter ' s estimated 392 . 7 million metric tons of proven and probable reserves are low sulfur coals. Sulfur Content Ash and Moisture Content Walter's metallurgical coal, particularly the coal from the Blue Creek coal seam in Alabama, has a low ash rating and moisture content. 75% 80% 85% 90% 95% 100% 105% Q1 '12 Q2 '12 Q3 '12 Q4 '12 Q1 '13 Q2 '13 Q3 '13 Q4 '13 Q1 '14 Q2 '14 Q3 '14 Q4 '14 Q1 '15 Q2 '15 Q3 '15 Q4 '15 Q1 '16 Q2 '16 Q3 '16 Q4 '16 No. 7 No. 4 |
|
|
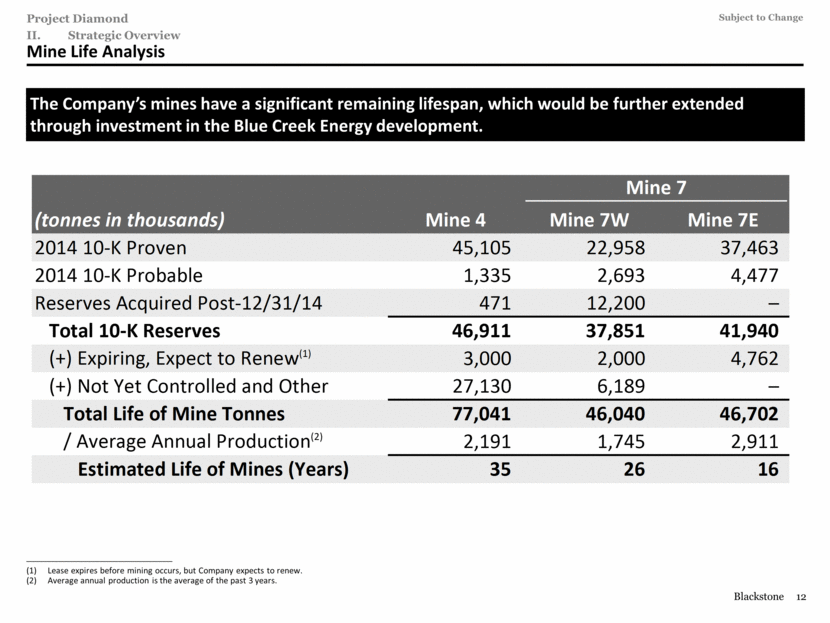
Mine Life Analysis II. Strategic Overview ________________________________________________ Lease expires before mining occurs, but Company expects to renew. Average annual production is the average of the past 3 years. The Company’s mines have a significant remaining lifespan, which would be further extended through investment in the Blue Creek Energy development. Mine 7 (tonnes in thousands) Mine 4 Mine 7W Mine 7E 2014 10-K Proven 45,105 22,958 37,463 2014 10-K Probable 1,335 2,693 4,477 Reserves Acquired Post-12/31/14 471 12,200 – Total 10-K Reserves 46,911 37,851 41,940 (+) Expiring, Expect to Renew (1) 3,000 2,000 4,762 (+) Not Yet Controlled and Other 27,130 6,189 – Total Life of Mine Tonnes 77,041 46,040 46,702 / Average Annual Production (2) 2,191 1,745 2,911 Estimated Life of Mines (Years) 35 26 16 |
|
|
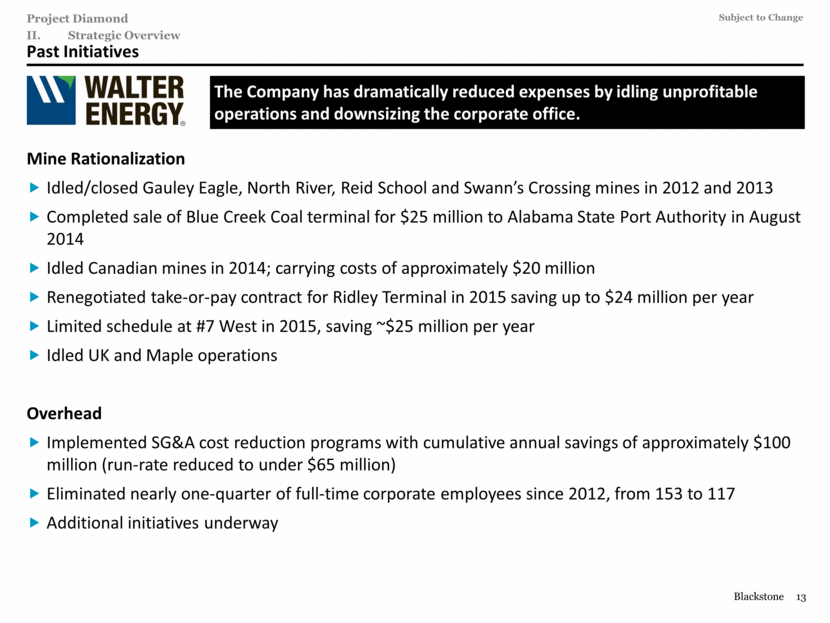
Past Initiatives II. Strategic Overview The Company has dramatically reduced expenses by idling unprofitable operations and downsizing the corporate office. Mine Rationalization Idled/closed Gauley Eagle, North River, Reid School and Swann’s Crossing mines in 2012 and 2013 Completed sale of Blue Creek Coal terminal for $25 million to Alabama State Port Authority in August 2014 Idled Canadian mines in 2014; carrying costs of approximately $20 million Renegotiated take-or-pay contract for Ridley Terminal in 2015 saving up to $24 million per year Limited schedule at #7 West in 2015, saving ~$25 million per year Idled UK and Maple operations Overhead Implemented SG&A cost reduction programs with cumulative annual savings of approximately $100 million (run-rate reduced to under $65 million) Eliminated nearly one-quarter of full-time corporate employees since 2012, from 153 to 117 Additional initiatives underway |
|
|
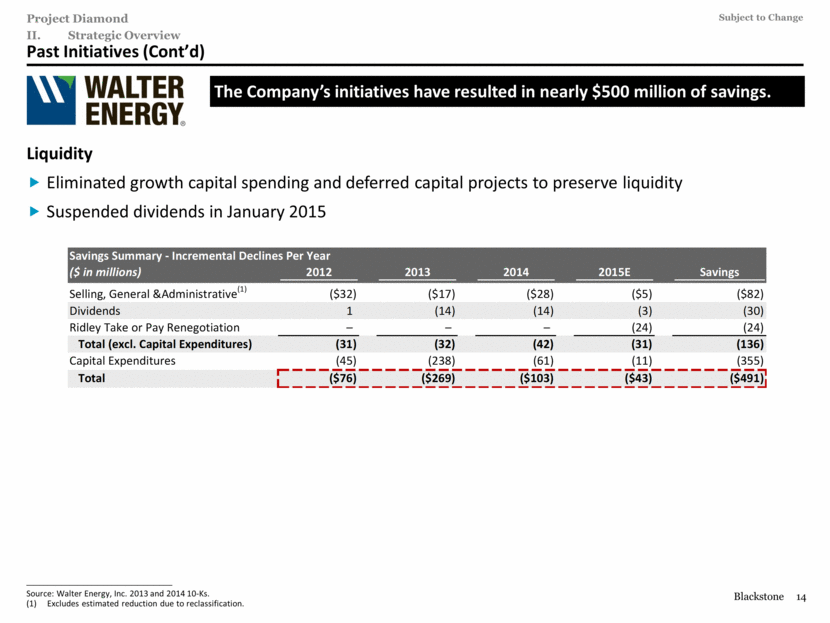
Past Initiatives (Cont’d) II. Strategic Overview The Company’s initiatives have resulted in nearly $500 million of savings. ________________________________________________ Source: Walter Energy, Inc. 2013 and 2014 10-Ks. Excludes estimated reduction due to reclassification. Liquidity Eliminated growth capital spending and deferred capital projects to preserve liquidity Suspended dividends in January 2015 Savings Summary - Incremental Declines Per Year ($ in millions) 2012 2013 2014 2015E Savings Selling, General &Administrative (1) ($32) ($17) ($28) ($5) ($82) Dividends 1 (14) (14) (3) (30) Ridley Take or Pay Renegotiation – – – (24) (24) Total (excl. Capital Expenditures) (31) (32) (42) (31) (136) Capital Expenditures (45) (238) (61) (11) (355) Total ($76) ($269) ($103) ($43) ($491) |
|
|
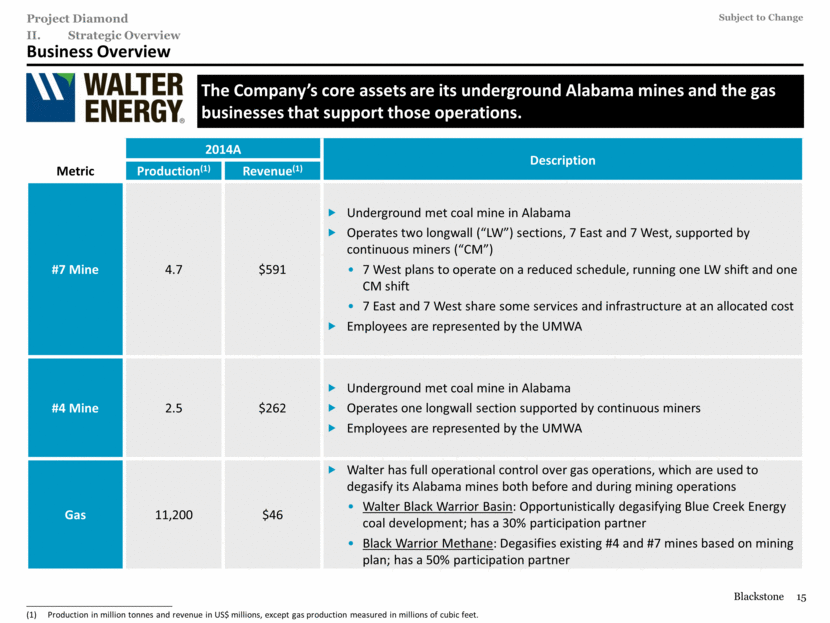
Business Overview II. Strategic Overview The Company’s core assets are its underground Alabama mines and the gas businesses that support those operations. 2014A Description Metric Production(1) Revenue(1) #7 Mine 4.7 $591 Underground met coal mine in Alabama Operates two longwall (“LW”) sections, 7 East and 7 West, supported by continuous miners (“CM”) 7 West plans to operate on a reduced schedule, running one LW shift and one CM shift 7 East and 7 West share some services and infrastructure at an allocated cost Employees are represented by the UMWA #4 Mine 2.5 $262 Underground met coal mine in Alabama Operates one longwall section supported by continuous miners Employees are represented by the UMWA Gas 11,200 $46 Walter has full operational control over gas operations, which are used to degasify its Alabama mines both before and during mining operations Walter Black Warrior Basin: Opportunistically degasifying Blue Creek Energy coal development; has a 30% participation partner Black Warrior Methane: Degasifies existing #4 and #7 mines based on mining plan; has a 50% participation partner ________________________________________________ Production in million tonnes and revenue in US$ millions, except gas production measured in millions of cubic feet. |
|
|
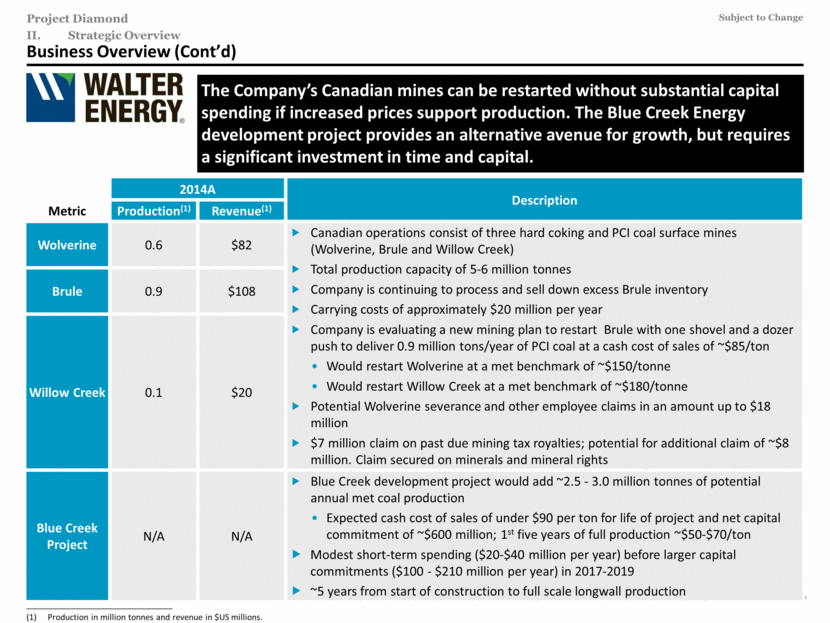
Business Overview (Cont’d) II. Strategic Overview The Company’s Canadian mines can be restarted without substantial capital spending if increased prices support production. The Blue Creek Energy development project provides an alternative avenue for growth, but requires a significant investment in time and capital. ________________________________________________ Production in million tonnes and revenue in $US millions. 2014A Description Metric Production(1) Revenue(1) Wolverine 0.6 $82 Canadian operations consist of three hard coking and PCI coal surface mines (Wolverine, Brule and Willow Creek) Total production capacity of 5-6 million tonnes Company is continuing to process and sell down excess Brule inventory Carrying costs of approximately $20 million per year Company is evaluating a new mining plan to restart Brule with one shovel and a dozer push to deliver 0.9 million tons/year of PCI coal at a cash cost of sales of ~$85/ton Would restart Wolverine at a met benchmark of ~$150/tonne Would restart Willow Creek at a met benchmark of ~$180/tonne Potential Wolverine severance and other employee claims in an amount up to $18 million $7 million claim on past due mining tax royalties; potential for additional claim of ~$8 million. Claim secured on minerals and mineral rights Brule 0.9 $108 Willow Creek 0.1 $20 Blue Creek Project N/A N/A Blue Creek development project would add ~2.5 - 3.0 million tonnes of potential annual met coal production Expected cash cost of sales of under $90 per ton for life of project and net capital commitment of ~$600 million; 1st five years of full production ~$50-$70/ton Modest short-term spending ($20-$40 million per year) before larger capital commitments ($100 - $210 million per year) in 2017-2019 ~5 years from start of construction to full scale longwall production |
|
|
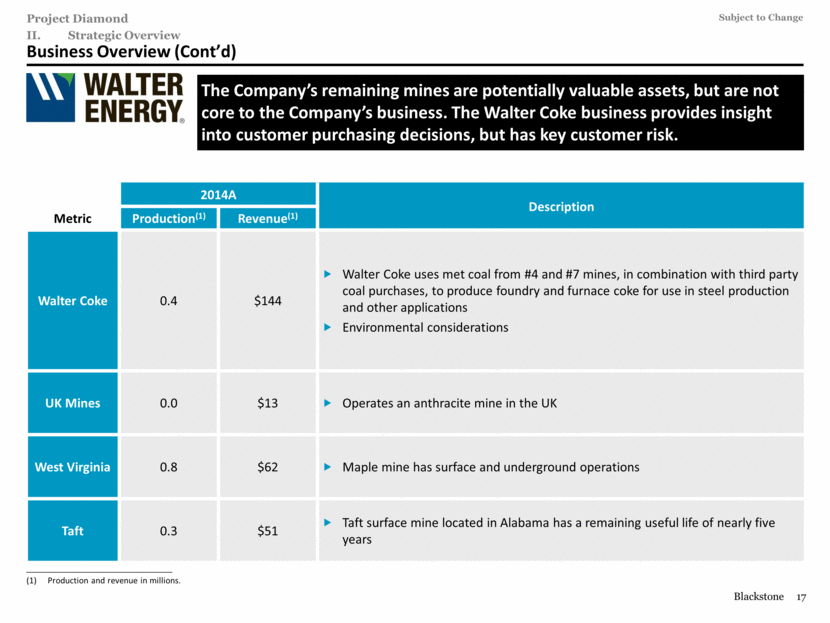
Business Overview (Cont’d) II. Strategic Overview The Company’s remaining mines are potentially valuable assets, but are not core to the Company’s business. The Walter Coke business provides insight into customer purchasing decisions, but has key customer risk. 2014A Description Metric Production(1) Revenue(1) Walter Coke 0.4 $144 Walter Coke uses met coal from #4 and #7 mines, in combination with third party coal purchases, to produce foundry and furnace coke for use in steel production and other applications Environmental considerations UK Mines 0.0 $13 Operates an anthracite mine in the UK West Virginia 0.8 $62 Maple mine has surface and underground operations Taft 0.3 $51 Taft surface mine located in Alabama has a remaining useful life of nearly five years ________________________________________________ Production and revenue in millions. |
|
|
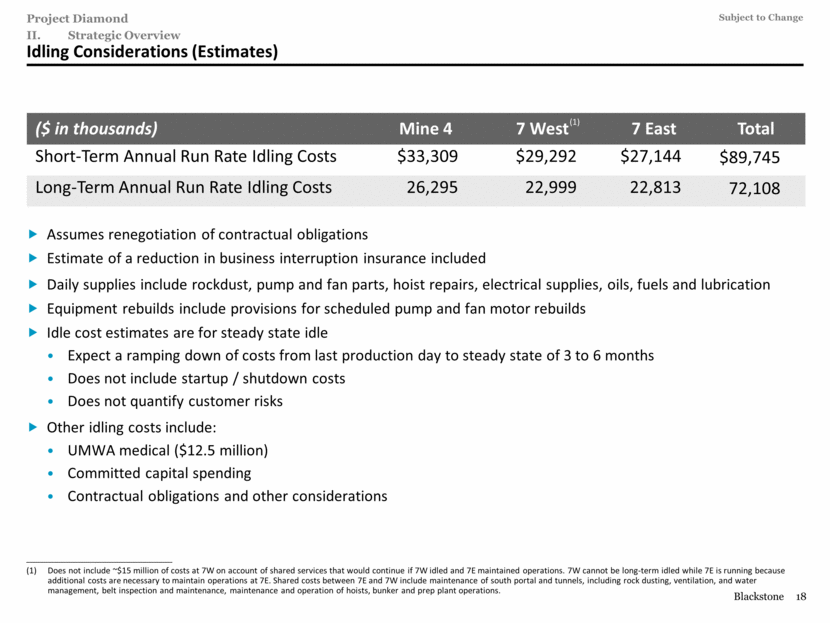
Idling Considerations (Estimates) Assumes renegotiation of contractual obligations Estimate of a reduction in business interruption insurance included Daily supplies include rockdust, pump and fan parts, hoist repairs, electrical supplies, oils, fuels and lubrication Equipment rebuilds include provisions for scheduled pump and fan motor rebuilds Idle cost estimates are for steady state idle Expect a ramping down of costs from last production day to steady state of 3 to 6 months Does not include startup / shutdown costs Does not quantify customer risks Other idling costs include: UMWA medical ($12.5 million) Committed capital spending Contractual obligations and other considerations II. Strategic Overview ($ in thousands) Mine 4 7 West 7 East Total Short-Term Annual Run Rate Idling Costs $33,309 $29,292 $27,144 $89,745 Long-Term Annual Run Rate Idling Costs 26,295 22,999 22,813 72,108 (1) ________________________________________________ Does not include ~$15 million of costs at 7W on account of shared services that would continue if 7W idled and 7E maintained operations. 7W cannot be long-term idled while 7E is running because additional costs are necessary to maintain operations at 7E. Shared costs between 7E and 7W include maintenance of south portal and tunnels, including rock dusting, ventilation, and water management, belt inspection and maintenance, maintenance and operation of hoists, bunker and prep plant operations. |
|
|
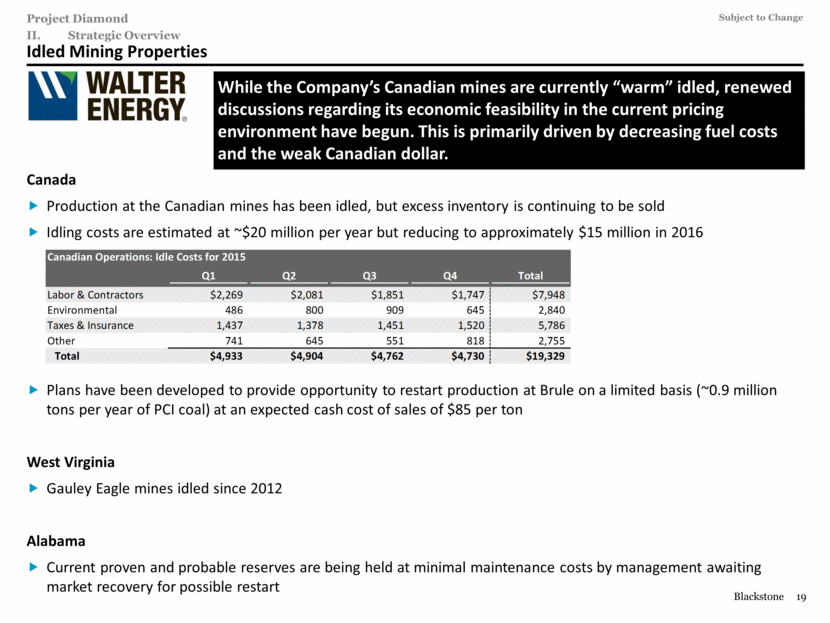
Idled Mining Properties II. Strategic Overview Canada Production at the Canadian mines has been idled, but excess inventory is continuing to be sold Idling costs are estimated at ~$20 million per year but reducing to approximately $15 million in 2016 Plans have been developed to provide opportunity to restart production at Brule on a limited basis (~0.9 million tons per year of PCI coal) at an expected cash cost of sales of $85 per ton West Virginia Gauley Eagle mines idled since 2012 Alabama Current proven and probable reserves are being held at minimal maintenance costs by management awaiting market recovery for possible restart While the Company’s Canadian mines are currently “warm” idled, renewed discussions regarding its economic feasibility in the current pricing environment have begun. This is primarily driven by decreasing fuel costs and the weak Canadian dollar. Canadian Operations: Idle Costs for 2015 Q1 Q2 Q3 Q4 Total Labor & Contractors $2,269 $2,081 $1,851 $1,747 $7,948 Environmental 486 800 909 645 2,840 Taxes & Insurance 1,437 1,378 1,451 1,520 5,786 Other 741 645 551 818 2,755 Total $4,933 $4,904 $4,762 $4,730 $19,329 |
|
|
III. Restructuring Considerations |
|
|
A. Capital / Legal Structure |
|
|
Condensed Organizational Chart A. Capital / Legal Structure Canadian Operating Entities Wolverine, Brule, Willow Creek Mines UK Operating Entities Development mines Atlantic Leaseco LLC Gauley Eagle WV Maple Coal Co. LLC Maple WV Black Warrior Methane Corp & Black Warrior Transmission Corp Gas drilling Belcourt Saxon JV 50% interest Walter Natural Gas, LLC Gas, ConocoP is 30% coinvestor 6 Other Direct Non-Guarantor Subsidiaries Blue Creek Energy Walter Energy Canada Holdings, Inc. Walter Coke, Inc. Furnace and Foundry coking assets Walter Minerals Taft Coal Sales & Associates, Inc. Choctaw, Coal mines and land holdings Tuscaloosa Tuscaloosa Resources, Inc. Swann’s Crossing, and Reid School Jim Walter Resources, Inc. (Mines #4 and #7) $579mm OPEB Blue Creek Coal Sales, Inc. J.W. Walter, Inc. WV land and mineral surface rights Walter Land Company Residential Land Legend Green = Guarantor of Canadian revolving credit facility only Blue = Guarantor under both the secured bank debt / bonds and the unsecured bonds Gray = Non-guarantor 50% $77mm Revolver $978mm Term Loan B $970mm 1st Lien Notes $350mm 2nd Lien PIK Notes $771mm Unsecured Notes $661mm MEPP Claim |
|
|
Collateral Considerations(1) A. Capital / Legal Structure Canadian and UK Subsidiaries Term Lenders, 9.5% and 11/12% PIK Secured Noteholders have a lien on 66% of the equity interests of Walter Energy Canada Holdings, Inc., but no direct claim on any of its assets or the assets of Canadian Guarantors Walter Energy Canada Holdings and the Canadian Guarantors have pledged their assets in favor of the Canadian obligations currently comprising ~$70 million in revolver availability, of which only ~24 million is committed as undrawn letters of credit Blue Creek Energy Walter Energy’s U.S. subsidiaries with total assets less than or equal to 2.0% of Consolidated Total Assets are not guarantors or grantors under the secured debt documents Blue Creek Energy is thus not a guarantor / grantor and not subject to secured lenders’ liens Estimated net costs of construction are approximately ~$600 million and investment uneconomic unless expectation of met coal price is at least ~$150 / tonne Cash cost of sales to average under $90/ton; first five years of full production ~$50-$70/ton Cash Collateral The Company’s cash balances are largely (i) held in investment accounts, or (ii) in deposit accounts that the Company believes to be directly traceable to collateral As such, we believe substantially all of the Company’s U.S. cash balances are subject to the lenders’ liens ________________________________________________ Analysis of intercompany claims, lien perfection and unencumbered assets other than as referenced above is ongoing. |
|
|
Cash Balance Detail A. Capital / Legal Structure ________________________________________________ Note: Includes cash balances with Credit Parties only. Cash Balances as of 6/5/15 ($ in thousands) Balance Company Financial Institution Account Description ($USD) U.S. Operating Accounts $63,163 Atlantic Development & Capital LLC Branch Bank and Trust Concentration, Wire Transfer, and Disbursement Account 3,243 Blue Creek Coal Sales, Inc. JP Morgan Chase Depository Account 1 Jim Walter Resources, Inc. JP Morgan Chase Depository Account 0 Walter Black Warrior Basin, LLC JP Morgan Chase Depository Account 0 Walter Coke, Inc. JP Morgan Chase Depository Account 1 Walter Energy, Inc. Bank of America Concentration, Wire Transfer, and ACH Transfer Account 6,292 Walter Energy, Inc. JP Morgan Chase Concentration, Wire Transfer, and ACH Transfer Account 5,046 Walter Energy, Inc. Regions Bank Concentration, Wire Transfer, and ACH Transfer Account 48,579 U.S. Investment Accounts $204,081 Walter Energy, Inc. Comerica Trust Account and Investment Portal 175,518 Walter Energy, Inc. Bank of America Money Market Investment Account 28,563 Canadian Accounts $32,840 Brule Coal Partnership Scotiabank Pooled Operating Account 11,952 Walter Canadian Coal Partnership Scotiabank Pooled Operating Account 2,020 Walter Energy, Inc. Scotiabank Operating Account 1,832 Willow Creek Coal Partnership Scotiabank Pooled Operating Account 12,570 Wolverine Coal Partnership Scotiabank Pooled Operating Account 4,465 Total Cash $300,083 |
|
|
B. Union Considerations |
|
|
Economics of the Union Contracts B. Union Considerations ________________________________________________ Note: Wolverine Canadian workforce represented by USW. Willow Creek workforce represented by Christian Labor Association. UMWA covers workers at the #4 and #7 mines and other UMWA operations. Based on raw payroll data, 2,170,357 hours were worked for regular wages, 719,759 for Overtime / Saturday and 311,319 for Holiday / Sunday. $60.2mm in regular wages, $30.0mm in Overtime / Saturday wages and $17.4mm in Holiday / Sunday wages were paid. 1974 MEPP spending in 2014 would have been $19.5 million at contribution rate expected to take effect in July 2015. UMWA employees wages and benefits constitute a large percentage of the cash costs of production at mines #4 and #7. UMWA Fund Contributions Hours Rate Amount 1974 MEPP (3) 3,087,336 $5.78 $18 1993 Benefit Plan 3,230,198 1.10 4 2012 Retiree Bonus Account Trust 3,234,675 1.56 5 EPC/NIM Payments Cash Deferred Savings Plan 4 Total Fund Contributions $31 UMWA Operations (1) ($ in millions) UMWA Salaried Total 2014 Wages and Benefits Wages & Overtime (2) $115 53 168 Vacation / Holiday / Sick / Personal (2) 14 9 22 UMWA Healthcare 28 28 Employer and Payroll Taxes 14 14 Worker's Compensation 5 5 Other 0 0 UMWA Fund Contributions 31 31 Post-Retirement Benefit Plan 31 31 Total Costs $237 $62 $299 Number of Employees 1,336 449 1,785 Wage and Benefit Cost per Employee in (000s) $178 $138 $168 Memo: Cash Cost of Production $458 Total UMWA Costs as % of Cash Production Costs 52% |
|
|
OPEB Obligations Walter Energy currently supports five postretirement benefit plans at a total annual cash cost of ~$30 million. Plan 2014A Beneficiaries Legal Entity Obligor Liability EBITDA Cash Cost Retirees Dependents Total United Mine Workers Postretiree Medical Plan $579.2 $57.4 $30.3 1,437 1,228 2,665 Jim Walter Resources Taft Retiree Medical 3.4 0.3 0.3 14 13 27 Taft Coal Walter Coke, Inc. Retiree Medical Plan 11.0 0.1 0.6 91 162 253 Walter Coke Walter Coke, Inc. Retiree Life Plan 0.5 0.0 0.0 160 N/A 160 Walter Coke Salaried Postretiree Medical Plan 4.3 (2.2) 0.1 66 36 102 Multiple Entities Total $598.4 $55.6 $31.3(1) 1,677 1,439 3,116 B. Union Considerations Economics General Description (2) (1) ________________________________________________ Not net of Medicare subsidies. Walter Coke retiree medical plan participants are excluded from the total since they are captured within the life plan. |
|
|
1974 Multi-Employer Pension Plan The Company is a participant in the UMWA's 1974 Multi-Employer Pension Plan and contributes ~$20 million per year. The 1974 Multi-Employer Pension Plan ("MEPP") provides pension benefits to retired miners and surviving spouses 9,200 active miners support over 90,000 beneficiaries In plan year 2014, MEPP received $105 million in contributions against $610 million in paid benefits Participating companies(1) contribute $5.78 ($6.05 beginning on July 1, 2015) to the MEPP for every hour worked by a UMWA miner Miners hired after January 1, 2011 do not participate in the MEPP, and instead receive a $1.50 per hour 401(k) contribution B. Union Considerations ________________________________________________ Participating companies include: Murray Energy, Patriot Coal, Alpha, Walter Energy, Cliffs Mining, Bluestone Industries, Drummond, Pacific West, American Electric Power, and Homer City Processing. MEPP Contribution Summary Pro Forma ($ in thousands) 2012 2013 2014 Average 2014 Hours Worked (thousands) 3,809 3,576 3,234 3,540 3,234 Average Hourly Contribution Rate $5.50 $5.50 $5.52 $5.51 $6.05 Contribution $20,948 $19,670 $17,854 $19,491 $19,568 |
|
|
C. Tax Attributes |

|
|
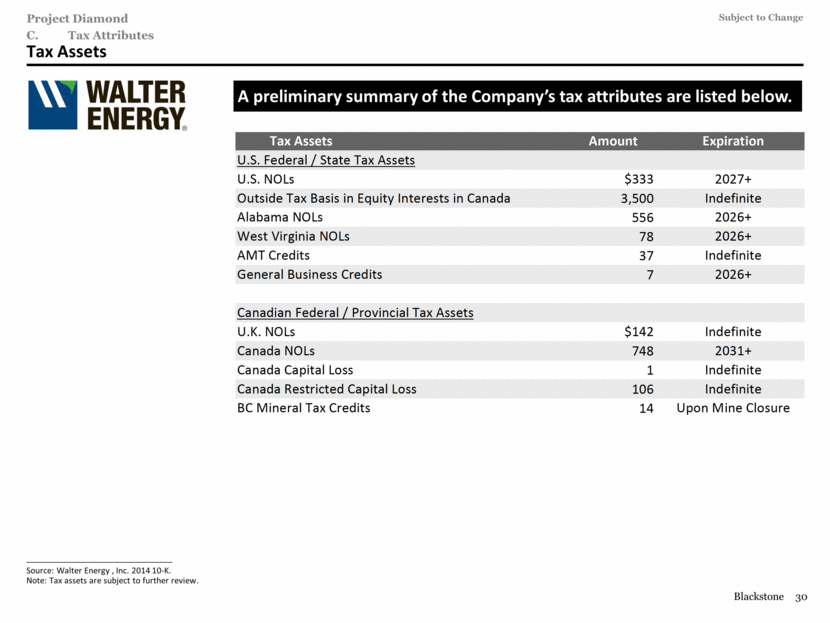
Tax Assets A preliminary summary of the Company’s tax attributes are listed below. ________________________________________________ Source: Walter Energy , Inc. 2014 10-K. Note: Tax assets are subject to further review. C. Tax Attributes (1) Tax Assets Amount Expiration U.S. Federal / State Tax Assets U.S. NOLs $333 2027+ Outside Tax Basis in Equity Interests in Canada 3,500 Indefinite Alabama NOLs 556 2026+ West Virginia NOLs 78 2026+ AMT Credits 37 Indefinite General Business Credits 7 2026+ Canadian Federal / Provincial Tax Assets U.K. NOLs $142 Indefinite Canada NOLs 748 2031+ Canada Capital Loss 1 Indefinite Canada Restricted Capital Loss 106 Indefinite BC Mineral Tax Credits 14 Upon Mine Closure |
|
|
Appendix |

|
|
Mine Detail |

|
|
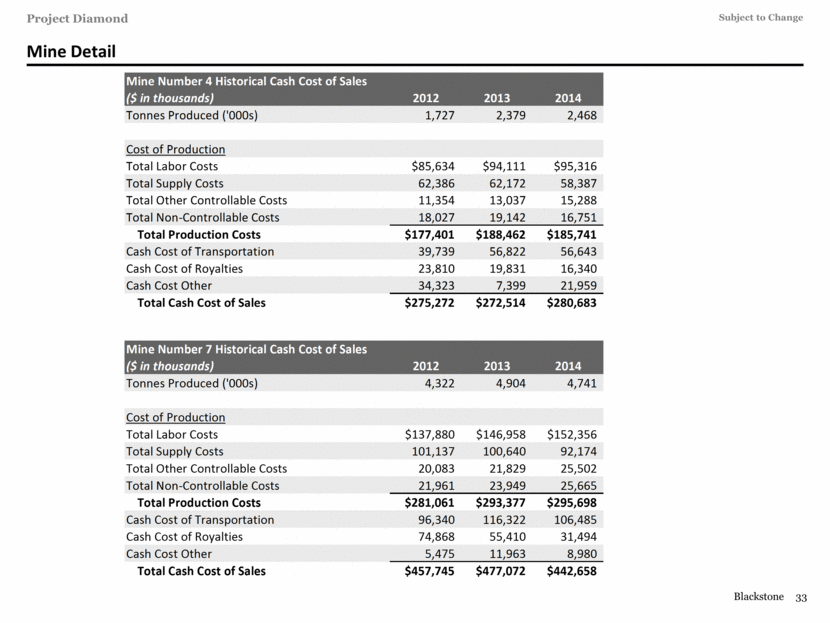
Mine Detail Mine Number 4 Historical Cash Cost of Sales ($ in thousands) 2012 2013 2014 Tonnes Produced ('000s) 1,727 2,379 2,468 Cost of Production Total Labor Costs $85,634 $94,111 $95,316 Total Supply Costs 62,386 62,172 58,387 Total Other Controllable Costs 11,354 13,037 15,288 Total Non-Controllable Costs 18,027 19,142 16,751 Total Production Costs $177,401 $188,462 $185,741 Cash Cost of Transportation 39,739 56,822 56,643 Cash Cost of Royalties 23,810 19,831 16,340 Cash Cost Other 34,323 7,399 21,959 Total Cash Cost of Sales $275,272 $272,514 $280,683 Mine Number 7 Historical Cash Cost of Sales ($ in thousands) 2012 2013 2014 Tonnes Produced ('000s) 4,322 4,904 4,741 Cost of Production Total Labor Costs $137,880 $146,958 $152,356 Total Supply Costs 101,137 100,640 92,174 Total Other Controllable Costs 20,083 21,829 25,502 Total Non-Controllable Costs 21,961 23,949 25,665 Total Production Costs $281,061 $293,377 $295,698 Cash Cost of Transportation 96,340 116,322 106,485 Cash Cost of Royalties 74,868 55,410 31,494 Cash Cost Other 5,475 11,963 8,980 Total Cash Cost of Sales $457,745 $477,072 $442,658 |
|
|
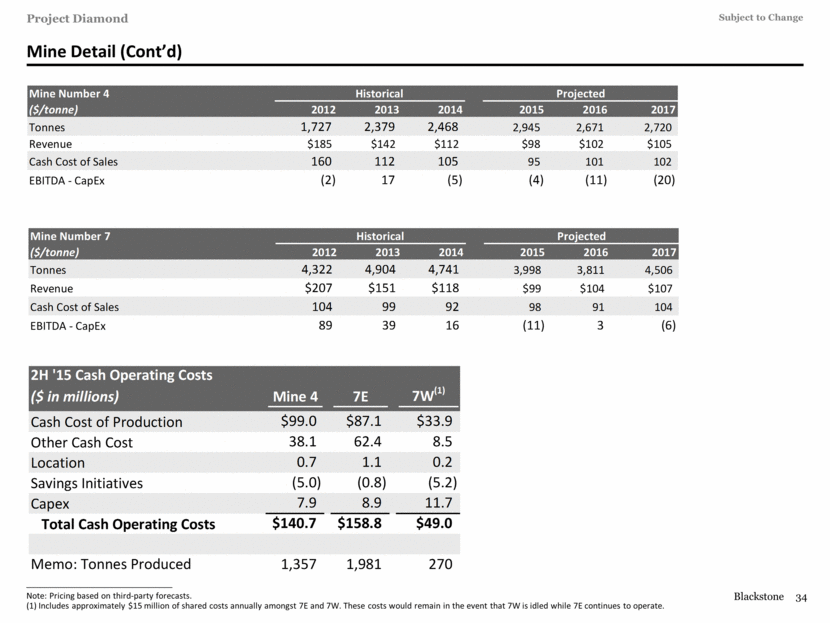
Mine Detail (Cont’d) ________________________________________________ Note: Pricing based on third-party forecasts. (1) Includes approximately $15 million of shared costs annually amongst 7E and 7W. These costs would remain in the event that 7W is idled while 7E continues to operate. Mine Number 4 Historical Projected ($/tonne) 2012 2013 2014 2015 2016 2017 Tonnes 1,727 2,379 2,468 2,945 2,671 2,720 Revenue $185 $142 $112 $98 $102 $105 Cash Cost of Sales 160 112 105 95 101 102 EBITDA - CapEx (2) 17 (5) (4) (11) (20) Mine Number 7 Historical Projected ($/tonne) 2012 2013 2014 2015 2016 2017 Tonnes 4,322 4,904 4,741 3,998 3,811 4,506 Revenue $207 $151 $118 $99 $104 $107 Cash Cost of Sales 104 99 92 98 91 104 EBITDA - CapEx 89 39 16 (11) 3 (6) 2H '15 Cash Operating Costs ($ in millions) Mine 4 7E 7W (1) Cash Cost of Production $99.0 $87.1 $33.9 Other Cash Cost 38.1 62.4 8.5 Location 0.7 1.1 0.2 Savings Initiatives (5.0) (0.8) (5.2) Capex 7.9 8.9 11.7 Total Cash Operating Costs $140.7 $158.8 $49.0 Memo: Tonnes Produced 1,357 1,981 270 |
|
|
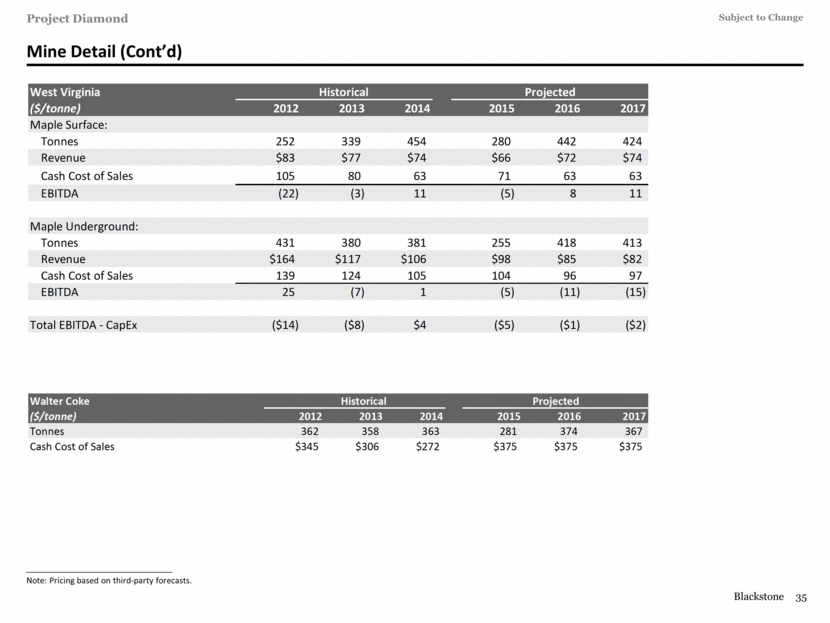
Mine Detail (Cont’d) ________________________________________________ Note: Pricing based on third-party forecasts. West Virginia Historical Projected ($/tonne) 2012 2013 2014 2015 2016 2017 Maple Surface: Tonnes 252 339 454 280 442 424 Revenue $83 $77 $74 $66 $72 $74 Cash Cost of Sales 105 80 63 71 63 63 EBITDA (22) (3) 11 (5) 8 11 Maple Underground: Tonnes 431 380 381 255 418 413 Revenue $164 $117 $106 $98 $85 $82 Cash Cost of Sales 139 124 105 104 96 97 EBITDA 25 (7) 1 (5) (11) (15) Total EBITDA - CapEx ($14) ($8) $4 ($5) ($1) ($2) Walter Coke Historical Projected ($/tonne) 2012 2013 2014 2015 2016 2017 Tonnes 362 358 363 281 374 367 Cash Cost of Sales $345 $306 $272 $375 $375 $375 |
|
|
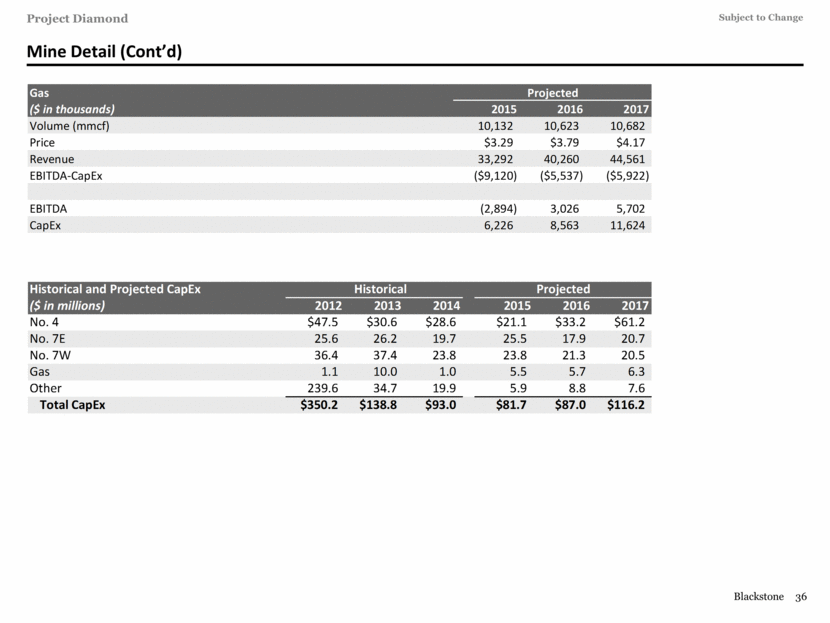
Mine Detail (Cont’d) Historical and Projected CapEx Historical Projected ($ in millions) 2012 2013 2014 2015 2016 2017 No. 4 $47.5 $30.6 $28.6 $21.1 $33.2 $61.2 No. 7E 25.6 26.2 19.7 25.5 17.9 20.7 No. 7W 36.4 37.4 23.8 23.8 21.3 20.5 Gas 1.1 10.0 1.0 5.5 5.7 6.3 Other 239.6 34.7 19.9 5.9 8.8 7.6 Total CapEx $350.2 $138.8 $93.0 $81.7 $87.0 $116.2 Gas Projected ($ in thousands) 2015 2016 2017 Volume (mmcf) 10,132 10,623 10,682 Price $3.29 $3.79 $4.17 Revenue 33,292 40,260 44,561 EBITDA-CapEx ($9,120) ($5,537) ($5,922) EBITDA (2,894) 3,026 5,702 CapEx 6,226 8,563 11,624 |
|
|
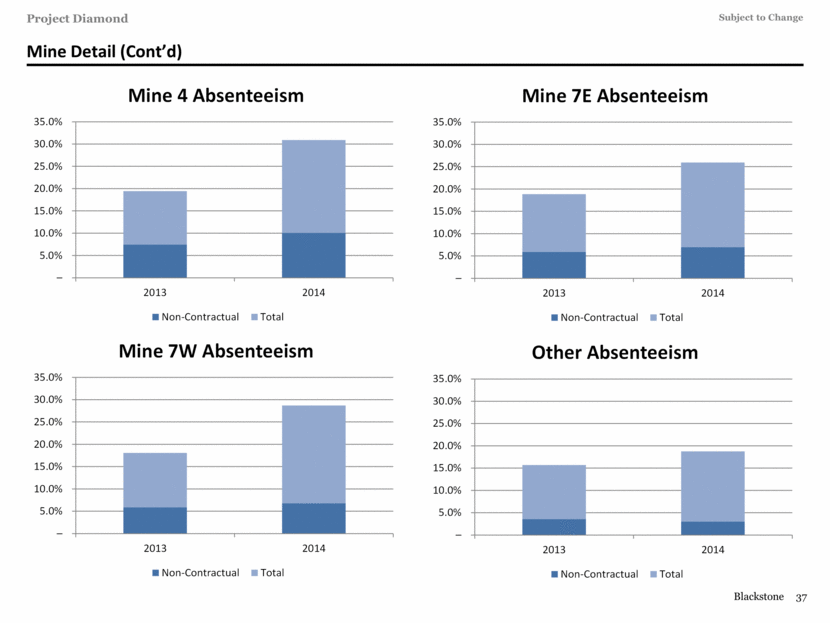
Mine Detail (Cont’d) – 5.0% 10.0% 15.0% 20.0% 25.0% 30.0% 35.0% 2013 2014 Other Absenteeism Non-Contractual Total – 5.0% 10.0% 15.0% 20.0% 25.0% 30.0% 35.0% 2013 2014 Mine 4 Absenteeism Non-Contractual Total – 5.0% 10.0% 15.0% 20.0% 25.0% 30.0% 35.0% 2013 2014 Mine 7E Absenteeism Non-Contractual Total – 5.0% 10.0% 15.0% 20.0% 25.0% 30.0% 35.0% 2013 2014 Mine 7W Absenteeism Non-Contractual Total |
|
|
Financial Forecast |

|
|
Cash Flow Forecast |

|
|
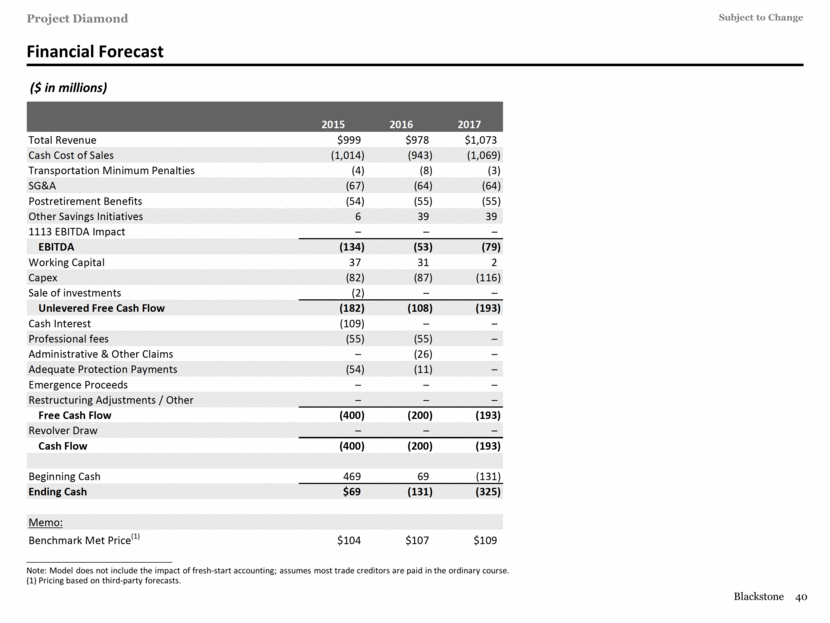
Financial Forecast ($ in millions) ________________________________________________ Note: Model does not include the impact of fresh-start accounting; assumes most trade creditors are paid in the ordinary course. (1) Pricing based on third-party forecasts. 2015 2016 2017 Total Revenue $999 $978 $1,073 Cash Cost of Sales (1,014) (943) (1,069) Transportation Minimum Penalties (4) (8) (3) SG&A (67) (64) (64) Postretirement Benefits (54) (55) (55) Other Savings Initiatives 6 39 39 1113 EBITDA Impact – – – EBITDA (134) (53) (79) Working Capital 37 31 2 Capex (82) (87) (116) Sale of investments (2) – – Unlevered Free Cash Flow (182) (108) (193) Cash Interest (109) – – Professional fees (55) (55) – Administrative & Other Claims – (26) – Adequate Protection Payments (54) (11) – Emergence Proceeds – – – Restructuring Adjustments / Other – – – Free Cash Flow (400) (200) (193) Revolver Draw – – – Cash Flow (400) (200) (193) Beginning Cash 469 69 (131) Ending Cash $69 (131) (325) Memo: Benchmark Met Price (1) $104 $107 $109 |
|
|
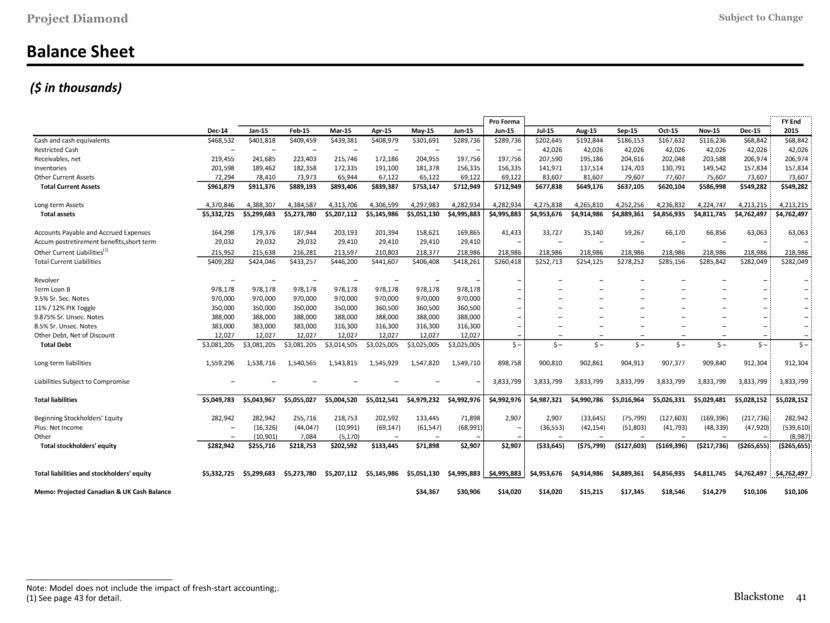
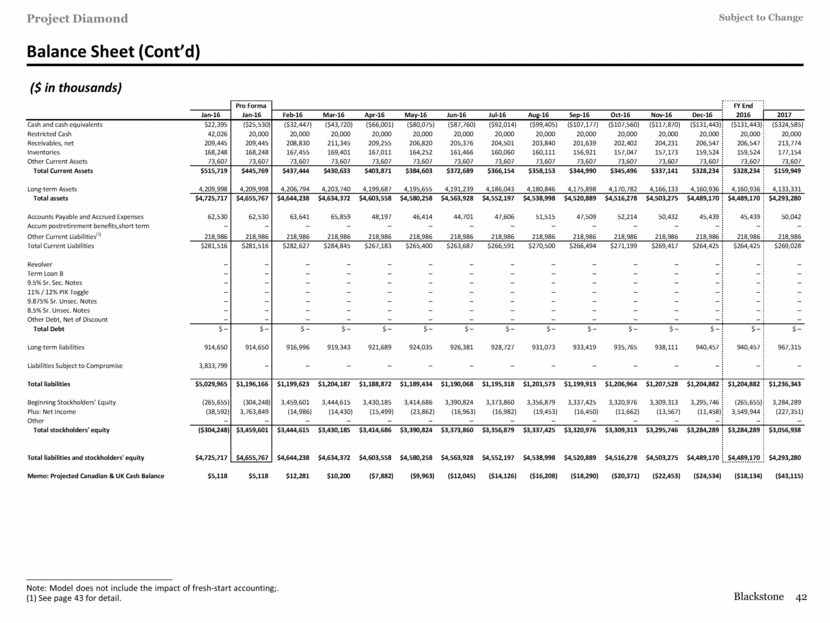
Balance Sheet ($ in thousands) ________________________________________________ Note: Model does not include the impact of fresh-start accounting;. (1) See page 43 for detail. Pro Forma FY End Dec-14 Jan-15 Feb-15 Mar-15 Apr-15 May-15 Jun-15 Jun-15 Jul-15 Aug-15 Sep-15 Oct-15 Nov-15 Dec-15 2015 Cash and cash equivalents $468,532 $401,818 $409,459 $439,381 $408,979 $301,691 $289,736 $289,736 $202,645 $192,844 $186,153 $167,632 $116,236 $68,842 $68,842 Restricted Cash – – – – – – – – 42,026 42,026 42,026 42,026 42,026 42,026 42,026 Receivables, net 219,455 241,685 223,403 215,746 172,186 204,955 197,756 197,756 207,590 195,186 204,616 202,048 203,588 206,974 206,974 Inventories 201,598 189,462 182,358 172,335 191,100 181,378 156,335 156,335 141,971 137,514 124,703 130,791 149,542 157,834 157,834 Other Current Assets 72,294 78,410 73,973 65,944 67,122 65,122 69,122 69,122 83,607 81,607 79,607 77,607 75,607 73,607 73,607 Total Current Assets $961,879 $911,376 $889,193 $893,406 $839,387 $753,147 $712,949 $712,949 $677,838 $649,176 $637,105 $620,104 $586,998 $549,282 $549,282 Long-term Assets 4,370,846 4,388,307 4,384,587 4,313,706 4,306,599 4,297,983 4,282,934 4,282,934 4,275,838 4,265,810 4,252,256 4,236,832 4,224,747 4,213,215 4,213,215 Total assets $5,332,725 $5,299,683 $5,273,780 $5,207,112 $5,145,986 $5,051,130 $4,995,883 $4,995,883 $4,953,676 $4,914,986 $4,889,361 $4,856,935 $4,811,745 $4,762,497 $4,762,497 Accounts Payable and Accrued Expenses 164,298 179,376 187,944 203,193 201,394 158,621 169,865 41,433 33,727 35,140 59,267 66,170 66,856 63,063 63,063 Accum postretirement benefits,short term 29,032 29,032 29,032 29,410 29,410 29,410 29,410 – – – – – – – – Other Current Liabilities (1) 215,952 215,638 216,281 213,597 210,803 218,377 218,986 218,986 218,986 218,986 218,986 218,986 218,986 218,986 218,986 Total Current Liabilities $409,282 $424,046 $433,257 $446,200 $441,607 $406,408 $418,261 $260,418 $252,713 $254,125 $278,252 $285,156 $285,842 $282,049 $282,049 Revolver – – – – – – – – – – – – – – – Term Loan B 978,178 978,178 978,178 978,178 978,178 978,178 978,178 – – – – – – – – 9.5% Sr. Sec. Notes 970,000 970,000 970,000 970,000 970,000 970,000 970,000 – – – – – – – – 11% / 12% PIK Toggle 350,000 350,000 350,000 350,000 360,500 360,500 360,500 – – – – – – – – 9.875% Sr. Unsec. Notes 388,000 388,000 388,000 388,000 388,000 388,000 388,000 – – – – – – – – 8.5% Sr. Unsec. Notes 383,000 383,000 383,000 316,300 316,300 316,300 316,300 – – – – – – – – Other Debt, Net of Discount 12,027 12,027 12,027 12,027 12,027 12,027 12,027 – – – – – – – – Total Debt $3,081,205 $3,081,205 $3,081,205 $3,014,505 $3,025,005 $3,025,005 $3,025,005 $ – $ – $ – $ – $ – $ – $ – $ – Long-term liabilities 1,559,296 1,538,716 1,540,565 1,543,815 1,545,929 1,547,820 1,549,710 898,758 900,810 902,861 904,913 907,377 909,840 912,304 912,304 Liabilities Subject to Compromise – – – – – – – 3,833,799 3,833,799 3,833,799 3,833,799 3,833,799 3,833,799 3,833,799 3,833,799 Total liabilities $5,049,783 $5,043,967 $5,055,027 $5,004,520 $5,012,541 $4,979,232 $4,992,976 $4,992,976 $4,987,321 $4,990,786 $5,016,964 $5,026,331 $5,029,481 $5,028,152 $5,028,152 Beginning Stockholders' Equity 282,942 282,942 255,716 218,753 202,592 133,445 71,898 2,907 2,907 (33,645) (75,799) (127,603) (169,396) (217,736) 282,942 Plus: Net Income – (16,326) (44,047) (10,991) (69,147) (61,547) (68,991) – (36,553) (42,154) (51,803) (41,793) (48,339) (47,920) (539,610) Other – (10,901) 7,084 (5,170) – – – – – – – – – – (8,987) Total stockholders' equity $282,942 $255,716 $218,753 $202,592 $133,445 $71,898 $2,907 $2,907 ($33,645) ($75,799) ($127,603) ($169,396) ($217,736) ($265,655) ($265,655) Total liabilities and stockholders' equity $5,332,725 $5,299,683 $5,273,780 $5,207,112 $5,145,986 $5,051,130 $4,995,883 $4,995,883 $4,953,676 $4,914,986 $4,889,361 $4,856,935 $4,811,745 $4,762,497 $4,762,497 Memo: Projected Canadian & UK Cash Balance $34,367 $30,906 $14,020 $14,020 $15,215 $17,345 $18,546 $14,279 $10,106 $10,106 |
|
|
Balance Sheet (Cont’d) ($ in thousands) ________________________________________________ Note: Model does not include the impact of fresh-start accounting;. (1) See page 43 for detail. Pro Forma FY End Jan-16 Jan-16 Feb-16 Mar-16 Apr-16 May-16 Jun-16 Jul-16 Aug-16 Sep-16 Oct-16 Nov-16 Dec-16 2016 2017 Cash and cash equivalents $22,395 ($25,530) ($32,447) ($43,720) ($66,001) ($80,075) ($87,760) ($92,014) ($99,405) ($107,177) ($107,560) ($117,870) ($131,443) ($131,443) ($324,585) Restricted Cash 42,026 20,000 20,000 20,000 20,000 20,000 20,000 20,000 20,000 20,000 20,000 20,000 20,000 20,000 20,000 Receivables, net 209,445 209,445 208,830 211,345 209,255 206,820 205,376 204,501 203,840 201,639 202,402 204,231 206,547 206,547 213,774 Inventories 168,248 168,248 167,455 169,401 167,011 164,252 161,466 160,060 160,111 156,921 157,047 157,173 159,524 159,524 177,154 Other Current Assets 73,607 73,607 73,607 73,607 73,607 73,607 73,607 73,607 73,607 73,607 73,607 73,607 73,607 73,607 73,607 Total Current Assets $515,719 $445,769 $437,444 $430,633 $403,871 $384,603 $372,689 $366,154 $358,153 $344,990 $345,496 $337,141 $328,234 $328,234 $159,949 Long-term Assets 4,209,998 4,209,998 4,206,794 4,203,740 4,199,687 4,195,655 4,191,239 4,186,043 4,180,846 4,175,898 4,170,782 4,166,133 4,160,936 4,160,936 4,133,331 Total assets $4,725,717 $4,655,767 $4,644,238 $4,634,372 $4,603,558 $4,580,258 $4,563,928 $4,552,197 $4,538,998 $4,520,889 $4,516,278 $4,503,275 $4,489,170 $4,489,170 $4,293,280 Accounts Payable and Accrued Expenses 62,530 62,530 63,641 65,859 48,197 46,414 44,701 47,606 51,515 47,509 52,214 50,432 45,439 45,439 50,042 Accum postretirement benefits,short term – – – – – – – – – – – – – – – Other Current Liabilities (1) 218,986 218,986 218,986 218,986 218,986 218,986 218,986 218,986 218,986 218,986 218,986 218,986 218,986 218,986 218,986 Total Current Liabilities $281,516 $281,516 $282,627 $284,845 $267,183 $265,400 $263,687 $266,591 $270,500 $266,494 $271,199 $269,417 $264,425 $264,425 $269,028 Revolver – – – – – – – – – – – – – – – Term Loan B – – – – – – – – – – – – – – – 9.5% Sr. Sec. Notes – – – – – – – – – – – – – – – 11% / 12% PIK Toggle – – – – – – – – – – – – – – – 9.875% Sr. Unsec. Notes – – – – – – – – – – – – – – – 8.5% Sr. Unsec. Notes – – – – – – – – – – – – – – – Other Debt, Net of Discount – – – – – – – – – – – – – – – Total Debt $ – $ – $ – $ – $ – $ – $ – $ – $ – $ – $ – $ – $ – $ – $ – Long-term liabilities 914,650 914,650 916,996 919,343 921,689 924,035 926,381 928,727 931,073 933,419 935,765 938,111 940,457 940,457 967,315 Liabilities Subject to Compromise 3,833,799 – – – – – – – – – – – – – – Total liabilities $5,029,965 $1,196,166 $1,199,623 $1,204,187 $1,188,872 $1,189,434 $1,190,068 $1,195,318 $1,201,573 $1,199,913 $1,206,964 $1,207,528 $1,204,882 $1,204,882 $1,236,343 Beginning Stockholders' Equity (265,655) (304,248) 3,459,601 3,444,615 3,430,185 3,414,686 3,390,824 3,373,860 3,356,879 3,337,425 3,320,976 3,309,313 3,295,746 (265,655) 3,284,289 Plus: Net Income (38,592) 3,763,849 (14,986) (14,430) (15,499) (23,862) (16,963) (16,982) (19,453) (16,450) (11,662) (13,567) (11,458) 3,549,944 (227,351) Other – – – – – – – – – – – – – – – Total stockholders' equity ($304,248) $3,459,601 $3,444,615 $3,430,185 $3,414,686 $3,390,824 $3,373,860 $3,356,879 $3,337,425 $3,320,976 $3,309,313 $3,295,746 $3,284,289 $3,284,289 $3,056,938 Total liabilities and stockholders' equity $4,725,717 $4,655,767 $4,644,238 $4,634,372 $4,603,558 $4,580,258 $4,563,928 $4,552,197 $4,538,998 $4,520,889 $4,516,278 $4,503,275 $4,489,170 $4,489,170 $4,293,280 Memo: Projected Canadian & UK Cash Balance $5,118 $5,118 $12,281 $10,200 ($7,882) ($9,963) ($12,045) ($14,126) ($16,208) ($18,290) ($20,371) ($22,453) ($24,534) ($18,134) ($43,115) |
|
|
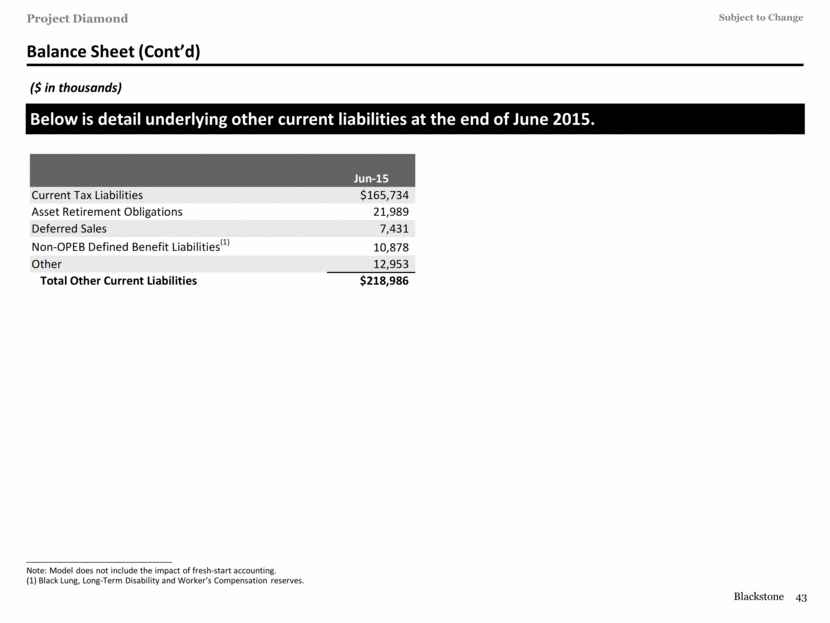
Balance Sheet (Cont’d) ($ in thousands) ________________________________________________ Note: Model does not include the impact of fresh-start accounting. (1) Black Lung, Long-Term Disability and Worker’s Compensation reserves. Below is detail underlying other current liabilities at the end of June 2015. Jun-15 Current Tax Liabilities $165,734 Asset Retirement Obligations 21,989 Deferred Sales 7,431 Non-OPEB Defined Benefit Liabilities (1) 10,878 Other 12,953 Total Other Current Liabilities $218,986 |
|
|
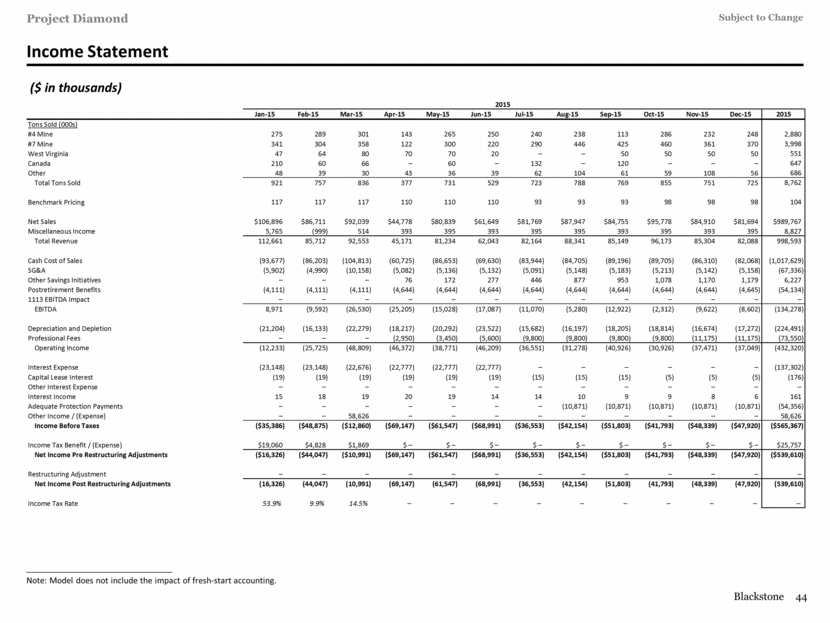
Income Statement ($ in thousands) ________________________________________________ Note: Model does not include the impact of fresh-start accounting. 2015 Jan-15 Feb-15 Mar-15 Apr-15 May-15 Jun-15 Jul-15 Aug-15 Sep-15 Oct-15 Nov-15 Dec-15 2015 Tons Sold (000s) #4 Mine 275 289 301 143 265 250 240 238 113 286 232 248 2,880 #7 Mine 341 304 358 122 300 220 290 446 425 460 361 370 3,998 West Virginia 47 64 80 70 70 20 – – 50 50 50 50 551 Canada 210 60 66 – 60 – 132 – 120 – – – 647 Other 48 39 30 43 36 39 62 104 61 59 108 56 686 Total Tons Sold 921 757 836 377 731 529 723 788 769 855 751 725 8,762 Benchmark Pricing 117 117 117 110 110 110 93 93 93 98 98 98 104 Net Sales $106,896 $86,711 $92,039 $44,778 $80,839 $61,649 $81,769 $87,947 $84,755 $95,778 $84,910 $81,694 $989,767 Miscellaneous Income 5,765 (999) 514 393 395 393 395 395 393 395 393 395 8,827 Total Revenue 112,661 85,712 92,553 45,171 81,234 62,043 82,164 88,341 85,149 96,173 85,304 82,088 998,593 Cash Cost of Sales (93,677) (86,203) (104,813) (60,725) (86,653) (69,630) (83,944) (84,705) (89,196) (89,705) (86,310) (82,068) (1,017,629) SG&A (5,902) (4,990) (10,158) (5,082) (5,136) (5,132) (5,091) (5,148) (5,183) (5,213) (5,142) (5,158) (67,336) Other Savings Initiatives – – – 76 172 277 446 877 953 1,078 1,170 1,179 6,227 Postretirement Benefits (4,111) (4,111) (4,111) (4,644) (4,644) (4,644) (4,644) (4,644) (4,644) (4,644) (4,644) (4,645) (54,134) 1113 EBITDA Impact – – – – – – – – – – – – – EBITDA 8,971 (9,592) (26,530) (25,205) (15,028) (17,087) (11,070) (5,280) (12,922) (2,312) (9,622) (8,602) (134,278) Depreciation and Depletion (21,204) (16,133) (22,279) (18,217) (20,292) (23,522) (15,682) (16,197) (18,205) (18,814) (16,674) (17,272) (224,491) Professional Fees – – – (2,950) (3,450) (5,600) (9,800) (9,800) (9,800) (9,800) (11,175) (11,175) (73,550) Operating Income (12,233) (25,725) (48,809) (46,372) (38,771) (46,209) (36,551) (31,278) (40,926) (30,926) (37,471) (37,049) (432,320) Interest Expense (23,148) (23,148) (22,676) (22,777) (22,777) (22,777) – – – – – – (137,302) Capital Lease Interest (19) (19) (19) (19) (19) (19) (15) (15) (15) (5) (5) (5) (176) Other Interest Expense – – – – – – – – – – – – – Interest Income 15 18 19 20 19 14 14 10 9 9 8 6 161 Adequate Protection Payments – – – – – – – (10,871) (10,871) (10,871) (10,871) (10,871) (54,356) Other Income / (Expense) – – 58,626 – – – – – – – – – 58,626 Income Before Taxes ($35,386) ($48,875) ($12,860) ($69,147) ($61,547) ($68,991) ($36,553) ($42,154) ($51,803) ($41,793) ($48,339) ($47,920) ($565,367) Income Tax Benefit / (Expense) $19,060 $4,828 $1,869 $ – $ – $ – $ – $ – $ – $ – $ – $ – $25,757 Net Income Pre Restructuring Adjustments ($16,326) ($44,047) ($10,991) ($69,147) ($61,547) ($68,991) ($36,553) ($42,154) ($51,803) ($41,793) ($48,339) ($47,920) ($539,610) Restructuring Adjustment – – – – – – – – – – – – – Net Income Post Restructuring Adjustments (16,326) (44,047) (10,991) (69,147) (61,547) (68,991) (36,553) (42,154) (51,803) (41,793) (48,339) (47,920) (539,610) Income Tax Rate 53.9% 9.9% 14.5% – – – – – – – – – – |
|
|
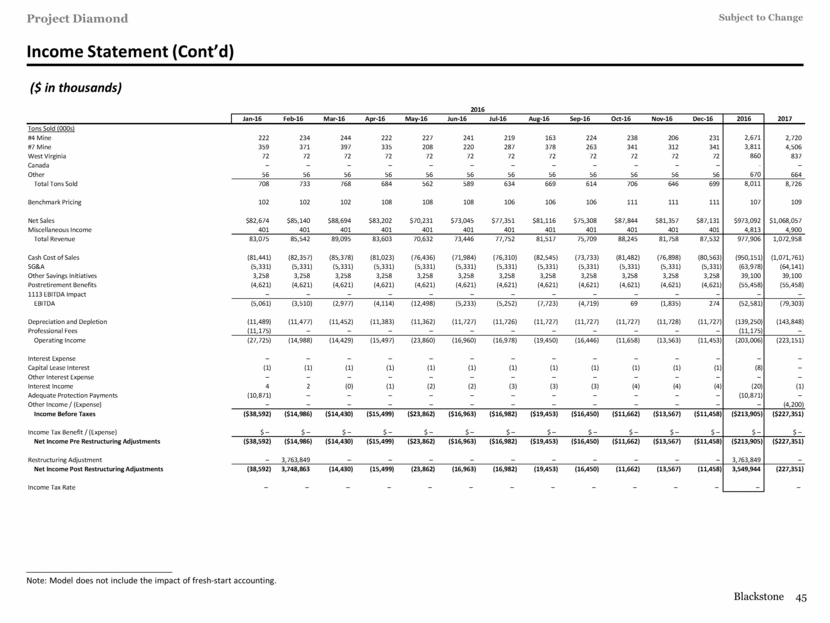
Income Statement (Cont’d) ($ in thousands) ________________________________________________ Note: Model does not include the impact of fresh-start accounting. 2016 Jan-16 Feb-16 Mar-16 Apr-16 May-16 Jun-16 Jul-16 Aug-16 Sep-16 Oct-16 Nov-16 Dec-16 2016 2017 Tons Sold (000s) #4 Mine 222 234 244 222 227 241 219 163 224 238 206 231 2,671 2,720 #7 Mine 359 371 397 335 208 220 287 378 263 341 312 341 3,811 4,506 West Virginia 72 72 72 72 72 72 72 72 72 72 72 72 860 837 Canada – – – – – – – – – – – – - – Other 56 56 56 56 56 56 56 56 56 56 56 56 670 664 Total Tons Sold 708 733 768 684 562 589 634 669 614 706 646 699 8,011 8,726 Benchmark Pricing 102 102 102 108 108 108 106 106 106 111 111 111 107 109 Net Sales $82,674 $85,140 $88,694 $83,202 $70,231 $73,045 $77,351 $81,116 $75,308 $87,844 $81,357 $87,131 $973,092 $1,068,057 Miscellaneous Income 401 401 401 401 401 401 401 401 401 401 401 401 4,813 4,900 Total Revenue 83,075 85,542 89,095 83,603 70,632 73,446 77,752 81,517 75,709 88,245 81,758 87,532 977,906 1,072,958 Cash Cost of Sales (81,441) (82,357) (85,378) (81,023) (76,436) (71,984) (76,310) (82,545) (73,733) (81,482) (76,898) (80,563) (950,151) (1,071,761) SG&A (5,331) (5,331) (5,331) (5,331) (5,331) (5,331) (5,331) (5,331) (5,331) (5,331) (5,331) (5,331) (63,978) (64,141) Other Savings Initiatives 3,258 3,258 3,258 3,258 3,258 3,258 3,258 3,258 3,258 3,258 3,258 3,258 39,100 39,100 Postretirement Benefits (4,621) (4,621) (4,621) (4,621) (4,621) (4,621) (4,621) (4,621) (4,621) (4,621) (4,621) (4,621) (55,458) (55,458) 1113 EBITDA Impact – – – – – – – – – – – – – – EBITDA (5,061) (3,510) (2,977) (4,114) (12,498) (5,233) (5,252) (7,723) (4,719) 69 (1,835) 274 (52,581) (79,303) Depreciation and Depletion (11,489) (11,477) (11,452) (11,383) (11,362) (11,727) (11,726) (11,727) (11,727) (11,727) (11,728) (11,727) (139,250) (143,848) Professional Fees (11,175) – – – – – – – – – – – (11,175) – Operating Income (27,725) (14,988) (14,429) (15,497) (23,860) (16,960) (16,978) (19,450) (16,446) (11,658) (13,563) (11,453) (203,006) (223,151) Interest Expense – – – – – – – – – – – – – – Capital Lease Interest (1) (1) (1) (1) (1) (1) (1) (1) (1) (1) (1) (1) (8) – Other Interest Expense – – – – – – – – – – – – – – Interest Income 4 2 (0) (1) (2) (2) (3) (3) (3) (4) (4) (4) (20) (1) Adequate Protection Payments (10,871) – – – – – – – – – – – (10,871) – Other Income / (Expense) – – – – – – – – – – – – – (4,200) Income Before Taxes ($38,592) ($14,986) ($14,430) ($15,499) ($23,862) ($16,963) ($16,982) ($19,453) ($16,450) ($11,662) ($13,567) ($11,458) ($213,905) ($227,351) Income Tax Benefit / (Expense) $ – $ – $ – $ – $ – $ – $ – $ – $ – $ – $ – $ – $ – $ – Net Income Pre Restructuring Adjustments ($38,592) ($14,986) ($14,430) ($15,499) ($23,862) ($16,963) ($16,982) ($19,453) ($16,450) ($11,662) ($13,567) ($11,458) ($213,905) ($227,351) Restructuring Adjustment – 3,763,849 – – – – – – – – – – 3,763,849 – Net Income Post Restructuring Adjustments (38,592) 3,748,863 (14,430) (15,499) (23,862) (16,963) (16,982) (19,453) (16,450) (11,662) (13,567) (11,458) 3,549,944 (227,351) Income Tax Rate – – – – – – – – – – – – – – |
|
|
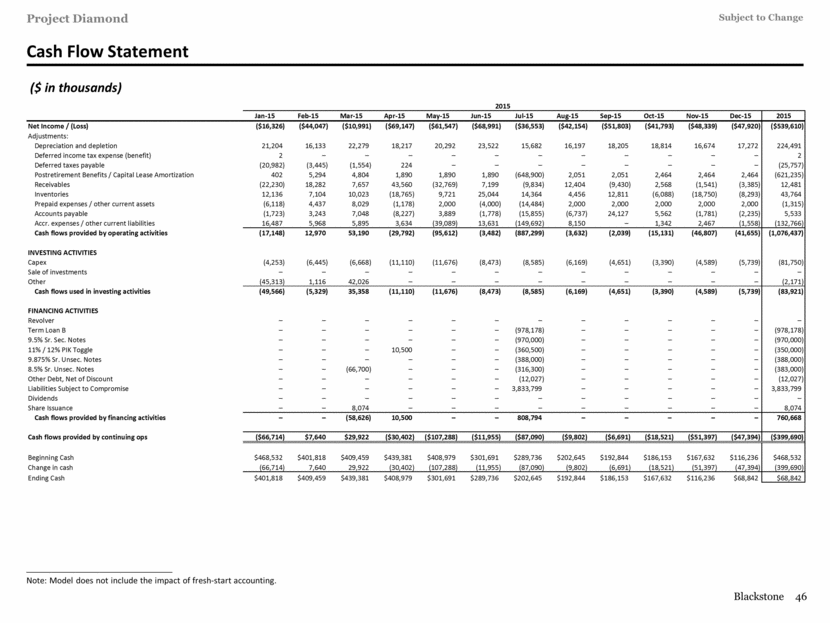
Cash Flow Statement ($ in thousands) ________________________________________________ Note: Model does not include the impact of fresh-start accounting. 2015 Jan-15 Feb-15 Mar-15 Apr-15 May-15 Jun-15 Jul-15 Aug-15 Sep-15 Oct-15 Nov-15 Dec-15 2015 Net Income / (Loss) ($16,326) ($44,047) ($10,991) ($69,147) ($61,547) ($68,991) ($36,553) ($42,154) ($51,803) ($41,793) ($48,339) ($47,920) ($539,610) Adjustments: Depreciation and depletion 21,204 16,133 22,279 18,217 20,292 23,522 15,682 16,197 18,205 18,814 16,674 17,272 224,491 Deferred income tax expense (benefit) 2 – – – – – – – – – – – 2 Deferred taxes payable (20,982) (3,445) (1,554) 224 – – – – – – – – (25,757) Postretirement Benefits / Capital Lease Amortization 402 5,294 4,804 1,890 1,890 1,890 (648,900) 2,051 2,051 2,464 2,464 2,464 (621,235) Receivables (22,230) 18,282 7,657 43,560 (32,769) 7,199 (9,834) 12,404 (9,430) 2,568 (1,541) (3,385) 12,481 Inventories 12,136 7,104 10,023 (18,765) 9,721 25,044 14,364 4,456 12,811 (6,088) (18,750) (8,293) 43,764 Prepaid expenses / other current assets (6,118) 4,437 8,029 (1,178) 2,000 (4,000) (14,484) 2,000 2,000 2,000 2,000 2,000 (1,315) Accounts payable (1,723) 3,243 7,048 (8,227) 3,889 (1,778) (15,855) (6,737) 24,127 5,562 (1,781) (2,235) 5,533 Accr. expenses / other current liabilities 16,487 5,968 5,895 3,634 (39,089) 13,631 (149,692) 8,150 – 1,342 2,467 (1,558) (132,766) Cash flows provided by operating activities (17,148) 12,970 53,190 (29,792) (95,612) (3,482) (887,299) (3,632) (2,039) (15,131) (46,807) (41,655) (1,076,437) INVESTING ACTIVITIES Capex (4,253) (6,445) (6,668) (11,110) (11,676) (8,473) (8,585) (6,169) (4,651) (3,390) (4,589) (5,739) (81,750) Sale of investments – – – – – – – – – – – – – Other (45,313) 1,116 42,026 – – – – – – – – – (2,171) Cash flows used in investing activities (49,566) (5,329) 35,358 (11,110) (11,676) (8,473) (8,585) (6,169) (4,651) (3,390) (4,589) (5,739) (83,921) FINANCING ACTIVITIES Revolver – – – – – – – – – – – – – Term Loan B – – – – – – (978,178) – – – – – (978,178) 9.5% Sr. Sec. Notes – – – – – – (970,000) – – – – – (970,000) 11% / 12% PIK Toggle – – – 10,500 – – (360,500) – – – – – (350,000) 9.875% Sr. Unsec. Notes – – – – – – (388,000) – – – – – (388,000) 8.5% Sr. Unsec. Notes – – (66,700) – – – (316,300) – – – – – (383,000) Other Debt, Net of Discount – – – – – – (12,027) – – – – – (12,027) Liabilities Subject to Compromise – – – – – – 3,833,799 – – – – – 3,833,799 Dividends – – – – – – – – – – – – – Share Issuance – – 8,074 – – – – – – – – – 8,074 Cash flows provided by financing activities – – (58,626) 10,500 – – 808,794 – – – – – 760,668 Cash flows provided by continuing ops ($66,714) $7,640 $29,922 ($30,402) ($107,288) ($11,955) ($87,090) ($9,802) ($6,691) ($18,521) ($51,397) ($47,394) ($399,690) Beginning Cash $468,532 $401,818 $409,459 $439,381 $408,979 $301,691 $289,736 $202,645 $192,844 $186,153 $167,632 $116,236 $468,532 Change in cash (66,714) 7,640 29,922 (30,402) (107,288) (11,955) (87,090) (9,802) (6,691) (18,521) (51,397) (47,394) (399,690) Ending Cash $401,818 $409,459 $439,381 $408,979 $301,691 $289,736 $202,645 $192,844 $186,153 $167,632 $116,236 $68,842 $68,842 |
|
|
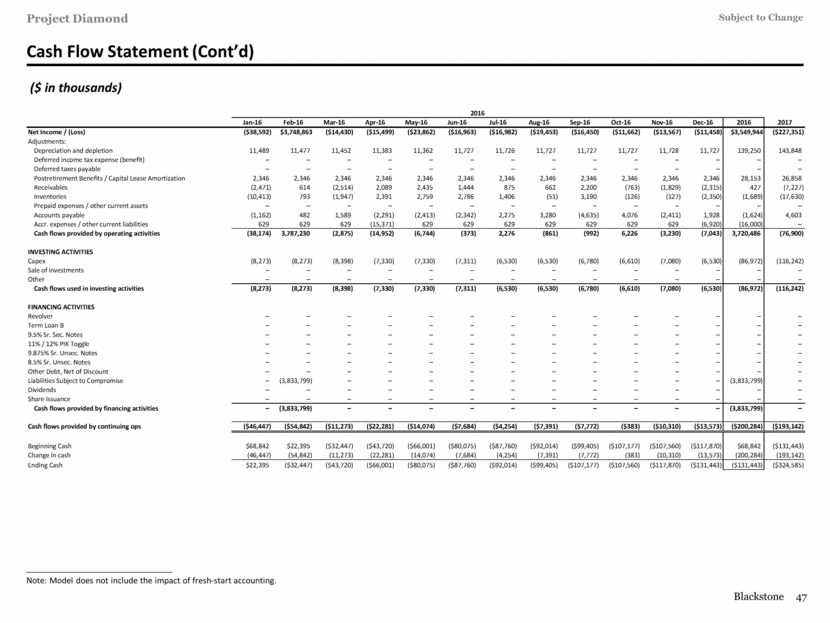
Cash Flow Statement (Cont’d) ($ in thousands) ________________________________________________ Note: Model does not include the impact of fresh-start accounting. 2016 Jan-16 Feb-16 Mar-16 Apr-16 May-16 Jun-16 Jul-16 Aug-16 Sep-16 Oct-16 Nov-16 Dec-16 2016 2017 Net Income / (Loss) ($38,592) $3,748,863 ($14,430) ($15,499) ($23,862) ($16,963) ($16,982) ($19,453) ($16,450) ($11,662) ($13,567) ($11,458) $3,549,944 ($227,351) Adjustments: Depreciation and depletion 11,489 11,477 11,452 11,383 11,362 11,727 11,726 11,727 11,727 11,727 11,728 11,727 139,250 143,848 Deferred income tax expense (benefit) – – – – – – – – – – – – – – Deferred taxes payable – – – – – – – – – – – – – – Postretirement Benefits / Capital Lease Amortization 2,346 2,346 2,346 2,346 2,346 2,346 2,346 2,346 2,346 2,346 2,346 2,346 28,153 26,858 Receivables (2,471) 614 (2,514) 2,089 2,435 1,444 875 662 2,200 (763) (1,829) (2,315) 427 (7,227) Inventories (10,413) 793 (1,947) 2,391 2,759 2,786 1,406 (51) 3,190 (126) (127) (2,350) (1,689) (17,630) Prepaid expenses / other current assets – – – – – – – – – – – – – – Accounts payable (1,162) 482 1,589 (2,291) (2,413) (2,342) 2,275 3,280 (4,635) 4,076 (2,411) 1,928 (1,624) 4,603 Accr. expenses / other current liabilities 629 629 629 (15,371) 629 629 629 629 629 629 629 (6,920) (16,000) – Cash flows provided by operating activities (38,174) 3,787,230 (2,875) (14,952) (6,744) (373) 2,276 (861) (992) 6,226 (3,230) (7,043) 3,720,486 (76,900) INVESTING ACTIVITIES Capex (8,273) (8,273) (8,398) (7,330) (7,330) (7,311) (6,530) (6,530) (6,780) (6,610) (7,080) (6,530) (86,972) (116,242) Sale of investments – – – – – – – – – – – – – – Other – – – – – – – – – – – – – – Cash flows used in investing activities (8,273) (8,273) (8,398) (7,330) (7,330) (7,311) (6,530) (6,530) (6,780) (6,610) (7,080) (6,530) (86,972) (116,242) FINANCING ACTIVITIES Revolver – – – – – – – – – – – – – – Term Loan B – – – – – – – – – – – – – – 9.5% Sr. Sec. Notes – – – – – – – – – – – – – – 11% / 12% PIK Toggle – – – – – – – – – – – – – – 9.875% Sr. Unsec. Notes – – – – – – – – – – – – – – 8.5% Sr. Unsec. Notes – – – – – – – – – – – – – – Other Debt, Net of Discount – – – – – – – – – – – – – – Liabilities Subject to Compromise – (3,833,799) – – – – – – – – – – (3,833,799) – Dividends – – – – – – – – – – – – – – Share Issuance – – – – – – – – – – – – – – Cash flows provided by financing activities – (3,833,799) – – – – – – – – – – (3,833,799) – Cash flows provided by continuing ops ($46,447) ($54,842) ($11,273) ($22,281) ($14,074) ($7,684) ($4,254) ($7,391) ($7,772) ($383) ($10,310) ($13,573) ($200,284) ($193,142) Beginning Cash $68,842 $22,395 ($32,447) ($43,720) ($66,001) ($80,075) ($87,760) ($92,014) ($99,405) ($107,177) ($107,560) ($117,870) $68,842 ($131,443) Change in cash (46,447) (54,842) (11,273) (22,281) (14,074) (7,684) (4,254) (7,391) (7,772) (383) (10,310) (13,573) (200,284) (193,142) Ending Cash $22,395 ($32,447) ($43,720) ($66,001) ($80,075) ($87,760) ($92,014) ($99,405) ($107,177) ($107,560) ($117,870) ($131,443) ($131,443) ($324,585) |
|
|
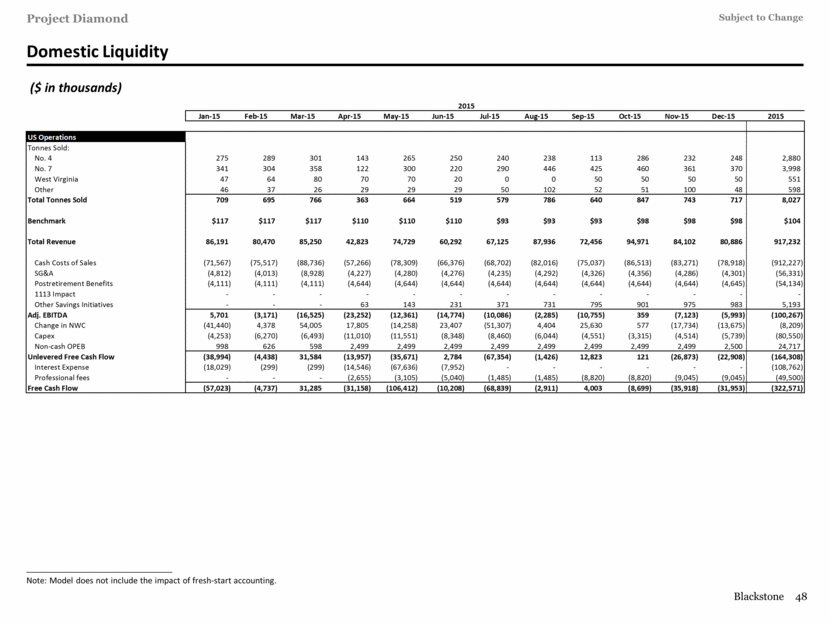
Domestic Liquidity ($ in thousands) ________________________________________________ Note: Model does not include the impact of fresh-start accounting. 2015 Jan-15 Feb-15 Mar-15 Apr-15 May-15 Jun-15 Jul-15 Aug-15 Sep-15 Oct-15 Nov-15 Dec-15 2015 US Operations Tonnes Sold: No. 4 275 289 301 143 265 250 240 238 113 286 232 248 2,880 No. 7 341 304 358 122 300 220 290 446 425 460 361 370 3,998 West Virginia 47 64 80 70 70 20 0 0 50 50 50 50 551 Other 46 37 26 29 29 29 50 102 52 51 100 48 598 Total Tonnes Sold 709 695 766 363 664 519 579 786 640 847 743 717 8,027 Benchmark $117 $117 $117 $110 $110 $110 $93 $93 $93 $98 $98 $98 $104 Total Revenue 86,191 80,470 85,250 42,823 74,729 60,292 67,125 87,936 72,456 94,971 84,102 80,886 917,232 Cash Costs of Sales (71,567) (75,517) (88,736) (57,266) (78,309) (66,376) (68,702) (82,016) (75,037) (86,513) (83,271) (78,918) (912,227) SG&A (4,812) (4,013) (8,928) (4,227) (4,280) (4,276) (4,235) (4,292) (4,326) (4,356) (4,286) (4,301) (56,331) Postretirement Benefits (4,111) (4,111) (4,111) (4,644) (4,644) (4,644) (4,644) (4,644) (4,644) (4,644) (4,644) (4,645) (54,134) 1113 Impact - - - - - - - - - - - - - Other Savings Initiatives - - - 63 143 231 371 731 795 901 975 983 5,193 Adj. EBITDA 5,701 (3,171) (16,525) (23,252) (12,361) (14,774) (10,086) (2,285) (10,755) 359 (7,123) (5,993) (100,267) Change in NWC (41,440) 4,378 54,005 17,805 (14,258) 23,407 (51,307) 4,404 25,630 577 (17,734) (13,675) (8,209) Capex (4,253) (6,270) (6,493) (11,010) (11,551) (8,348) (8,460) (6,044) (4,551) (3,315) (4,514) (5,739) (80,550) Non-cash OPEB 998 626 598 2,499 2,499 2,499 2,499 2,499 2,499 2,499 2,499 2,500 24,717 Unlevered Free Cash Flow (38,994) (4,438) 31,584 (13,957) (35,671) 2,784 (67,354) (1,426) 12,823 121 (26,873) (22,908) (164,308) Interest Expense (18,029) (299) (299) (14,546) (67,636) (7,952) - - - - - - (108,762) Professional fees - - - (2,655) (3,105) (5,040) (1,485) (1,485) (8,820) (8,820) (9,045) (9,045) (49,500) Free Cash Flow (57,023) (4,737) 31,285 (31,158) (106,412) (10,208) (68,839) (2,911) 4,003 (8,699) (35,918) (31,953) (322,571) |
|
|
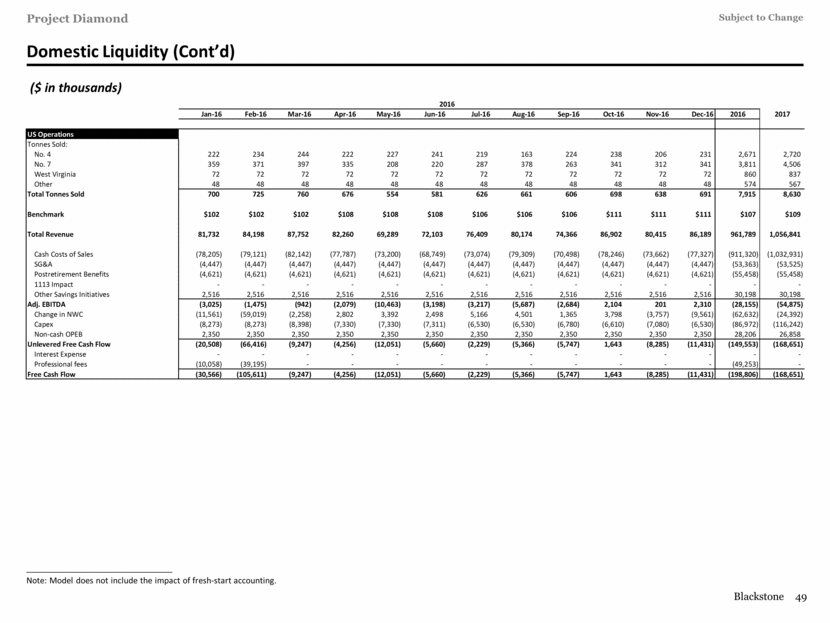
Domestic Liquidity (Cont’d) ($ in thousands) ________________________________________________ Note: Model does not include the impact of fresh-start accounting. 2016 Jan-16 Feb-16 Mar-16 Apr-16 May-16 Jun-16 Jul-16 Aug-16 Sep-16 Oct-16 Nov-16 Dec-16 2016 2017 US Operations Tonnes Sold: No. 4 222 234 244 222 227 241 219 163 224 238 206 231 2,671 2,720 No. 7 359 371 397 335 208 220 287 378 263 341 312 341 3,811 4,506 West Virginia 72 72 72 72 72 72 72 72 72 72 72 72 860 837 Other 48 48 48 48 48 48 48 48 48 48 48 48 574 567 Total Tonnes Sold 700 725 760 676 554 581 626 661 606 698 638 691 7,915 8,630 Benchmark $102 $102 $102 $108 $108 $108 $106 $106 $106 $111 $111 $111 $107 $109 Total Revenue 81,732 84,198 87,752 82,260 69,289 72,103 76,409 80,174 74,366 86,902 80,415 86,189 961,789 1,056,841 Cash Costs of Sales (78,205) (79,121) (82,142) (77,787) (73,200) (68,749) (73,074) (79,309) (70,498) (78,246) (73,662) (77,327) (911,320) (1,032,931) SG&A (4,447) (4,447) (4,447) (4,447) (4,447) (4,447) (4,447) (4,447) (4,447) (4,447) (4,447) (4,447) (53,363) (53,525) Postretirement Benefits (4,621) (4,621) (4,621) (4,621) (4,621) (4,621) (4,621) (4,621) (4,621) (4,621) (4,621) (4,621) (55,458) (55,458) 1113 Impact - - - - - - - - - - - - - - Other Savings Initiatives 2,516 2,516 2,516 2,516 2,516 2,516 2,516 2,516 2,516 2,516 2,516 2,516 30,198 30,198 Adj. EBITDA (3,025) (1,475) (942) (2,079) (10,463) (3,198) (3,217) (5,687) (2,684) 2,104 201 2,310 (28,155) (54,875) Change in NWC (11,561) (59,019) (2,258) 2,802 3,392 2,498 5,166 4,501 1,365 3,798 (3,757) (9,561) (62,632) (24,392) Capex (8,273) (8,273) (8,398) (7,330) (7,330) (7,311) (6,530) (6,530) (6,780) (6,610) (7,080) (6,530) (86,972) (116,242) Non-cash OPEB 2,350 2,350 2,350 2,350 2,350 2,350 2,350 2,350 2,350 2,350 2,350 2,350 28,206 26,858 Unlevered Free Cash Flow (20,508) (66,416) (9,247) (4,256) (12,051) (5,660) (2,229) (5,366) (5,747) 1,643 (8,285) (11,431) (149,553) (168,651) Interest Expense - - - - - - - - - - - - - - Professional fees (10,058) (39,195) - - - - - - - - - - (49,253) - Free Cash Flow (30,566) (105,611) (9,247) (4,256) (12,051) (5,660) (2,229) (5,366) (5,747) 1,643 (8,285) (11,431) (198,806) (168,651) |
|
|
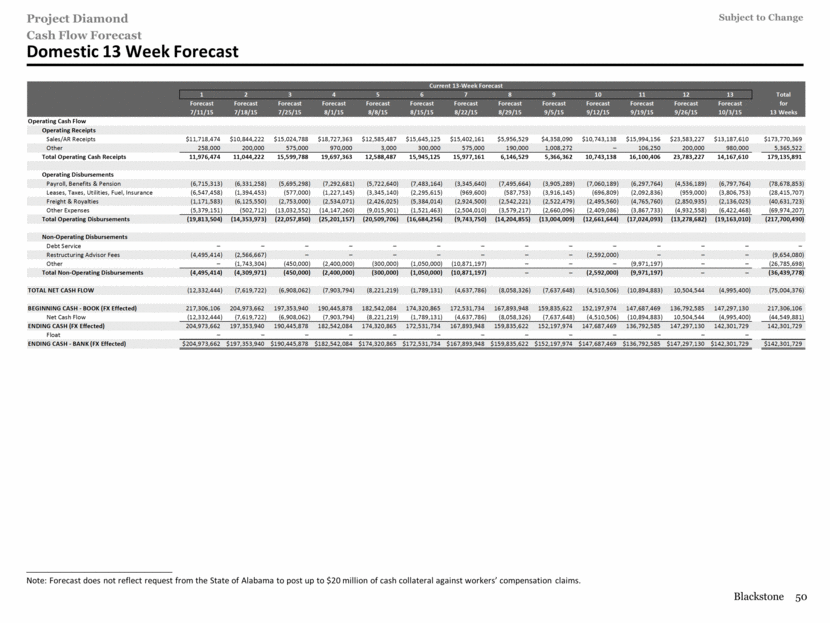
Domestic 13 Week Forecast Cash Flow Forecast ________________________________________________ Note: Forecast does not reflect request from the State of Alabama to post up to $20 million of cash collateral against workers’ compensation claims. Current 13-Week Forecast 1 2 3 4 5 6 7 8 9 10 11 12 13 Total Forecast Forecast Forecast Forecast Forecast Forecast Forecast Forecast Forecast Forecast Forecast Forecast Forecast for 7/11/15 7/18/15 7/25/15 8/1/15 8/8/15 8/15/15 8/22/15 8/29/15 9/5/15 9/12/15 9/19/15 9/26/15 10/3/15 13 Weeks Operating Cash Flow Operating Receipts Sales/AR Receipts $11,718,474 $10,844,222 $15,024,788 $18,727,363 $12,585,487 $15,645,125 $15,402,161 $5,956,529 $4,358,090 $10,743,138 $15,994,156 $23,583,227 $13,187,610 $173,770,369 Other 258,000 200,000 575,000 970,000 3,000 300,000 575,000 190,000 1,008,272 – 106,250 200,000 980,000 5,365,522 Total Operating Cash Receipts 11,976,474 11,044,222 15,599,788 19,697,363 12,588,487 15,945,125 15,977,161 6,146,529 5,366,362 10,743,138 16,100,406 23,783,227 14,167,610 179,135,891 Operating Disbursements Payroll, Benefits & Pension (6,715,313) (6,331,258) (5,695,298) (7,292,681) (5,722,640) (7,483,164) (3,345,640) (7,495,664) (3,905,289) (7,060,189) (6,297,764) (4,536,189) (6,797,764) (78,678,853) Leases, Taxes, Utilities, Fuel, Insurance (6,547,458) (1,394,453) (577,000) (1,227,145) (3,345,140) (2,295,615) (969,600) (587,753) (3,916,145) (696,809) (2,092,836) (959,000) (3,806,753) (28,415,707) Freight & Royalties (1,171,583) (6,125,550) (2,753,000) (2,534,071) (2,426,025) (5,384,014) (2,924,500) (2,542,221) (2,522,479) (2,495,560) (4,765,760) (2,850,935) (2,136,025) (40,631,723) Other Expenses (5,379,151) (502,712) (13,032,552) (14,147,260) (9,015,901) (1,521,463) (2,504,010) (3,579,217) (2,660,096) (2,409,086) (3,867,733) (4,932,558) (6,422,468) (69,974,207) Total Operating Disbursements (19,813,504) (14,353,973) (22,057,850) (25,201,157) (20,509,706) (16,684,256) (9,743,750) (14,204,855) (13,004,009) (12,661,644) (17,024,093) (13,278,682) (19,163,010) (217,700,490) Non-Operating Disbursements Debt Service – – – – – – – – – – – – – – Restructuring Advisor Fees (4,495,414) (2,566,667) – – – – – – – (2,592,000) – – – (9,654,080) Other – (1,743,304) (450,000) (2,400,000) (300,000) (1,050,000) (10,871,197) – – – (9,971,197) – – (26,785,698) Total Non-Operating Disbursements (4,495,414) (4,309,971) (450,000) (2,400,000) (300,000) (1,050,000) (10,871,197) – – (2,592,000) (9,971,197) – – (36,439,778) TOTAL NET CASH FLOW (12,332,444) (7,619,722) (6,908,062) (7,903,794) (8,221,219) (1,789,131) (4,637,786) (8,058,326) (7,637,648) (4,510,506) (10,894,883) 10,504,544 (4,995,400) (75,004,376) BEGINNING CASH - BOOK (FX Effected) 217,306,106 204,973,662 197,353,940 190,445,878 182,542,084 174,320,865 172,531,734 167,893,948 159,835,622 152,197,974 147,687,469 136,792,585 147,297,130 217,306,106 Net Cash Flow (12,332,444) (7,619,722) (6,908,062) (7,903,794) (8,221,219) (1,789,131) (4,637,786) (8,058,326) (7,637,648) (4,510,506) (10,894,883) 10,504,544 (4,995,400) (44,549,881) ENDING CASH (FX Effected) 204,973,662 197,353,940 190,445,878 182,542,084 174,320,865 172,531,734 167,893,948 159,835,622 152,197,974 147,687,469 136,792,585 147,297,130 142,301,729 142,301,729 Float – – – – – – – – – – – – – ENDING CASH - BANK (FX Effected) $204,973,662 $197,353,940 $190,445,878 $182,542,084 $174,320,865 $172,531,734 $167,893,948 $159,835,622 $152,197,974 $147,687,469 $136,792,585 $147,297,130 $142,301,729 $142,301,729 |
|
|
SG&A Estimates |

|
|
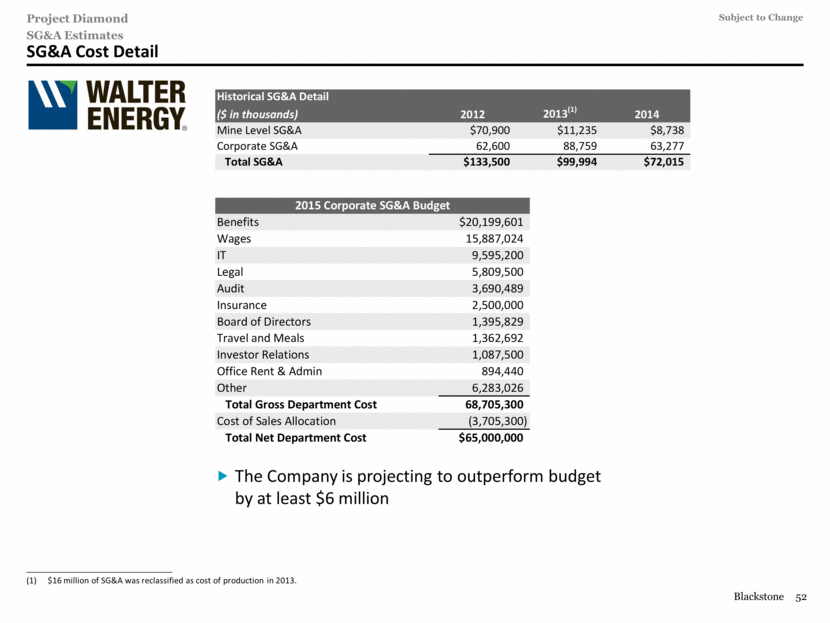
SG&A Cost Detail SG&A Estimates (1) The Company is projecting to outperform budget by at least $6 million ________________________________________________ $16 million of SG&A was reclassified as cost of production in 2013. 2015 Corporate SG&A Budget Benefits $20,199,601 Wages 15,887,024 IT 9,595,200 Legal 5,809,500 Audit 3,690,489 Insurance 2,500,000 Board of Directors 1,395,829 Travel and Meals 1,362,692 Investor Relations 1,087,500 Office Rent & Admin 894,440 Other 6,283,026 Total Gross Department Cost 68,705,300 Cost of Sales Allocation (3,705,300) Total Net Department Cost $65,000,000 Historical SG&A Detail ($ in thousands) 2012 2013 (1) 2014 Mine Level SG&A $70,900 $11,235 $8,738 Corporate SG&A 62,600 88,759 63,277 Total SG&A $133,500 $99,994 $72,015 |
|
|
Canadian Equipment Detail |
|
|
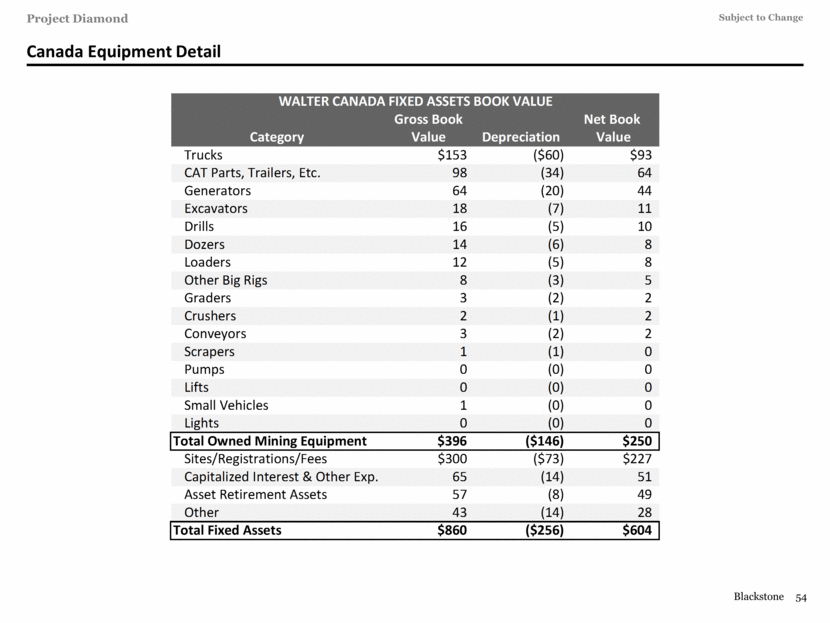
Canada Equipment Detail WALTER CANADA FIXED ASSETS BOOK VALUE Gross Book Net Book Category Value Depreciation Value Trucks $153 ($60) $93 CAT Parts, Trailers, Etc. 98 (34) 64 Generators 64 (20) 44 Excavators 18 (7) 11 Drills 16 (5) 10 Dozers 14 (6) 8 Loaders 12 (5) 8 Other Big Rigs 8 (3) 5 Graders 3 (2) 2 Crushers 2 (1) 2 Conveyors 3 (2) 2 Scrapers 1 (1) 0 Pumps 0 (0) 0 Lifts 0 (0) 0 Small Vehicles 1 (0) 0 Lights 0 (0) 0 Total Owned Mining Equipment $396 ($146) $250 Sites/Registrations/Fees $300 ($73) $227 Capitalized Interest & Other Exp. 65 (14) 51 Asset Retirement Assets 57 (8) 49 Other 43 (14) 28 Total Fixed Assets $860 ($256) $604 |
|
|
Walter Coke |

|
|
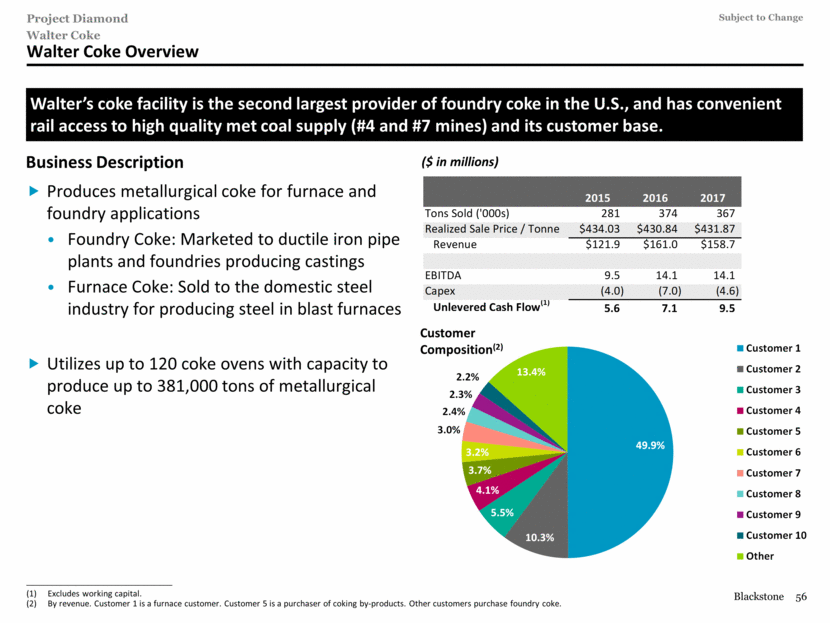
Walter Coke Overview Walter’s coke facility is the second largest provider of foundry coke in the U.S., and has convenient rail access to high quality met coal supply (#4 and #7 mines) and its customer base. Business Description Produces metallurgical coke for furnace and foundry applications Foundry Coke: Marketed to ductile iron pipe plants and foundries producing castings Furnace Coke: Sold to the domestic steel industry for producing steel in blast furnaces Utilizes up to 120 coke ovens with capacity to produce up to 381,000 tons of metallurgical coke Walter Coke ($ in millions) ________________________________________________ Excludes working capital. By revenue. Customer 1 is a furnace customer. Customer 5 is a purchaser of coking by-products. Other customers purchase foundry coke. Customer Composition(2) 49.9% 10.3% 5.5% 4.1% 3.7% 3.2% 3.0% 2.4% 2.3% 2.2% 13.4% Customer 1 Customer 2 Customer 3 Customer 4 Customer 5 Customer 6 Customer 7 Customer 8 Customer 9 Customer 10 Other 2015 2016 2017 Tons Sold ('000s) 281 374 367 Realized Sale Price / Tonne $434.03 $430.84 $431.87 Revenue $121.9 $161.0 $158.7 EBITDA 9.5 14.1 14.1 Capex (4.0) (7.0) (4.6) Unlevered Cash Flow (1) 5.6 7.1 9.5 |
|
|
Mine Plans |

|
|
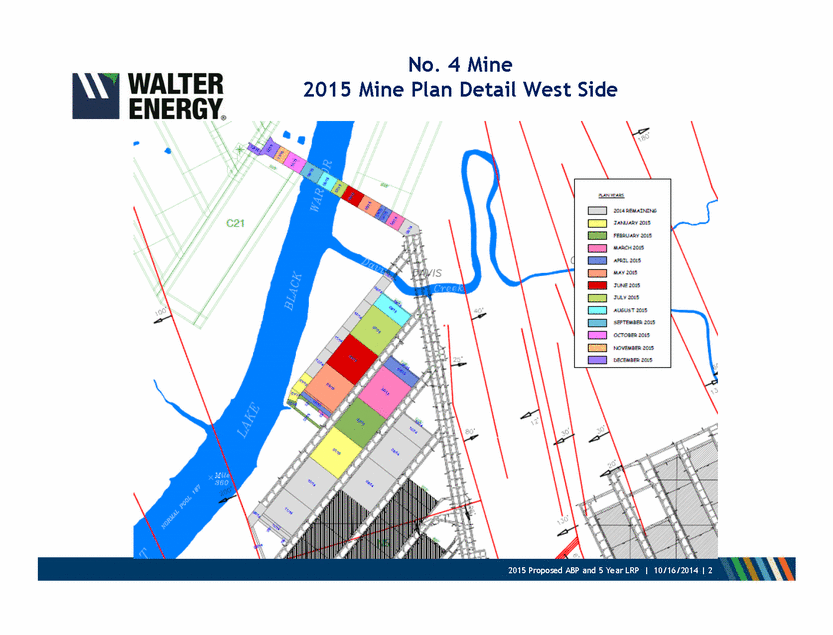
No. 4 Mine WALTER ENERGY® 2015 Mine Plan Detail West Side CJ 2:1L•f«MAlN!Nri CJ JAhl.IM"' 2015 CJ FEBU...,..101S CJ MAACJotlCH!i c::::J APIUL Ct5 Cl MAY2'0J3 -.J\Jtt.E2C1!i Cl JUL• ZOl5 CJ AU6U!iTl:Ol5 Cl :S!a'lBI.iE!I all3 CJ OCTOBE!I IS CJ N.7\'EMBEIIZOI!i |
|
|
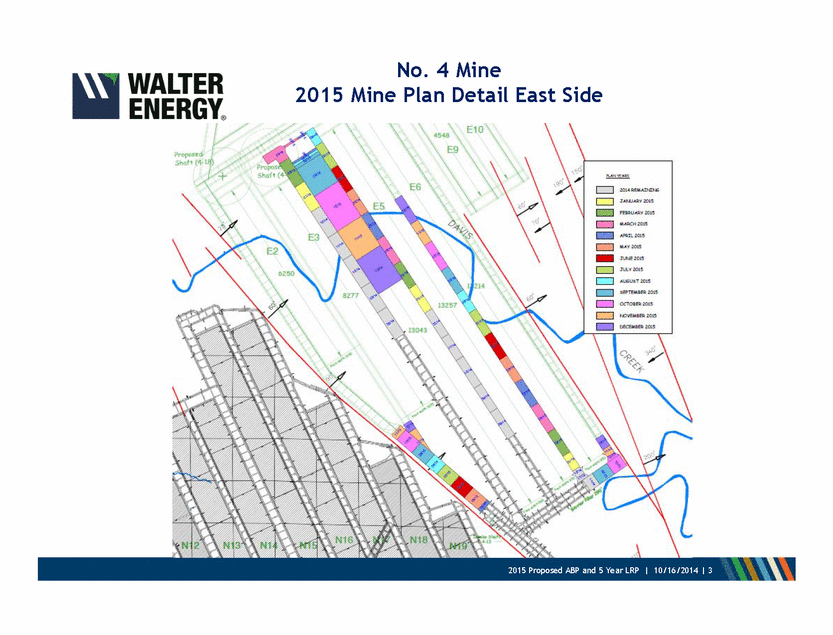
No. 4 Mine 2015 Mine Plan DetailEast WALTER ENERGY® Side c:::::::J JIA.y lOI.S c:::::::J ..,. c:::::::J JANJAftY 2015 c:::J FEiQU.-.Q2; 0t!l c:::::::J ...A<all015 c::J AHW.:!Ot5 c:::::::J ..All)J5 -.n.NEIOI5 c:::::::J A U60kZ>C!15 c:::J :scJITEMEIHt zat c:::::::J OCTOBEJI IOI.S |
|
|
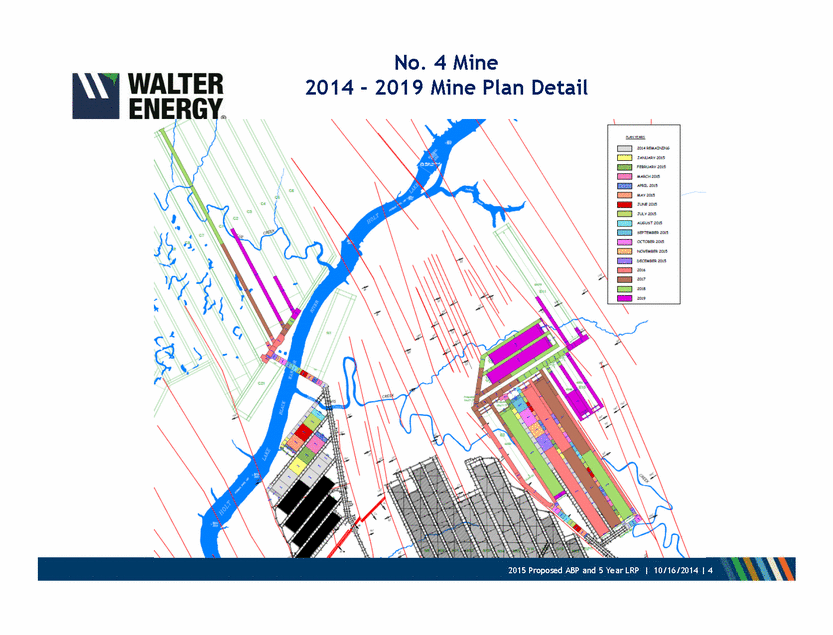
No.4 Mine 2014-2019 Mine Plan Detail WALTER EN -"J\"J.".Y"lO"'B" A CJ XlioiRQI c::J .1ANJAAV 201 c::::J FEI:tll.ollO!.J c::::J MAAOI o:l!i [::J AI'Cin. MiS c::::J MAY la.J c:::J UWST ZOl5 [:::::J SB'TlMI zau. c::::J OCO<MR lOIS |
|
|
No. 7 Mine East WALTER ENERGY® 2015 Mine Plan Detail c:::::::::J JUlY 201 I '·. 10/1612014 I 2 2015 Proposed ABP and 5 Year LRP [_J 201•RFMAININ!i CJ JANUARY 2015 - FEBRUARY 2015 - MARa-i Z015 - APIUl201' - MAY2015 - JUN€2015 - AUGVST2015 - OCTOBER 2015 Cl NOVEMBER 2015 - DEC!'M9ER 2015 |

|
|
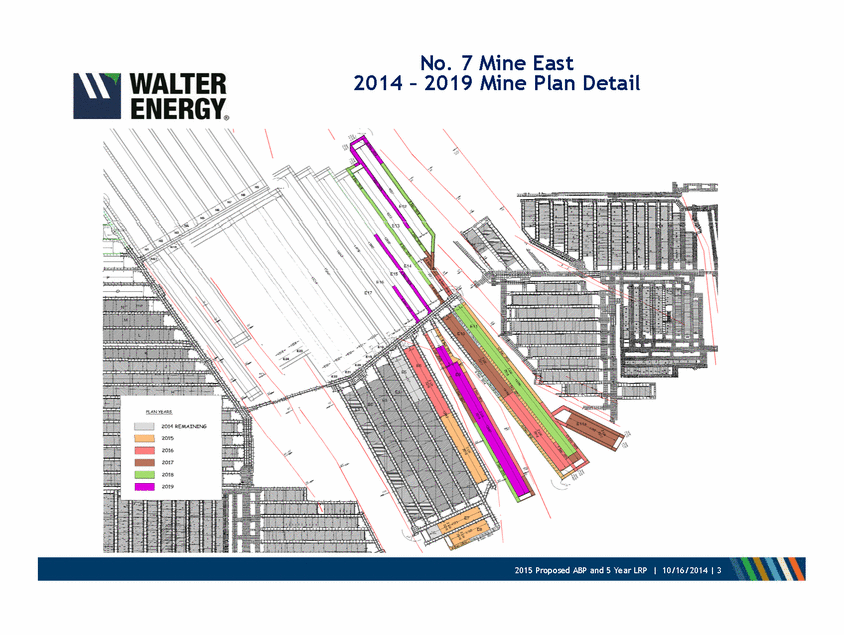
No. 7 Mine East WALTER ENERGY® 2014-2019 Mine Plan Detail c::::::::J ZOH EMAINING c::::::::J Z0\5 ZOI6 - 2017 - 2018 I '\. 10/1612014 I 3 2015 Proposed ABP and 5 Year LRP |
|
|
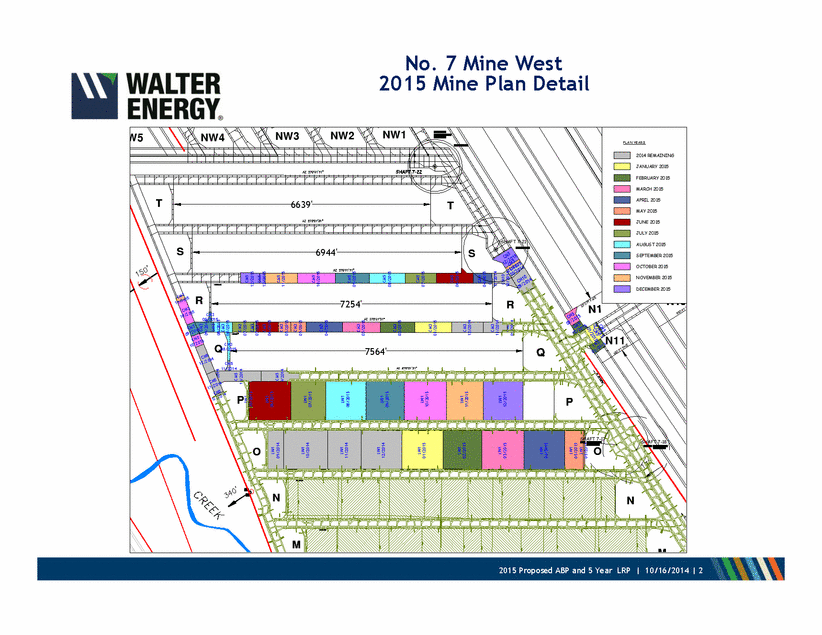
No. 7 Mine West WALTER ENERGY® 2015 Mine Plan Detail r=J MAY2015 r=J JULY2015 >. 10/16/2014 I 2 2015 Proposed ABP and 5 Year LRP r=J 2014 I'EMAININ5 r=J JANUARY 2015 - FEBRUARY2015 r=J MARC><2015 - Af'OIL2015 - JUNE2015 r=J AUru5T2015 c::::J Se>TEMBER 2015 r=J OCTOBER2015 r=J NOVEMBER 2015 |
|
|
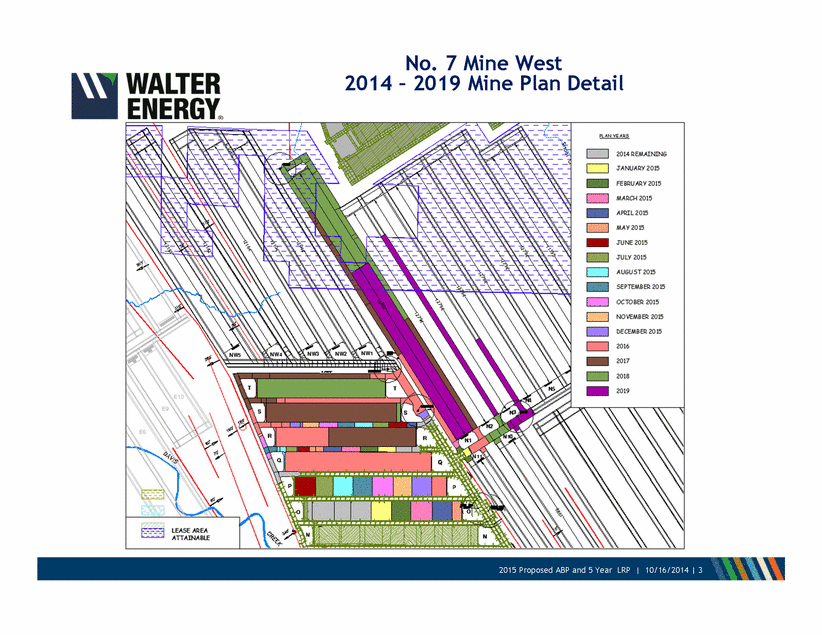
No. 7 Mine West WALTER ENERGY 2014-2019 Mine Plan Detail c=J 2014 REMAINING FEBRUARY 2015 c=J MAR<J.l2015 -MAY2015 APRIL2015 c-=J 2016 2017 2019 LEASE AREA ATTAINABlE 14 1 3 '· -:.. 10/16120 2015 Proposed ABP and 5Year LRP PlAN YEARS c-=J JANlMRY 2015 c=J JUNE2015 c=J JULY 2015 c=J AUGUST2015 SEPTEMBER 2015 r=J OClOBER 2015 c=J NOVEMBER 2015 c=J I>ECEMBER 2015 c-=J 2018 |