Attached files
| file | filename |
|---|---|
| 8-K - 8-K - Bluerock Residential Growth REIT, Inc. | v415531_8k.htm |
Exhibit 99.1
July 15, 2015

Forward - Looking Statements - 2 - The information in this presentation has been prepared solely for informational purposes by Bluerock Residential Growth REIT, Inc . (“BRG”) and does not constitute an offer to sell or the solicitation of an offer to purchase any securities . This presentation is not, and should not be assumed to be, complete . This presentation has been prepared to assist interested parties in making their own evaluation of BRG and does not purport to contain all of the information that may be relevant . In all cases, interested parties should conduct their own investigation and analysis of BRG and the data set forth in this presentation and other information provided by or on behalf of BRG . In addition, certain of the information contained herein may be derived from information provided by industry sources . BRG believes that such information is accurate and that the sources from which it has been obtained are reliable . BRG cannot guarantee the accuracy of such information, however, and has not independently verified such information . The information presented herein remains subject to change . Statements in this presentation are made as of the date of this presentation unless stated otherwise . This presentation also contains statements that, to the extent they are not recitations of historical fact, constitute “forward - looking statements . ” Forward - looking statements are typically identified by the use of terms such as “may,” “should,” “expect,” “could,” “intend,” “plan,” “anticipate,” “estimate,” “believe,” “continue,” “predict,” “potential” or the negative of such terms and other comparable terminology . The forward - looking statements included herein are based upon BRG’s current expectations, plans, estimates, assumptions and beliefs that involve numerous risks and uncertainties . Assumptions relating to the foregoing involve judgments with respect to, among other things, future economic, competitive and market conditions and future business decisions, all of which are difficult or impossible to predict accurately and many of which are beyond BRG’s control . Although BRG believes that the expectations reflected in such forward - looking statements are based on reasonable assumptions, BRG’s actual results and performance and the value of its securities could differ materially from those set forth in the forward - looking statements due to the impact of many factors including, but not limited to, the uncertainties of real estate development, acquisition and disposition activity, the ability of our joint venture partners to satisfy their obligations, the costs and availability of financing, the effects of local economic and market conditions, the effects of acquisitions and dispositions, the impact of newly adopted accounting principles on BRG’s accounting policies and on period - to - period comparisons of financial results, regulatory changes and other risks and uncertainties detailed in the “Risk Factors” in Item 1 . A . Risk Factors section of the Company’s Annual Report on Form 10 - K filed with the U . S . Securities and Exchange Commission on March 4 , 2015 , and other discussions of risk factors contained in BRG’s periodic filings . BRG claims the safe harbor protection for forward looking statements contained in the Private Securities Litigation Reform Act of 1995 . BRG undertakes no obligation to update or revise any such information for any reason after the date of this presentation, unless required by law .

- 3 - Company Highlights ▪ Differentiated Value Creation Strategy » Building a Class A portfolio in growth m arkets » Executing as ‘ l ocal s harpshooter’ with leading regional partners » Creating value at asset l evel ▪ Deep, Experienced Management Team ▪ Young and Productive Class A Portfolio, plus Robust Accretive Pipeline ▪ Attractive Metrics Relative to Peers » Trading at an 24% discount to net asset value (NAV) (1) » 9.3% dividend yield supported by portfolio (2) Fox Hill, Austin Resort - Style Pool, Lansbrook, Tampa Sky Deck, MDA Apartments, Chicago ( 1 ) See disclosure on slide 12 related to NAV estimates ( 2 ) Dividend yield as of 7/10/15 close Notes - 3 -

Management Team with 25 - 30 Years Experience Ramin Kamfar Chairman, CEO & President of BRG James G. Babb, III Chief Investment Officer of BRGM Jordan Ruddy President of BRGM Gary Kachadurian Vice Chairman of BRGM Director - Chair of Investment Committee ▪ Co - Founder of Bluerock Real Estate – 2002 ▪ Acquisition of close to 10,000 apartment units and 2.5 million square feet of office space ▪ 25 years in real estate, private equity, investment banking ▪ Previously, Lehman Brothers ▪ 25 years experience in real estate ▪ Previously, Starwood Capital – Founding Member; Co - Managed Starwood Multifamily and Office effort for 12 years ▪ Involved in creation of Equity Residential; Starwood Hotels; iStar Financial ▪ Co - Founder of Bluerock Real Estate – 2002 ▪ 25 years experience in real estate, capital markets ▪ Previously, Bank of America, JP Morgan Chase, Smith Barney ▪ 34 years experience in real estate ▪ Previously, RREEF / Deutsche Bank – Head of National Acquisitions and Multifamily Value - Add & Development Groups; Member of Investment and Policy Committees ▪ Previously, Lincoln Property Company – Partner, Chairman - NMHC - 4 - “BRGM” refers to BRG Manager, LLC Notes

Current/LOI Property Target Market 4.6% 3.6% 3.6% 3.5% 3.4% 3.4% 3.3% 2.9% 2.7% 2.6% 2.5% 1.9% 0.0% 1.0% 2.0% 3.0% 4.0% 5.0% ▪ Targeting Class A assets generally built post - 2000 » Modern and efficient structures and layouts » Highly amenitized environment » Lifestyle product – a place to live, interact, socialize » One of youngest portfolios, among highest average rents in our markets Source: Bureau of Labor Statistics Statistics for the Year Ended March 31, 2015 ▪ Targeting markets with long t erm e mployment g rowth d rivers » Target industries include healthcare , education, technology, finance, trade, entertainment, energy » Younger / more educated demographic with higher disposable income » High quality of life markets drive demand and retention Selected Bluerock Target MSAs – Employment Growth Alexan CityCentre Targeting attractive, growing renter by choice demographic Building a Class A Portfolio in Growth Markets - 5 - Rendering

Strategic Partner Network Enables best in class sourcing and execution across multiple markets / strategies Extensive Experience – 200,000+ Total Units Under Management ▪ Partner Network includes some of largest leading owner / operators nationally » Deep, localized expertise and track record of success » Best - in - class infrastructure with proven ability to execute » Capital to invest alongside ▪ Partner Network provides significant, often off - market, deal flow » 2014 Strategic Partner transaction activity of $3 billion ▪ Partner Network unique to BRG » Longstanding relationships » BRG delivers value by deal sourcing, strategic asset management, lack of property management conflict - 6 -

BRG Creates Value ▪ Acquire properties primarily through off - market and relationship transactions » Discount purchase of complex assets such as fractured condos or ‘broken capital structure’ as opportunity to create value ▪ Target assets with high NOI growth potential » Create value through re - tenanting, repositioning, renovation or redevelopment ▪ Selectively invest in development deals with significant value creation » Structured as Convertible Preferred Equity to generate income during development; convertible into ownership at BRG option upon stabilization ▪ Active recycling of capital through asset sales when redeployment is accretive Focus on discount purchase of complex deals or post acquisition value - add Recent Dispositions Asset Location Units Deal Type Cost (M) Sale Price (M) IRR (1) Equity Multiple 23Hundred@Berry Hill Nashville, TN 266 Development $34 $61 60% 2.8x Grove at Waterford Hendersonville, TN 252 Value - Add $30 $38 85% 1.6x Estates at Perimeter Augusta, GA 240 Stabilized $25 $26 6% 1.2x Creekside Chattanooga, TN 192 Value - Add $14 $19 29% 2.5x Weighted Average 53% 2.2x - 7 - (1) IRR and equity multiple calculated on BRG’s investment Notes

Q1 2014 Q2 2014 Q3 2014 Q4 2014 Q1 2015 Q2 - Pro Forma (1) Revenues (in millions) $3.3 $7.8 $9.6 $9.8 $9.0 $11.3 - $11.6 Average Occupancy 91.6% 93.4% 95.5% 95.2% 94.2% - Same Store NOI Growth (YoY) (9.4%) 7.6% 5.7% 13.8% 19.2% - G&A / Revenues 15.8% 5.1% 4.6% 3.5% 5.1% 3.7% - 3.6% AFFO per Share ($0.48) $0.13 $0.22 $0.19 $0.13 / $0.29 (2) $0.26 - $0.28 I P O G U I D A N C E 2.4% 2.4% 2.1% 0.9% 0.6% 2.4% 0.8% 1.1% 1.1% 2.3% 0.0% 1.0% 2.0% 3.0% 4.0% 5.0% 6.0% 7.0% 8.0% 9.0% Lansbrook Village Alexan CityCentre UCF Orlando Enders Place ARIUM Grandewood Alexan Blaire House Park & Kingston Fox Hill Whetstone Cheshire Bridge Strength in Operational and Acquisition Metrics - 8 - (1) For a reconciliation to GAAP measures and a discussion of pro forma assumptions, see BRG’s Q1 2015, Q4 2014, Q3 2014 and Q2 2014 Earnings Supplements and BRG’s 10 - Q for the quarter ended March 31, 2015 (2) Q1 2015 Pro Forma AFFO per share of $0.29 (3) Based on sales of comparable assets; Management estimates Notes ▪ Demonstrating strength in operational results Post IPO Acquisitions: consistently generating spread between stabilized cap rate and market cap rate (3)

Current Portfolio (1) - 9 - (1) Based on information as of March 31, 2015 unless otherwise noted (2) MDA was built in 1929 as an office building and underwent a gut rehabilitation in 2006 (3) This property is under development. Rent figures are projected or reflect current leasing estimates (4) EOS leasing began April, 2015, rental rate based on budget (5) Phase II (15 units) to be acquired at c/o; estimated 4Q 2015 (6) Pro Forma includes Alexan Southside, Alexan CityCentre , Whetstone, Cheshire Bridge and EOS projected units and rents; occupancy excludes properties under development or lease - up (7) Monthly rent excludes cable and garage income (8) Total includes pipeline properties and projected rents / units for development properties; occupancy excludes properties unde r d evelopment or lease - up Notes Property Name Location Units Year Built / Renovated Monthly Rent Occupancy Sourcing MDA Apartments Chicago, IL 190 2006 (2) $2,231 95% off-market Alexan CityCentre (3) Houston, TX 340 2017 2,144 - off-market Alexan Southside (3) Houston, TX 270 2017 2,019 - off-market Cheshire Bridge (3) Atlanta, GA 285 2017 1,559 - off-market Enders Place at Baldwin Park Orlando, FL 220 2003 1,521 95% relationship Whetstone Durham, NC 204 2015 1,325 Lease-Up off-market EOS (Formerly: "UCF Orlando") (4) Orlando, FL 296 2015 1,211 Lease-Up off-market Park & Kingston (5) Charlotte, NC 153 2014 1,184 91% relationship Fox Hill Austin, TX 288 2010 1,110 98% relationship ARIUM Grandewood Orlando, FL 306 2005 1,130 96% off-market Lansbrook Village Palm Harbor, FL 595 1998-2004 1,122 93% auction/relat. Village Green Ann Arbor, MI 520 1989-1992 / 2013 1,120 93% off-market North Park Towers Southfield, MI 313 1967/2000 1,044 95% relationship Springhouse at Newport News Newport News, VA 432 1985 830 92% off-market Villas at Oak Crest Chattanooga, TN 209 1985, 1999 806 98% relationship 3,226 $1,150 94% 4,621 $1,311 94% Letter of Intent - San Marco (3) Jacksonville, FL 276 2017 $1,580 - relationship Letter of Intent - Raleigh Property (3) Raleigh, NC 242 2016/17 1,400 - off-market Letter of Intent - Dallas Portfolio Dallas, TX 674 2015 1,310 Lease-Up off-market Under Contract - Ashton II Charlotte, NC 151 2015 1,200 Lease-Up off-market Under Contract - Ashton I Charlotte, NC 322 2012 1,166 92% off-market Under Contract - Century Palms (7) Orlando, FL 252 2007 1,080 94% off-market 1,917 $1,297 93% 6,538 $1,307 94% Sub-Total (Current) Sub-Total (Pro Forma) (6) Sub-Total (Pipeline) Total (8)

$1,439 $1,307 $1,296 $1,264 $1,150 $955 $902 PPS AEC CPT BRG MAA Portfolio Occupancy Same Store NOI Growth Weighted Average Age (1) Average Rent per Unit (2) 19.2% 9.0% 5.8% 3.7% 2.8% 1.2% N/A % 5% 10% 15% 20% BRG TSRE MAA CPT AEC PPS IRT One of the youngest, most productive among peers Portfolio Comparison (as of Q1 2015) IRT/TSRE (pro forma) IRT/TSRE (pro forma) 14 14 16 16 17 20 5 10 15 20 25 BRG CPT PPS AEC MAA IRT/TSRE (pro forma) BRG (pro forma) - 10 - (1) Weighted on number of units; BRG average asset age uses major renovation dates at North Park Towers and MDA Apartments (2) BRG (pro forma) includes expected rent for the three development properties Note: IRT/TSRE (pro forma) reflects estimated Q1 2015 metrics following IRT’s acquisition of TSRE Notes 96.3% 96.0% 94.9% 94.5% 94.2% 91.8% 90% 92% 94% 96% 98% MAA CPT PPS BRG AEC
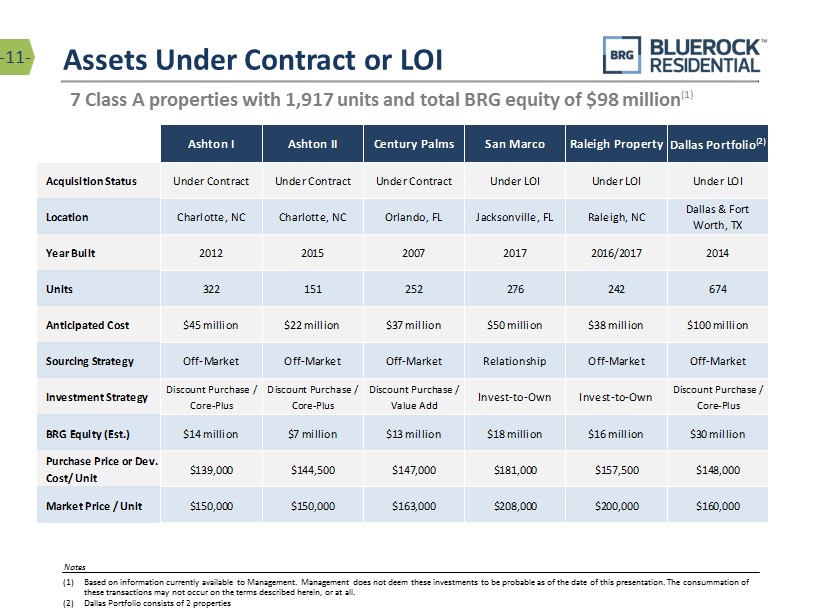
Ashton I Ashton II Century Palms San Marco Raleigh Property Dallas Portfolio (2) Acquisition Status Under Contract Under Contract Under Contract Under LOI Under LOI Under LOI Location Charlotte, NC Charlotte, NC Orlando, FL Jacksonville, FL Raleigh, NC Dallas & Fort Worth, TX Year Built 2012 2015 2007 2017 2016/2017 2014 Units 322 151 252 276 242 674 Anticipated Cost $45 million $22 million $37 million $50 million $38 million $100 million Sourcing Strategy Off-Market Off-Market Off-Market Relationship Off-Market Off-Market Investment Strategy Discount Purchase / Core-Plus Discount Purchase / Core-Plus Discount Purchase / Value Add Invest-to-Own Invest-to-Own Discount Purchase / Core-Plus BRG Equity (Est.) $14 million $7 million $13 million $18 million $16 million $30 million Purchase Price or Dev. Cost/ Unit $139,000 $144,500 $147,000 $181,000 $157,500 $148,000 Market Price / Unit $150,000 $150,000 $163,000 $208,000 $200,000 $160,000 7 Class A properties with 1,917 units and total BRG equity of $98 million (1) Assets Under Contract or LOI - 11 - (1) Based on information currently available to Management. Management does not deem these investments to be probable as of the date of th is presentation. The consummation of these transactions may not occur on the terms described herein, or at all . (2) Dallas Portfolio consists of 2 properties Notes
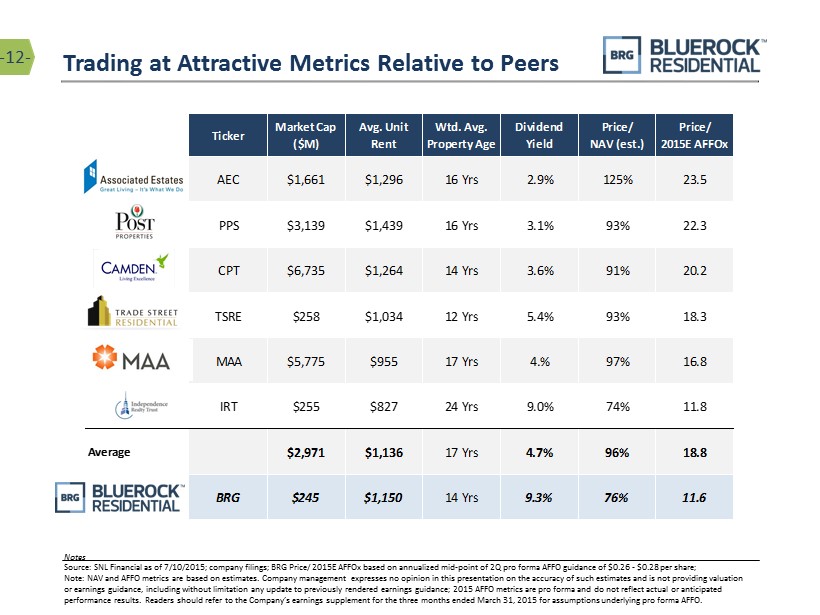
Ticker Market Cap ($M) Avg. Unit Rent Wtd. Avg. Property Age Dividend Yield Price/ NAV (est.) Price/ 2015E AFFOx AEC $1,661 $1,296 16 Yrs 2.9% 125% 23.5 PPS $3,139 $1,439 16 Yrs 3.1% 93% 22.3 CPT $6,735 $1,264 14 Yrs 3.6% 91% 20.2 TSRE $258 $1,034 12 Yrs 5.4% 93% 18.3 MAA $5,775 $955 17 Yrs 4.% 97% 16.8 IRT $255 $827 24 Yrs 9.0% 74% 11.8 Average $2,971 $1,136 17 Yrs 4.7% 96% 18.8 BRG $245 $1,150 14 Yrs 9.3% 76% 11.6 Trading at Attractive Metrics Relative to Peers - 12 - Notes Source: SNL Financial as of 7/10/2015 ; company filings; BRG Price/ 2015E AFFOx based on annualized mid - point of 2Q pro forma AFFO guidance of $0.26 - $0.28 per share; Note: NAV and AFFO metrics are based on estimates. Company management expresses no opinion in this presentation on the accura cy of such estimates and is not providing valuation or earnings guidance, including without limitation any update to previously rendered earnings guidance; 2015 AFFO metrics are pr o forma and do not reflect actual or anticipated performance results. Readers should refer to the Company’s earnings supplement for the three months ended March 31, 2015 for as sumptions underlying pro forma AFFO.

11.6 11.8 16.8 18.3 20.2 22.3 23.5 10.0 15.0 20.0 25.0 BRG IRT MAA TSRE CPT PPS AEC - 26% - 24% - 9% - 7% - 7% - 3% 25% -30% % 30% 9.3% 9.0% 5.4% 4.0% 3.6% 3.1% 2.9% % 5% 10% BRG IRT TSRE MAA CPT PPS AEC Portfolio Poised for Growth x Portfolio primed for internal growth » BRG’s strategy is continuing to produce outsized returns: newer, class A assets, growth markets, renters by choice » Value embedded in existing portfolio: fractured condo deal, value - add programs and development projects x Robust pipeline of attractive transactions » Active pipeline exceeds 5,600 units / $720 million » Ability to grow asset base through transactions accretive to AFFO and NAV x Attractive metrics relative to peers » Trading at 24% discount to NAV » Discount AFFO multiple relative to peers » Dividend yield of 9.3% versus peer average of 4.7% Premium Dividend – As of 7/10/15 Discount to NAV Attractive 2015 AFFO Multiple - 13 - IRT BRG CPT TSRE PPS MAA AEC NAV