Attached files
| file | filename |
|---|---|
| 8-K - 8-K - 8point3 Energy Partners LP | d58403d8k.htm |
Exhibit 99.1
8point3 energy partners
Company Overview
July 2015
©2015 8point3 Energy Partners
Disclaimer
Cautionary
Statement Regarding Forward-Looking Statements
This presentation and the oral statements made in connection therewith contain “forward-looking
statements.” All statements, other than statements of historical fact, regarding the Partnership’s strategy, future operations, financial position, estimated revenues and losses, projected costs, prospects, plans and objectives of
management are forward-looking statements. Any forward-looking statements involve risks, uncertainties and assumptions. The forward-looking statements contained herein are based on the Partnership’s management’s current expectations and
assumptions about future events and are based on currently available information as to the outcome and timing of future events. Although the Partnership believes that its plans, intentions and expectations reflected in or suggested by these
forward-looking statements are reasonable, it can give no assurance that these plans, intentions or expectations will be achieved when anticipated or at all. Actual results could differ materially from those expressed in any forward-looking
statements.
Except as otherwise required by applicable law, the Partnership disclaims any duty to update any forward-looking statements. The forward-looking
statements contained herein are expressly qualified by this cautionary notice to recipients.
Industry and Market Data
This presentation has been prepared by the Partnership and includes market and competitive position data and other statistical information from the Partnership’s own internal
estimates as well as from third-party sources, including independent industry publications, government publications or other published independent sources, including the U.S. Department of Energy, the International Energy Agency, the U.S. Energy
Information Administration, Bloomberg New Energy Finance, Renewable Energy Policy Network for the 21st Century, the Solar Energy Industries Association and Lazard Ltd. Although the Partnership believes these third-party sources are reliable as of
their respective dates, the Partnership has not independently verified the accuracy or completeness of this information.
Non-GAAP Financial Measures
This presentation includes certain non-GAAP financial measures, including EBITDA. Such non-GAAP financial measures should be considered only as supplemental to, and not as superior
to, financial measures prepared in accordance with GAAP. Please refer to the Appendix of this presentation for a reconciliation of the non-GAAP financial measures included in this presentation to the most directly comparable financial measures
prepared in accordance with GAAP.
8point3 energy partners
©2015 8point3
Energy Partners
2
Introduction to 8Point3 Energy Partners
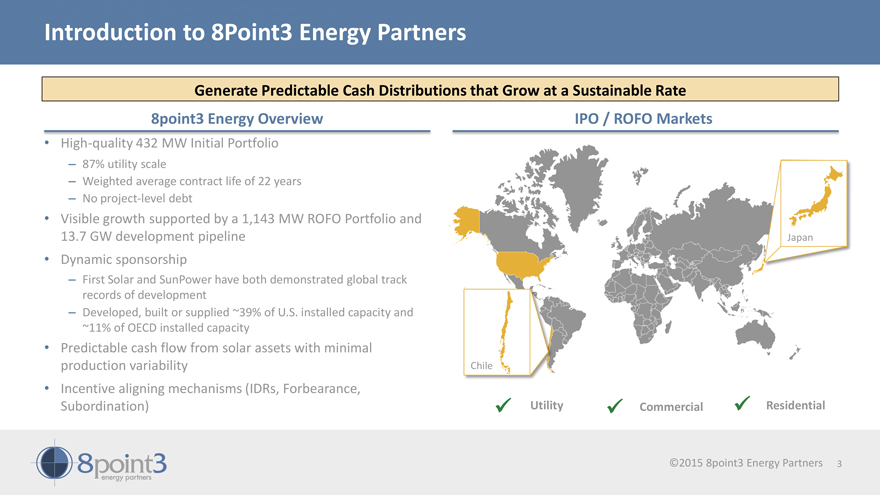
Generate Predictable Cash Distributions that Grow at a Sustainable Rate
8point3 Energy
Overview
High-quality 432 MW Initial Portfolio
– 87% utility scale
– Weighted average contract life of 22 years
– No project-level
debt
Visible growth supported by a 1,143 MW ROFO Portfolio and
13.7 GW
development pipeline
Dynamic sponsorship
– First Solar and SunPower have
both demonstrated global track records of development
– Developed, built or supplied
~39% of U.S. installed capacity and
~11% of OECD installed capacity
Predictable cash flow from solar assets with minimal production variability
Incentive aligning
mechanisms (IDRs, Forbearance,
Subordination)
IPO / ROFO Markets
Japan
Chile
Utility Commercial Residential
8point3 energy partners ©2015 8point3 Energy Partners 3
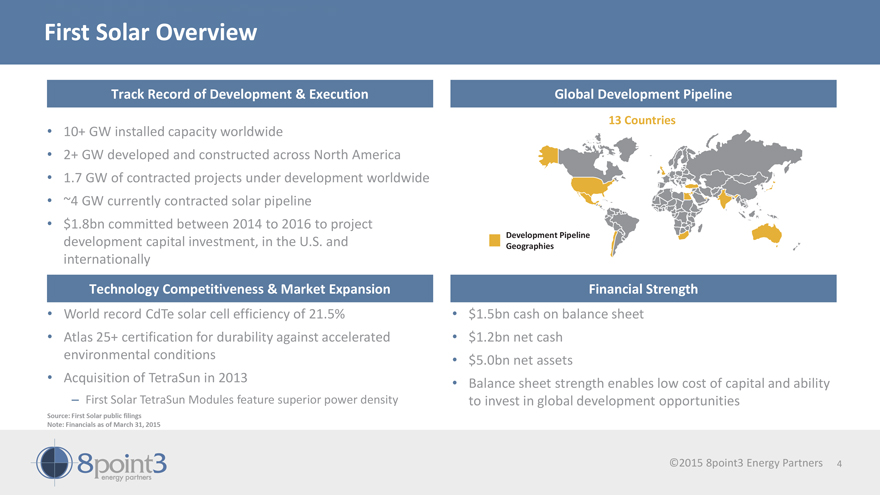
First Solar Overview
Track Record of Development & Execution
10+ GW installed capacity
worldwide
2+ GW developed and constructed across North America
1.7 GW of
contracted projects under development worldwide
~4 GW currently contracted solar pipeline
$1.8bn committed between 2014 to 2016 to project development capital investment, in the U.S. and internationally
Global Development Pipeline
13 Countries
Development Pipeline
Geographies
Technology Competitiveness & Market Expansion
World record CdTe solar cell efficiency of
21.5%
Atlas 25+ certification for durability against accelerated environmental conditions
Acquisition of TetraSun in 2013
– First Solar TetraSun Modules feature superior power
density
Financial Strength
$1.5bn cash on balance sheet
$1.2bn net cash
$5.0bn net assets
Balance sheet strength enables low cost of capital and ability to invest in global development opportunities
Source: First Solar public filings
Note: Financials as of March 31, 2015
8point3 energy partners ©2015 8point3 Energy Partners 4
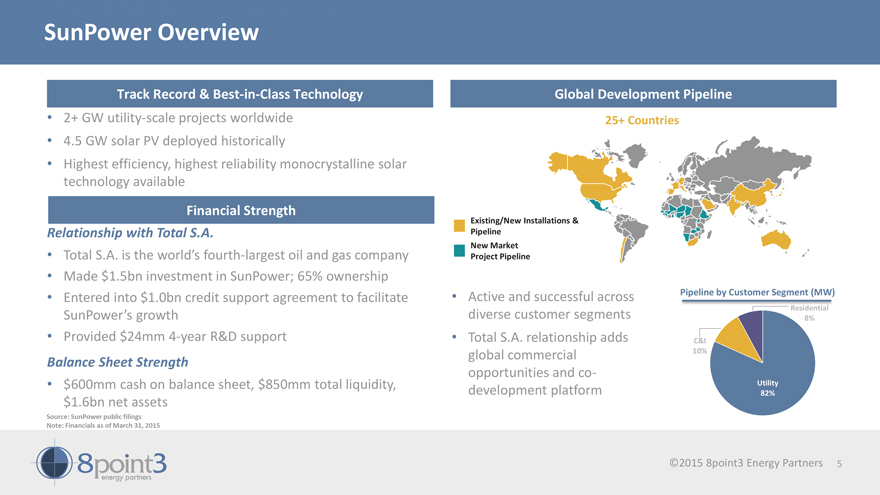
SunPower Overview
Track
Record & Best-in-Class Technology
2+ GW utility-scale projects worldwide
4.5 GW solar PV deployed historically
Highest efficiency, highest reliability monocrystalline
solar technology available
Financial Strength
Relationship with Total S.A.
Total S.A. is the world’s fourth-largest oil and gas company
Made $1.5bn
investment in SunPower; 65% ownership
Entered into $1.0bn credit support agreement to facilitate SunPower’s growth
Provided $24mm 4-year R&D support
Balance Sheet Strength
$600mm cash on balance sheet, $850mm total liquidity, $1.6bn net assets
Source: SunPower
public filings Note: Financials as of March 31, 2015
Global Development Pipeline
25+ Countries
Existing/New Installations & Pipeline
New Market
Project Pipeline
Active and successful across diverse customer segments
Total S.A. relationship adds global
commercial opportunities and co-development platform
Pipeline by Customer Segment (MW)
Residential
8%
C&I
10%
Utility
82%
8point3 energy partners ©2015 8point3 Energy Partners 5
Strategic Rationale | Why 8point3 Energy Matters to Our Sponsors
Pure-play vehicle that highlights the value of contracted solar power assets
Provides key
source of visible demand for Sponsors’ core module manufacturing businesses
Complementary technologies and market segments provide diversification of growth
opportunities
Broadens investor base and provides an attractive cost of capital
Enables Sponsors to retain ownership of assets and benefit from recurring cash flow and residual value upside
General Partner interest will represent significant and increasing value to Sponsors as 8point3 achieves growth targets
Sustainable competitive advantage for Sponsors and long-term, stable returns for Sponsors’ shareholders
8point3 energy partners ©2015 8point3 Energy Partners 6

Key Investment Highlights
1 Favorable Industry Dynamics
2 Stable Cash Flows Generated by Long-Term
Contracts with Credit-Worthy Counterparties
3 High Quality Portfolio of Newly Constructed Solar Assets with Significant Scale and Diversity
4 Ongoing Relationship with First Solar and SunPower Provides Visibility for Sustainable Growth
5 Conservative Financing Structure
6 Experienced Management Team
8point3 energy partners ©2015 8point3 Energy Partners 7
Our Portfolio
8point3
energy partners ©2015 8point3 Energy Partners
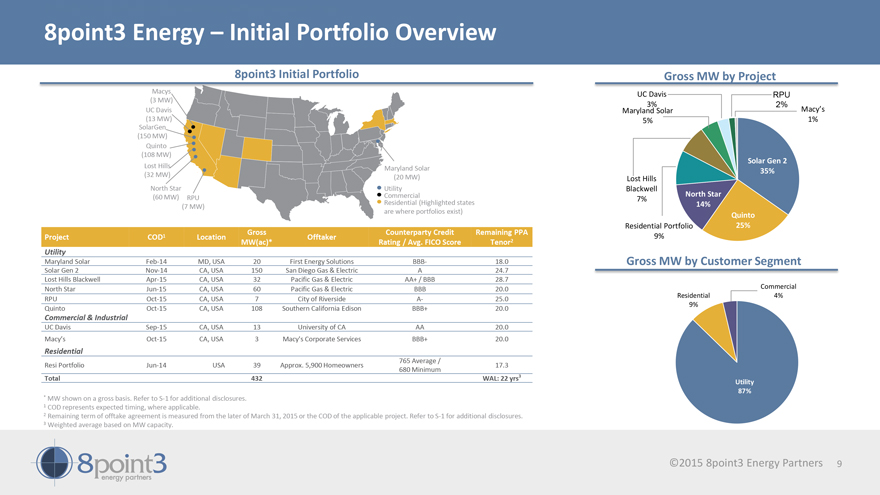
8point3 Energy – Initial Portfolio Overview
8point3 Initial Portfolio
Macys
(3 MW)
UC Davis
(13 MW)
SolarGen
(150 MW)
Quinto
(108 MW)
Lost Hills
(32 MW)
Maryland Solar
(20 MW)
North Star
(60 MW)
RPU
(7 MW)
Utility
Commercial
Residential (Highlighted states are where portfolios exist)
Project COD1 Location Gross MW(ac)* Offtaker Counterparty Credit Rating / Avg. FICO Score Remaining PPA Tenor2
Utility
Maryland Solar Feb-14 MD, USA 20 First Energy Solutions BBB- 18.0
Solar Gen 2 Nov-14 CA, USA 150 San Diego Gas & Electric A 24.7
Lost Hills Blackwell Apr-15
CA, USA 32 Pacific Gas & Electric AA+ / BBB 28.7
North Star Jun-15 CA, USA 60 Pacific Gas & Electric BBB 20.0
RPU Oct-15 CA, USA 7 City of Riverside A- 25.0
Quinto Oct-15 CA, USA 108 Southern California
Edison BBB+ 20.0
Commercial & Industrial UC Davis Sep-15 CA, USA 13 University of CA AA 20.0
Macy’s Oct-15 CA, USA 3 Macy’s Corporate Services BBB+ 20.0
Residential
Resi Portfolio Jun-14 USA 39 Approx. 5,900 Homeowners 765 Average / 680 Minimum 17.3
Total 432
WAL: 22 yrs3
Gross MW by Project
UC Davis 3% RPU 2%
Maryland Solar 5%
Macy’s 1%
Solar Gen 2 35%
Lost Hills Blackwell 7%
North Star 14%
Quinto 25%
Residential Portfolio 9%
Gross MW by Customer Segment
Commercial 4%
Residential 9%
Utility 87%
* MW shown on a gross basis. Refer to S-1 for additional disclosures.
1 COD represents expected timing, where applicable.
2 Remaining term of offtake agreement is
measured from the later of March 31, 2015 or the COD of the applicable project. Refer to S-1 for additional disclosures.
3 Weighted average based on MW
capacity.
8point3 energy partners ©2015 8point3 Energy Partners 9
Right of First Offer Portfolio Detail
ROFO Assets Summary
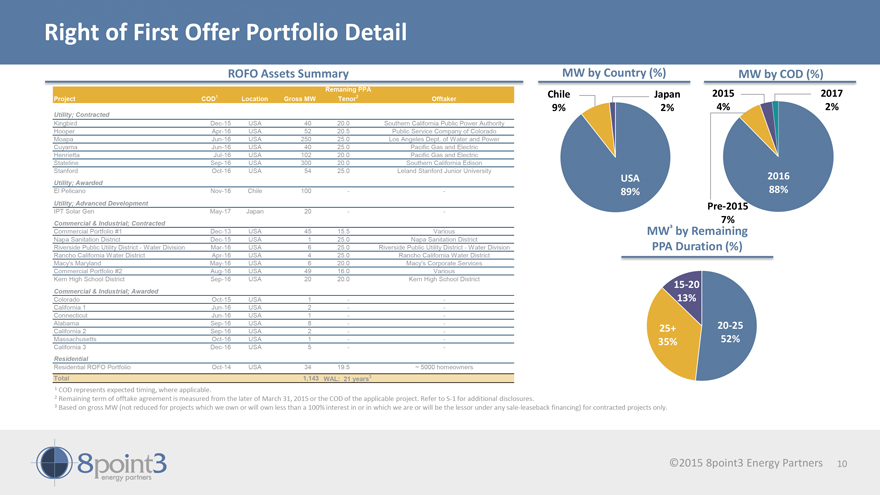
Project COD1 Location Gross MW Remaning PPA Tenor2 Offtaker
Utility; Contracted
Kingbird Dec-15 USA 40 20.0 Southern California Public Power Authority
Hooper Apr-16 USA 52 20.5 Public Service Company of Colorado
Moapa Jun-16 USA
250 25.0 Los Angeles Dept. of Water and Power
Cuyama Jun-16 USA 40 25.0 Pacific Gas and Electric
Henrietta Jul-16 USA 102 20.0 Pacific Gas and Electric
Stateline Sep-16 USA 300 20.0 Southern
California Edison
Stanford Oct-16 USA 54 25.0 Leland Stanford Junior University
Utility; Awarded
El Pelicano Nov-16 Chile 100 - -
Utility; Advanced Development
IPT Solar Gen May-17 Japan 20 - -
Commercial & Industrial; Contracted
Commercial Portfolio #1 Dec-13 USA 45 15.5
Various
Napa Sanitation District Dec-15 USA 1 25.0 Napa Sanitation District
Riverside Public Utility District - Water Division Mar-16 USA 6 25.0 Riverside Public Utility District - Water Division
Rancho California Water District Apr-16 USA 4 25.0 Rancho California Water District
Macy’s Maryland May-16 USA 6 20.0 Macy’s Corporate Services
Commercial Portfolio #2 Aug-16 USA 49 16.0 Various
Kern High School District
Sep-16 USA 20 20.0 Kern High School District
Commercial & Industrial; Awarded
Colorado Oct-15 USA 1 - -
California 1 Jun-16 USA 2 - -
Connecticut Jun-16 USA 1 - -
Alabama Sep-16 USA 8 - -
California 2 Sep-16 USA 2 - -
Massachusetts Oct-16 USA 1 - -
California 3 Dec-16 USA 5 - -
Residential
Residential ROFO Portfolio Oct-14 USA 34 19.5 ~5000 homeowners
Total 1,143 WAL: 21 years3
MW by Country (%)
Chile 9%
Japan 2%
USA 89%
MW by COD (%)
2015 4%
2017 2%
2016 88%
Pre-2015 7%
2016 88%
MW3 by Remaining PPA Duration (%)
15-20 13%
25+ 35%
20-25 52%
1 COD represents expected timing, where applicable.
2 Remaining term of offtake agreement is
measured from the later of March 31, 2015 or the COD of the applicable project. Refer to S-1 for additional disclosures.
3 Based on gross MW (not reduced for
projects which we own or will own less than a 100% interest in or in which we are or will be the lessor under any sale-leaseback financing) for contracted projects only.
8point3 energy partners ©2015 8point3 Energy Partners 10
Visibility for Sustainable Growth
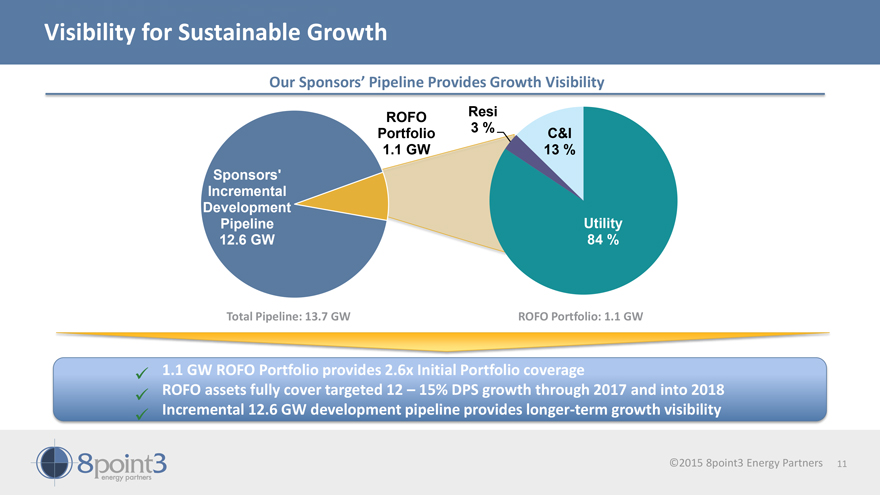
Our Sponsors’ Pipeline Provides Growth Visibility
ROFO Portfolio 1.1 GW Resi 3 % C&I
13 %
Sponsors’ Incremental Development Pipeline 12.6 GW Utility 84 %
Total Pipeline: 13.7 GW ROFO Portfolio: 1.1 GW
1.1 GW ROFO Portfolio provides
2.6x Initial Portfolio coverage
ROFO assets fully cover targeted 12 – 15% DPS growth through 2017 and into 2018
Incremental 12.6 GW development pipeline provides longer-term growth visibility
8point3 Energy
Partners ©2015 8point3 Energy Partners 11
Key Investment Highlights
8point3 Energy Partners ©2015 8point3 Energy Partners
1 Favorable Industry Dynamics
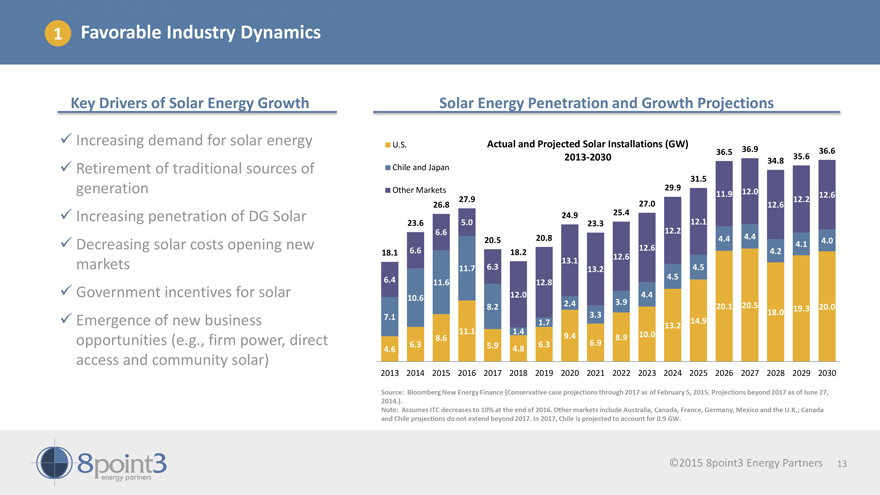
Key Drivers of Solar Energy Growth
Increasing demand for solar energy
Retirement of traditional sources of generation
Increasing penetration of DG Solar
Decreasing solar costs opening new markets
Government incentives for solar
Emergence of new business opportunities (e.g., firm power, direct access and community solar)
Solar Energy Penetration and Growth Projections
U.S. Actual and Projected
Solar Installations (GW) 36.9
36.5 36.6
2013-2030 34.8 35.6
Chile and Japan
31.5
Other Markets 29.9 12.0
11.9 12.6
27.9 12.2
26.8 27.0 12.6
24.9 25.4
23.6 5.0 23.3 12.1
6.6 12.2
20.5 20.8 4.4 4.4 4.0
12.6 4.1
18.1 6.6 18.2 4.2
13.1 12.6
11.7 6.3 13.2 4.5
4.5
6.4 11.6 12.8
10.6 12.0 4.4
8.2 2.4 3.9 20.1 20.5 19.3 20.0
7.1 3.3 18.0
1.7 13.2 14.9
8.6 11.1 1.4 9.4 8.9 10.0
4.6 6.3 5.9 4.8 6.3 6.9
2013 2014 2015 2016 2017 2018 2019 2020 2021 2022 2023 2024 2025 2026 2027 2028 2029 2030
Source: Bloomberg New Energy Finance (Conservative case projections through 2017 as of February 5, 2015. Projections beyond 2017 as of June 27, 2014.).
Note: Assumes ITC decreases to 10% at the end of 2016. Other markets include Australia, Canada, France, Germany, Mexico and the U.K.; Canada and Chile projections
do not extend beyond 2017. In 2017, Chile is projected to account for 0.9 GW.
8point3 Energy Partners ©2015 8point3 Energy Partners 13
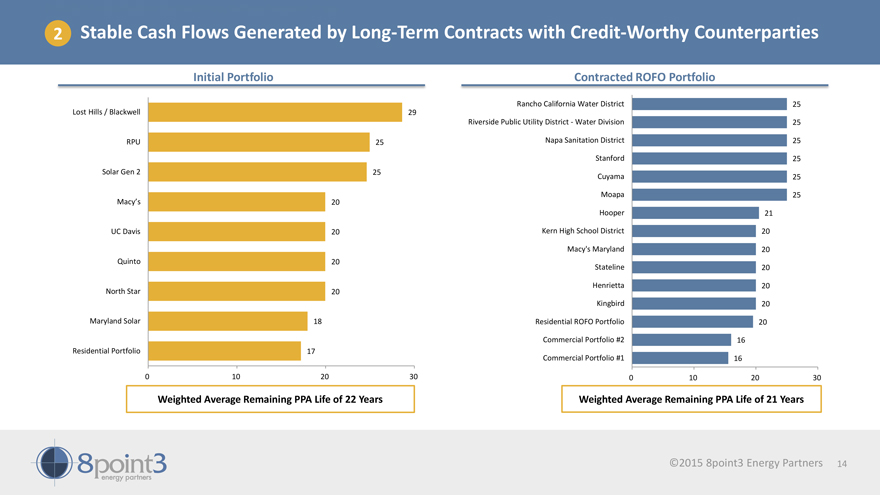
2 Stable Cash Flows Generated by Long-Term Contracts with Credit-Worthy Counterparties
Initial Portfolio
Lost Hills / Blackwell 29
RPU 25
Solar Gen 2 25
Macy’s 20
UC Davis 20
Quinto 20
North Star 20
Maryland Solar 18
Residential Portfolio 17
0 10 20 30
Weighted Average Remaining PPA Life of 22 Years
Contracted ROFO Portfolio
Rancho California Water District 25
Riverside Public Utility District - Water Division 25
Napa Sanitation District 25
Stanford 25
Cuyama 25
Moapa 25
Hooper 21
Kern High School District 20
Macy’s Maryland 20
Stateline 20
Henrietta 20
Kingbird 20
Residential ROFO Portfolio 20
Commercial Portfolio #2 16
Commercial Portfolio #1 16
0 10 20 30
Weighted Average Remaining PPA Life of 21 Years
8point3 energy partners ©2015 8point3 Energy Partners 14
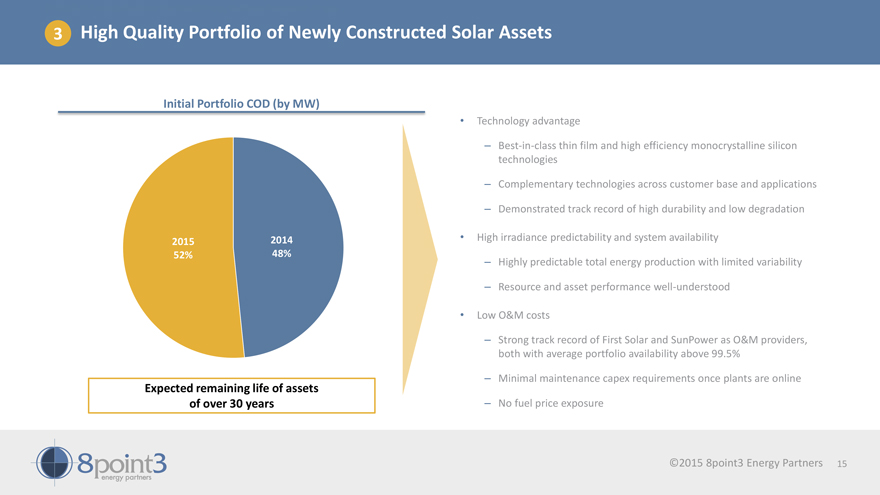
3 High Quality Portfolio of Newly Constructed Solar Assets
Initial Portfolio COD (by MW)
2015 2014 52% 48%
Expected remaining life of assets of over 30 years
Technology advantage
Best-in-class thin film and high efficiency monocrystalline silicon technologies
Complementary
technologies across customer base and applications
Demonstrated track record of high durability and low degradation
High irradiance predictability and system availability
Highly predictable total energy
production with limited variability
Resource and asset performance well-understood
Low O&M costs
Strong track record of First Solar and SunPower as O&M providers, both
with average portfolio availability above 99.5%
Minimal maintenance capex requirements once plants are online
No fuel price exposure
8point3 Energy Partners ©2015 8point3 Energy Partners 15
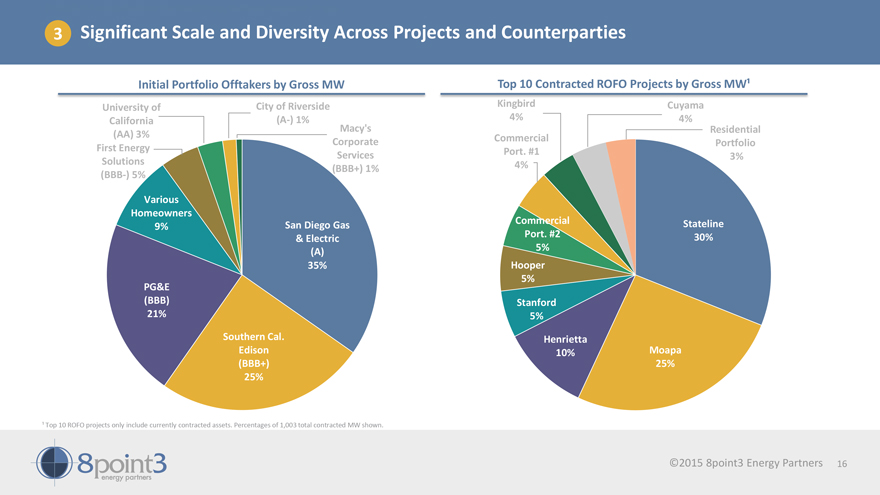
3 Significant Scale and Diversity Across Projects and Counterparties
Initial Portfolio Offtakers by Gross MW
University of California (AA) 3% City of Riverside
(A-) 1%
First Energy Solutions (BBB-) 5% Macy’s Corporate Services (BBB+) 1%
Various Homeowners 9% San Diego Gas & Electric (A) 35%
PG&E (BBB) 21% Southern Cal.
Edison (BBB+) 25%
Top 10 Contracted ROFO Projects by Gross MW1
Kingbird 4%
Cuyama 4%
Commercial Port. #1 4%
Residential Portfolio 3%
Commercial Port. #2 5%
Stateline 30%
Hooper 5%
Stanford 5%
Henrietta 10%
Moapa 25%
1 Top 10 ROFO projects only include currently contracted assets. Percentages of
1,003 total contracted MW shown.
8point3 Energy Partners ©2015 8point3 Energy Partners 16
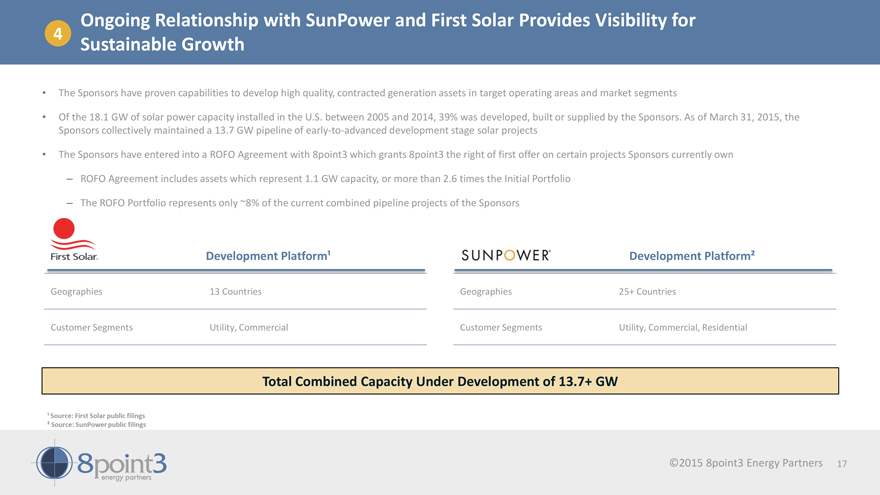
Ongoing Relationship with SunPower and First Solar Provides Visibility for
4
Sustainable Growth
The Sponsors have proven capabilities to develop high quality, contracted generation assets in target operating areas and market segments
Of the 18.1 GW of solar power capacity installed in the U.S. between 2005 and 2014, 39% was developed, built or supplied by the Sponsors. As of March 31, 2015, the Sponsors
collectively maintained a 13.7 GW pipeline of early-to-advanced development stage solar projects
The Sponsors have entered into a ROFO Agreement with 8point3 which
grants 8point3 the right of first offer on certain projects Sponsors currently own
ROFO Agreement includes assets which represent 1.1 GW capacity, or more than 2.6
times the Initial Portfolio
The ROFO Portfolio represents only ~8% of the current combined pipeline projects of the Sponsors
First Solar® Development Platform1 SUNPOWER® Development Platform2
Geographies
Customer Segments 13 Countries Utility, Commercial Geographies Customer Segments 25+ Countries Utility, Commercial, Residential
Total Combined Capacity Under
Development of 13.7+ GW
1 Source: First Solar public filings
2 Source:
SunPower public filings
8point3 Energy Partners
©2015 8point3 Energy
Partners 17
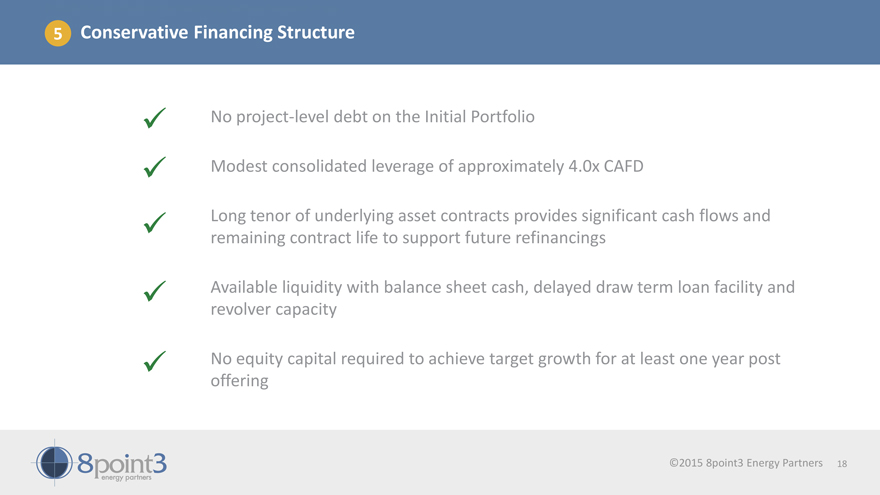
5 Conservative Financing Structure
No project-level debt on the Initial Portfolio
Modest consolidated leverage of approximately
4.0x CAFD
Long tenor of underlying asset contracts provides significant cash flows and remaining contract life to support future refinancings
Available liquidity with balance sheet cash, delayed draw term loan facility and revolver capacity
No equity capital required to achieve target growth for at least one year post offering
8point3 Energy Partners ©2015 8point3 Energy Partners 18
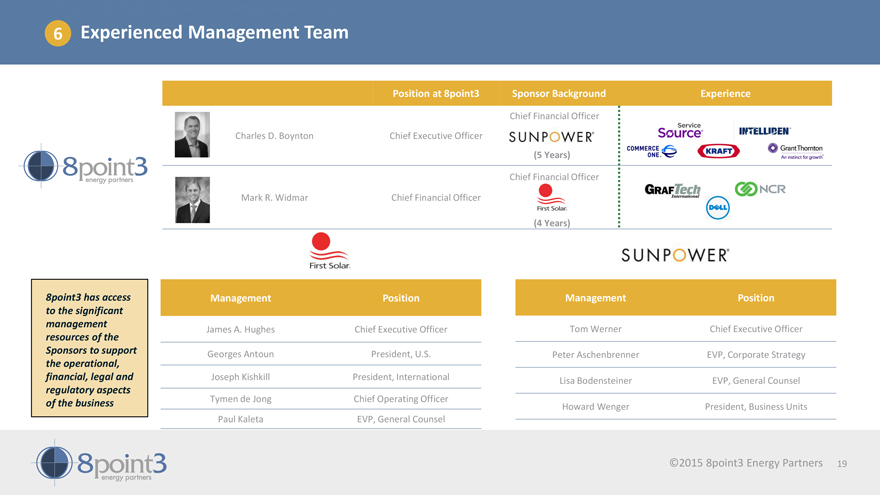
6 Experienced Management Team
Position at 8point3 Sponsor Background Experience
Chief Financial Officer Service Source®
COMMERCE ONE® KRAFT INTELLIDEN® Grant Thorton An instinct for growth®
Charles D. Boynton Chief Executive Officer SUNPOWER®
8point3 Energy Partners (5 Years) GRAFTECH International NCR DELL
Chief Financial Officer
Mark R. Widmar Chief Financial Officer First Solar®
(4 Years)
8point3 has access to the significant management resources of the Sponsors to support the operational, financial, legal and regulatory aspects of the business
Management Position Management Position
James A. Hughes Chief Executive Officer Tom Werner
Chief Executive Officer
Georges Antoun President, U.S. Peter Aschenbrenner EVP, Corporate Strategy
Joseph Kishkill President, International Lisa Bodensteiner EVP, General Counsel
Tymen de Jong
Chief Operating Officer
Howard Wenger President, Business Units
Paul Kaleta
EVP, General Counsel
8point3 Energy Partners ©2015 8point3 Energy Partners 19

Financial Overview
8point3 Energy Partners ©2015 8point3 Energy Partners
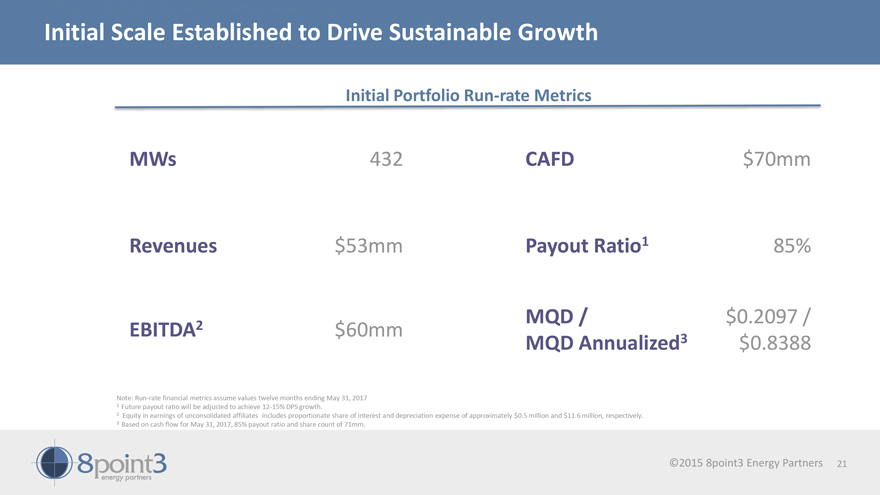
Initial Scale Established to Drive Sustainable Growth
Initial Portfolio Run-rate Metrics
MWs
Revenues
EBITDA2
432
$53mm
$60mm
CAFD
Payout Ratio1
MQD / MQD Annualized3
$70mm
85%
$0.2097 / $0.8388
Note: Run-rate financial metrics assume values twelve
months ending May 31, 2017
1 Future payout ratio will be adjusted to achieve 12-15% DPS growth.
2 Equity in earnings of unconsolidated affiliates includes proportionate share of interest and depreciation expense of approximately $0.5 million and $11.6 million, respectively.
3 Based on cash flow for May 31, 2017, 85% payout ratio and share count of 71mm.
8point3 Energy Partners
©2015 8point3 Energy Partners
21
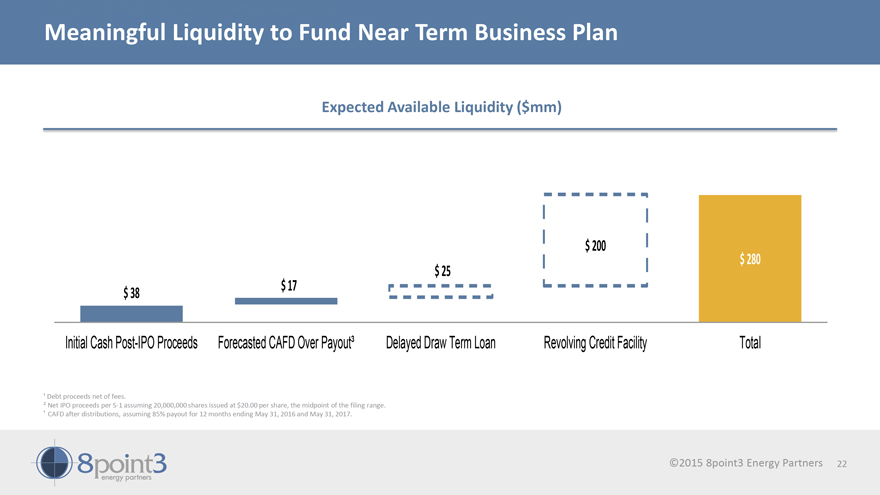
Meaningful Liquidity to Fund Near Term Business Plan
Expected Available Liquidity ($mm)
$ 38
Initial Cash Post-IPO Proceeds
$ 17
Forecasted CAFD Over Payout3
$ 25
Delayed Draw Term Loan
$ 200
Revolving Credit Facility
$ 280
Total
1 Debt proceeds net of fees.
2 Net IPO proceeds per S-1 assuming 20,000,000 shares issued at $20.00 per share, the midpoint of the filing range.
3 CAFD after distributions, assuming 85% payout for 12 months ending May 31, 2016 and May 31, 2017.
8point3 energy partners
©2015 8point3 Energy Partners 22
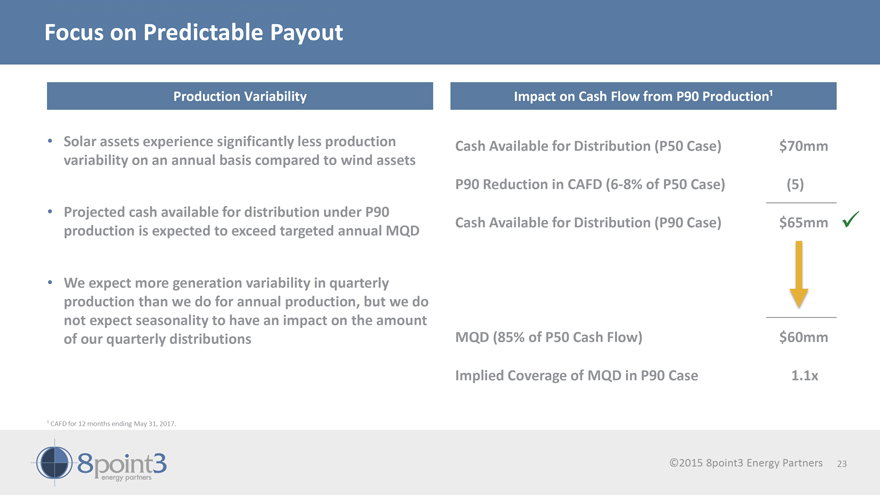
Focus on Predictable Payout
Production Variability
Solar assets experience significantly less production
variability on an annual basis compared to wind assets
Projected cash available for distribution under P90 production is expected to exceed targeted annual MQD
We expect more generation variability in quarterly production than we do for annual production, but we do not expect seasonality to have an impact on the amount of
our quarterly distributions
1 CAFD for 12 months ending May 31, 2017.
Impact
on Cash Flow from P90 Production1
Cash Available for Distribution (P50 Case)
P90 Reduction in CAFD (6-8% of P50 Case)
Cash Available for Distribution (P90
Case)
MQD (85% of P50 Cash Flow)
Implied Coverage of MQD in P90 Case
$70mm
(5)
$65mm
$60mm
1.1x
8point3 energy partners
©2015 8point3 Energy Partners 23
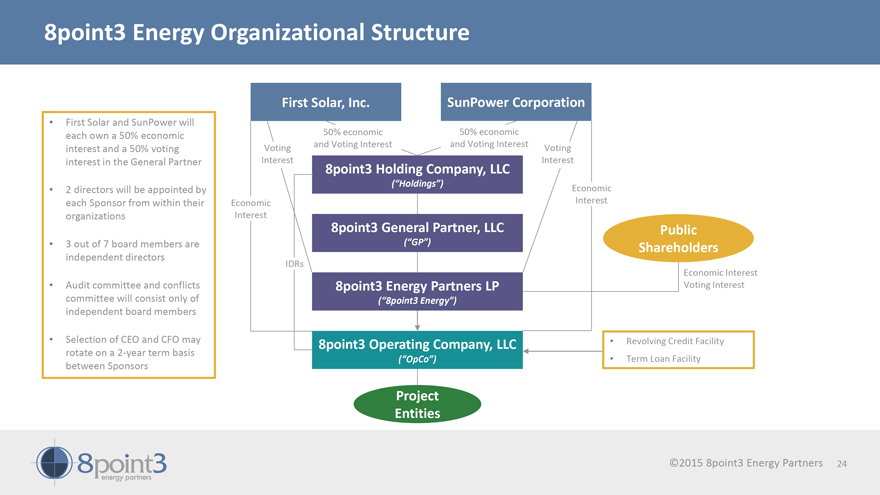
8point3 Energy Organizational Structure
First Solar and SunPower will each own a 50% economic interest and a 50% voting interest in the General Partner
2 directors will be appointed by each Sponsor from within their organizations
3 out of 7 board
members are independent directors
Audit committee and conflicts committee will consist only of independent board members
Selection of CEO and CFO may rotate on a 2-year term basis between Sponsors
First Solar, Inc.
50% economic and Voting Interest
Voting Interest
Economic Interest
IDRs
8point3 Holding Company, LLC
(“Holdings”)
8point3 General Partner, LLC
(“GP”)
8point3 Energy Partners LP
(“8point3 Energy”)
8point3 Operating Company, LLC
(“OpCo”)
Project
Entities
SunPower Corporation
50% economic
and Voting Interest
Voting Interest
Economic
Interest
Public
Shareholders
Economic Interest
Voting Interest
Revolving Credit Facility
Term Loan Facility
8point3 energy partners
©2015 8point3 Energy Partners 24
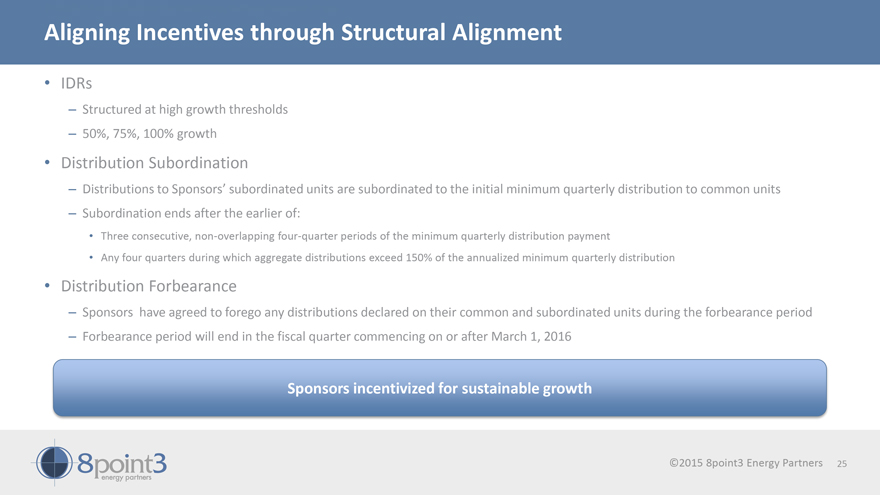
Aligning Incentives through Structural Alignment
IDRs
Structured at high growth thresholds
50%, 75%, 100% growth
Distribution Subordination
Distributions to Sponsors’ subordinated units are subordinated to the initial minimum quarterly distribution to common units
Subordination ends after the earlier of:
Three consecutive, non-overlapping four-quarter
periods of the minimum quarterly distribution payment
Any four quarters during which aggregate distributions exceed 150% of the annualized minimum quarterly
distribution
Distribution Forbearance
Sponsors have agreed to forego any
distributions declared on their common and subordinated units during the forbearance period
Forbearance period will end in the fiscal quarter commencing on or
after March 1, 2016
Sponsors incentivized for sustainable growth
8point3
energy partners
©2015 8point3 Energy Partners 25
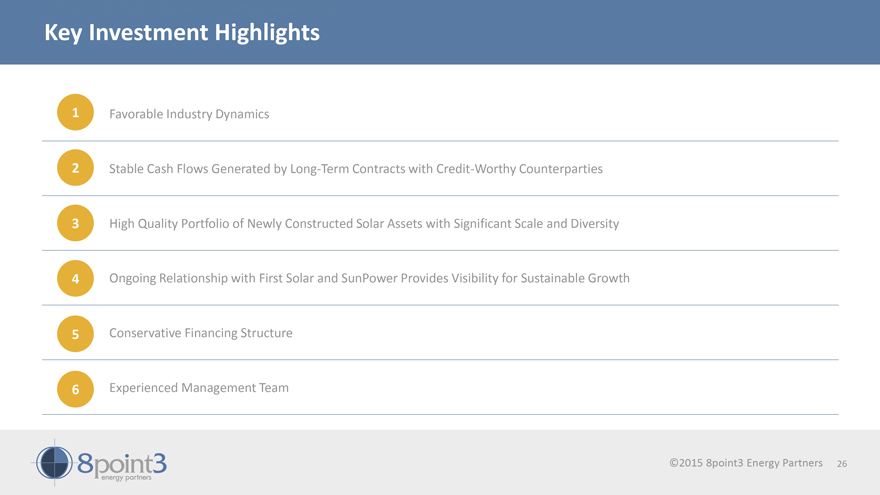
Key Investment Highlights
1 Favorable Industry Dynamics
2 Stable Cash Flows Generated by Long-Term
Contracts with Credit-Worthy Counterparties
3 High Quality Portfolio of Newly Constructed Solar Assets with Significant Scale and Diversity
4 Ongoing Relationship with First Solar and SunPower Provides Visibility for Sustainable Growth
5 Conservative Financing Structure
6 Experienced Management Team
8point3 energy partners
©2015 8point3 Energy Partners 26
Appendix
8point3 energy
partners
©2015 8point3 Energy Partners
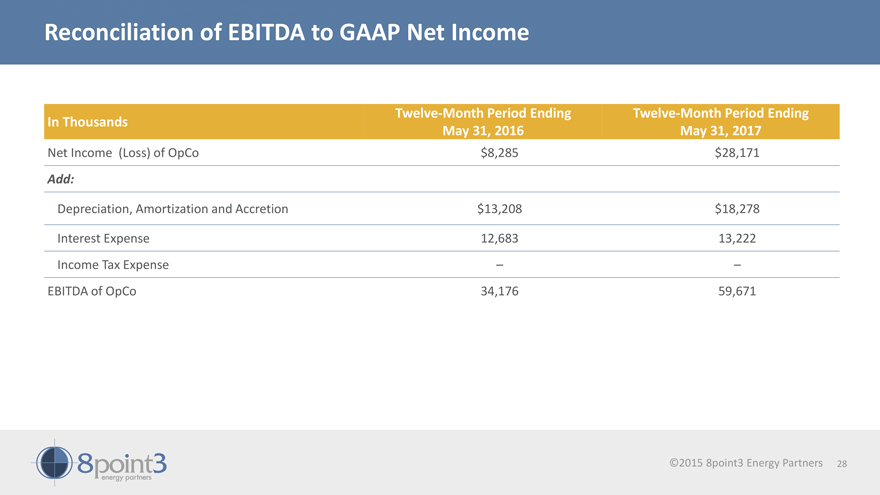
Reconciliation of EBITDA to GAAP Net Income
In Thousands
Net Income (Loss) of OpCo
Add:
Depreciation, Amortization and Accretion
Interest Expense
Income Tax Expense
EBITDA of OpCo
Twelve-Month Period Ending
May 31, 2016
$8,285
$13,208
12,683
–
34,176
Twelve-Month Period Ending
May 31, 2017
$28,171
$18,278
13,222
–
59,671
8point3 energy partners
©2015 8point3 Energy Partners 28
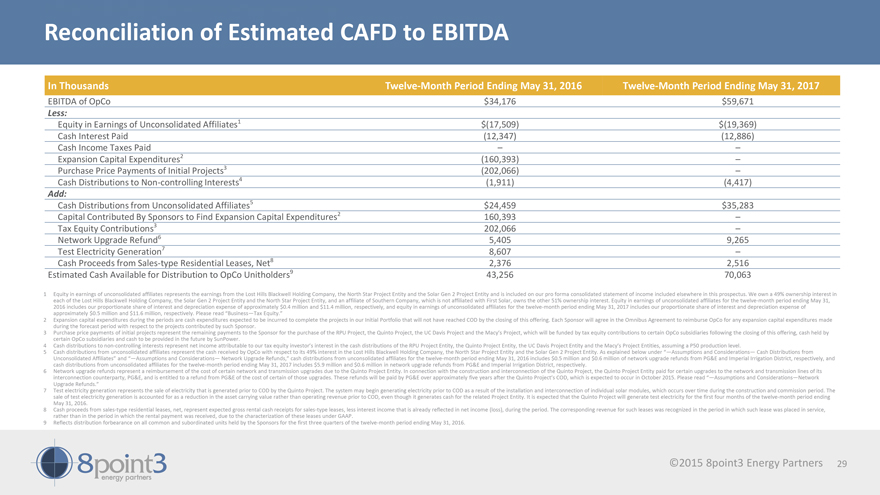
Reconciliation of Estimated CAFD to EBITDA
In Thousands
EBITDA of OpCo
Less:
Equity in Earnings of Unconsolidated Affiliates1
Cash Interest Paid
Cash Income Taxes Paid
Expansion Capital Expenditures2
Purchase Price Payments of Initial Projects3
Cash Distributions to Non-controlling Interests4
Add:
Cash Distributions from Unconsolidated Affiliates5
Capital Contributed By Sponsors to Find
Expansion Capital Expenditures2
Tax Equity Contributions3
Network Upgrade
Refund6
Test Electricity Generation7
Cash Proceeds from Sales-type
Residential Leases, Net8
Estimated Cash Available for Distribution to OpCo Unitholders9
Twelve-Month Period Ending May 31, 2016
$34,176
$(17,509)
(12,347)
–
(160,393)
(202,066)
(1,911)
$24,459
160,393
202,066
5,405
8,607
2,376
43,256
Twelve-Month Period Ending May 31, 2017
$59,671
$(19,369)
(12,886)
–
–
–
(4,417)
$35,283
–
–
9,265
–
2,516
70,063
1 Equity in earnings of unconsolidated affiliates represents the earnings from the Lost Hills Blackwell Holding Company, the North Star Project Entity and the Solar Gen 2 Project
Entity and is included on our pro forma consolidated statement of income included elsewhere in this prospectus. We own a 49% ownership interest in each of the Lost Hills Blackwell Holding Company, the Solar Gen 2 Project Entity and the North Star
Project Entity, and an affiliate of Southern Company, which is not affiliated with First Solar, owns the other 51% ownership interest. Equity in earnings of unconsolidated affiliates for the twelve-month period ending May 31, 2016 includes our
proportionate share of interest and depreciation expense of approximately $0.4 million and $11.4 million, respectively, and equity in earnings of unconsolidated affiliates for the twelve-month period ending May 31, 2017 includes our proportionate
share of interest and depreciation expense of approximately $0.5 million and $11.6 million, respectively. Please read “Business—Tax Equity.”
2
Expansion capital expenditures during the periods are cash expenditures expected to be incurred to complete the projects in our Initial Portfolio that will not have reached COD by the closing of this offering. Each Sponsor will agree in the Omnibus
Agreement to reimburse OpCo for any expansion capital expenditures made during the forecast period with respect to the projects contributed by such Sponsor.
3
Purchase price payments of initial projects represent the remaining payments to the Sponsor for the purchase of the RPU Project, the Quinto Project, the UC Davis Project and the Macy’s Project, which will be funded by tax equity contributions
to certain OpCo subsidiaries following the closing of this offering, cash held by certain OpCo subsidiaries and cash to be provided in the future by SunPower.
4
Cash distributions to non-controlling interests represent net income attributable to our tax equity investor’s interest in the cash distributions of the RPU Project Entity, the Quinto Project Entity, the UC Davis Project Entity and the
Macy’s Project Entities, assuming a P50 production level.
5 Cash distributions from unconsolidated affiliates represent the cash received by OpCo with respect
to its 49% interest in the Lost Hills Blackwell Holding Company, the North Star Project Entity and the Solar Gen 2 Project Entity. As explained below under “—Assumptions and Considerations— Cash Distributions from Unconsolidated
Affiliates” and “—Assumptions and Considerations— Network Upgrade Refunds,” cash distributions from unconsolidated affiliates for the twelve-month period ending May 31, 2016 includes $0.5 million and $0.6 million of network
upgrade refunds from PG&E and Imperial Irrigation District, respectively, and cash distributions from unconsolidated affiliates for the twelve-month period ending May 31, 2017 includes $5.9 million and $0.6 million in network upgrade refunds
from PG&E and Imperial Irrigation District, respectively.
6 Network upgrade refunds represent a reimbursement of the cost of certain network and transmission
upgrades due to the Quinto Project Entity. In connection with the construction and interconnection of the Quinto Project, the Quinto Project Entity paid for certain upgrades to the network and transmission lines of its interconnection counterparty,
PG&E, and is entitled to a refund from PG&E of the cost of certain of those upgrades. These refunds will be paid by PG&E over approximately five years after the Quinto Project’s COD, which is expected to occur in October 2015.
Please read “—Assumptions and Considerations—Network Upgrade Refunds.”
7 Test electricity generation represents the sale of electricity that is
generated prior to COD by the Quinto Project. The system may begin generating electricity prior to COD as a result of the installation and interconnection of individual solar modules, which occurs over time during the construction and commission
period. The sale of test electricity generation is accounted for as a reduction in the asset carrying value rather than operating revenue prior to COD, even though it generates cash for the related Project Entity. It is expected that the Quinto
Project will generate test electricity for the first four months of the twelve-month period ending May 31, 2016.
8 Cash proceeds from sales-type residential
leases, net, represent expected gross rental cash receipts for sales-type leases, less interest income that is already reflected in net income (loss), during the period. The corresponding revenue for such leases was recognized in the period in which
such lease was placed in service, rather than in the period in which the rental payment was received, due to the characterization of these leases under GAAP.
9
Reflects distribution forbearance on all common and subordinated units held by the Sponsors for the first three quarters of the twelve-month period ending May 31, 2016.
8point3 energy partners
©2015 8point3 Energy Partners 29