Attached files
| file | filename |
|---|---|
| 8-K - 8-K - CHUBB CORP | d58105d8k.htm |
| EX-99.4 - EX-99.4 - CHUBB CORP | d58105dex994.htm |
| EX-99.5 - EX-99.5 - CHUBB CORP | d58105dex995.htm |
| EX-99.3 - EX-99.3 - CHUBB CORP | d58105dex993.htm |
| EX-99.1 - EX-99.1 - CHUBB CORP | d58105dex991.htm |
Exhibit 99.2
ACE to Acquire Chubb:
Creating a Global P&C
Industry Leader
July 1, 2015
Explanatory Notes
Cautionary Statement Regarding
Forward-Looking Statements
All forward-looking statements made in this presentation, related to the acquisition of Chubb, potential post-acquisition performance or
otherwise, reflect ACE’s current views with respect to future events, business transactions and business performance and are made pursuant to the safe harbor provisions of the Private Securities Litigation Reform Act of 1995. In some cases, you
can identify forward-looking statements by words such as “may,” “will,” “should,” “expect,” “plan,” “anticipate,” “intend,” “believe,” “estimate,”
“predict,” “potential,” “continue,” “could,” “future,” “project” or other words of similar meaning. All forward-looking statements involve risks and uncertainties, which may cause actual
results to differ, possibly materially, from those contained in the forward-looking statements.
Forward-looking statements include, but are not limited to,
statements about the benefits of the proposed transaction involving ACE and Chubb, including future financial results; ACE’s and Chubb’s plans, objectives, expectations and intentions; the expected timing of completion of the transaction
and other statements that are not historical facts. Important factors that could cause actual results to differ, possibly materially, from those indicated by the forward-looking statements include, without limitation, the following: the inability to
complete the transaction in a timely manner; the inability to complete the transaction due to the failure of Chubb’s shareholders to adopt the transaction agreement or the failure of ACE shareholders to approve, among other matters, the
issuance of ACE common stock in connection with the acquisition; the failure to satisfy other conditions to completion of the transaction, including receipt of required regulatory approvals; the failure of the proposed transaction to close for any
other reason; the possibility that any of the anticipated benefits of the proposed transaction will not be realized; the risk that integration of Chubb’s operations with those of ACE will be materially delayed or will be more costly or
difficult than expected; the challenges of integrating and retaining key employees; the effect of the announcement of the transaction on ACE’s, Chubb’s or the combined company’s respective business relationships, operating results and
business generally; the possibility that the anticipated synergies and cost savings of the transaction will not be realized, or will not be realized within the expected time period; the possibility that the transaction may be more expensive to
complete than anticipated, including as a result of unexpected factors or events; diversion of management’s attention from ongoing business operations and opportunities; general competitive, economic, political and market conditions and
fluctuations; and actions taken or conditions imposed by the United States and foreign governments and regulatory authorities. In addition, you should carefully consider the risks and uncertainties and other factors that may affect future results of
the combined company described in the section entitled “Risk Factors” in the joint proxy statement/prospectus to be delivered to ACE’s and Chubb’s respective shareholders, and in ACE’s and Chubb’s respective filings
with the Securities and Exchange Commission (“SEC”) that are available on the SEC’s website, located at www.sec.gov, including the sections entitled “Risk Factors” in ACE’s Annual Report on Form 10–K for the year
ended December 31, 2014, which was filed with the SEC on February 27, 2015, and “Risk Factors” in Chubb’s Annual Report on Form 10–K for the year ended December 31, 2014, which was filed with the SEC on
February 26, 2015. You should not place undue reliance on forward-looking statements, which speak only as of the date of this presentation. ACE undertakes no obligation to publicly update or revise any forward-looking statements, whether as a
result of new information, future events or otherwise.
2
Explanatory Notes
Additional Information and Where
to Find It
This presentation does not constitute an offer to sell or the solicitation of an offer to buy any securities or a solicitation of any vote or approval.
This presentation may be deemed to be solicitation material in respect of the proposed transaction between ACE and Chubb. In connection with the proposed transaction, ACE intends to file a registration statement on Form S-4, containing a joint proxy
statement/prospectus with the SEC. The final joint proxy statement/prospectus will be delivered to the shareholders of ACE and Chubb. This presentation is not a substitute for the registration statement, definitive joint proxy statement/prospectus
or any other documents that ACE or Chubb may file with the SEC or send to shareholders in connection with the proposed transaction. Shareholders are urged to read all relevant documents filed with the SEC, including the joint proxy
statement/prospectus, because they will contain important information about the proposed transaction.
Shareholders will be able to obtain copies of the joint proxy
statement/prospectus and other documents filed with the SEC (when available) free of charge at the SEC’s website, http://www.sec.gov. Copies of documents filed with the SEC by ACE will be made available free of charge on ACE’s website at
www.acegroup.com. Copies of documents filed with the SEC by Chubb will be made available free of charge on Chubb’s website at www. Chubb.com.
Participants in
Solicitation
ACE, Chubb and their respective directors, executive officers and other members of management and employees may be deemed to be participants in the
solicitation of proxies in respect of the proposed transaction. Information about the directors and executive officers of ACE is set forth in the proxy statement for ACE’s 2015 Annual General Meeting, which was filed with the SEC on
April 8, 2015, and ACE’s Annual Report on Form 10-K for the year ended December 31, 2014, which was filed with the SEC on February 27, 2015. Information about the directors and executive officers of Chubb is set forth in the
proxy statement for Chubb’s 2015 Annual Meeting of Shareholders, which was filed with the SEC on March 13, 2015, and Chubb’s Annual Report on Form 10-K for the year ended December 31, 2014, which was filed with the SEC on
February 26, 2015. Other information regarding the participants in the proxy solicitation and a description of their direct and indirect interests, by security holdings or otherwise, will be contained in the joint proxy statement/prospectus and
other relevant materials filed with the SEC. You may obtain free copies of these documents as described above.
3
Compelling Strategic Rationale
| • |
|
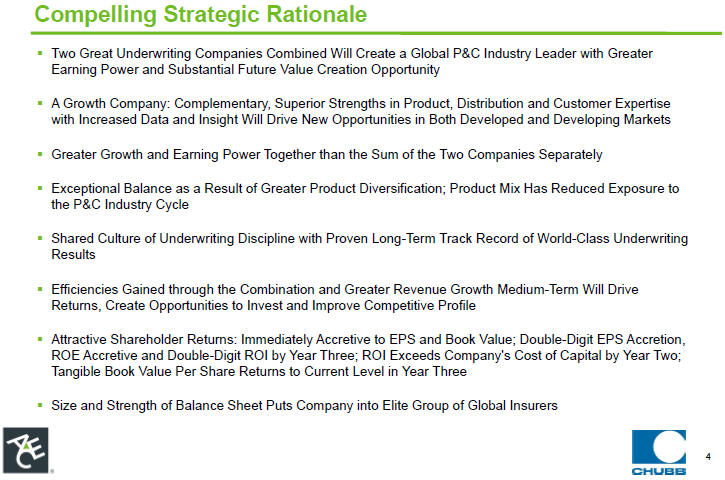
Two Great Underwriting Companies Combined Will Create a Global P&C Industry Leader with Greater Earning Power and Substantial Future Value Creation Opportunity |
| • |
|
A Growth Company: Complementary, Superior Strengths in Product, Distribution and Customer Expertise with Increased Data and Insight Will Drive New Opportunities in Both Developed and Developing Markets |
| • |
|
Greater Growth and Earning Power Together than the Sum of the Two Companies Separately |
| • |
|
Exceptional Balance as a Result of Greater Product Diversification; Product Mix Has Reduced Exposure to the P&C Industry Cycle |
| • |
|
Shared Culture of Underwriting Discipline with Proven Long-Term Track Record of World-Class Underwriting Results |
| • |
|
Efficiencies Gained through the Combination and Greater Revenue Growth Medium-Term Will Drive Returns, Create Opportunities to Invest and Improve Competitive Profile |
| • |
|
Attractive Shareholder Returns: Immediately Accretive to EPS and Book Value; Double-Digit EPS Accretion, ROE Accretive and Double-Digit ROI by Year Three; ROI Exceeds Company’s Cost of Capital by Year Two; Tangible Book Value Per Share Returns to Current Level in Year Three |
| • |
|
Size and Strength of Balance Sheet Puts Company into Elite Group of Global Insurers |
4
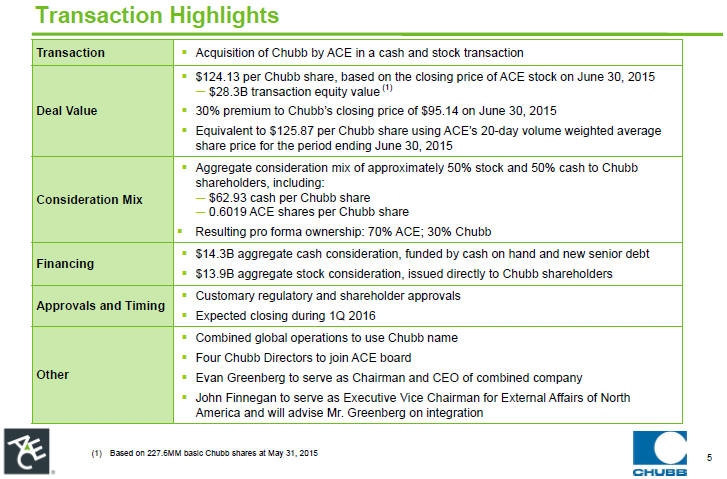
Transaction Highlights
| Transaction | • Acquisition of Chubb by ACE in a cash and stock transaction | |
| Deal Value | • $124.13 per Chubb share, based on the closing price of ACE stock on June 30, 2015 | |
| — $28.3B transaction equity value (1) | ||
| • 30% premium to Chubb’s closing price of $95.14 on June 30, 2015 | ||
| • Equivalent to $125.87 per Chubb share using ACE’s 20-day volume weighted average share price for the period ending June 30, 2015 | ||
| Consideration Mix | • Aggregate consideration mix of approximately 50% stock and 50% cash to Chubb shareholders, including: | |
| — $62.93 cash per Chubb share | ||
| — 0.6019 ACE shares per Chubb share | ||
| • Resulting pro forma ownership: 70% ACE; 30% Chubb | ||
| Financing | • $14.3B aggregate cash consideration, funded by cash on hand and new senior debt | |
| • $13.9B aggregate stock consideration, issued directly to Chubb shareholders | ||
| Approvals and Timing | • Customary regulatory and shareholder approvals | |
| • Expected closing during 1Q 2016 | ||
| Other | • Combined global operations to use Chubb name | |
| • Four Chubb Directors to join ACE board | ||
| • Evan Greenberg to serve as Chairman and CEO of combined company | ||
| • John Finnegan to serve as Executive Vice Chairman for External Affairs of North | ||
| America and will advise Mr. Greenberg on integration |
| (1) | Based on 227.6MM basic Chubb shares at May 31, 2015 |
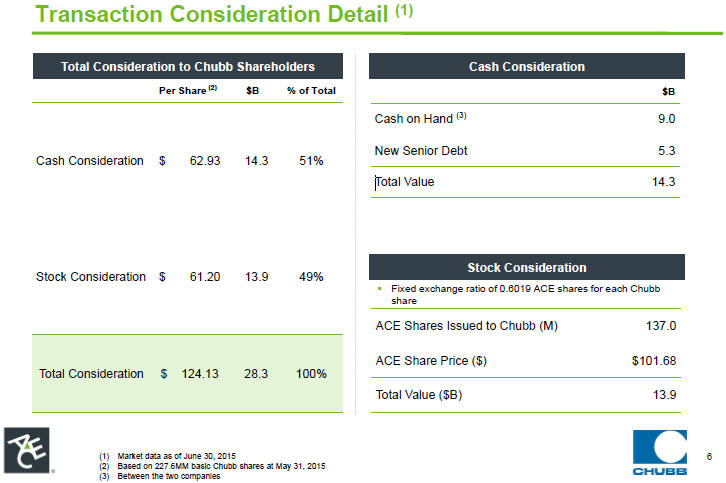
Transaction Consideration Detail (1)
| Total Consideration to Chubb Shareholders | ||||||||||||
| Per Share (2) | $B | % of Total | ||||||||||
| Cash Consideration | $ | 62.93 | 14.3 | 51 | % | |||||||
| Stock Consideration | $ | 61.20 | 13.9 | 49 | % | |||||||
| Total Consideration | $ | 124.13 | 28.3 | 100 | % | |||||||
| Cash Consideration | ||||||||||||
| $B | ||||||||||||
| Cash on Hand (3) | 9.0 | |||||||||||
| New Senior Debt | 5.3 | |||||||||||
| Total Value | 14.3 | |||||||||||
| Stock Consideration | ||||||||||||
| • Fixed exchange ratio of 0.6019 ACE shares for each Chubb share | ||||||||||||
| ACE Shares Issued to Chubb (M) | 137.0 | |||||||||||
| ACE Share Price ($) | $ | 101.68 | ||||||||||
| Total Value ($B) | 13.9 | |||||||||||
| (1) | Market data as of June 30, 2015 |
| (2) | Based on 227.6MM basic Chubb shares at May 31, 2015 |
| (3) | Between the two companies |
Transaction Provides Significant Value to Chubb Shareholders
¡ Provides significant value to shareholders today and as part of combined business
- Attractive premium
- Significant and immediate value
- Upside potential
- Number of strategic benefits (overview)
- Enhanced earning power and growth/value creation opportunities
¡ Compelling transaction for Chubb
7
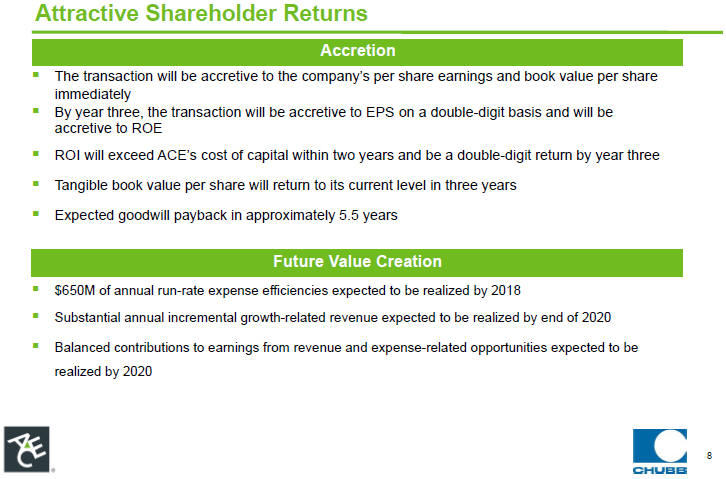
Attractive Shareholder Returns
Accretion
¡ The transaction will be accretive to the company’s per share earnings and book value
per share immediately
¡ By year three, the transaction will be accretive to EPS on a double-digit basis and
will be accretive to ROE
¡ ROI will exceed ACE’s cost of capital within two years and be a
double-digit return by year three
¡ Tangible book value per share will return to its current level in three
years
¡ Expected goodwill payback in approximately 5.5 years
Future Value Creation
¡ $650M of annual
run-rate expense efficiencies expected to be realized by 2018
¡ Substantial annual
incremental growth-related revenue expected to be realized by end of 2020
¡ Balanced contributions to earnings
from revenue and expense-related opportunities expected to be realized by 2020
8
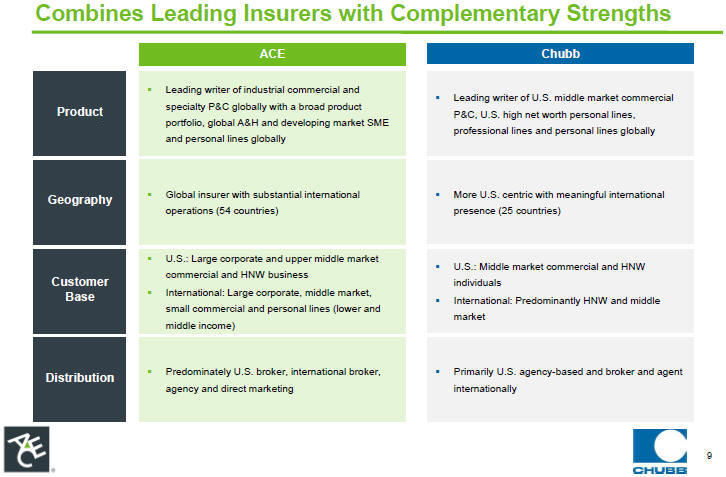
Combines Leading Insurers with Complementary Strengths
| ACE | Chubb | |||||||||||||
| ¡ | |
Leading writer of industrial commercial and |
|
|||||||||||
| ¡ | |
Leading writer of U.S. middle market commercial |
| |||||||||||
| |
specialty P&C globally with a broad product |
|
||||||||||||
| Product | |
P&C, U.S. high net worth personal lines, |
| |||||||||||
| |
portfolio, global A&H and developing market SME |
|
||||||||||||
| |
professional lines and personal lines globally |
| ||||||||||||
| |
and personal lines globally |
|
||||||||||||
| Geography | ¡ | |
Global insurer with substantial international |
|
¡ | |
More U.S. centric with meaningful international |
| ||||||
| |
operations (54 countries) |
|
|
presence (25 countries) |
| |||||||||
| ¡ | |
U.S.: Large corporate and upper middle market |
|
|||||||||||
| ¡ | |
U.S.: Middle market commercial and HNW |
| |||||||||||
| |
commercial and HNW business |
|
||||||||||||
| Customer | individuals | |||||||||||||
| Base | ¡ | |
International: Large corporate, middle market, |
|
¡ | |
International: Predominantly HNW and middle |
| ||||||
| |
small commercial and personal lines (lower and |
|
||||||||||||
| market | ||||||||||||||
| middle income) | ||||||||||||||
| Distribution | ¡ | |
Predominately U.S. broker, international broker, |
|
¡ | |
Primarily U.S. agency-based and broker and agent |
| ||||||
| |
agency and direct marketing |
|
internationally | |||||||||||
9
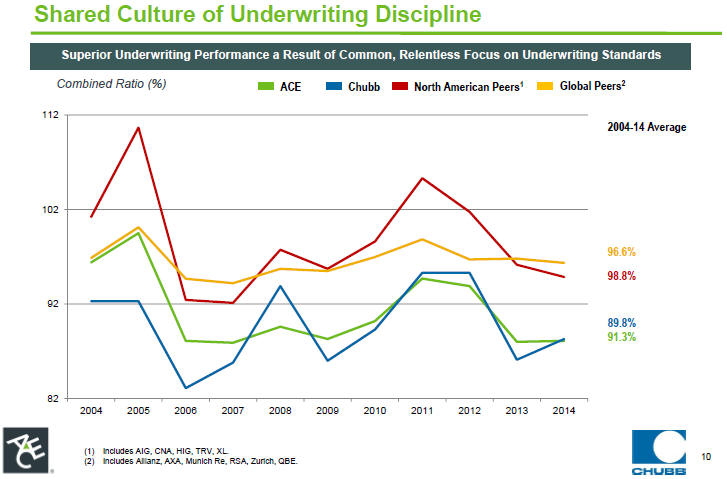
Shared Culture of Underwriting Discipline
Superior
Underwriting Performance a Result of Common, Relentless Focus on Underwriting Standards
Combined Ratio (%) ACE Chubb North American Peers1 Global Peers2
112
102
92
82
2004-14 Average
96.6%
98.8%
89.8%
91.3%
2004 2005 2006 2007 2008 2009 2010 2011 2012 2013 2014
| (1) | Includes AIG, CNA, HIG, TRV, XL. |
| (2) | Includes Allianz, AXA, Munich Re, RSA, Zurich, QBE. |
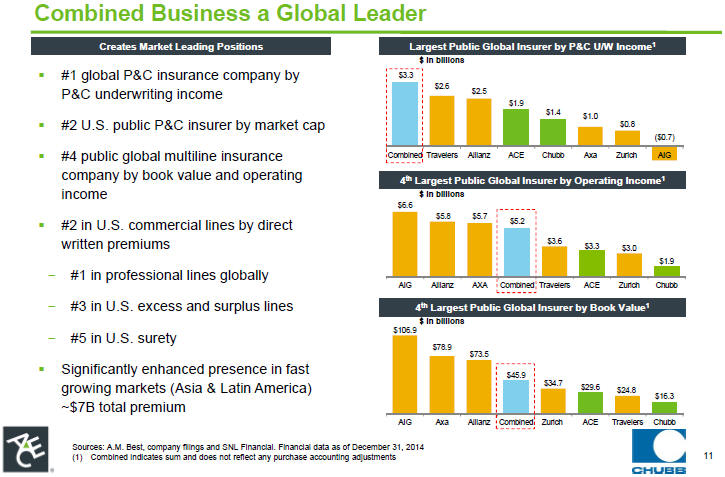
Combined Business a Global Leader
Creates Market
Leading Positions
¡ #1 global P&C insurance company by P&C underwriting income
¡ #2 U.S. public P&C insurer by market cap
¡ #4 public global multiline insurance company by book value and operating income
¡ #2 in U.S. commercial lines by direct written premiums
- #1 in professional lines globally
- #3 in U.S. excess and surplus lines
- #5 in U.S. surety
¡ Significantly
enhanced presence in fast growing markets (Asia & Latin America)
~$7B total premium
Largest Public Global Insurer by P&C U/W Income1
$ in billions $3.3 $2.6 $2.5 $1.9 $1.4
$1.0 $0.8
($0.7) Combined Travelers Allianz ACE Chubb Axa Zurich AIG
4th
Largest Public Global Insurer by Operating Income1
$ in billions $6.6 $5.8 $5.7 $5.2
$3.6 $3.3 $3.0 $1.9
AIG Allianz AXA Combined Travelers ACE Zurich Chubb
4th Largest Public Global Insurer by Book Value1
$ in billions $106.9
$78.9 $73.5 $45.9 $34.7 $29.6 $24.8 $16.3
AIG Axa Allianz Combined Zurich ACE Travelers Chubb
Sources: A.M. Best, company filings and SNL Financial. Financial data as of December 31, 2014 (1) Combined indicates sum and does not reflect any
purchase accounting adjustments
11
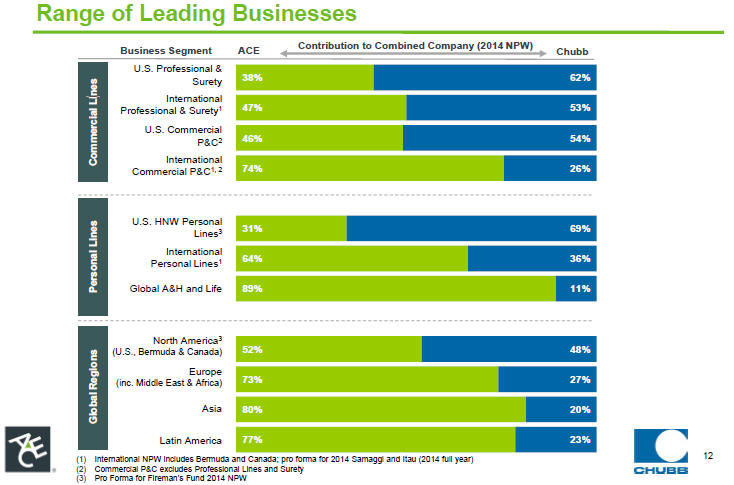
Range of Leading Businesses
Business Segment ACE
Contribution to Combined Company (2014 NPW)
Chubb
U.S. Professional &
Surety 38% 62% Lines International Professional & Surety1 47% 53% U.S. Commercial P&C2 46% 54% Commercial International 74% 26%
Commercial P&C1, 2
U.S. HNW Personal Lines3
31% 69%
International
Lines1 64% 36%
Personal Lines
Global A&H and Life 89% 11%
Global Regions
North America3
(U.S., Bermuda & Canada) 52% 48%
Europe
(inc. Middle East & Africa) 73% 27%
Asia 80% 20%
Latin America 77% 23%
(1) International NPW includes Bermuda and Canada; pro forma for 2014
Samaggi and Itau (2014 full year)
(2) Commercial P&C excludes Professional Lines and Surety
(3) Pro Forma for Fireman’s Fund 2014 NPW
12
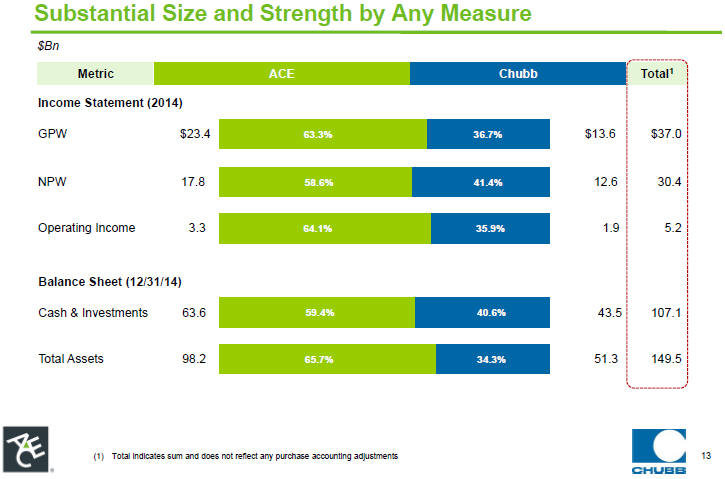
Substantial Size and Strength by Any Measure
$Bn
Metric ACE Chubb Total1
Income Statement (2014)
GPW $23.4 63.3% 36.7% $13.6 $37.0 NPW 17.8 58.6% 41.4% 12.6 30.4 Operating Income 3.3 64.1% 35.9% 1.9 5.2
Balance Sheet (12/31/14)
Cash & Investments 63.6 59.4% 40.6% 43.5 107.1
Total Assets 98.2 65.7% 34.3% 51.3 149.5
| (1) | Total indicates sum and does not reflect any purchase accounting adjustments |
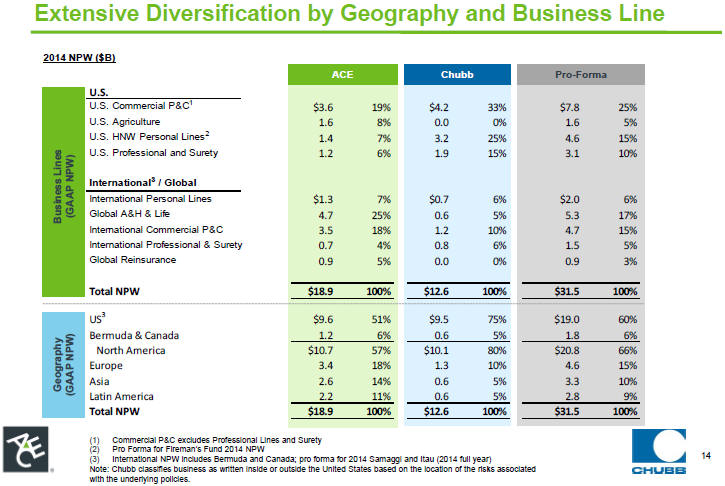
Extensive Diversification by Geography and Business Line
2014 NPW ($B)
ACE Chubb Pro-Forma
U.S.
U.S. Commercial P&C1 $3.6 19% $4.2 33% $7.8 25%
U.S. Agriculture 1.6 8% 0.0 0% 1.6 5% U.S. HNW Personal Lines2
1.4 7% 3.2 25% 4.6 15%
U.S. Professional and Surety 1.2 6% 1.9 15% 3.1 10%
International3 / Global
International Personal Lines $1.3 7% $0.7 6% $2.0 6% Business Lines (GAAP NPW) Global A&H & Life 4.7 25% 0.6 5% 5.3 17% International Commercial P&C
3.5 18% 1.2 10% 4.7 15% International Professional & Surety 0.7 4% 0.8 6% 1.5 5% Global Reinsurance 0.9 5% 0.0 0% 0.9 3%
Total NPW $18.9 100% $12.6 100%
$31.5 100%
US3 $9.6 51% $9.5 75% $19.0 60% Bermuda & Canada 1.2 6% 0.6 5%
1.8 6% Geography (GAAP NPW) North America $10.7 57% $10.1 80% $20.8 66% Europe 3.4 18% 1.3 10% 4.6 15% Asia 2.6 14% 0.6 5% 3.3 10% Latin America 2.2 11% 0.6 5% 2.8 9%
Total NPW $18.9 100% $12.6 100% $31.5 100%
| (1) | Commercial P&C excludes Professional Lines and Surety (2) Pro Forma for Fireman’s Fund 2014 NPW |
| (3) | International NPW includes Bermuda and Canada; pro forma for 2014 Samaggi and Itau (2014 full year) |
Note: Chubb classifies business as written inside or outside the United States based on the location of the risks
associated with the underlying policies.
14
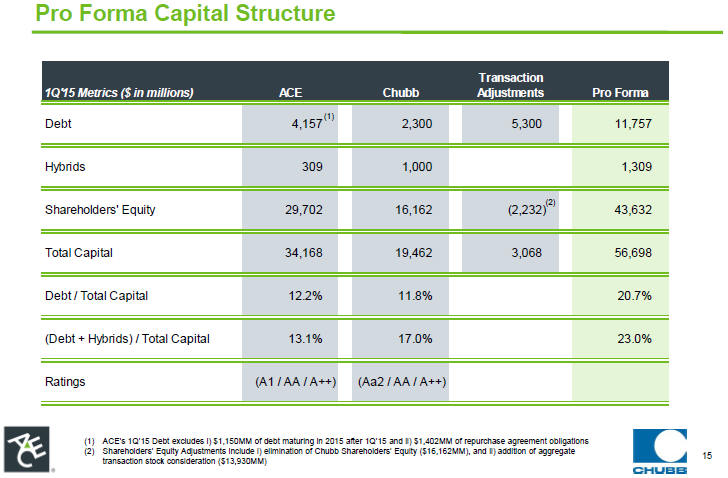
Pro Forma Capital Structure
| Transaction | ||||||||||||||||
| 1Q’15 Metrics ($ in millions) | ACE | Chubb | Adjustments | Pro Forma |
||||||||||||
| Debt | 4,157 | (1) | 2,300 | 5,300 | 11,757 | |||||||||||
| Hybrids | 309 | 1,000 | 1,309 | |||||||||||||
| Shareholders’ Equity | 29,702 | 16,162 | (2,232 | )(2) | 43,632 | |||||||||||
| Total Capital | 34,168 | 19,462 | 3,068 | 56,698 | ||||||||||||
| Debt / Total Capital | 12.2 | % | 11.8 | % | 20.7 | % | ||||||||||
| (Debt + Hybrids) / Total Capital | 13.1 | % | 17.0 | % | 23.0 | % | ||||||||||
| Ratings | |
(A1 / AA / A++ |
) |
|
(Aa2 / AA / A++ |
) |
||||||||||
(1) ACE’s 1Q’15 Debt excludes i) $1,150MM of debt maturing in 2015 after 1Q’15 and ii) $1,402MM of repurchase
agreement obligations (2) Shareholders’ Equity Adjustments include i) elimination of Chubb Shareholders’ Equity ($16,162MM), and ii) addition of aggregate transaction stock consideration ($13,930MM)
15
Conclusion
¡ Two Great Underwriting Companies Combined Will Create a Global P&C Industry Leader with Greater Earning
Power and Substantial Future Value Creation Opportunity
¡ A Growth Company: Complementary, Superior Strengths
in Product, Distribution and Customer Expertise with Increased Data and Insight Will Drive New Opportunities in Both Developed and Developing Markets
¡ Greater Growth and Earning Power Together than the Sum of the Two Companies Separately
¡ Exceptional Balance as a Result of Greater Product Diversification; Product Mix Has Reduced Exposure to the P&C Industry Cycle
¡ Shared Culture of Underwriting Discipline with Proven Long-Term Track Record of World-Class Underwriting Results
¡ Efficiencies Gained through the Combination and Greater Revenue Growth Medium-Term Will Drive Returns, Create Opportunities to
Invest and Improve Competitive Profile
¡ Attractive Shareholder Returns: Immediately Accretive to EPS and Book
Value; Double-Digit EPS Accretion, ROE Accretive and Double-Digit ROI by Year Three; ROI Exceeds Company’s Cost of Capital by Year Two; Tangible Book Value Per Share Returns to Current Level in Year Three
¡ Size and Strength of Balance Sheet Puts Company into Elite Group of Global Insurers
16
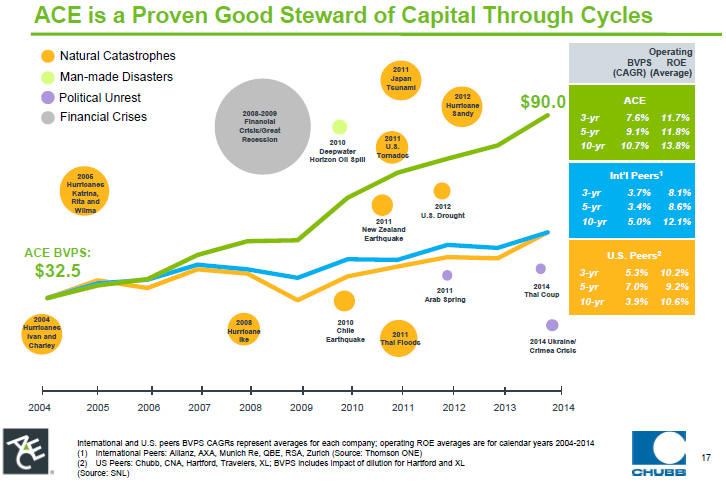
ACE is a Proven Good Steward of Capital Through Cycles
Natural Catastrophes Operating
BVPS ROE (CAGR) (Average)
Man-made Disasters 2011 Japan Tsunami
Political Unrest ACE
2012 Hurricane Sandy $90.0
Financial Crises 2008-2009 3-yr 7.6% 11.7%
Financial
Crisis/Great 5-yr 9.1% 11.8%
Recession
2011 U.S. Tornados
10-yr 10.7% 13.8%
2010 Deepwater Horizon Oil Spill
2005 Int’l Peers1
Hurricanes
Katrina, 3-yr 3.7% 8.1%
Rita and
2012 5-yr 3.4% 8.6%
Wilma
2011 U.S. Drought
10-yr 5.0% 12.1%
ACE BVPS: U.S. Peers2
$32.5 3-yr 5.3% 10.2% 2014 5-yr 7.0% 9.2%
2011 New Zealand Earthquake
Thai Coup
Arab Spring 10-yr 3.9% 10.6%
2004 2008 2010
Hurricanes Hurricane Chile 2011 Ivan and Ike Earthquake
Thai Floods 2014 Ukraine/ Charley
Crimea Crisis
2004 2005 2006 2007 2008 2009 2010 2011 2012 2013 2014
International and U.S. peers BVPS CAGRs represent averages for each company; operating ROE averages are for calendar years 2004-2014 (1) International Peers:
Allianz, AXA, Munich Re, QBE, RSA, Zurich (Source: Thomson ONE) (2) US Peers: Chubb, CNA, Hartford, Travelers, XL; BVPS includes impact of dilution for Hartford and XL
(Source: SNL)
17