Attached files
| file | filename |
|---|---|
| 8-K - 8-K - CHC Group Ltd. | a8kre_q4earnings.htm |
| EX-99.1 - EXHIBIT 99.1 - CHC Group Ltd. | exhibit991earningsrelease.htm |
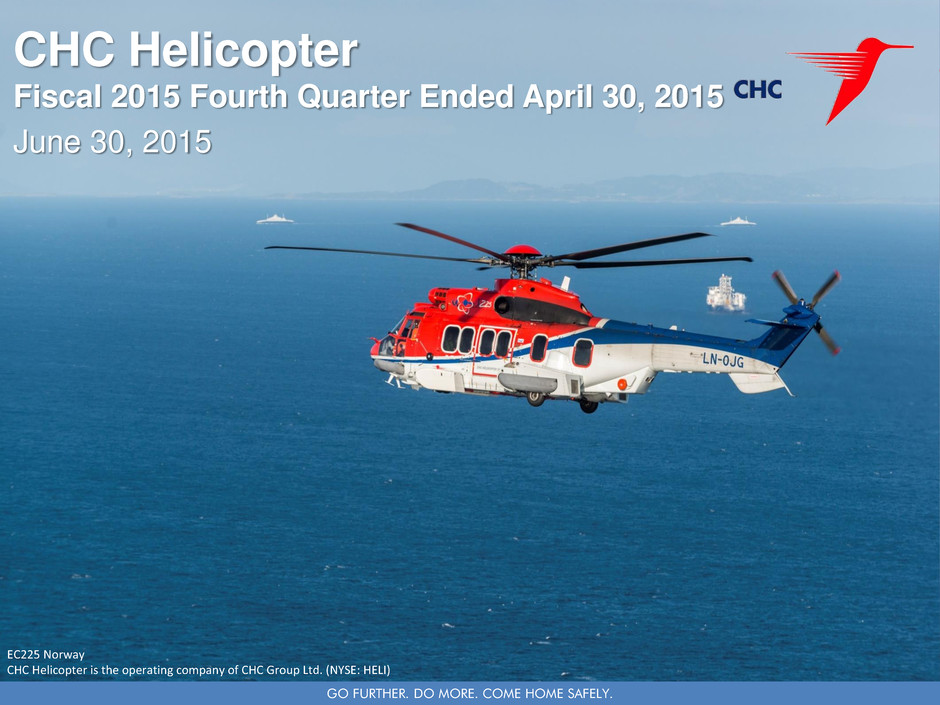
GO FURTHER. DO MORE. COME HOME SAFELY. Page 1GO FURTHER. DO MO E. OME HOME SAFELY. EC225 Norway CHC Helicopter is the operating company of CHC Group Ltd. (NYSE: HELI) CHC Helicopter Fiscal 2015 Fourth Quarter Ended April 30, 2015 June 30, 2015
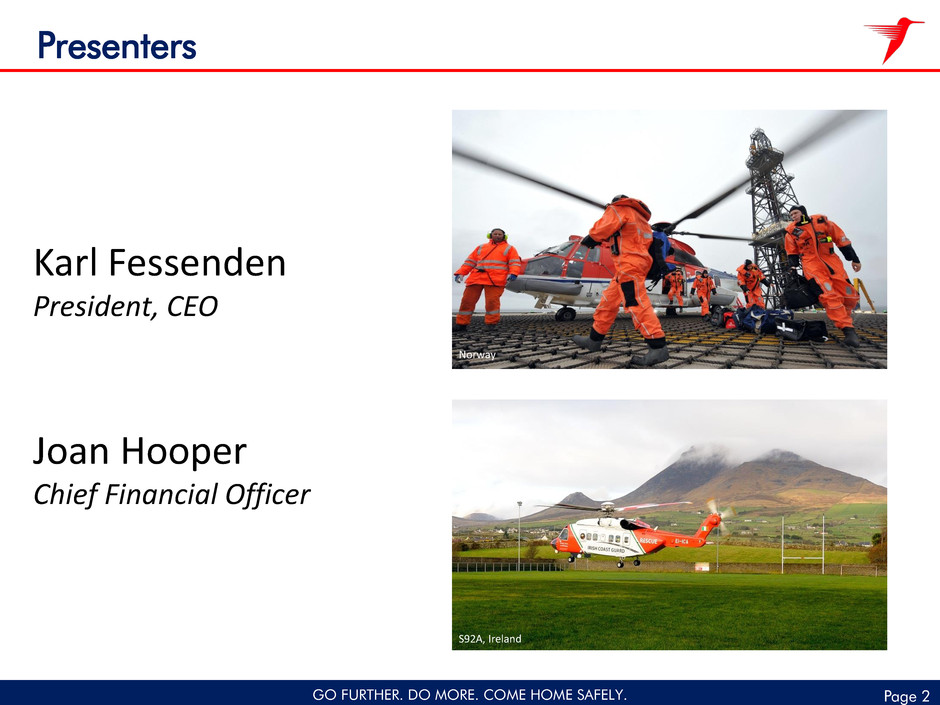
GO FURTHER. DO MORE. COME HOME SAFELY. Page 2 Presenters Karl Fessenden President, CEO Joan Hooper Chief Financial Officer Rio de Janeiro, Brazil S92A, Ireland Norway

Page 3GO FURTHER. DO MORE. COME HOME SAFELY. Forward-Looking Statements and non-GAAP Financial Measures This presentation contains forward-looking statements and information within the meaning of certain securities laws, including the “safe harbor” provision of the United States Private Securities Litigation Reform Act of 1995, the United States Securities Act of 1933, as amended, the United States Securities Exchange Act of 1934, as amended and other applicable securities legislation. All statements, other than statements of historical fact included in this press release regarding the benefits of the transactions, as well as, our strategy, future operations, projections, conclusions, forecasts and other statements are “forward-looking statements”. While these forward-looking statements represent our best current judgment, actual results could differ materially from the conclusions, forecasts or projections contained in the forward-looking statements. Certain material factors or assumptions were applied in drawing a conclusion or making a forecast or projection in the forward-looking information contained herein. Such factors include: volatility in the oil and gas sector generally, and the potential impact of such volatility on offshore exploration and production, particularly on demand for offshore transportation services, competition in the markets we serve, our ability to secure and maintain long-term support contracts, our ability to maintain standards of acceptable safety performance, exchange rate fluctuations, political, economic, and regulatory uncertainty, problems with our non-wholly owned entities, including potential conflicts with the other owners of such entities, exposure to credit risks, our ability to continue funding our working capital requirements, risks inherent in the operation of helicopters, unanticipated costs or cost increases associated with our business operations, trade industry exposure, inflation, ability to continue maintaining government issued licenses, necessary aircraft or insurance, loss of key personnel, work stoppages due to labor disputes, and future material acquisitions or dispositions. Should one or more of these risks or uncertainties materialize, or should underlying assumptions prove incorrect, actual outcomes may vary materially from those indicated. The Company disclaims any intentions or obligations to update or revise any forward-looking statements, whether as a result of new information, future events or otherwise. Please refer to our annual report on Form 10-K and quarterly reports on Form 10-Q, and our other filings, in particular any discussion of risk factors or forward-looking statements, which are filed with the SEC and available free of charge at the SEC’s website (www.sec.gov), for a full discussion of the risks and other factors that may impact any estimates or forward-looking statements made herein. Adjusted EBITDAR excluding special items is referred to in this document as EBITDAR.

GO FURTHER. DO MORE. COME HOME SAFELY. Page 4 Accident-Rate Benchmarking CHC’s five-year rolling average as of May 1 is 0.38 accidents/100,000 flight hours N u m b er o f ac cid en ts/ 1 0 0 K f lig h t h ou rs Safety: Maintaining Leading Performance • ICAO “accident” definition: flight incident resulting in fatal or serious injury, or aircraft lost or sustaining damage or structural failure. • Offshore average rate per 2009 OGP Report, Page 6. • Twin Helicopters average rate inferred from worldwide accident-rate table, 2009 OGP Report, Page 4. • CHC rate includes the October 2012 controlled landing and August 2013 accident, both in North Sea. Industry wide statistics 1.8 0.8 0.38 0 0.2 0.4 0.6 0.8 1 1.2 1.4 1.6 1.8 2 Offshore Operations Twin Helicopters CHC
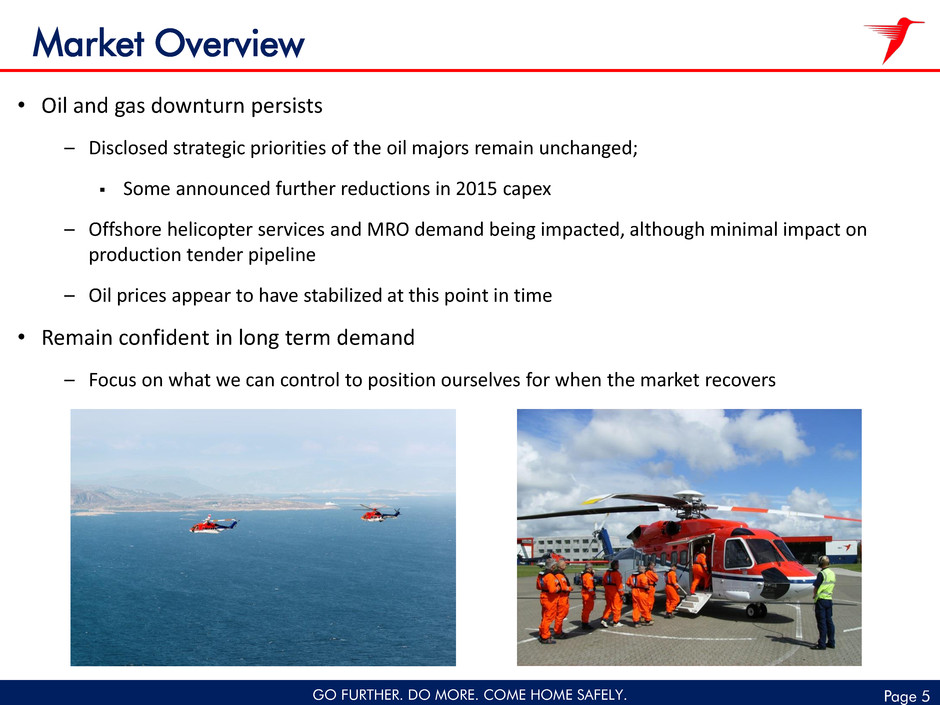
Page 5GO FURTHER. DO MORE. COME HOME SAFELY. Market Overview • Oil and gas downturn persists – Disclosed strategic priorities of the oil majors remain unchanged; Some announced further reductions in 2015 capex – Offshore helicopter services and MRO demand being impacted, although minimal impact on production tender pipeline – Oil prices appear to have stabilized at this point in time • Remain confident in long term demand – Focus on what we can control to position ourselves for when the market recovers

GO FURTHER. DO MORE. COME HOME SAFELY. Page 6 CHC’s customer base is diversified and high quality Blue Chip Customer Base • Well capitalized major national and independent oil & gas companies • Top 10 customers represent approximately 65% of revenue1 • Long-standing customer relationships 1. As of FY 15 Top Ten

GO FURTHER. DO MORE. COME HOME SAFELY. Page 7 Strengthen competitive and financial position Financial priorities unchanged Reducing debt and enhancing capital efficiency Leverage unique capabilities and focus on relationships Customer partnerships Four Focus Areas Rigorous cost control without compromising safety In the midst of market uncertainty, we have sharpened our focus in four areas:

GO FURTHER. DO MORE. COME HOME SAFELY. Page 8 Improved Availability Availability Availability has been consistently higher in Fiscal 2015 compared to Fiscal 2014 Availability is based on CHC’s definition of maintenance availability and represents the percentage of aircraft in Helicopter Services available for revenue flights and excludes aircraft undergoing scheduled maintenance, major maintenance or not available for operation. 82% 84% 89% 90% 94% 94% 93% 94% 75% 80% 85% 90% 95% 100% Q1'14 Q2'14 Q3'14 Q4'14 Q1'15 Q2'15 Q3'15 Q4'15
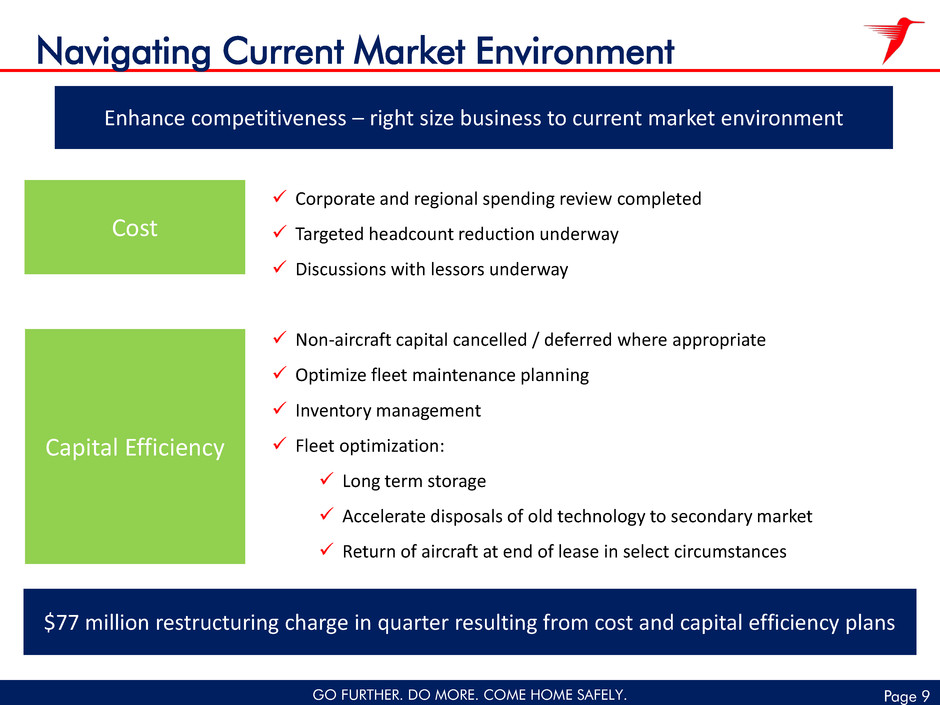
GO FURTHER. DO MORE. COME HOME SAFELY. Page 9 Navigating Current Market Environment Corporate and regional spending review completed Targeted headcount reduction underway Discussions with lessors underway Non-aircraft capital cancelled / deferred where appropriate Optimize fleet maintenance planning Inventory management Fleet optimization: Long term storage Accelerate disposals of old technology to secondary market Return of aircraft at end of lease in select circumstances Enhance competitiveness – right size business to current market environment Cost Capital Efficiency $77 million restructuring charge in quarter resulting from cost and capital efficiency plans

GO FURTHER. DO MORE. COME HOME SAFELY. Page 10 1. Liquidity is a non-GAAP financial measure which was comprised at FY15 Q4 of cash and cash equivalents of $134 million, unused capacity in the revolver of $342 million, net of letters of credit of $33 million, plus undrawn overdraft facilities of $24 million. 2. Adjusted Net Debt is a non-GAAP financial measure calculated as net debt plus NPV of lease commitments at quarter end presented discounted at 9%. See slide 21 for adjusted net debt reconciliation. 3. Adjusted Leverage Ratio is a non-GAAP financial measure calculated as Adjusted Net Debt divided by trailing twelve months Adjusted EBITDAR excluding special items. • Majority of proceeds from Clayton, Dubilier & Rice (CD&R) deployed ‒ Repurchased ~$21 million of Unsecured Notes in tender offer during fourth quarter • Total bond repurchases during the year of $320 million reduced annualized interest costs by ~$30 million • Liquidity(1) strong at $500 million • Adjusted leverage ratio reduced to 5.0x from prior year end of 5.3x • Asset backed loan facility signed after year end – additional $145 million of liquidity Robust year end liquidity of $500 million & $145 million new credit commitments post year end Strengthened Balance Sheet (in $US millions except leverage ratio) FY14 Q4 FY15 Q4 $ Change Cash and Cash Equivalents $303 $134 $(168) Liquidity(1) 651 500 (151) Adjusted Net Debt(2) 2,497 2,307 (190) Adjusted Leverage Ratio(3) 5.3x 5.0x (0.3)x
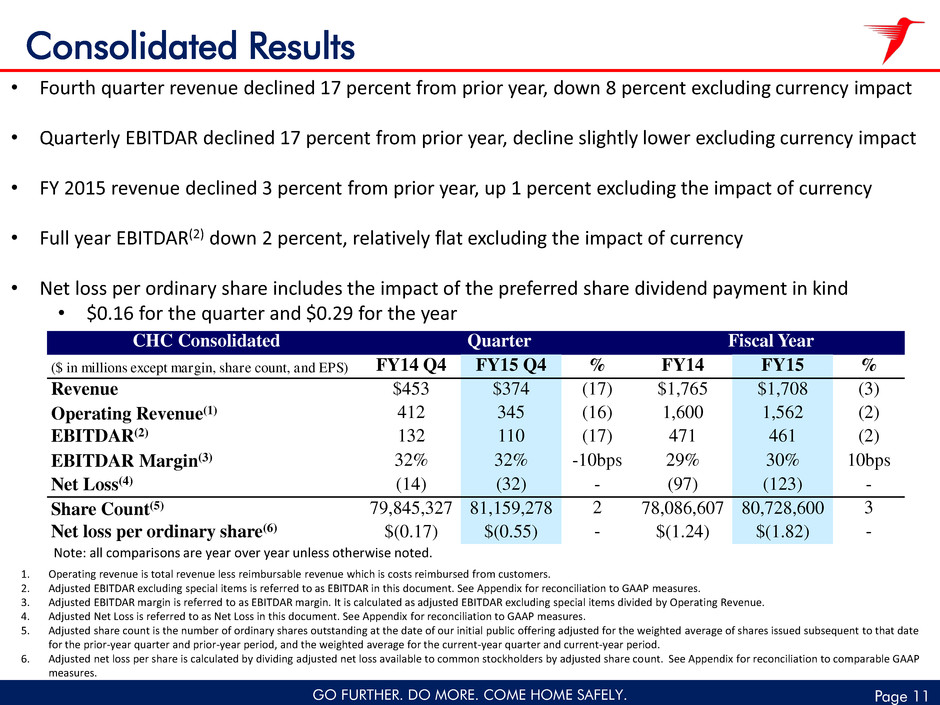
Page 11GO FURTHER. DO MORE. COME HOME SAFELY. Consolidated Results Note: all comparisons are year over year unless otherwise noted. • Fourth quarter revenue declined 17 percent from prior year, down 8 percent excluding currency impact • Quarterly EBITDAR declined 17 percent from prior year, decline slightly lower excluding currency impact • FY 2015 revenue declined 3 percent from prior year, up 1 percent excluding the impact of currency • Full year EBITDAR(2) down 2 percent, relatively flat excluding the impact of currency • Net loss per ordinary share includes the impact of the preferred share dividend payment in kind • $0.16 for the quarter and $0.29 for the year CHC Consolidated Quarter Fiscal Year ($ in millions except margin, share count, and EPS) FY14 Q4 FY15 Q4 % FY14 FY15 % Revenue $453 $374 (17) $1,765 $1,708 (3) Operating Revenue(1) 412 345 (16) 1,600 1,562 (2) EBITDAR(2) 132 110 (17) 471 461 (2) EBITDAR Margin(3) 32% 32% -10bps 29% 30% 10bps Net Loss(4) (14) (32) - (97) (123) - Share Count(5) 79,845,327 81,159,278 2 78,086,607 80,728,600 3 Net loss per ordinary share(6) $(0.17) $(0.55) - $(1.24) $(1.82) - 1. Operating revenue is total revenue less reimbursable revenue which is costs reimbursed from customers. 2. Adjusted EBITDAR excluding special items is referred to as EBITDAR in this document. See Appendix for reconciliation to GAAP measures. 3. Adjusted EBITDAR margin is referred to as EBITDAR margin. It is calculated as adjusted EBITDAR excluding special items divided by Operating Revenue. 4. Adjusted Net Loss is referred to as Net Loss in this document. See Appendix for reconciliation to GAAP measures. 5. Adjusted share count is the number of ordinary shares outstanding at the date of our initial public offering adjusted for the weighted average of shares issued subsequent to that date for the prior-year quarter and prior-year period, and the weighted average for the current-year quarter and current-year period. 6. Adjusted net loss per share is calculated by dividing adjusted net loss available to common stockholders by adjusted share count. See Appendix for reconciliation to comparable GAAP measures.

Page 12GO FURTHER. DO MORE. COME HOME SAFELY. Helicopter Services (HS) 1. Adjusted EBITDAR margin is referred to as EBITDAR margin. It is calculated as adjusted EBITDAR divided by Operating Revenue. 2. Heavy Equivalent Rate (HE) is the 3rd party operating revenue from Helicopter Services segment divided by average HE count. 3. Our heavy and medium helicopters, are weighted at 100% and 50%, respectively, to arrive at a single HE count, excluding helicopters that are held for sale. • In the quarter, revenue decreased 16 percent, down 6 percent excluding the impact of currency ‒ Decline also driven by lower flying activity and lower reimbursable revenue • Fourth quarter EBITDAR dollars decreased 11 percent; ‒ Margin improvement primarily from foreign exchange • For the year, revenue decreased 4 percent, flat excluding the impact of currency • EBITDAR dollars up slightly on a 120 basis point increase in margin Helicopter Services Quarter Fiscal Year ($ in millions except margin and HE count) FY14 Q4 FY15 Q4 % FY14 FY15 % Operating Revenue $364 $312 (14) $1,453 $1,412 (3) Reimbursable revenue 41 29 (29) 165 145 (12) Total External Revenue 405 341 (16) 1,618 1,557 (4) EBITDAR 140 124 (11) 514 516 — EBITDAR Margin(1) 38% 40% 140bps 35% 37% 120bps HE Rate(2) $2,242 $1,984 (12) $8,822 $8,830 — Average HE Count(3) 162.5 157.3 (3) 164.7 159.9 (3)

Page 13GO FURTHER. DO MORE. COME HOME SAFELY. Heli-One Boundary Bay, Canada Rzeszow , Poland • In the quarter, third-party revenue decreased $15 million or 32 percent ‒ Due to decrease in third party flying hours and completion timing of some maintenance work • Fourth quarter EBITDAR declined $6 million due to a decrease in 3rd party and internal MRO work • Full year revenue increased $3 million or 2 percent • Full year EBITDAR declined $7 million due to a decrease in internal work for Helicopter Services Rzeszow, Poland Heli-One Quarter Fiscal Year ($ in millions except margin) FY14 Q4 FY15 Q4 % FY14 FY15 % External Revenue $48 $33 (32) $147 $150 2 Inter-Segment revenue 46 28 (40) 160 108 (33) Total Revenue 94 60 (36) 307 258 (16) EBITDAR 10 4 (62) 29 23 (23) EBITDAR Margin 11% 7% -440bps 10% 9% -80bps

GO FURTHER. DO MORE. COME HOME SAFELY. Page 14 Free Cash Flow 1. Free cash flow is a non-GAAP financial measure defined as cash provided by operating activities less cash used in investing activities. See slide 17 for details. 2. Adjusted free cash flow is defined as free cash flow adjusted for special items, restricted cash, and impact on free cash flow from CD&R investment. See slide 17 for details. • Free Cash Flow(1) decline of $254 million driven by: ‒ Higher capex due to increase in mix of owned aircraft ($203 million) ‒ Timing of working capital ($33 million) ‒ Realized foreign currency loss on derivative contracts ($17 million) • Adjusted FCF(2) of $(164) million down $38 million due primarily to timing of working capital ($33 million) (in $US millions) FY14 FY15 $ Change Cash Flow Provided By / (Used in) Operating Activities 12 (75) (88) Cash Flow Used in Investing Activities (141) (307) (166) Free Cash Flow(1) (128) (383) (254) Adjusted Free Cash Flow(2) (126) (164) (38)

GO FURTHER. DO MORE. COME HOME SAFELY. Page 15 4. Financial Priorities Unchanged: Strengthen Balance Sheet and De-levering Free Cash Flow Positive Balanced Growth 2. Optimistic about Long-Term Demand Proactively Adapting to Current Market Realities 3. Persistent Focus on Cost and Capital Efficiency Enhance Competitiveness Key Takeaways 1. Continuously Committed to Enhance Safety

Page 16GO FURTHER. DO MORE. COME HOME SAFELY. APPENDIX
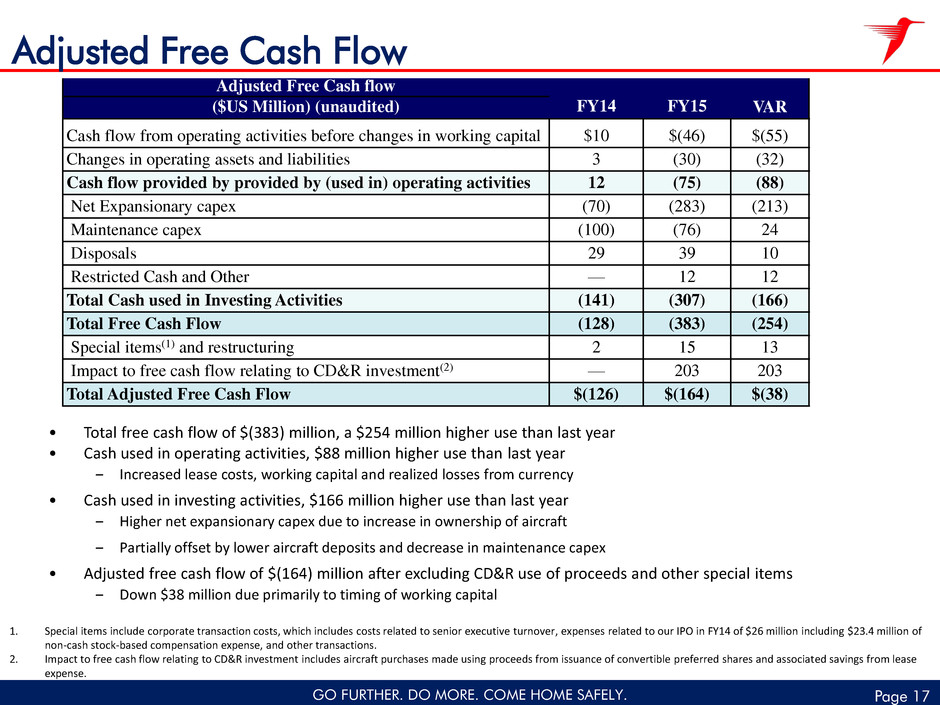
GO FURTHER. DO MORE. COME HOME SAFELY. Page 17 Adjusted Free Cash Flow • Total free cash flow of $(383) million, a $254 million higher use than last year • Cash used in operating activities, $88 million higher use than last year ‒ Increased lease costs, working capital and realized losses from currency • Cash used in investing activities, $166 million higher use than last year ‒ Higher net expansionary capex due to increase in ownership of aircraft ‒ Partially offset by lower aircraft deposits and decrease in maintenance capex • Adjusted free cash flow of $(164) million after excluding CD&R use of proceeds and other special items ‒ Down $38 million due primarily to timing of working capital 1. Special items include corporate transaction costs, which includes costs related to senior executive turnover, expenses related to our IPO in FY14 of $26 million including $23.4 million of non-cash stock-based compensation expense, and other transactions. 2. Impact to free cash flow relating to CD&R investment includes aircraft purchases made using proceeds from issuance of convertible preferred shares and associated savings from lease expense. Adjusted Free Cash flow ($US Million) (unaudited) FY14 FY15 VAR Cash flow from operating activities before changes in working capital $10 $(46) $(55) Changes in operating assets and liabilities 3 (30) (32) Cash flow provided by provided by (used in) operating activities 12 (75) (88) Net Expansionary capex (70) (283) (213) Maintenance capex (100) (76) 24 Disposals 29 39 10 Restricted Cash and Other — 12 12 Total Cash used in Investing Activities (141) (307) (166) Total Free Cash Flow (128) (383) (254) Special items(1) and restructuring 2 15 13 Impact to free cash flow relating to CD&R investment(2) — 203 203 Total Adjusted Free Cash Flow $(126) $(164) $(38)

Page 18GO FURTHER. DO MORE. COME HOME SAFELY. EBITDAR - Non-GAAP Reconciliation (Expressed in thousands of United States dollars) (Unaudited) EBITDAR: Reconciliation to GAAP measures Three months ended Year ended April 30, 2014 April 30, 2015 April 30, 2014 April 30, 2015 Helicopter Services $ 139,644 $ 123,811 $ 513,991 $ 516,477 Heli-One 10,235 3,909 29,218 22,534 Corporate (17,248) (19,628) (95,087) (83,857) Eliminations (1,739) (1,390) (3,134) (2,027) Adjusted EBITDAR 130,892 106,702 444,988 453,127 Helicopter lease and associated costs (61,232) (68,407) (227,893) (262,748) Depreciation (38,415) (45,981) (144,573) (143,653) Restructuring expense — (76,906) — (80,347) Asset impairments (2,977) (3,708) (25,933) (553,650) Loss on disposal of assets (4,688) (2,473) (6,631) (13,407) Operating income (loss) 23,580 (90,773) 39,958 (600,678) Interest on long-term debt (35,586) (26,898) (153,222) (126,481) Foreign exchange gain (loss) 18,448 1,682 (6,028) (25,153) Other financing charges (21,638) (3,690) (23,253) (17,841) Loss before income tax (15,196) (119,679) (142,545) (770,153) Income tax recovery (expense) (10,885) 694 (28,374) (24,607) Net loss $ (26,081) $ (118,985) $ (170,919) $ (794,760) Net earnings (loss) attributable to: Controlling interest $ (23,224) $ (107,987) $ (172,548) $ (805,151) Non-controlling interests (2,857) (10,998) 1,629 10,391 Net loss $ (26,081) $ (118,985) $ (170,919) $ (794,760)
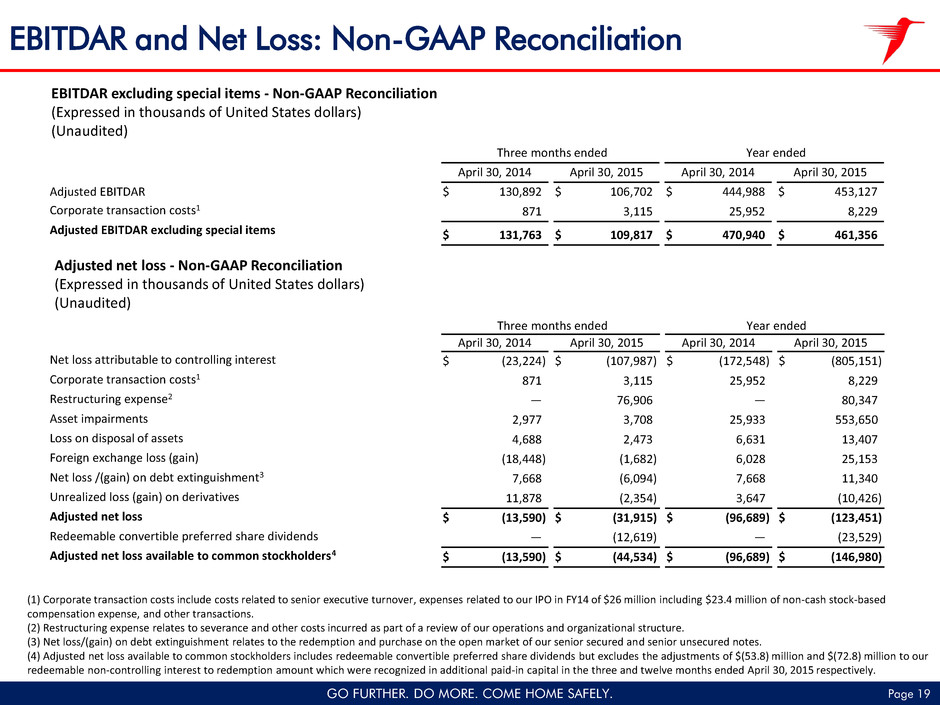
Page 19GO FURTHER. DO MORE. COME HOME SAFELY. EBITDAR and Net Loss: Non-GAAP Reconciliation EBITDAR excluding special items - Non-GAAP Reconciliation (Expressed in thousands of United States dollars) (Unaudited) Adjusted net loss - Non-GAAP Reconciliation (Expressed in thousands of United States dollars) (Unaudited) (1) Corporate transaction costs include costs related to senior executive turnover, expenses related to our IPO in FY14 of $26 million including $23.4 million of non-cash stock-based compensation expense, and other transactions. (2) Restructuring expense relates to severance and other costs incurred as part of a review of our operations and organizational structure. (3) Net loss/(gain) on debt extinguishment relates to the redemption and purchase on the open market of our senior secured and senior unsecured notes. (4) Adjusted net loss available to common stockholders includes redeemable convertible preferred share dividends but excludes the adjustments of $(53.8) million and $(72.8) million to our redeemable non-controlling interest to redemption amount which were recognized in additional paid-in capital in the three and twelve months ended April 30, 2015 respectively. Three months ended Year ended April 30, 2014 April 30, 2015 April 30, 2014 April 30, 2015 Net loss attributable to controlling interest $ (23,224) $ (107,987) $ (172,548) $ (805,151) Corporate transaction costs1 871 3,115 25,952 8,229 Restructuring expense2 — 76,906 — 80,347 Asset impairments 2,977 3,708 25,933 553,650 Loss on disposal of assets 4,688 2,473 6,631 13,407 Foreign exchange loss (gain) (18,448) (1,682) 6,028 25,153 Net loss /(gain) on debt extinguishment3 7,668 (6,094) 7,668 11,340 Unrealized loss (gain) on derivatives 11,878 (2,354) 3,647 (10,426) Adjusted net loss $ (13,590) $ (31,915) $ (96,689) $ (123,451) Redeemable convertible preferred share dividends — (12,619) — (23,529) Adjusted net loss available to common stockholders4 $ (13,590) $ (44,534) $ (96,689) $ (146,980) Three months ended Year ended April 30, 2014 April 30, 2015 April 30, 2014 April 30, 2015 Adjusted EBITDAR $ 130,892 $ 106,702 $ 444,988 $ 453,127 Corporate transaction costs1 871 3,115 25,952 8,229 Adjusted EBITDAR excluding special items $ 131,763 $ 109,817 $ 470,940 $ 461,356
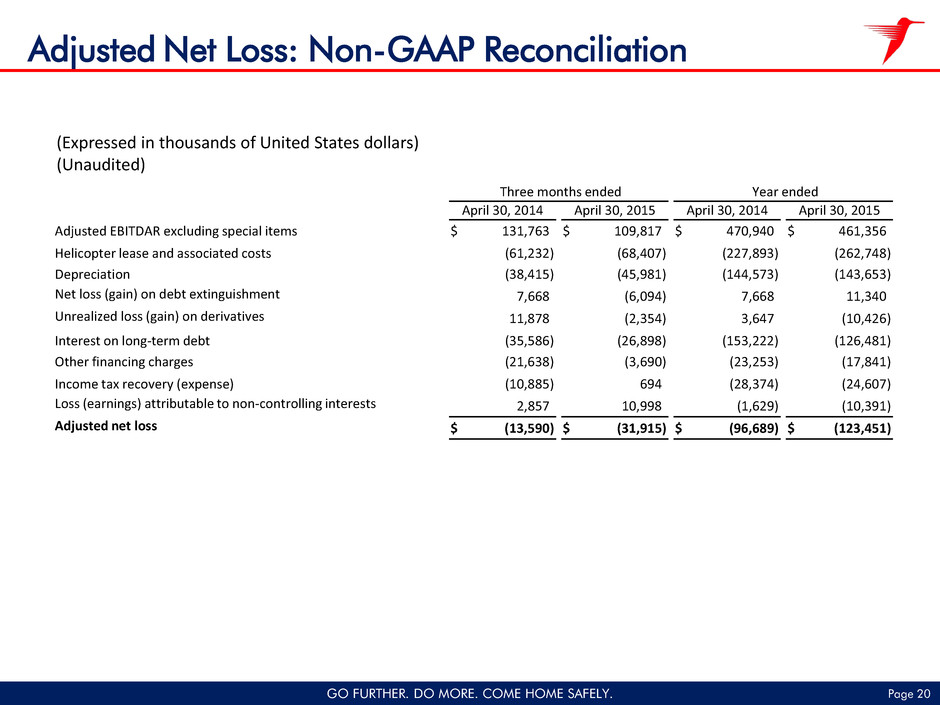
Page 20GO FURTHER. DO MORE. COME HOME SAFELY. (Expressed in thousands of United States dollars) (Unaudited) Adjusted Net Loss: Non-GAAP Reconciliation Three months ended Year ended April 30, 2014 April 30, 2015 April 30, 2014 April 30, 2015 Adjusted EBITDAR excluding special items $ 131,763 $ 109,817 $ 470,940 $ 461,356 Helicopter lease and associated costs (61,232) (68,407) (227,893) (262,748) Depreciation (38,415) (45,981) (144,573) (143,653) Net loss (gain) on debt extinguishment 7,668 (6,094) 7,668 11,340 Unrealized loss (gain) on derivatives 11,878 (2,354) 3,647 (10,426) Interest on long-term debt (35,586) (26,898) (153,222) (126,481) Other financing charges (21,638) (3,690) (23,253) (17,841) Income tax recovery (expense) (10,885) 694 (28,374) (24,607) Loss (earnings) attributable to non-controlling interests 2,857 10,998 (1,629) (10,391) Adjusted net loss $ (13,590) $ (31,915) $ (96,689) $ (123,451)

Page 21GO FURTHER. DO MORE. COME HOME SAFELY. Adjusted Net Debt Reconciliation 1. NPV of lease commitments as of April 30, 2014 and 2015 discounted at 9%. April 30, 2014 April 30, 2015 Long-term debt $ 1,546.2 $ 1,215.7 Current portion of long-term debt 4.1 3.6 Discount on notes 11.9 9.1 Premium on notes (1.5) (1.2) Less: Cash on Balance Sheet (302.5) (134.3) Net Debt $ 1,258.1 $ 1,092.9 NPV of lease commitments1 1,238.5 1,212.9 Adjusted net debt $ 2,496.6 $ 2,305.8 (Expressed in millions of United States dollars) (Unaudited)

Page 22GO FURTHER. DO MORE. COME HOME SAFELY. 263 252 247 236 231 174 169 165 165 160 6.84 8.03 8.73 8.82 8.83 0 1 2 3 4 5 6 7 8 9 10 0 50 100 150 200 250 300 FY11 FY12 FY13 FY14 FY15 Fleet count Heavy equivalent HE rate Fleet1, HE count2 and HE rate3 trends Fleet Statistics Technologically Advanced Fleet • Average age down from ~17 years in fiscal 2007 to ~10 years • New technology aircraft accounts for ~85% of fleet value • Improved returns 1. Fleet count at fiscal year end. 2. Heavy and medium helicopters, are weighted at 100% and 50%, respectively, to arrive at a single HE count, excluding helicopters that are held for sale. Shown above is average HE count of 5 quarters. 3. Heavy Equivalent (HE) Rate is the 3rd party operating revenue from HS segment divided by average HE count. See following page for the non-GAAP reconciliation of the HE Rate. Shift towards new technology aircraft supports increase in HE rate HE R at e $ m ill ion s U n it s

Page 23GO FURTHER. DO MORE. COME HOME SAFELY. HE Rate: Non-GAAP Reconciliation 1. Heavy and medium helicopters, are weighted at 100% and 50%, respectively, to arrive at a single HE count, excluding helicopters that are held for sale. Shown above is average HE count of 5 quarters. (Expressed in thousands of U.S. dollars) (Unaudited) Helicopter Services total external revenue $ 1,316,238 $ 1,526,060 $ 1,603,403 $ 1,617,708 $ 1,557,319 Less: Reimbursable revenues Helicopter Services operating revenue $ 1,191,814 $ 1,359,316 $ 1,437,865 $ 1,453,039 $ 1,411,901 Average HE count(1) HE Rate $ 6,842 $ 8,034 $ 8,730 $ 8,822 $ 8,830 174.2 164.7 159.9 2012 (166,744) 169.2 2013 (165,538) 164.7 For the fiscal year ended April 30 2011 2014 2015 (124,424) (164,669) (145,418)

Page 24GO FURTHER. DO MORE. COME HOME SAFELY. 2 pilots; 12 – 15 passengers 42 in Fleet 2 pilots; 11-13 passengers 17 in Fleet Other S92 2 pilots; 19 passengers 45 in Fleet EC225 2 pilots; 19 passengers 40 in Fleet S76 Series 2 pilots; 12 passengers 51 in Fleet AS332L, L1, L2 2 pilots; 17-19 passengers 36 in Fleet 231 Heavy/Medium twin engine helicopters with ~$3.1 Billion Fleet Value* Fleet average age ~10 years * Fleet value is based on 2015 Ascend and Helivalue$ mid-life appraised value based on fleet count as of April 30, 2015. AW139 H ea v y M e d iu m Fleet comprised entirely of heavy and medium aircraft Leading Operator of Heavy and Medium Aircraft
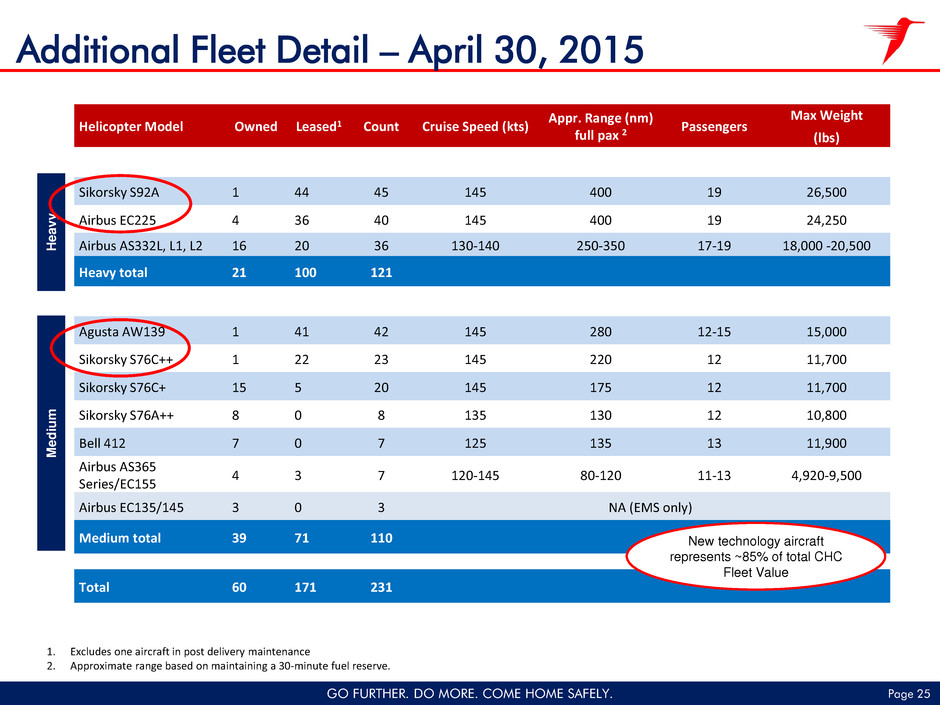
Page 25GO FURTHER. DO MORE. COME HOME SAFELY. Additional Fleet Detail – April 30, 2015 1. Excludes one aircraft in post delivery maintenance 2. Approximate range based on maintaining a 30-minute fuel reserve. Helicopter Model Owned Leased1 Count Cruise Speed (kts) Appr. Range (nm) full pax 2 Passengers Max Weight (lbs) Sikorsky S92A 1 44 45 145 400 19 26,500 Airbus EC225 4 36 40 145 400 19 24,250 Airbus AS332L, L1, L2 16 20 36 130-140 250-350 17-19 18,000 -20,500 Heavy total 21 100 121 Agusta AW139 1 41 42 145 280 12-15 15,000 Sikorsky S76C++ 1 22 23 145 220 12 11,700 Sikorsky S76C+ 15 5 20 145 175 12 11,700 Sikorsky S76A++ 8 0 8 135 130 12 10,800 Bell 412 7 0 7 125 135 13 11,900 Airbus AS365 Series/EC155 4 3 7 120-145 80-120 11-13 4,920-9,500 Airbus EC135/145 3 0 3 NA (EMS only) Medium total 39 71 110 Total 60 171 231 Hea v y M edi u m New technology aircraft represents ~85% of total CHC Fleet Value

Page 26GO FURTHER. DO MORE. COME HOME SAFELY. Helicopter Services Regional Revenue break-down – FY14-Q4 vs. FY15-Q4 Third Party Revenue Quarter Fiscal Year US $millions FY14 Q4 FY15 Q4 % FY14 FY15 % Eastern North Sea $97 $69 (29) $383 $339 (12) Western North Sea 111 86 (23) 422 415 (2) Americas 69 76 9 277 300 8 Asia Pacific 82 79 (4) 344 326 (5) Africa-Euro Asia 44 30 (31) 187 172 (8) Other 2 2 (18) 5 6 14 Helicopter Services $405 $341 (16) $1,618 $1,557 (4)
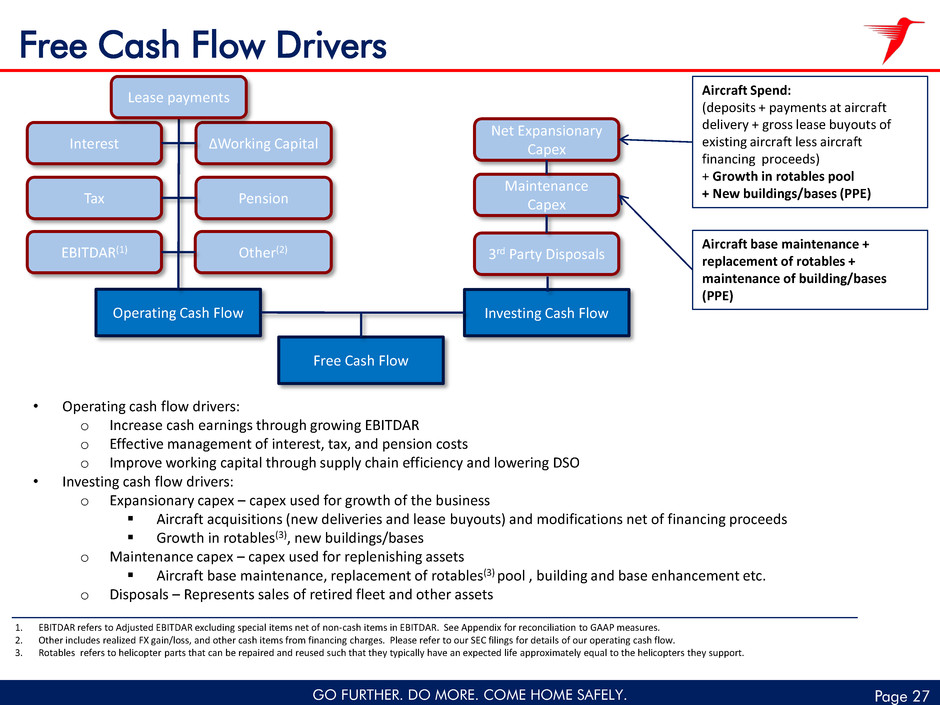
GO FURTHER. DO MORE. COME HOME SAFELY. Page 27 Free Cash Flow Drivers Net Expansionary Capex Maintenance Capex 3rd Party Disposals Investing Cash Flow ∆Working CapitalInterest Tax Operating Cash Flow Free Cash Flow Pension EBITDAR(1) Other(2) • Operating cash flow drivers: o Increase cash earnings through growing EBITDAR o Effective management of interest, tax, and pension costs o Improve working capital through supply chain efficiency and lowering DSO • Investing cash flow drivers: o Expansionary capex – capex used for growth of the business Aircraft acquisitions (new deliveries and lease buyouts) and modifications net of financing proceeds Growth in rotables(3), new buildings/bases o Maintenance capex – capex used for replenishing assets Aircraft base maintenance, replacement of rotables(3) pool , building and base enhancement etc. o Disposals – Represents sales of retired fleet and other assets Aircraft Spend: (deposits + payments at aircraft delivery + gross lease buyouts of existing aircraft less aircraft financing proceeds) + Growth in rotables pool + New buildings/bases (PPE) Lease payments Aircraft base maintenance + replacement of rotables + maintenance of building/bases (PPE) 1. EBITDAR refers to Adjusted EBITDAR excluding special items net of non-cash items in EBITDAR. See Appendix for reconciliation to GAAP measures. 2. Other includes realized FX gain/loss, and other cash items from financing charges. Please refer to our SEC filings for details of our operating cash flow. 3. Rotables refers to helicopter parts that can be repaired and reused such that they typically have an expected life approximately equal to the helicopters they support.
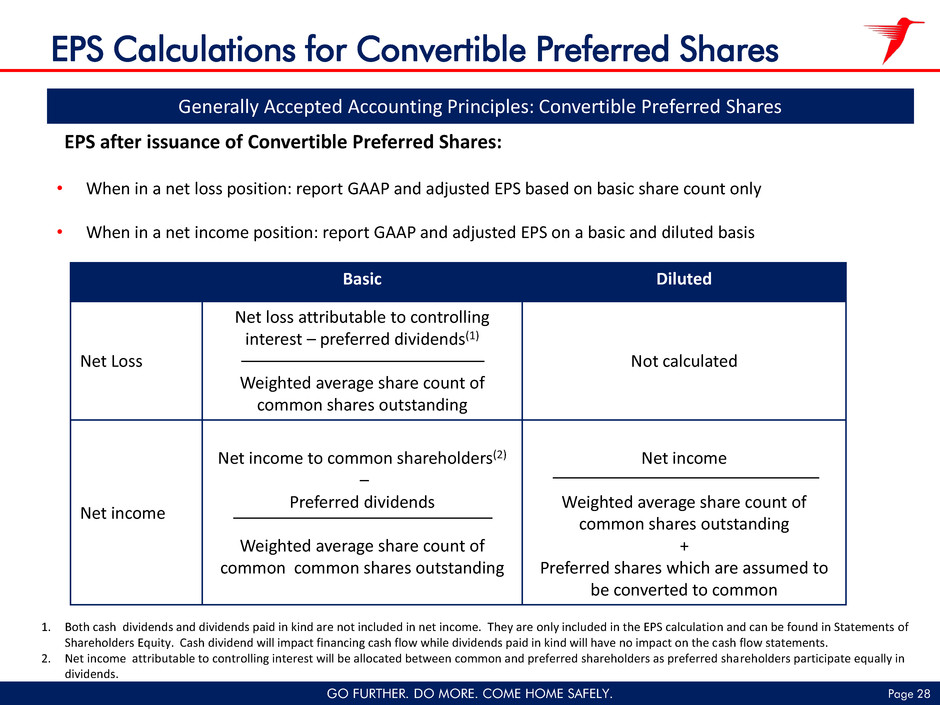
Page 28GO FURTHER. DO MORE. COME HOME SAFELY. EPS after issuance of Convertible Preferred Shares: Basic Diluted Net Loss Net loss attributable to controlling interest – preferred dividends(1) Weighted average share count of common shares outstanding Not calculated Net income Net income to common shareholders(2) – Preferred dividends Weighted average share count of common common shares outstanding Net income Weighted average share count of common shares outstanding + Preferred shares which are assumed to be converted to common • When in a net loss position: report GAAP and adjusted EPS based on basic share count only • When in a net income position: report GAAP and adjusted EPS on a basic and diluted basis EPS Calculations for Convertible Preferred Shares Generally Accepted Accounting Principles: Convertible Preferred Shares 1. Both cash dividends and dividends paid in kind are not included in net income. They are only included in the EPS calculation and can be found in Statements of Shareholders Equity. Cash dividend will impact financing cash flow while dividends paid in kind will have no impact on the cash flow statements. 2. Net income attributable to controlling interest will be allocated between common and preferred shareholders as preferred shareholders participate equally in dividends.

Page 29GO FURTHER. DO MORE. COME HOME SAFELY. • Paid on March 15, June 15, September 15, and December 15 of each year • Dividend Rate: 8.5% per annum • Dividend accrues and accumulates on a daily basis • Compounds quarterly on each preferred dividend payment date • Dividend is made to the nearest cent or 1/100,000th of a preferred share Dividend Calculation for Convertible Preferred Shares Dividend Amount Preferred shares outstanding during applicable period X ¼ of dividend rate

Page 30GO FURTHER. DO MORE. COME HOME SAFELY. Glossary of Terms Adjusted EBITDAR = earnings before interest, taxes, depreciation, amortization, helicopter lease and associated costs, asset impairments, gain (loss) on disposal of assets, restructuring expense, foreign exchange gain (loss) and other financing income (charges). Adjusted EBITDAR excluding special items = Adjusted EBITDAR excluding special items excludes corporate transaction costs, which includes costs related to senior executive turnover, expenses related to our IPO including costs related to restructuring our compensation plan, and other transactions. Adjusted EBITDAR margin = Adjusted EBITDAR excluding special items/operating revenue. Adjusted free cash flow = free cash flow adjusted for special items, restricted cash, and impact on free cash flow from CD&R investment. Adjusted leverage ratio= Adjusted net debt divided by trailing twelve months Adjusted EBITDAR excluding special items. Adjusted net income(loss) = net loss which excludes corporate transaction costs, asset dispositions, restructuring expense, asset impairments, the revaluation of our derivatives and foreign exchange gain (loss), and net income or loss attributable to non- controlling interests and debt extinguishment. Adjusted net loss per share = adjusted net loss available to common shareholders/weighted adjusted share count. Free cash flow = cash provided by operating activities less cash used in investing activities. Liquidity = cash and cash equivalents and unused capacity in the revolver net of letters of credit plus undrawn overdraft facilities. Operating revenue = Total revenue less reimbursable revenue which is costs reimbursed from customers. Weighted adjusted share count = the number of ordinary shares outstanding at our IPO date, adjusted for the weighted average of shares issued subsequent to this date.
