Attached files
| file | filename |
|---|---|
| EX-10.7 - EX-10.7 - Rapid7, Inc. | d908531dex107.htm |
| EX-3.2 - EX-3.2 - Rapid7, Inc. | d908531dex32.htm |
| EX-10.13 - EX-10.13 - Rapid7, Inc. | d908531dex1013.htm |
| EX-10.6 - EX-10.6 - Rapid7, Inc. | d908531dex106.htm |
| EX-23.1 - EX-23.1 - Rapid7, Inc. | d908531dex231.htm |
Table of Contents
As filed with the Securities and Exchange Commission on June 26, 2015.
Registration Statement No. 333-204874
UNITED STATES
SECURITIES AND EXCHANGE COMMISSION
WASHINGTON, D.C. 20549
AMENDMENT NO. 1
TO
FORM S-1
REGISTRATION STATEMENT
UNDER
THE SECURITIES ACT OF 1933
RAPID7, INC.
(Exact name of registrant as specified in its charter)
| Delaware | 7372 | 35-2423994 | ||
| (State or other jurisdiction of incorporation or organization) |
(Primary Standard Industrial Classification Code Number) |
(I.R.S. Employer Identification Number) |
100 Summer Street Boston, Massachusetts 02110
Tel: (617) 247-1717
(Address, including zip code, and telephone number, including area code, of registrant’s principal executive offices)
Corey Thomas
President and Chief Executive Officer
Rapid7, Inc.
100 Summer Street
Boston, Massachusetts 02110
Tel: (617) 247-1717
(Name, address, including zip code, and telephone number, including area code, of agent for service)
Copies to:
| Nicole Brookshire, Esq. Richard Segal, Esq. Cooley LLP 500 Boylston Street Boston, Massachusetts 02116 (617) 937-2300 |
Christopher Austin, Esq. Orrick, Herrington & Sutcliffe LLP 51 West 52nd Street New York, New York 10019 (212) 506-5000 |
Approximate date of commencement of proposed sale to the public: As soon as practicable after the effective date of this registration statement.
If any of the securities being registered on this Form are to be offered on a delayed or continuous basis pursuant to Rule 415 under the Securities Act of 1933, as amended, check the following box. ¨
If this Form is filed to register additional securities for an offering pursuant to Rule 462(b) under the Securities Act, check the following box and list the Securities Act registration statement number of the earlier effective registration statement for the same offering. ¨
If this Form is a post-effective amendment filed pursuant to Rule 462(c) under the Securities Act, check the following box and list the Securities Act registration statement number of the earlier effective registration statement for the same offering. ¨
If this Form is a post-effective amendment filed pursuant to Rule 462(d) under the Securities Act, check the following box and list the Securities Act registration number of the earlier effective registration statement for the same offering. ¨
Indicate by check mark whether the registrant is a large accelerated filer, an accelerated filer, a non-accelerated filer or a smaller reporting company. See the definitions of “large accelerated filer,” “accelerated filer” and “smaller reporting company” in Rule 12b-2 of the Exchange Act.
| Large Accelerated Filer ¨ | Accelerated Filer ¨ | Non-accelerated Filer x | Smaller Reporting Company ¨ |
CALCULATION OF REGISTRATION FEE
|
| ||||
| Title of Securities Being Registered | Proposed Maximum Aggregate Offering Price(1)(2) |
Amount of Registration Fee(3) | ||
| Common Stock, $0.01 par value per share |
$80,000,000 | $9,296 | ||
|
| ||||
|
| ||||
| (1) | In accordance with Rule 457(o) under the Securities Act of 1933, as amended, the number of shares being registered and the proposed maximum offering price per share are not included in this table. |
| (2) | Estimated solely for purposes of computing the amount of the registration fee pursuant to Rule 457(o) under the Securities Act of 1933, as amended. Includes the offering price of shares that the underwriters have the option to purchase to cover over-allotments, if any. |
| (3) | Previously paid. |
The registrant hereby amends this Registration Statement on such date or dates as may be necessary to delay its effective date until the registrant shall file a further amendment that specifically states that this Registration Statement shall thereafter become effective in accordance with Section 8(a) of the Securities Act of 1933, as amended, or until the Registration Statement shall become effective on such date as the Securities and Exchange Commission, acting pursuant to said Section 8(a), may determine.
Table of Contents
The information in this prospectus is not complete and may be changed. We may not sell these securities until the registration statement filed with the Securities and Exchange Commission is effective. This prospectus is not an offer to sell these securities and we are not soliciting offers to buy these securities in any state where the offer or sale is not permitted.
PROSPECTUS (Subject to Completion)
Issued , 2015
Shares

COMMON STOCK
Rapid7, Inc. is offering shares of its common stock. This is our initial public offering and no public market currently exists for our common stock. We anticipate that the initial public offering price of our common stock will be between $ and $ per share.
We have applied to list our common stock on the NASDAQ Global Market under the symbol “RPD.”
We are an “emerging growth company” under the U.S. federal securities laws and are subject to reduced public company reporting requirements. Investing in our common stock involves risks. See “Risk Factors” beginning on page 14.
PRICE $ A SHARE
| Price to |
Underwriting |
Proceeds to |
||||||||||
| Per Share |
$ | $ | $ | |||||||||
| Total |
$ | $ | $ | |||||||||
Entities affiliated with Technology Crossover Ventures have agreed to purchase $5.0 million of our common stock in a separate private placement concurrent with the completion of this offering at a price per share equal to the initial public offering price. The sale of such shares will not be registered under the Securities Act of 1933, as amended. The closing of this offering is not conditioned upon the closing of such concurrent private placement. The shares of common stock purchased in the concurrent private placement will not be subject to any underwriting discounts or commissions.
We have granted the underwriters the right to purchase up to an additional shares of our common stock to cover over-allotments.
The Securities and Exchange Commission and state securities regulators have not approved or disapproved of these securities or determined if this prospectus is truthful or complete. Any representation to the contrary is a criminal offense.
The underwriters expect to deliver the shares of our common stock to purchasers on , 2015.
| MORGAN STANLEY | BARCLAYS | |||||
| PACIFIC CREST SECURITIES | WILLIAM BLAIR | RAYMOND JAMES | COWEN AND COMPANY |
, 2015
Table of Contents
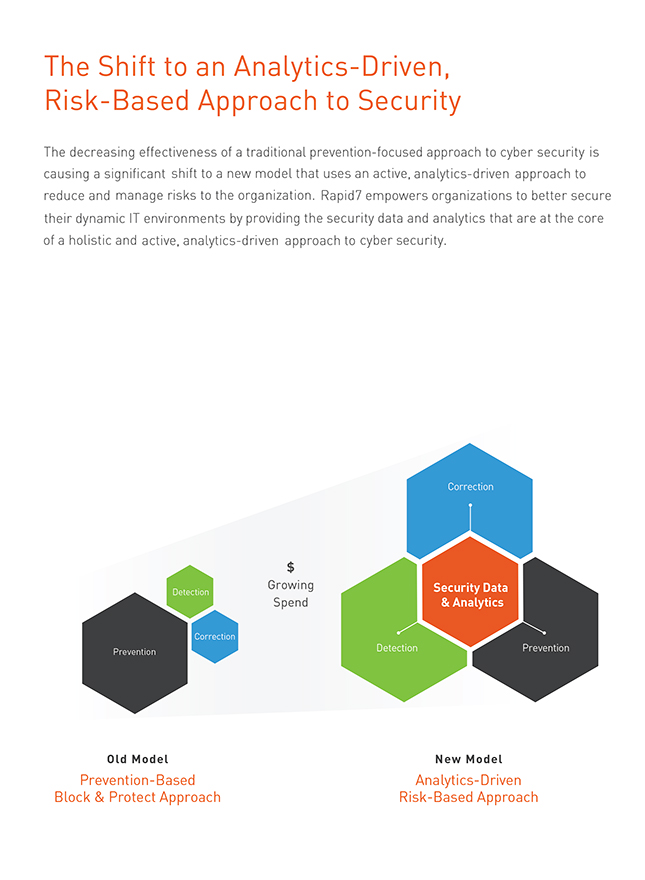
Table of Contents
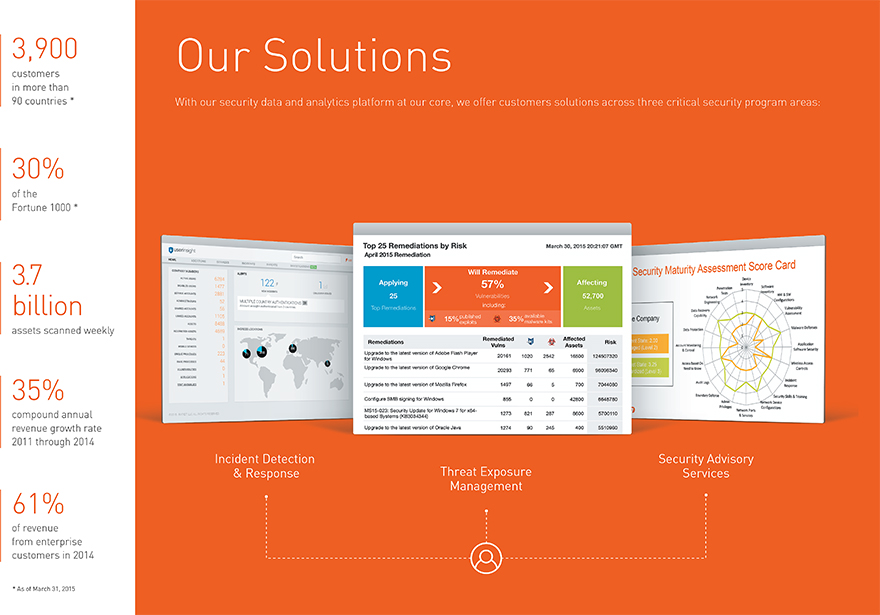
Table of Contents
You should rely only on the information contained in this document and any free writing prospectus we provide to you. Neither we nor the underwriters have authorized anyone to provide any information or to make any representations other than those contained in this prospectus or in any free writing prospectuses we have prepared. We take no responsibility for, and can provide no assurance as to the reliability of, any other information that others may give you. This prospectus is an offer to sell only the shares offered hereby, but only under circumstances and in jurisdictions where it is lawful to do so. The information contained in this prospectus is current only as of its date.
Through and including , 2015 (25 days after the date of this prospectus), all dealers that effect transactions in our common stock, whether or not participating in this offering, may be required to deliver a prospectus. This is in addition to the dealer’s obligation to deliver a prospectus when acting as an underwriter and with respect to unsold allotments or subscriptions.
For investors outside the United States: We have not and the underwriters have not done anything that would permit this offering, or possession or distribution of this prospectus in any jurisdiction where action for that purpose is required, other than in the United States. Persons outside the United States who come into possession of this prospectus must inform themselves about, and observe any restrictions relating to, the offering of the shares of common stock and the distribution of this prospectus outside of the United States.
Table of Contents
This summary highlights information contained elsewhere in this prospectus and does not contain all of the information that you should consider in making your investment decision. Before investing in our common stock, you should carefully read this entire prospectus, including our consolidated financial statements and the related notes and the information set forth under the sections titled “Risk Factors,” “Special Note Regarding Forward-Looking Statements,” and “Management’s Discussion and Analysis of Financial Condition and Results of Operations,” in each case included in this prospectus. Unless the context otherwise requires, we use the terms “Rapid7,” “company,” “our,” “us,” and “we” in this prospectus to refer to Rapid7, Inc. and, where appropriate, our consolidated subsidiaries.
RAPID7, INC.
Rapid7 is a leading provider of security data and analytics solutions that enable organizations to implement an active, analytics-driven approach to cyber security. Our security data and analytics platform was purpose built for today’s increasingly complex and chaotic IT environment. We combine our extensive experience in security data and analytics and deep insight into attacker behaviors and techniques to make sense of the wealth of data available to organizations about their IT environments and users. There has been an explosion of increasingly sophisticated cyber attacks as the proliferation of mobile devices, cloud-based applications and solutions relying on user credentials has eliminated the boundaries that previously defined an organization’s network perimeter and expanded the threat surface that organizations must now defend. Our powerful and proprietary analytics enable organizations to contextualize and prioritize the threats facing their physical, virtual and cloud assets, including those posed by the behaviors of their users. Leveraging our security data and analytics platform, our solutions enable organizations to strategically and dynamically manage their cyber security exposure. Our solutions empower organizations to prevent attacks by providing visibility into vulnerabilities and to rapidly detect compromises, respond to breaches and correct the underlying causes of attacks. This balanced and analytics-focused approach ultimately better secures organizations’ environments and reduces the likelihood of, and risks associated with, cyber attacks. We believe our technology and solutions revolutionize the practice of cyber security and are central and critical to implementing a modern security program.
With our security data and analytics platform at our core, we are pioneering active, analytics-driven solutions to cyber security that enable organizations to find and eliminate critical weaknesses and detect attacks in their IT environments. Our threat exposure management offerings include our industry-leading vulnerability management products, which we enhance with deep security analytics capabilities to quickly deliver contextual risk prioritization, critical threat awareness and impactful remediation guidance. Similarly, we added analytics and automation to traditional manual penetration testing to be able to deliver robust ongoing attack simulation solutions that provide organizations with visibility into real-world threats. By providing and combining analytics and actionable insights related to both an organization’s attack surface and the dynamic threat landscape, our security data and analytics platform enables organizations to manage their threat exposure above and beyond traditional vulnerability management products on the market. Further leveraging our technology platform and analytics capabilities, we recently introduced our incident detection product to provide organizations with the ability to rapidly detect and respond to cyber security incidents and breaches. To complement our incident detection product, we also recently introduced our incident response services, which provide our customers with critical access to our security experts and experience, enabling them to accelerate incident response and containment. We also offer security advisory services that help organizations develop a holistic approach to their cyber security programs and advance their cyber security program maturity. All of our products have been designed with an intuitive user interface, focused on ease-of-use and fast time-to-value for our customers.
Cyber security has become a strategic imperative for organizations globally, driven by increased focus by boards of directors and senior management in the wake of numerous recent high profile breaches and data thefts. Organizations are increasingly at risk of being compromised, with the number of reported security incidents
1
Table of Contents
within enterprises increasing 48% in 2014 over the prior year, according to a report by PricewaterhouseCoopers LLP. There are three converging macro drivers that are changing the cyber security landscape for organizations and driving the increase in cyber breaches. First, mobile and connected devices, cloud-based applications and more open and interconnected networks have increased IT complexity, expanding the exploitable attack surface across an organization and resulting in more sources of potential vulnerability. Second, there has been a dramatic change in the tools available to cyber attackers. Attackers can now purchase highly effective and easy-to-use software at very low cost that is designed to circumvent traditional prevention-based tools, thereby lowering the bar for nearly anyone to launch advanced cyber attacks. Third, the economic motives for attackers are more compelling, with new, vibrant markets providing attackers an efficient and effective way to monetize stolen customer information and employee data.
The confluence of these factors has rendered the old model of “block and protect” prevention-based cyber security programs ineffective. These traditional “block and protect” approaches to cyber security typically rely disproportionately on network perimeter protection tools such as firewalls and antivirus software to stop attackers. However, as the network perimeter rapidly disappears, the effectiveness of these legacy solutions diminishes greatly. Further, preventative solutions are generally not able to identify or deter attacks that involve stolen or weak credentials, which are used in 76% of cyber attacks according to the 2013 Verizon Data Breach Investigations Report. When an attacker gains access to an organization’s network through compromised credentials or otherwise, the attacker can freely exploit assets within the breached environment until they are detected, which took a median of 205 days in 2014 according to a report by Mandiant. The decreasing effectiveness of a traditional prevention-focused approach to cyber security is causing a significant shift to a new model that uses an active, analytics-driven approach to reduce and manage risks to the organization. This new model disrupts the historical focus on “block and protect” solutions and balances organizations’ investments in prevention, detection and correction to reduce the likelihood of, and risks associated with, cyber attacks. Effective implementation of this new model demands data and analytics to assess the effectiveness of tools and programs, identify attacker behaviors and prioritize and remediate exposures. Rapid7 empowers organizations to better secure their dynamic IT environments by providing the security data and analytics that are at the core of a holistic and active, analytics-driven approach to cyber security.
As of March 31, 2015, we had more than 3,900 customers, including over 30% of the organizations in the Fortune 1000. We have experienced strong revenue growth with revenue increasing from $31.0 million in 2011 to $76.9 million in 2014, representing a 35% compound annual growth rate. We have strong visibility to our revenue as 53% of the revenue recognized in 2014 was recorded on our balance sheet as deferred revenue as of December 31, 2013 and 85% of the revenue recognized in the first quarter of 2015 was recorded on our balance sheet as deferred revenue as of December 31, 2014. We incurred a net loss of $32.6 million in 2014 as we continued to invest for growth given our large market opportunity.
Industry Background
Increasing Cyber Security Breaches Driven by a Rapidly Evolving and Dynamic Threat Landscape
IT professionals face a rapidly evolving and dynamic threat landscape and an increasingly fragmented mosaic of security technology vendors offering point solutions to prevent specific threats and protect against specific attack vectors. Forced to make choices and allocate budgets with limited information, IT professionals are often left feeling overwhelmed. At the same time, threats continue to escalate due to three converging macro drivers:
Increasingly Complex IT Environment is Expanding Organizations’ Attack Surfaces. IT departments are required to deliver more applications faster, often in the cloud, in order to meet growing user demands for innovation and productivity tools. As a result, it has become increasingly difficult for IT departments to secure the increasing number of systems against the growing number of known security vulnerabilities. Increasing user empowerment has also led to an increase in the number of applications and devices that individual users can
2
Table of Contents
access with their credentials, which further expands the attack surface of an organization exposed to potential cyber criminals. Firewalls and other traditional prevention-based techniques are less capable of protecting this complex and expanded attack surface, leaving IT professionals overwhelmed by new threats and looking for new technologies and ways to respond.
Weaponized Malware Evades Traditional Prevention-Based Tools and Expands the Cyber Attacker Universe. There are sophisticated software toolkits and malware that can be used to launch a cyber attack, which are readily available online for free or at a low cost. These toolkits are specifically designed to circumvent the preventative security measures typically put in place by organizations, allowing cyber criminals with rudimentary IT knowledge to launch sophisticated attacks on enterprise users and networks. With this weaponized software, cyber attacks are no longer just the domain of advanced attackers, and the number of security breaches is rapidly increasing.
A Vibrant Cyber-Crime Economy Further Incents Cyber Attackers. Economic incentives for attackers continue to become more compelling, as new and vibrant black markets for stolen data, including credit card information, email account information and healthcare information, enable attackers to efficiently and effectively monetize stolen information. This more recent dynamic has led to a proliferation of data from successful attacks being offered for sale by cyber criminals, and the formation of a lucrative and growing underground economy.
Enterprise Security Shifting from Passive “Block and Protect” to Actively-Managed Security Programs
Organizations have traditionally taken a passive approach to cyber security, relying on deploying “block and protect” security tools aimed at thwarting attackers at the perimeter of the network. However, sophisticated software-enabled technologies and techniques are increasingly used by attackers to evade prevention-based security solutions. Additionally, the explosion of cloud-based applications and mobile devices accessing enterprise data are blurring the previously rigid lines that once defined enterprise network boundaries. Without these boundaries, prevention-based tools are easily circumvented by cyber criminals. Equally problematic for today’s organizations, traditional “block and protect” solutions are ineffective against cyber attacks using compromised user credentials. Many users have administrator-level credentials on their devices to maximize their productivity, but these credentials are relatively easily stolen and can be exploited by attackers in order to gain access to an organization’s network, assets and information. Use of stolen credentials in cyber attacks is becoming a significant issue, and once an attacker has gained access to an IT system with valid credentials, most prevention-based technologies cannot identify the threat. Without knowledge of a breach, IT professionals cannot react to limit the damage and attackers may have months to explore an organization’s network and steal critical data before being detected.
In light of high profile and costly security breaches, IT professionals are increasingly focused on developing comprehensive security programs to better protect their organizations against attacks. An actively-managed approach to an organization’s cyber security program improves the program’s overall effectiveness by focusing on analytics and an understanding of risks and threats in context. This approach further assists IT professionals in allocating security budgets to the specific tools that enable organizations to process and analyze significant amounts of data in real time to quickly identify, understand and react to attacks and breaches as they occur. Through security data and analytics, organizations can recognize behavior patterns associated with breaches, even if the attack vector is completely novel. The organization can then develop and improve its cyber security programs in order to reduce its exposures and better detect and respond to compromises using a holistic approach that balances investments in prevention, detection and correction. Analytics provides the critical context and prioritization to underlying security data to facilitate effective, informed and proactive decisions that allow for the systemic and dynamic management of security programs across each of these areas. An active, analytics-driven security program can prevent attacks through increased visibility into vulnerabilities, rapidly detecting and responding to compromises and correcting the underlying causes of attacks.
3
Table of Contents
Our Market Opportunity
According to Gartner, Inc., advanced targeted attacks make prevention-centric strategies obsolete. Securing enterprises in 2020 will require a shift to information- and people-centric security strategies, combined with pervasive internal monitoring and sharing of security intelligence. Accordingly, we believe that our market opportunity is large and growing and will be positively impacted by the ongoing shift in security spending from a traditional passive, “block and protect” approach to an active, analytics-driven approach to cyber security. Gartner, Inc. estimates that by 2020, 60% of enterprise information security budgets will be allocated for rapid detection and response approaches – up from less than 10% in 2014.
Our estimate, based on International Data Corporation data, is that the overall market for security data and analytics is a $12.6 billion opportunity in 2015. Included in our estimates are all or a portion of the markets for Security and Vulnerability Management, Network Intrusion Detection and Prevention, Endpoint Security Suites and Security Services. We believe that our market opportunity will grow as organizations continue to move away from prevention-based solutions and toward analytics-driven security environments.
Benefits of Our Solutions
We are a leading provider of security data and analytics solutions that enable organizations to implement an active, analytics-driven approach to cyber security. Key benefits of our solutions include:
| l | Decreased Risk of Security Breach. Our technology platform and solutions provide IT professionals with a complete view of their dynamic attack surface and automatically assess an organization’s vulnerabilities relative to the evolving threat landscape. We provide robust and relevant analytics and insight into attacker behaviors and techniques so that IT professionals are able to identify and prioritize risks effectively to reduce risks and ultimately create a more secure IT environment for their organization. |
| l | Enhanced Attack Preparedness. Our solutions allow our customers to test their defenses by simulating real-world attacks on their IT environments, using the same techniques and exploits as attackers. Our attack simulation solutions leverage our security data and analytics expertise as well as the insights from our community of thousands of active Metasploit users, who provide us with real-time, real-world insight into attacker behavior across the global IT attack surface. |
| l | Fast, Effective and Confident Intrusion Response. Our product offerings can help mitigate the impact of a breach by automatically identifying the root cause of a breach and providing clear and actionable insight into effective mitigation and correction. Our solutions provide timely, prioritized and clear analysis and instructions to IT professionals so that they can quickly, confidently and effectively respond to cyber security breaches. |
| l | A Continually Relevant and Effective Security Program. Our solutions are continually relevant as they evolve with, and react to, the dynamic threat landscape. Guided by our holistic approach balancing prevention, detection and correction solutions, we provide strategic, technology-agnostic guidance tailored to an organization’s security maturity and optimized to an organization’s IT environment. |
Our Competitive Strengths
We have developed the following key competitive advantages that we believe will allow us to maintain a leadership position in the market for security data and analytics:
| l | Automated Data Collection from the Endpoint to the Cloud. Our technology platform provides robust data collection capabilities across multiple data sources, from endpoint information, to user behaviors, to |
4
Table of Contents
| cloud activity. The platform collects data through an agentless architecture, which allows our platform to amass data from multiple sources quickly and without significant customer installation expertise. |
| l | Customer-Specific Security Analytics. Our technology platform collects and organizes data from each customer’s unique IT environment, which allows us to systemically and automatically profile the key risks specific to each customer. |
| l | Robust and Relevant Knowledge of Attacker Activity. We maintain the Metasploit open source framework, which is used to simulate attacks and test an organization’s defense against real-world threats. Our ties to the security research community through Metasploit provide us with real-time insight into new attacks and exploits. The size and accuracy of our exploit database and the speed at which our threat exposure management offerings are updated provides significant value to IT professionals looking to secure their networks in a dynamic and evolving threat environment. |
| l | Intuitive Product Design Focused on Speed to Insight. Our solutions are designed for ease-of-use by IT professionals, from the integration of our underlying technology platform to the clean user interface of our solutions. This enables our customers to develop actionable insights quickly and with limited training, providing them with a fast time-to-value. |
| l | Deep Security Domain Expertise Across Technology, Operations and People. We leverage our deep domain expertise in security data and analytics to better serve our customers, who frequently have limited ability to carry deep expertise in-house. We aim to serve as a trusted security advisor to our customers, encompassing a powerful combination of technology, services and operations expertise to support our customers’ success in managing their cyber security exposure. |
| l | User Behavior Analytics. Within our technology platform, our behavioral analytics tools and prioritization engine triangulate on the most important data to determine suspicious user behaviors and potentially compromised user credentials while reducing false signals and alerts. These powerful user-centric analytics allow IT professionals to make informed and proactive decisions about how to respond. |
Our Growth Strategy
Our mission is to deliver security data and analytics that revolutionize the practice of cyber security. Key elements of our growth strategy include:
| l | Drive New Customer Additions. We intend to continue to invest in building our global sales and go-to-market organizations, as we believe that most organizations with IT infrastructure would benefit from our products and services, regardless of size or industry. |
| l | Increase Customer Economics and Success. We have a dedicated customer success team focused on engagement and education to drive customer loyalty and increased purchases of our solutions. We believe that enterprise customers will increase their spending with us as they continue to shift their cyber security programs to security data and analytics-centric strategies. |
| l | Continue to Expand Internationally. We will continue to increase our international sales, service and support organizations to target additional sales across Europe and Asia and will also continue to expand our number of channel partners internationally. |
| l | Continue to Innovate with Our Products and Technology Platform. We plan to build upon our current performance and technology leadership in security data and analytics to enhance our technology platform and product capabilities. |
5
Table of Contents
| l | Serve as the Hub for Cyber Security. Our robust and comprehensive data collection capabilities, deep understanding of the attacker, analytics-driven approach and industry leadership through our Metasploit community position us to fundamentally change the way that organizations approach cyber security. We expect to continue to offer new analytics-based solutions for cyber security operations and that third-party application developers will continue to leverage our data collection and analytics capabilities. |
Selected Risks Affecting Our Business
Our business is subject to numerous risks and uncertainties, including those highlighted in the section titled “Risk Factors” immediately following this prospectus summary. These risks include, among others, the following:
| l | We are a rapidly growing company, which makes it difficult to evaluate our future prospects and may increase the risk that we will not be successful. |
| l | If we are unable to sustain our revenue growth rate, we may not achieve or maintain profitability in the future. |
| l | If our products or professional services fail to detect vulnerabilities or incorrectly detect vulnerabilities, or if our products contain undetected errors or defects, our brand and reputation could be harmed, which could have an adverse effect on our business and results of operations. |
| l | We face intense competition in our market. |
| l | The market for our products and professional services is new and unproven and may not grow. |
| l | If we do not continue to innovate and offer products and professional services that address the dynamic threat landscape, we may not remain competitive, and our revenue and operating results could suffer. |
| l | Our business and operations are experiencing rapid growth, and if we do not appropriately manage our future growth, or are unable to scale our systems and processes, our operating results may be negatively affected. |
| l | We are subject to governmental export and import controls that could impair our ability to compete in international markets or subject us to liability if we are not in compliance with applicable laws. |
| l | Assertions by third parties of infringement or other violations by us of their intellectual property rights, whether or not correct, could result in significant costs and harm our business and operating results. |
| l | Concentration of ownership among our existing directors, executive officers and holders of 5% or more of our outstanding common stock may prevent new investors from influencing significant corporate decisions. |
Concurrent Private Placement
Entities affiliated with Technology Crossover Ventures have agreed to purchase $5.0 million of our common stock in a separate private placement concurrent with the completion of this offering at a price per share equal to the initial public offering price. The sale of such shares will not be registered under the Securities Act of 1933, as amended. The closing of this offering is not conditioned upon the closing of such concurrent private placement.
6
Table of Contents
Corporate Information
We were initially incorporated in July 2000 in Delaware. Rapid7 LLC, a limited liability company organized under the laws of the Commonwealth of Massachusetts, was formed in January 2004. In August 2004, pursuant to an exchange agreement among Rapid7 LLC and the stockholders of Rapid7, Inc., the stockholders exchanged their shares in Rapid7, Inc. for equity interests in Rapid7 LLC, after which Rapid7, Inc. was dissolved. In August 2008, Rapid7 LLC was merged with and into Rapid7 LLC, a newly-formed Delaware limited liability company. Rapid7, Inc. was reincorporated in Delaware in October 2011. In a series of transactions in November 2011, equity holders of Rapid7 LLC exchanged their equity interests in Rapid7 LLC for capital stock in Rapid7, Inc. and Rapid7 LLC became a wholly-owned subsidiary of Rapid7, Inc., which is the registrant and issuer of the shares of common stock in this offering.
Following this offering, our directors, executive officers and holders of more than 5% of our common stock, some of whom are represented on our board of directors, together with their affiliates will beneficially own % of the voting power of our outstanding capital stock.
Our principal executive offices are located at 100 Summer Street, Boston, Massachusetts. Our telephone number is (617) 247-1717. Our website address is www.rapid7.com. The information contained on, or that can be accessed through, our website is not incorporated by reference into this prospectus, and you should not consider any information contained on, or that can be accessed through, our website as part of this prospectus or in deciding whether to purchase our common stock.
“Rapid7,” the Rapid7 logo, and other trademarks or service marks of Rapid7, Inc. appearing in this prospectus are the property of Rapid7, Inc. This prospectus contains additional trade names, trademarks and service marks of others, which are the property of their respective owners. Solely for convenience, trademarks and trade names referred to in this prospectus may appear without the ® or TM symbols.
Implications of Being an Emerging Growth Company
We qualify as an “emerging growth company” as defined in the Jumpstart Our Business Startups Act of 2012, or the JOBS Act. An emerging growth company may take advantage of specified reduced reporting and other burdens that are otherwise applicable generally to public companies. These provisions include:
| l | a requirement to have only two years of audited financial statements and only two years of related selected financial data and management’s discussion and analysis of financial condition and results of operations disclosure; |
| l | an exemption from the auditor attestation requirement in the assessment of our internal control over financial reporting pursuant to the Sarbanes-Oxley Act of 2002, or the Sarbanes-Oxley Act; |
| l | an exemption from new or revised financial accounting standards until they would apply to private companies and from compliance with any new requirements adopted by the Public Company Accounting Oversight Board requiring mandatory audit firm rotation; |
| l | reduced disclosure about the emerging growth company’s executive compensation arrangements; and |
| l | no requirement to seek nonbinding advisory votes on executive compensation or golden parachute arrangements. |
7
Table of Contents
We may take advantage of some or all these provisions until we are no longer an emerging growth company. We will remain an emerging growth company until the earlier to occur of (1) the last day of the fiscal year (a) following the fifth anniversary of the completion of this offering, (b) in which we have total annual gross revenues of at least $1.0 billion or (c) in which we are deemed to be a “large accelerated filer” under the rules of the U.S. Securities and Exchange Commission, which means the market value of our common stock that is held by non-affiliates exceeds $700 million as of the prior June 30th and (2) the date on which we have issued more than $1.0 billion in non-convertible debt during the prior three-year period.
We are choosing to “opt out” of the provision of the JOBS Act that permits emerging growth companies to take advantage of an extended transition period to comply with new or revised accounting standards applicable to public companies and, as a result, we will comply with new or revised accounting standards as required when they are adopted. This decision to opt out of the extended transition period is irrevocable.
We have elected to adopt certain of the reduced disclosure requirements available to emerging growth companies. As a result of these elections, the information that we provide in this prospectus may be different than the information you may receive from other public companies in which you hold equity interests. In addition, it is possible that some investors will find our common stock less attractive as a result of these elections, which may result in a less active trading market for our common stock and higher volatility in our stock price.
8
Table of Contents
THE OFFERING
| Common stock offered by us |
shares |
| Common stock to be sold to entities affiliated with Technology Crossover Ventures |
shares |
| Common stock to be outstanding after this offering and the concurrent private placement |
shares |
| Over-allotment option |
We have granted the underwriters an option, exercisable for 30 days after the date of this prospectus, to purchase up to an additional shares from us to cover over-allotments. |
| Use of proceeds |
We estimate that we will receive net proceeds from this offering of approximately $ million, assuming an initial public offering price of $ per share, the midpoint of the price range set forth on the cover page of this prospectus, after deducting the underwriter discounts and commissions and estimated offering expenses payable by us. Our net proceeds from the concurrent private placement will be $5.0 million. The principal purposes of this offering are to increase our financial flexibility, create a public market for our common stock, and facilitate our future access to the capital markets. We expect to use the net proceeds of this offering and the concurrent private placement for working capital and other general corporate purposes. We also intend to use $ million of the net proceeds to pay all remaining outstanding principal and interest, together with a termination fee, under our term loan with Silicon Valley Bank. Further, we may use a portion of the proceeds from this offering for acquisitions or strategic investments in complementary businesses or technologies, although we do not currently have any plans for any such acquisitions or investments. These expectations are subject to change. See “Use of Proceeds” for additional information. |
| Risk factors |
See “Risk Factors” and the other information included in this prospectus for a discussion of factors you should carefully consider before deciding to invest in our common stock. |
| Proposed NASDAQ Global Market symbol |
“RPD” |
The number of shares of our common stock that will be outstanding after this offering and the concurrent private placement is based on shares of common stock outstanding as of March 31, 2015, and excludes:
| l | 4,006,962 shares of common stock issuable upon the exercise of options outstanding as of March 31, 2015, at a weighted-average exercise price of $5.44 per share; |
9
Table of Contents
| l | 200,000 shares of common stock issuable upon the exercise of warrants outstanding as of March 31, 2015, at an exercise price of $10.00 per share; |
| l | shares of our common stock reserved for future issuance pursuant to our 2015 Equity Incentive Plan, or 2015 Plan, which will become effective prior to the completion of this offering and will include provisions that automatically increase the number of shares of common stock reserved for issuance thereunder each year; and |
| l | shares of common stock reserved for future issuance under our 2015 Employee Stock Purchase Plan, which will become effective prior to the completion of this offering and will include provisions that automatically increase the number of shares of common stock reserved for issuance thereunder each year. |
Unless otherwise indicated, this prospectus reflects and assumes the following:
| l | the conversion of all of our outstanding shares of our preferred stock into an aggregate of 16,382,615 shares of our common stock immediately prior to the closing of this offering; |
| l | additional shares of common stock to be issued upon the conversion of all of our outstanding shares of our Series D preferred stock immediately prior to the closing of this offering pursuant to provisions of our certificate of incorporation as currently in effect, assuming an initial public offering price of $ per share, the midpoint of the price range set forth on the cover page of this prospectus, and which shares are referred to in this prospectus as the Additional Series D Conversion Shares; |
| l | shares of common stock to be issued and sold in the concurrent private placement to entities affiliated with Technology Crossover Ventures, assuming an initial public offering price of $ per share, the midpoint of the price range set forth on the cover page of this prospectus; |
| l | the filing and effectiveness of our amended and restated certificate of incorporation in Delaware and the adoption of our amended and restated bylaws, each of which will occur immediately prior to the completion of this offering; |
| l | no exercise of outstanding options or warrants after March 31, 2015; and |
| l | no exercise by the underwriters of their over-allotment option to purchase additional shares of our common stock. |
Additional Series D Conversion Shares
Holders of outstanding shares of our Series D preferred stock have the right to be issued additional shares of common stock upon the conversion of their shares of Series D preferred stock in an initial public offering, which we refer to as the Additional Series D Conversion Shares, regardless of the initial public offering price. The number of shares of our common stock to be issued as Additional Series D Conversion Shares depends on the initial public offering price of our common stock. Based on the assumed initial public offering price of $ per share, the midpoint of the price range set forth on the cover page of this prospectus, we will issue Additional Series D Conversion Shares. For illustrative purposes only, the table below shows the number of Additional Series D Conversion Shares that would be issuable at various initial public offering prices, as well as the total number shares of our common stock that would be outstanding after this offering as a result:
| Assumed Initial Public Offering Price ($) |
Additional Series D Conversion Shares (#) |
Estimated Total Shares of Common
Stock |
10
Table of Contents
SUMMARY CONSOLIDATED FINANCIAL AND OTHER DATA
We derived the summary consolidated statements of operations data for the years ended December 31, 2012, 2013 and 2014 from our audited consolidated financial statements included elsewhere in this prospectus. We derived the summary consolidated statement of operations data for the three months ended March 31, 2014 and 2015 and the summary consolidated balance sheet data as of March 31, 2015 from our unaudited financial statements included elsewhere in this prospectus. We have prepared the unaudited financial statements on the same basis as the audited financial statements, and the unaudited financial data include, in our opinion, all adjustments, consisting only of normal recurring adjustments, that we consider necessary for a fair presentation of our financial position and results of operations for these periods. Our historical results are not necessarily indicative of the results to be expected in the future.
When you read this summary consolidated financial data, it is important that you read it together with the historical consolidated financial statements and related notes to those statements, as well as “Selected Consolidated Financial Data” and “Management’s Discussion and Analysis of Financial Condition and Results of Operations,” included elsewhere in this prospectus.
| Year Ended December 31, | Three Months Ended March 31, |
|||||||||||||||||||||||||||||
| 2012 | 2013 | 2014 | 2014 | 2015 | ||||||||||||||||||||||||||
| (in thousands, except share and per share data) | ||||||||||||||||||||||||||||||
| (unaudited) | ||||||||||||||||||||||||||||||
| Consolidated Statements of Operations Data: |
||||||||||||||||||||||||||||||
| Revenue: |
||||||||||||||||||||||||||||||
| Products |
$ | 29,414 | $ | 38,633 | $ | 47,030 | $ | 10,615 | $ | 13,645 | ||||||||||||||||||||
| Maintenance and support |
9,727 | 14,017 | 19,016 | 4,145 | 5,799 | |||||||||||||||||||||||||
| Professional services |
6,903 | 7,380 | 10,834 | 1,976 | 4,127 | |||||||||||||||||||||||||
|
|
|
|
|
|
|
|
|
|
|
|||||||||||||||||||||
| Total revenue |
46,044 | 60,030 | 76,880 | 16,736 | 23,571 | |||||||||||||||||||||||||
| Cost of revenue:(1) |
||||||||||||||||||||||||||||||
| Products |
1,691 | 4,048 | 4,557 | 1,239 | 1,546 | |||||||||||||||||||||||||
| Maintenance and support |
2,069 | 3,388 | 4,495 | 988 | 1,210 | |||||||||||||||||||||||||
| Professional services |
4,462 | 5,442 | 9,420 | 1,631 | 3,736 | |||||||||||||||||||||||||
|
|
|
|
|
|
|
|
|
|
|
|||||||||||||||||||||
| Total cost of revenue |
8,222 | 12,878 | 18,472 | 3,858 | 6,492 | |||||||||||||||||||||||||
| Operating expenses:(1) |
||||||||||||||||||||||||||||||
| Research and development |
17,820 | 21,411 | 25,570 | 6,120 | 6,414 | |||||||||||||||||||||||||
| Sales and marketing |
23,278 | 31,779 | 49,007 | 11,004 | 13,230 | |||||||||||||||||||||||||
| General and administrative |
9,436 | 12,586 | 12,972 | 3,482 | 4,053 | |||||||||||||||||||||||||
|
|
|
|
|
|
|
|
|
|
|
|||||||||||||||||||||
| Total operating expense |
50,534 | 65,776 | 87,549 | 20,606 | 23,697 | |||||||||||||||||||||||||
|
|
|
|
|
|
|
|
|
|
|
|||||||||||||||||||||
| Loss from operations |
(12,712 | ) | (18,624 | ) | (29,141 | ) | (7,728 | ) | (6,618 | ) | ||||||||||||||||||||
| Interest income (expense), net |
(71 | ) | (122 | ) | (2,802 | ) | (695 | ) | (685 | ) | ||||||||||||||||||||
| Other income (expense), net |
(29 | ) | 43 | (305 | ) | 41 | (305 | ) | ||||||||||||||||||||||
|
|
|
|
|
|
|
|
|
|
|
|||||||||||||||||||||
| Loss before income taxes |
(12,812 | ) | (18,703 | ) | (32,248 | ) | (8,382 | ) | (7,608 | ) | ||||||||||||||||||||
| Provision for (benefit from) income taxes |
(418 | ) | 170 | 379 | 96 | 74 | ||||||||||||||||||||||||
|
|
|
|
|
|
|
|
|
|
|
|||||||||||||||||||||
| Net loss |
(12,394 | ) | (18,873 | ) | (32,627 | ) | (8,478 | ) | (7,682 | ) | ||||||||||||||||||||
| Accretion of preferred stock to redemption value(2) |
(25,606 | ) | (33,553 | ) | (52,336 | ) | (12,178 | ) | (11,273 | ) | ||||||||||||||||||||
|
|
|
|
|
|
|
|
|
|
|
|||||||||||||||||||||
| Net loss attributable to common stockholders |
$ | (38,000 | ) | $ | (52,426 | ) | $ | (84,963 | ) | $ | (20,656 | ) | $ | (18,955 | ) | |||||||||||||||
|
|
|
|
|
|
|
|
|
|
|
|||||||||||||||||||||
| Net loss per share attributable to common stockholders, basic and diluted(2) | $ | (3.09 | ) | $ | (4.18 | ) | $ | (6.65 | ) | $ | (1.62 | ) | $ | (1.50 | ) | |||||||||||||||
|
|
|
|
|
|
|
|
|
|
|
|||||||||||||||||||||
| Weighted-average common shares outstanding, basic and diluted | 12,308,428 | 12,549,266 | 12,770,916 | 12,716,675 | 12,642,188 | |||||||||||||||||||||||||
| Pro forma net loss per share attributable to common stockholders, basic and diluted(3) | $ | $ | ||||||||||||||||||||||||||||
|
|
|
|
|
|||||||||||||||||||||||||||
| Pro forma weighted-average common shares outstanding, basic and diluted(3) | ||||||||||||||||||||||||||||||
11
Table of Contents
| (1) | Includes stock-based compensation expense and depreciation and amortization expense as follows: |
| Year Ended December 31, | Three Months Ended March 31, |
|||||||||||||||||||
| 2012 | 2013 | 2014 | 2014 | 2015 | ||||||||||||||||
| (in thousands) | ||||||||||||||||||||
| (unaudited) | ||||||||||||||||||||
| Stock-based compensation expense: |
||||||||||||||||||||
| Cost of revenue |
$ | 61 | $ | 67 | $ | 167 | $ | 39 | $ | 49 | ||||||||||
| Research and development |
375 | 426 | 499 | 120 | 144 | |||||||||||||||
| Sales and marketing |
293 | 249 | 496 | 119 | 115 | |||||||||||||||
| General and administrative |
991 | 1,305 | 997 | 250 | 267 | |||||||||||||||
|
|
|
|
|
|
|
|
|
|
|
|||||||||||
| Total stock-based compensation expense |
$ | 1,720 | $ | 2,047 | $ | 2,159 | $ | 528 | $ | 575 | ||||||||||
|
|
|
|
|
|
|
|
|
|
|
|||||||||||
| Depreciation and amortization expense: |
||||||||||||||||||||
| Cost of revenue |
$ | 547 | $ | 1,107 | $ | 1,275 | $ | 291 | $ | 352 | ||||||||||
| Research and development |
406 | 649 | 1,093 | 217 | 241 | |||||||||||||||
| Sales and marketing |
444 | 675 | 1,396 | 294 | 371 | |||||||||||||||
| General and administrative |
132 | 200 | 376 | 76 | 170 | |||||||||||||||
|
|
|
|
|
|
|
|
|
|
|
|||||||||||
| Total depreciation and amortization expense |
$ | 1,529 | $ | 2,631 | $ | 4,140 | $ | 878 | $ | 1,134 | ||||||||||
|
|
|
|
|
|
|
|
|
|
|
|||||||||||
| (2) | See Note (11) to our consolidated financial statements appearing elsewhere in this prospectus for further details on the calculation of accretion of preferred stock to redemption value and basic and diluted net loss per share attributable to common stockholders. |
| (3) | Pro forma basic and diluted net loss per share represents net loss divided by the pro forma weighted-average shares of common stock outstanding. Pro forma weighted-average shares outstanding reflects the conversion of all outstanding shares of preferred stock (using the if-converted method) into common stock as though the conversion had occurred on the first day of the relevant period or the original issuance date, if later. |
| As of March 31, 2015 | ||||||||||||
| Actual | Pro forma(1) |
Pro forma as adjusted(2)(3) |
||||||||||
| (in thousands) | ||||||||||||
| (unaudited) | ||||||||||||
| Consolidated Balance Sheet Data: |
||||||||||||
| Cash |
$ | 33,343 | $ | $ | ||||||||
| Working capital, excluding deferred revenue |
45,927 | |||||||||||
| Total assets |
79,382 | |||||||||||
| Total deferred revenue |
88,643 | |||||||||||
| Total debt |
17,009 | |||||||||||
| Total liabilities |
121,345 | |||||||||||
| Redeemable convertible preferred stock |
222,871 | |||||||||||
| Accumulated deficit |
(261,435 | ) | ||||||||||
| Total stockholders’ (deficit) equity |
(264,834 | ) | ||||||||||
(1) Pro forma consolidated balance sheet data reflects the automatic conversion of all outstanding shares of preferred stock into common stock immediately prior to the closing of this offering, including the Additional Series D Conversion Shares. See “Prospectus Summary—The Offering” for a description of the Additional Series D Conversion Shares as the number of Additional Series D Conversion Shares that will be issued depends on the initial public offering price of our common stock.
(2) Pro forma as adjusted consolidated balance sheet data reflects the pro forma items described immediately above plus (1) our sale of shares of common stock in this offering at an assumed initial public offering price of $ per share, the midpoint of the price range set forth on the cover page of this prospectus, after deducting underwriting discounts and commissions and estimated offering expenses payable by us and shares of common stock in the concurrent private placement to entities affiliated with Technology Crossover
12
Table of Contents
Ventures at an assumed initial public offering price of $ per share, the midpoint of the price range set forth on the cover page of this prospectus and (2) repayment of our outstanding term loan and the elimination of the related debt discount.
(3) Pro forma as adjusted consolidated balance sheet data is illustrative only and will change based on the actual initial public offering price and other terms of this offering determined at pricing. Each $1.00 increase or decrease in the assumed initial public offering price of $ per share, the midpoint of the price range set forth on the cover page of this prospectus, would increase or decrease pro forma as adjusted cash, total assets and total stockholders’ (deficit) equity by approximately $ , assuming that the number of shares offered by us, as set forth on the cover page of this prospectus, remains the same, and after deducting underwriting discounts and commissions payable by us, and assuming that the number of shares that we sell to entities affiliated with Technology Crossover Ventures in the concurrent private placement remains the same. We may also increase or decrease the number of shares we are offering. A 1,000,000 share increase or decrease in the number of shares offered by us would increase or decrease pro forma as adjusted cash, total assets and total stockholders’ (deficit) equity by approximately $ million, assuming that the assumed initial public offering price remains the same, and after deducting underwriting discounts and commissions payable by us, and assuming that the number of shares that we sell to entities affiliated with Technology Crossover Ventures in the concurrent private placement remains the same.
Key Metrics
We regularly monitor a number of financial and operating metrics in order to measure our current performance and estimate our future performance. For a description of how we calculate these financial and operating metrics as well as their uses, see “Management’s Discussion and Analysis of Financial Condition and Results of Operations—Key Metrics.”
| Year End December 31, | Three Months Ended March 31, |
|||||||||||||||||||||||||||||||||||||||
| 2012 | 2013 | 2014 | 2014 | 2015 | ||||||||||||||||||||||||||||||||||||
| (dollars in thousands) | ||||||||||||||||||||||||||||||||||||||||
| (unaudited) | ||||||||||||||||||||||||||||||||||||||||
| Total revenue |
$ | 46,044 | $ | 60,030 | $ | 76,880 | $ | 16,736 | $ | 23,571 | ||||||||||||||||||||||||||||||
| Year-over-year growth |
49 | % | 30 | % | 28 | % | 23 | % | 41 | % | ||||||||||||||||||||||||||||||
| Operating cash flow |
$ | (691 | ) | $ | (613 | ) | $ | (3,356 | ) | $ | (2,139 | ) | $ | (3,012 | ) | |||||||||||||||||||||||||
| Deferred revenue |
$ | 44,728 | $ | 59,855 | $ | 85,056 | $ | 61,137 | $ | 88,643 | ||||||||||||||||||||||||||||||
| Number of customers |
2,255 | 2,733 | 3,733 | 2,860 | 3,902 | |||||||||||||||||||||||||||||||||||
13
Table of Contents
Investing in our common stock involves a high degree of risk. You should consider carefully the risks and uncertainties described below, together with all of the other information in this prospectus, including our consolidated financial statements and related notes, before deciding whether to purchase shares of our common stock. If any of the following risks is realized, our business, financial condition, results of operations and prospects could be materially and adversely affected. In that event, the price of our common stock could decline, and you could lose part or all of your investment.
Risks Related to Our Business and Industry
We are a rapidly growing company, which makes it difficult to evaluate our future prospects and may increase the risk that we will not be successful.
We are a rapidly growing company. Our ability to forecast our future operating results is subject to a number of uncertainties, including our ability to plan for and model future growth. We have encountered and will continue to encounter risks and uncertainties frequently experienced by growing companies in rapidly evolving industries. If our assumptions regarding these uncertainties, which we use to plan our business, are incorrect or change in reaction to changes in our markets, or if we do not address these risks successfully, our operating and financial results could differ materially from our expectations, our business could suffer and the trading price of our stock may decline.
If we are unable to sustain our revenue growth rate, we may not achieve or maintain profitability in the future.
From the year ended December 31, 2011 to the year ended December 31, 2014, our revenue grew from $31.0 million to $76.9 million, which represents a compounded annual growth rate of approximately 35%. Although we have experienced rapid growth historically and currently have high renewal rates, we may not continue to grow as rapidly in the future and our renewal rates may decline. Any success that we may experience in the future will depend in large part on our ability to, among other things:
| l | maintain and expand our customer base; |
| l | increase revenues from existing customers through increased or broader use of our products and professional services within their organizations; |
| l | improve the performance and capabilities of our products through research and development; |
| l | continue to develop our cloud-based solutions; |
| l | maintain the rate at which customers purchase our content subscriptions and maintenance and support; |
| l | continue to successfully expand our business domestically and internationally; and |
| l | successfully compete with other companies. |
If we are unable to maintain consistent revenue or revenue growth, our stock price could be volatile, and it may be difficult to achieve and maintain profitability. You should not rely on our revenue for any prior quarterly or annual periods as any indication of our future revenue or revenue growth.
14
Table of Contents
We have not been profitable historically and may not achieve or maintain profitability in the future.
We have posted a net loss in each year since inception, including net losses of approximately $12.4 million in 2012, $18.9 million in 2013, $32.6 million in 2014 and $7.7 million in the three months ended March 31, 2015. As of March 31, 2015, we had an accumulated deficit of $261.4 million. While we have experienced significant revenue growth in recent periods, we are not certain whether or when we will obtain a high enough volume of sales of our products and professional services to sustain or increase our growth or achieve or maintain profitability in the future. We also expect our costs to increase in future periods, which could negatively affect our future operating results if our revenue does not increase. In particular, we expect to continue to expend substantial financial and other resources on:
| l | research and development related to our offerings, including investments in our research and development team; |
| l | sales and marketing, including a significant expansion of our sales organization, both domestically and internationally; |
| l | continued international expansion of our business; |
| l | expansion of our professional services organization; and |
| l | general administration expenses, including legal and accounting expenses related to being a public company. |
These investments may not result in increased revenue or growth in our business. If we are unable to increase our revenue at a rate sufficient to offset the expected increase in our costs, our business, financial position and results of operations will be harmed, and we may not be able to achieve or maintain profitability over the long term. Additionally, we may encounter unforeseen operating expenses, difficulties, complications, delays and other unknown factors that may result in losses in future periods. If our revenue growth does not meet our expectations in future periods, our financial performance may be harmed, and we may not achieve or maintain profitability in the future.
If our products or professional services fail to detect vulnerabilities or incorrectly detect vulnerabilities, or if our products contain undetected errors or defects, our brand and reputation could be harmed, which could have an adverse effect on our business and results of operations.
If our products or professional services fail to detect vulnerabilities in our customers’ cyber security infrastructure, or if our products or professional services fail to identify and respond to new and increasingly complex methods of cyber attacks, our business and reputation may suffer. There is no guarantee that our products or professional services will detect all vulnerabilities, especially in light of the rapidly changing security landscape to which we must respond. Additionally, our products may falsely detect vulnerabilities or threats that do not actually exist. For example, our Metasploit offering relies on information provided by an active community of more than 45,000 security researchers as of April 2015, who contribute new exploits, attacks and vulnerabilities. If the information from these third parties is inaccurate, the potential for false indications of security vulnerabilities increases. These false positives, while typical in the industry, may impair the perceived reliability of our offerings and may therefore adversely impact market acceptance of our products and professional services and could result in negative publicity, loss of customers and sales and increased costs to remedy any problem.
Our products may also contain undetected errors or defects when first introduced or as new versions are released. We have experienced these errors or defects in the past in connection with new products and product upgrades and we expect that these errors or defects will be found from time to time in the future in new or enhanced products after commercial release. Defects may cause our products to be vulnerable to attacks, cause them to fail
15
Table of Contents
to detect vulnerabilities, or temporarily interrupt customers’ networking traffic. Any errors, defects, disruptions in service or other performance problems with our products may damage our customers’ business and could hurt our reputation. If our products or professional services fail to detect vulnerabilities for any reason, we may incur significant costs, the attention of our key personnel could be diverted, our customers may delay or withhold payment to us or elect not to renew or other significant customer relations problems may arise. We may also be subject to liability claims for damages related to errors or defects in our products. A material liability claim or other occurrence that harms our reputation or decreases market acceptance of our products may harm our business and operating results.
An actual or perceived security breach or theft of the sensitive data of one of our customers, regardless of whether the breach is attributable to the failure of our products or professional services, could adversely affect the market’s perception of our offerings and subject us to legal claims.
We face intense competition in our market.
The market for cyber security solutions is highly fragmented, intensely competitive and constantly evolving. We compete with an array of established and emerging security software and services vendors. With the introduction of new technologies and market entrants, we expect the competitive environment to remain intense going forward. Our competitors include: vulnerability management and assessment vendors, including Qualys and Tenable Network Security; diversified security software and services vendors, including McAfee (a subsidiary of Intel), IBM and HP; security services specialists, including Mandiant (a subsidiary of FireEye); and providers of point solutions that compete with some of the features present in our solutions.
Some of our actual and potential competitors have advantages over us, such as longer operating histories, significantly greater financial, technical, marketing or other resources, stronger brand and business user recognition, larger intellectual property portfolios and broader global distribution and presence. In addition, our industry is evolving rapidly and is becoming increasingly competitive. Larger and more established companies may focus on cyber security and could directly compete with us. Smaller companies could also launch new products and services that we do not offer and that could gain market acceptance quickly.
Our competitors may be able to respond more quickly and effectively than we can to new or changing opportunities, technologies, standards or customer requirements. With the introduction of new technologies, the evolution of our offerings and new market entrants, we expect competition to intensify in the future. In addition, some of our larger competitors have substantially broader product offerings and can bundle competing products and services with other software offerings. As a result, customers may choose a bundled product offering from our competitors, even if individual products have more limited functionality than our solutions. These competitors may also offer their products at a lower price as part of this larger sale, which could increase pricing pressure on our offerings and cause the average sales price for our offerings to decline. These larger competitors are also often in a better position to withstand any significant reduction in capital spending, and will therefore not be as susceptible to economic downturns.
Furthermore, our current and potential competitors may establish cooperative relationships among themselves or with third parties that may further enhance their resources and product and services offerings in the markets we address. In addition, current or potential competitors may be acquired by third parties with greater available resources. As a result of such relationships and acquisitions, our current or potential competitors might be able to adapt more quickly to new technologies and customer needs, devote greater resources to the promotion or sale of their products and services, initiate or withstand substantial price competition, take advantage of other opportunities more readily or develop and expand their product and service offerings more quickly than we do. For all of these reasons, we may not be able to compete successfully against our current or future competitors.
16
Table of Contents
The market for our products and professional services is new and unproven and may not grow.
We believe our future success will depend in large part on the growth, if any, in the market for cyber security data and analytics. This market is nascent, and as such, it is difficult to predict important market trends, including the potential growth, if any. To date, the majority of enterprise spend on cyber security has been on threat protection products, such as network, endpoint and web security that are designed to stop threats from penetrating corporate networks. Organizations that use these security products may believe that their existing security solutions sufficiently protect access to their sensitive business data. Therefore, they may continue allocating their cyber security budgets to these products and may not adopt our products and professional services in addition to, or in lieu of, such traditional products. Further, sophisticated cyber attackers are skilled at adapting to new technologies and developing new methods of gaining access to organizations’ sensitive business data, and changes in the nature of advanced cyber threats could result in a shift in IT budgets away from products and professional services such as ours. In addition, while recent high visibility attacks on prominent enterprises and governments have increased market awareness of the problem of cyber attacks, if cyber attacks were to decline, or enterprises or governments perceived that the general level of cyber attacks have declined, our ability to attract new customers and expand our sale to existing customers could be materially and adversely affected. If products and professional services such as ours are not viewed by organizations as necessary, or if customers do not recognize the benefit of our offerings as a critical layer of an effective cyber security strategy, our revenue may not grow as quickly as expected, or may decline, and the trading price of our stock could suffer. It is therefore difficult to predict how large the market will be for our solutions.
In addition, it is difficult to predict customer adoption and renewal rates, customer demand for our products and professional services, the size and growth rate of the market for cyber security data analytics, the entry of competitive products or the success of existing competitive products. Any expansion in our market depends on a number of factors, including the cost, performance and perceived value associated with our offerings and those of our competitors. If these offerings do not achieve widespread adoption or there is a reduction in demand for solutions in our market caused by a lack of customer acceptance, technological challenges, competing technologies and products, decreases in corporate spending, weakening economic conditions, or otherwise, it could result in reduced customer orders, early terminations, reduced renewal rates or decreased revenue, any of which would adversely affect our business operations and financial results. You should consider our business and prospects in light of the risks and difficulties we encounter in this new and unproven market.
Forecasts of our market and market growth may prove to be inaccurate, and even if the markets in which we compete achieve the forecasted growth, there can be no assurance that our business will grow at similar rates, or at all.
Growth forecasts included in this prospectus relating to our market opportunity and the expected growth in the market for information and data security analytics are subject to significant uncertainty and are based on assumptions and estimates which may prove to be inaccurate. Even if these markets meet our size estimates and experience the forecasted growth, we may not grow our business at similar rates, or at all. Our growth is subject to many factors, including our success in implementing our business strategy, which is subject to many risks and uncertainties. Accordingly, the forecasts of market growth included in this prospectus should not be taken as indicative of our future growth.
Organizations may be reluctant to purchase cyber security data analytics offerings that are cloud-based due to the actual or perceived vulnerability of cloud solutions.
Some organizations have been reluctant to use cloud solutions for cyber security, such as UserInsight, because they have concerns regarding the risks associated with the reliability or security of the technology delivery model associated with this solution. If we or other cloud service providers experience security incidents, breaches of customer data, disruptions in service delivery or other problems, the market for cloud solutions as a whole may be negatively impacted.
17
Table of Contents
If we do not continue to innovate and offer products and professional services that address the dynamic threat landscape, we may not remain competitive, and our revenue and operating results could suffer.
The cyber security market is characterized by rapid technological advances, changes in customer requirements, frequent new product introductions and enhancements and evolving industry standards. Our success also depends on continued innovation to provide features that make our products and professional services responsive to the dynamic threat landscape. While we continue to invest significant resources in research and development in order to ensure that our products continue to address the cyber security risks that our customers face, the introduction of products and services embodying new technologies could render our existing products or services obsolete or less attractive to customers. In addition, developing new products and product enhancements is expensive and time consuming, and there is no assurance that such activities will result in significant cost savings, revenue or other expected benefits. If we spend significant time and effort on research and development and are unable to generate an adequate return on our investment, our business and results of operations may be materially and adversely affected. Further, we may not be able to successfully anticipate or adapt to changing technology or customer requirements or the dynamic threat landscape on a timely basis, or at all.
To date, we have derived a substantial majority of our revenue from customers using our threat exposure management offerings. If we are unable to renew or increase sales of our threat exposure management offerings, or if we are unable to increase sales of our other offerings, our business and operating results could be adversely affected.
Although we have recently introduced new products and professional services, we derive and expect to continue to derive a substantial majority of our revenue from customers using certain of our threat exposure management offerings, Nexpose and Metasploit. Approximately two-thirds of our revenue was attributable to Nexpose in each of the last three fiscal years. As a result, our operating results could suffer due to:
| l | any decline in demand for our threat exposure management offerings; |
| l | failure of our threat exposure management offerings to detect vulnerabilities in our customers’ IT environments; |
| l | the introduction of products and technologies that serve as a replacement or substitute for, or represent an improvement over, our threat exposure management offerings; |
| l | technological innovations or new standards that our threat exposure management offerings do not address; |
| l | sensitivity to current or future prices offered by us or competing solutions; and |
| l | our inability to release enhanced versions of our threat exposure management offerings on a timely basis in response to the dynamic threat landscape. |
Our inability to renew or increase sales of our threat exposure management offerings, including content subscriptions and maintenance and support, or a decline in prices of our threat exposure management offerings would harm our business and operating results more seriously than if we derived significant revenues from a variety of offerings. For example, our sales and marketing of our UserInsight product for incident detection and response is relatively new, and it is uncertain whether UserInsight will gain market acceptance. We are also investing heavily in the expansion of our security advisory services offerings, which we believe will help drive demand for our other products in addition to being a stand-alone service. Any factor adversely affecting sales of our products or professional services, including release cycles, market acceptance, competition, performance and reliability, reputation and economic and market conditions, could adversely affect our business and operating results.
18
Table of Contents
If Metasploit were to be used by attackers to exploit vulnerabilities in the cyber security infrastructures of third parties, our reputation and business could be harmed.
Although Metasploit is a penetration testing tool that is intended to allow organizations to test the effectiveness of their cyber security programs, Metasploit also has the potential to be used to exploit vulnerabilities in the cyber security infrastructures of third parties. There is no guarantee that Metasploit will only be used defensively or for research purposes, and any actual or perceived security breach or theft of sensitive data in which Metasploit is believed to have been used could adversely affect perception of, and demand for, our offerings. Further, to the extent that the identification of new exploits and vulnerabilities by the Metasploit community enhances the knowledge base of cyber attackers or enables them to undertake new forms of attacks, we could suffer negative publicity and loss of customers and sales, as well as possible legal claims.
A component of our growth strategy is dependent on our continued international expansion, which adds complexity to our operations.
We market and sell our products and professional services throughout the world and have personnel in many parts of the world. For the year ended December 31, 2014, international operations generated 12% of our revenue. Our growth strategy is dependent, in part, on our continued international expansion. We expect to conduct a significant amount of our business with organizations that are located outside the United States, particularly in Europe and Asia. We cannot assure you that our expansion efforts into international markets will be successful in creating further demand for our products and professional services outside of the United States or in effectively selling our products and professional services in the international markets that we enter. Our current international operations and future initiatives will involve a variety of risks, including:
| l | foreign currency exchange fluctuations; |
| l | trade and foreign exchange restrictions; |
| l | economic or political instability in foreign markets; |
| l | greater difficulty in enforcing contracts, accounts receivable collection and longer collection periods; |
| l | changes in regulatory requirements, including, but not limited to data privacy, data protection and data security regulations; |
| l | difficulties and costs of staffing and managing foreign operations; |
| l | the uncertainty and limitation of protection for intellectual property rights in some countries; |
| l | costs of compliance with foreign laws and regulations and the risks and costs of non-compliance with such laws and regulations; |
| l | costs of compliance with U.S. laws and regulations for foreign operations, including the Foreign Corrupt Practices Act, import and export control laws, tariffs, trade barriers, economic sanctions and other regulatory or contractual limitations on our ability to sell or provide our solutions in certain foreign markets, and the risks and costs of non-compliance; |
| l | heightened risks of unfair or corrupt business practices in certain geographies and of improper or fraudulent sales arrangements that may impact financial results and result in restatements of, and irregularities in, financial statements; |
| l | the potential for political unrest, acts of terrorism, hostilities or war; |
19
Table of Contents
| l | management communication and integration problems resulting from cultural differences and geographic dispersion; |
| l | costs associated with language localization of our products; and |
| l | costs of compliance with multiple and possibly overlapping tax structures. |
Our business, including the sales of our products and professional services by us and our channel partners, may be subject to foreign governmental regulations, which vary substantially from country to country and change from time to time. Our failure, or the failure by our channel partners, to comply with these regulations could adversely affect our business. Further, in many foreign countries it is common for others to engage in business practices that are prohibited by our internal policies and procedures or U.S. regulations applicable to us. Although we have implemented policies and procedures designed to comply with these laws and policies, there can be no assurance that our employees, contractors, channel partners and agents have complied, or will comply, with these laws and policies. Violations of laws or key control policies by our employees, contractors, channel partners or agents could result in delays in revenue recognition, financial reporting misstatements, fines, penalties or the prohibition of the importation or exportation of our products and could have a material adverse effect on our business and results of operations. If we are unable to successfully manage the challenges of international expansion and operations, our business and operating results could be adversely affected.
As a cyber security provider, we are a target of cyber attacks that could adversely impact our reputation and operating results.
We sell cyber security and data analytics products. As a result, we have been and will be a target of cyber attacks designed to impede the performance of our products, penetrate our network security or the security of our cloud platform or our internal systems, or that of our customers, misappropriate proprietary information and/or cause interruptions to our services. For example, because Metasploit serves as an introduction to hacking for many individuals, a successful cyber attack on us may be perceived as a victory for a cyber attacker, thereby increasing the likelihood that we may be a target for attack even absent a financial motive. Further, if our systems are breached, attackers could learn critical information about how our products operate to help protect our customers’ IT infrastructures from cyber risk, thereby making our customers more vulnerable to cyber attacks. In addition, if actual or perceived breaches of our network security occur, they could adversely affect the market perception of our products, negatively affecting our reputation, and may expose us to the loss of our proprietary information or information belonging to our customers, investigations or litigation and possible liability, including injunctive relief and monetary damages. Such security breaches could also divert the efforts of our technical and management personnel. In addition, such security breaches could impair our ability to operate our business and provide products to our customers. If this happens, our reputation could be harmed, our revenue could decline and our business could suffer.
We are dependent on the continued services and performance of our senior management and other key employees, as well as on our ability to successfully hire, train, manage and retain qualified personnel, especially those in sales and marketing and research and development.
Our future performance depends on the continued services and contributions of our senior management, particularly Corey Thomas, our President and Chief Executive Officer, and other key employees to execute on our business plan and to identify and pursue new opportunities and product innovations. We maintain key man insurance on Mr. Thomas, but do not do so for any of our other executive officers or key employees. From time to time, there may be changes in our senior management team resulting from the termination or departure of our executive officers and key employees. Our senior management and key employees are generally employed on an at-will basis, which means that they could terminate their employment with us at any time. The loss of the services of our senior management, particularly Mr. Thomas, or other key employees for any reason could significantly delay or prevent our development or the achievement of our strategic objectives and harm our business, financial condition and results of operations.
20
Table of Contents
Our ability to successfully pursue our growth strategy will also depend on our ability to attract, motivate and retain our personnel, especially those in sales and marketing and research and development. We face intense competition for these employees from numerous technology, software and other companies, especially in certain geographic areas in which we operate, and we cannot ensure that we will be able to attract, motivate and/or retain additional qualified employees in the future. If we are unable to attract new employees and retain our current employees, we may not be able to adequately develop and maintain new products or professional services or market our existing products or professional services at the same levels as our competitors and we may, therefore, lose customers and market share. Our failure to attract and retain personnel, especially those in sales and marketing and research and development positions for which we have historically had a high turnover rate, could have an adverse effect on our ability to execute our business objectives and, as a result, our ability to compete could decrease, our operating results could suffer and our revenue could decrease. Even if we are able to identify and recruit a sufficient number of new hires, these new hires will require significant training before they achieve full productivity and they may not become productive as quickly as we would like or at all.
Our business and operations are experiencing rapid growth, and if we do not appropriately manage our future growth, or are unable to scale our systems and processes, our operating results may be negatively affected.
We are a rapidly growing company. To manage future growth effectively, and in connection with our transition to being a public company, we will need to continue to improve and expand our internal information technology systems, financial infrastructure, and operating and administrative systems and controls, which we may not be able to do efficiently, in a timely manner or at all. Any future growth would add complexity to our organization and require effective coordination across our organization. Failure to manage any future growth effectively could result in increased costs, harm our results of operations and lead to investors losing confidence in our internal systems and processes.
Our quarterly operating results may vary from period to period, which could result in our failure to meet expectations with respect to operating results and cause the trading price of our stock to decline.
Our operating results have historically varied from period to period, and we expect that they will continue to do so as a result of a number of factors, many of which are outside of our control, including:
| l | the level of demand for our products and professional services; |
| l | customer renewal rates; |
| l | the extent to which customers purchase additional products, including content subscriptions and maintenance and support related to our Nexpose, Metasploit and AppSpider products, or professional services; |
| l | the level of perceived threats to organizations’ cyber security; |
| l | network outages, security breaches, technical difficulties or interruptions with our products; |
| l | changes in the growth rate of the markets in which we compete; |
| l | the announcement or adoption of new regulations and policy mandates or changes to existing regulations and policy mandates; |
| l | the timing and success of new product or professional service introductions by us or our competitors or any other changes in the competitive landscape of our industry, including consolidation among our competitors; |
| l | the introduction or adoption of new technologies that compete with our offerings; |
21
Table of Contents
| l | the mix of our products and professional services sold during a period; |
| l | decisions by potential customers to purchase cyber security products or services from other vendors; |
| l | the amount and timing of operating costs and capital expenditures related to the operations and expansion of our business; |
| l | the timing of sales commissions relative to the recognition of revenue and the timing of revenue recognition generally; |
| l | price competition; |
| l | our ability to successfully manage any future acquisitions of businesses, including without limitation the timing of expenses and potential future charges for impairment of goodwill from acquired companies; |
| l | our ability to increase, retain and incentivize the channel partners that market and sell our products and professional services; |
| l | our continued international expansion and associated exposure to changes in foreign currency exchange rates; |
| l | the amount and timing of operating expenses related to the maintenance and expansion of our business, operations and infrastructure; |
| l | unforeseen litigation and intellectual property infringement; |
| l | the announcement or adoption of new regulations and policy mandates or changes to existing regulations and policy mandates; |
| l | the strength of regional, national and global economies; |
| l | the impact of natural disasters or manmade problems such as terrorism; and |
| l | future accounting pronouncements or changes in our accounting policies. |
Each factor above or discussed elsewhere in this prospectus or the cumulative effect of some of these factors may result in fluctuations in our operating results. This variability and unpredictability could result in our failure to meet expectations with respect to operating results, or those of securities analysts or investors, for a particular period. If we fail to meet or exceed expectations for our operating results for these or any other reasons, the market price of our stock could fall and we could face costly lawsuits, including securities class action suits.
We recognize substantially all of our revenue ratably over the term of our agreements with customers and, as a result, downturns or upturns in sales may not be immediately reflected in our operating results.
We recognize substantially all of our revenue ratably over the terms of our agreements with customers, which generally occurs over a one to three-year period. As a result, a substantial portion of the revenue that we report in each period will be derived from the recognition of deferred revenue relating to agreements entered into during previous periods. Consequently, a decline in new sales or renewals in any one period may not be immediately reflected in our revenue results for that period. This decline, however, will negatively affect our revenue in future periods. Accordingly, the effect of significant downturns in sales and market acceptance of our products and potential changes in our rate of renewals may not be fully reflected in our results of operations until future periods. Our model also makes it difficult for us to rapidly increase our revenue through additional sales in any period, as revenue from new customers generally will be recognized over the term of the applicable agreement.
22
Table of Contents
We also intend to increase our investment in research and development, sales and marketing, and general and administrative functions and other areas to grow our business. We are likely to recognize the costs associated with these increased investments earlier than some of the anticipated benefits and the return on these investments may be lower, or may develop more slowly, than we expect, which could adversely affect our operating results.
We may be unable to rapidly and efficiently adjust our cost structure in response to significant revenue declines, which could adversely affect our operating results.
Our brand, reputation and ability to attract, retain and serve our customers are dependent in part upon the reliable performance of our products and network infrastructure.
Our brand, reputation and ability to attract, retain and serve our customers are dependent in part upon the reliable performance of our products and network infrastructure. We have experienced, and may in the future experience, disruptions, outages and other performance problems due to a variety of factors, including infrastructure changes, human or software errors, capacity constraints and fraud or security attacks. In some instances, we may not be able to identify the cause or causes of these performance problems within an acceptable period of time.
We utilize third-party data centers located in Boston, Massachusetts, in addition to operating and maintaining certain elements of our own network infrastructure. We also utilize Amazon Web Services for our UserInsight infrastructure. Some elements of this complex system are operated by third parties that we do not control and that could require significant time to replace. We expect this dependence on third parties to continue. More specifically, certain of our products, in particular our Nexpose managed service and UserInsight products, are hosted on Amazon Web Services, which provides us with computing and storage capacity. Interruptions in our systems or the third-party systems on which we rely, whether due to system failures, computer viruses, physical or electronic break-ins, or other factors, could affect the security or availability of our products, network infrastructure and website.
Prolonged delays or unforeseen difficulties in connection with adding capacity or upgrading our network architecture when required may cause our service quality to suffer. Problems with the reliability or security of our systems could harm our reputation. Damage to our reputation and the cost of remedying these problems could negatively affect our business, financial condition, and operating results.
Additionally, our existing data center facilities and third-party hosting providers have no obligations to renew their agreements with us on commercially reasonable terms or at all, and certain of the agreements governing these relationships may be terminated by either party at any time. If we are unable to maintain or renew our agreements with these providers on commercially reasonable terms or if in the future we add additional data center facilities or third-party hosting providers, we may experience costs or downtime as we transition our operations.
Any disruptions or other performance problems with our products could harm our reputation and business and may damage our customers’ businesses. Interruptions in our service delivery might reduce our revenue, cause us to issue credits to customers, subject us to potential liability and cause customers to not renew their purchases or our products.
If we fail to manage our operations infrastructure, our customers may experience service outages and/or delays.
Our future growth is dependent upon our ability to continue to meet the expanding needs of our customers and to attract new customers. As existing customers gain more experience with our products, they may broaden their reliance on our products, which will require that we expand our operations infrastructure. We also seek to maintain excess capacity in our operations infrastructure to facilitate the rapid provision of new customer deployments. In addition, we need to properly manage our technological operations infrastructure in order to
23
Table of Contents
support changes in hardware and software parameters and the evolution of our products, all of which require significant lead time. If we do not accurately predict our infrastructure requirements, our existing customers may experience service outages that may subject us to financial penalties, financial liabilities and customer losses. If our operations infrastructure fails to keep pace with increased sales, customers may experience delays as we seek to obtain additional capacity, which could adversely affect our reputation and our revenue.
If our products fail to help our customers achieve and maintain compliance with regulations and/or industry standards, our revenue and operating results could be harmed.
We generate a portion of our revenue from our threat exposure management offerings that help organizations achieve and maintain compliance with regulations and industry standards both domestically and internationally. For example, many of our customers subscribe to our threat exposure management offerings to help them comply with the security standards developed and maintained by the Payment Card Industry Security Standards Council, or the PCI Council, which apply to companies that process, transmit or store cardholder data. In addition, our threat exposure management offerings are used by customers in the health care industry to help them comply with numerous federal and state laws and regulations related to patient privacy. In particular, the Health Insurance Portability and Accountability Act of 1996, or HIPAA, and the 2009 Health Information Technology for Economic and Clinical Health Act include privacy standards that protect individual privacy by limiting the uses and disclosures of individually identifiable health information and implementing data security standards. The foregoing and other state, federal and international legal and regulatory regimes may affect our customers’ requirements for, and demand for, our products and professional services. Governments and industry organizations, such as the PCI Council, may also adopt new laws, regulations or requirements, or make changes to existing laws or regulations, that could impact the demand for, or value of, our products. If we are unable to adapt our products to changing legal and regulatory standards or other requirements in a timely manner, or if our products fail to assist with, or expedite, our customers’ cyber security defense and compliance efforts, our customers may lose confidence in our products and could switch to products offered by our competitors, or threaten or bring legal actions against us. In addition, if laws, regulations or standards related to data security, vulnerability management and other IT security and compliance requirements are relaxed or the penalties for non-compliance are changed in a manner that makes them less onerous, our customers may view government and industry regulatory compliance as less critical to their businesses, and our customers may be less willing to purchase our products. In any of these cases, our revenue and operating results could be harmed.
In addition, government and other customers may require our products to comply with certain privacy, security or other certifications and standards. If our products are late in achieving or fail to achieve or maintain compliance with these certifications and standards, or our competitors achieve compliance with these certifications and standards, we may be disqualified from selling our products to such customers, or may otherwise be at a competitive disadvantage, either of which would harm our business, results of operations, and financial condition.
If our customers are unable to implement our products successfully, customer perceptions of our offerings may be impaired or our reputation and brand may suffer.
Our products are deployed in a wide variety of IT environments, including large-scale, complex infrastructures. Some of our customers have experienced difficulties implementing our products in the past and may experience implementation difficulties in the future. If our customers are unable to implement our products successfully, customer perceptions of our offerings may be impaired or our reputation and brand may suffer.
In addition, in order for our products to achieve their functional potential, our products must effectively integrate into our customers’ IT infrastructures, which have different specifications, utilize varied protocol standards, deploy products from multiple different vendors and contain multiple layers of products that have been added over time. Our customers’ IT infrastructures are also dynamic, with a myriad of devices and endpoints entering and exiting the customers’ IT systems on a regular basis, and our products must be able to effectively adapt to and track these changes.
24
Table of Contents
Any failure by our customers to appropriately implement our products or any failure of our products to effectively integrate and operate within our customers’ IT infrastructures could result in customer dissatisfaction, impact the perceived reliability of our products, result in negative press coverage, negatively affect our reputation and harm our financial results.
The continued utility of Metasploit depends in part on the continued contributions from security researchers.
Our Metasploit product relies on information provided by an active community of more than 45,000 security researchers as of April 2015, who contribute new exploits, attacks and vulnerabilities. We expect that the continued contributions from these third parties will both enhance the robustness of Metasploit and also support our sales and marketing efforts. However, to the extent that the information provided by these third parties is inaccurate or malicious, the potential for false indications of security vulnerabilities and susceptibility to attack increases, which could adversely impact market acceptance of our products and professional services and could result in negative publicity, loss of customers and sales and increased costs to remedy any problem. Further, to the extent that our community of third parties is reduced in size or participants become less active, we may lose valuable insight into the dynamic threat landscape and our ability to quickly respond to new exploits, attacks and vulnerabilities may be reduced.
Recent and future acquisitions could disrupt our business and harm our financial condition and operating results.
In order to remain competitive, we have in the past and may in the future seek to acquire additional businesses, products or technologies. The environment for acquisitions in our industry is very competitive and acquisition candidate purchase prices will likely exceed what we would prefer to pay. We also may not find suitable acquisition candidates, and acquisitions we complete may be unsuccessful.
Achieving the anticipated benefits of future acquisitions will depend in part upon whether we can integrate acquired operations, products and technology in a timely and cost-effective manner. The integration process requires, among other things, coordination of administrative, sales and marketing, accounting and finance functions, and expansion of information and management systems. Integration may prove to be difficult due to the necessity of coordinating geographically separate organizations and integrating personnel with disparate business backgrounds and accustomed to different corporate cultures. This process is complex, expensive and time consuming, and may cause an interruption of, or loss of momentum in, product development and sales activities and operations of both companies. Further, we may be unable to retain key personnel of an acquired company following the acquisition. If we are unable to effectively execute acquisitions, our business, financial condition and operating results could be adversely affected.
In addition, we may only be able to conduct limited due diligence on an acquired company’s operations. Following an acquisition, we may be subject to unforeseen liabilities arising from an acquired company’s past or present operations and these liabilities may be greater than the warranty and indemnity limitations that we negotiate. Any unforeseen liability that is greater than these warranty and indemnity limitations could have a negative impact on our financial condition.
We rely on third-party channel partners to generate a substantial amount of our revenue.
Our success is dependent in part upon establishing and maintaining relationships with a variety of channel partners that we utilize to extend our geographic reach and market penetration. We anticipate that we will continue to rely on these partners in order to help facilitate sales of our offerings as part of larger purchases in the United States and to grow our business internationally. For 2012, 2013 and 2014, we derived approximately 30%, 38% and 41%, respectively, of our revenue from sales of products and professional services through channel partners, and the percentage of revenue derived from channel partners may increase in future periods. Our agreements with our channel partners are non-exclusive and do not prohibit them from working with our
25
Table of Contents
competitors or offering competing solutions, and some of our channel partners may have more established relationships with our competitors. If our channel partners choose to place greater emphasis on products of their own or those offered by our competitors or do not effectively market and sell our products and professional services, our ability to grow our business and sell our products and professional services, particularly in key international markets, may be adversely affected. In addition, our failure to recruit additional channel partners, or any reduction or delay in their sales of our products and professional services or conflicts between channel sales and our direct sales and marketing activities may harm our results of operations. Finally, even if we are successful, our relationships with channel partners may not result in greater customer usage of our products and professional services or increased revenue.
Failure to maintain high-quality customer support could have a material adverse effect on our business.
Once our products are deployed within our customers’ networks, our customers depend on our technical and other customer support services to resolve any issues relating to the implementation and maintenance of our products. If we do not effectively assist our customers in deploying our products, help our customers quickly resolve post-deployment issues or provide effective ongoing support, our ability to renew or sell additional products or professional services to existing customers would be adversely affected and our reputation with potential customers could be damaged. Further, to the extent that we are unsuccessful in hiring, training and retaining adequate technical and customer success personnel, our ability to provide adequate and timely support to our customers will be negatively impacted, and our customers’ satisfaction with our offerings will be adversely affected.
We rely on third-party software to operate certain functions of our business.
We rely on software vendors to operate certain critical functions of our business, including financial management and human resource management. If these services become unavailable due to extended outages or interruptions or because they are no longer available on commercially reasonable terms or prices, our expenses could increase, our ability to manage our finances could be interrupted and our processes for managing sales of our solutions and supporting our customers could be impaired until equivalent services, if available, are identified, obtained and integrated, all of which could harm our business.
We use third-party software and data that may be difficult to replace or that may cause errors or failures of our solutions, which could lead to lost customers or harm to our reputation and our operating results.
We license third-party software and security and compliance data from various third parties to deliver our offerings. In the future, this software or data may not be available to us on commercially reasonable terms, or at all. Any loss of the right to use any of this software or data could result in delays in the provisioning of our offerings until equivalent technology or data is either developed by us, or, if available, is identified, obtained and integrated, which could harm our business. In addition, any errors or defects in or failures of this third-party software could result in errors or defects in our products or cause our products to fail, which could harm our business and be costly to correct. Many of these providers attempt to impose limitations on their liability for such errors, defects or failures, and if enforceable, we may have additional liability to our customers or third-party providers that could harm our reputation and increase our operating costs.
We will need to maintain our relationships with third-party software and data providers, and to obtain software and data from such providers that do not contain errors or defects. Any failure to do so could adversely impact our ability to deliver effective solutions to our customers and could harm our operating results.
26
Table of Contents
Our products contain third-party open source software components, and our failure to comply with the terms of the underlying open source software licenses could restrict our ability to sell our products.
Our products contain software licensed to us by third parties under so-called “open source” licenses, including the GNU General Public License, or GPL, the GNU Lesser General Public License, or LGPL, the BSD License, the Apache License and others. From time to time, there have been claims against companies that distribute or use open source software in their products and services, asserting that such open source software infringes the claimants’ intellectual property rights. We could be subject to suits by parties claiming that what we believe to be licensed open source software infringes their intellectual property rights. Use and distribution of open source software may entail greater risks than use of third-party commercial software, as open source licensors generally do not provide warranties or other contractual protections regarding infringement claims or the quality of the code. In addition, certain open source licenses require that source code for software programs that are subject to the license be made available to the public and that any modifications or derivative works to such open source software continue to be licensed under the same terms.
Although we monitor our use of open source software in an effort both to comply with the terms of the applicable open source licenses and to avoid subjecting our products to conditions we do not intend, the terms of many open source licenses have not been interpreted by U.S. courts, and there is a risk that these licenses could be construed in a way that could impose unanticipated conditions or restrictions on our ability to commercialize our products. The terms of certain open source licenses require us to release the source code of our applications and to make our applications available under those open source licenses if we combine or distribute our applications with open source software in a certain manner. In the event that portions of our applications are determined to be subject to an open source license, we could be required to publicly release the affected portions of our source code, re-engineer all, or a portion of, those applications or otherwise be limited in the licensing of our applications. Disclosing our proprietary source code could allow our competitors to create similar products with lower development effort and time and ultimately could result in a loss of sales for us. Disclosing the source code of our proprietary software could also make it easier for cyber attackers and other third parties to discover vulnerabilities in or to defeat the protections of our products, which could result in our products failing to provide our customers with the security they expect. Any of these events could have a material adverse effect on our business, operating results and financial condition.
Our technology alliance partnerships expose us to a range of business risks and uncertainties that could have a material adverse impact on our business and financial results.
We have entered, and intend to continue to enter, into technology alliance partnerships with third parties to support our future growth plans, including with certain of our actual or potential competitors. For example, through these technology alliance partnerships, we integrate with certain third-party application program interfaces, or APIs, which enhance our data collection capabilities in our customers’ IT environments. If these third parties no longer allow us to integrate with their APIs, or if we determine not to maintain these integrations, the functionality of our products may be reduced and our products may not be as marketable to certain potential customers. Technology alliance partnerships require significant coordination between the parties involved, particularly if a partner requires that we integrate its products with our products. Further, we have invested and will continue to invest significant time, money and resources to establish and maintain relationships with our technology alliance partners, but we have no assurance that any particular relationship will continue for any specific period of time or result in new offerings that we can effectively commercialize or enhancements to our existing offerings. In addition, while we believe that entering into technology alliance partnerships with certain of our actual or potential competitors is currently beneficial to our competitive position in the market, such partnerships may also give our competitors insight into our offerings that they may not otherwise have, thereby allowing them to compete more effectively against us.
27
Table of Contents
Our sales cycle may be unpredictable.
The timing of sales of our offerings is difficult to forecast because of the length and unpredictability of our sales cycle, particularly with large enterprises and with respect to certain of our products, such as UserInsight. We sell our products primarily to IT departments that are managing a growing set of user and compliance demands, which has increased the complexity of customer requirements to be met and confirmed during the sales cycle and prolonged our sales cycle. Further, the length of time that potential customers devote to their testing and evaluation, contract negotiation and budgeting processes varies significantly, depending on the size of the organization and nature of the product or professional service under consideration. For example, the length of the sales cycle for our threat exposure management offerings typically ranges from one to six months, while sales of our UserInsight product can exceed twelve months because input from an organization’s senior management is often required before a sale of a product such as UserInsight is consummated and because UserInsight has only been broadly commercially available since 2014. In addition, we might devote substantial time and effort to a particular unsuccessful sales effort, and as a result we could lose other sales opportunities or incur expenses that are not offset by an increase in revenue, which could harm our business.
A portion of our revenue is generated by sales to government entities, which are subject to a number of challenges and risks.
Selling to government entities can be highly competitive, expensive and time consuming, and often requires significant upfront time and expense without any assurance that we will win a sale. Government demand and payment for our products and professional services may also be impacted by public sector budgetary cycles and funding authorizations, with funding reductions or delays adversely affecting public sector demand for our offerings. Government entities also have heightened sensitivity surrounding the purchase of cyber security solutions due to the critical importance of their IT infrastructures, the nature of the information contained within those infrastructures and the fact that they are highly-visible targets for cyber attacks. Accordingly, increasing sales of our products and professional services to government entities may be more challenging than selling to commercial organizations. Further, in the course of providing our products and professional services to government entities, our employees and those of our channel partners may be exposed to sensitive government information. Any failure by us or our channel partners to safeguard and maintain the confidentiality of such information could subject us to liability and reputational harm, which could materially and adversely affect our results of operations and financial performance.
We are exposed to fluctuations in currency exchange rates, which could negatively affect our financial condition and results of operations.
Our reporting currency is the U.S. dollar and we generate a majority of our revenue in U.S. dollars. However, for the year ended December 31, 2014, we incurred approximately 14% of our expenses outside of the United States in foreign currencies, primarily the pound sterling (GBP), principally with respect to salaries and related personnel expenses associated with our sales and research and development operations. Additionally, for the year ended December 31, 2014, 4.1% of our revenue was generated in foreign currencies. Accordingly, changes in exchange rates may have an adverse effect on our business, operating results and financial condition. The exchange rate between the U.S. dollar and foreign currencies has fluctuated substantially in recent years and may continue to fluctuate substantially in the future. The results of our operations may be adversely affected by foreign exchange fluctuations. To date, we have not engaged in any hedging strategies, and any such strategies, such as forward contracts, options and foreign exchange swaps related to transaction exposures that we may implement to mitigate this risk may not eliminate our exposure to foreign exchange fluctuations.
Changes in financial accounting standards may cause an adverse impact our reported results of operations.
A change in accounting standards or practices, particular with respect to revenue recognition, could harm our operating results and may even affect our reporting of transactions completed before the change is effective. New
28
Table of Contents
accounting pronouncements and varying interpretations of accounting pronouncements have occurred and may occur in the future. Changes to existing rules or the questioning of current practices may harm our operating results or the way we conduct our business.
Our business is subject to the risks of earthquakes, fire, power outages, floods and other catastrophic events, and to interruption by manmade problems such as terrorism.
A significant natural disaster, such as an earthquake, fire or a flood, or a significant power outage could have a material adverse impact on our business, operating results and financial condition. In addition, natural disasters could affect our channel partners’ ability to perform services for us on a timely basis. In the event we or our channel partners are hindered by any of the events discussed above, our ability to provide our products or professional services to customers could be delayed.
In addition, our facilities and those of our third-party data centers and hosting providers are vulnerable to damage or interruption from human error, intentional bad acts, pandemics, earthquakes, hurricanes, floods, fires, war, terrorist attacks, power losses, hardware failures, systems failures, telecommunications failures and similar events. The occurrence of a natural disaster, power failure or an act of terrorism, vandalism or other misconduct, a decision by a third party to close a facility on which we rely without adequate notice, or other unanticipated problems could result in lengthy interruptions in provision or delivery of our products, potentially leaving our customers vulnerable to cyber attacks. The occurrence of any of the foregoing events could damage our systems and hardware or could cause them to fail completely, and our insurance may not cover such events or may be insufficient to compensate us for the potentially significant losses, including the potential harm to the future growth of our business, that may result from interruptions in our service as a result of system failures.
All of the aforementioned risks may be exacerbated if the disaster recovery plans for us and our third-party data centers and hosting providers prove to be inadequate. To the extent that any of the above results in delayed or reduced customer sales, our business, financial condition and results of operations could be adversely affected.
We may require additional capital to support business growth, and this capital might not be available on acceptable terms, if at all.
We intend to continue to make investments to support our business growth and may require additional funds to respond to business challenges, including the need to develop new features or enhance our products, improve our operating infrastructure or acquire complementary businesses and technologies. Accordingly, we may need to engage in equity or debt financings to secure additional funds. If we raise additional funds through future issuances of equity or convertible debt securities, our existing stockholders could suffer significant dilution, and any new equity securities we issue could have rights, preferences and privileges superior to those of holders of our common stock. Any debt financing that we may secure in the future could involve restrictive covenants relating to our capital raising activities and other financial and operational matters, which may make it more difficult for us to obtain additional capital and to pursue business opportunities, including potential acquisitions. We may not be able to obtain additional financing on terms favorable to us, if at all. If we are unable to obtain adequate financing or financing on terms satisfactory to us when we require it, our ability to continue to support our business growth and to respond to business challenges could be significantly impaired, and our business may be adversely affected.
Risks Related to Government Regulation, Data Collection, Intellectual Property and Litigation
Failure to comply with governmental laws and regulations could harm our business.
Our business is subject to regulation by various federal, state, local and foreign governments. In certain jurisdictions, these regulatory requirements may be more stringent than those in the United States. Noncompliance with applicable regulations or requirements could subject us to investigations, sanctions,
29
Table of Contents
mandatory product recalls, enforcement actions, disgorgement of profits, fines, damages, civil and criminal penalties, injunctions or other collateral consequences. If any governmental sanctions are imposed, or if we do not prevail in any possible civil or criminal litigation, our business, results of operations, and financial condition could be materially adversely affected. In addition, responding to any action will likely result in a significant diversion of management’s attention and resources and an increase in professional fees. Enforcement actions and sanctions could harm our business, reputation, results of operations and financial condition.
We are subject to governmental export and import controls that could impair our ability to compete in international markets and/or subject us to liability if we are not in compliance with applicable laws.
Like other U.S.-based IT security products, our products are subject to U.S. export control and import laws and regulations, including the U.S. Export Administration Regulations and various economic and trade sanctions regulations administered by the U.S. Treasury Department’s Office of Foreign Assets Control. Exports of these products must be made in compliance with these laws and regulations. If we were to fail to comply with these laws and regulations, we and certain of our employees could be subject to substantial civil and criminal penalties, including fines for our company and responsible employees or managers, and, in extreme cases, incarceration of responsible employees and managers and the possible loss of export privileges. Complying with export control laws and regulations, including obtaining the necessary licenses or authorizations, for a particular sale may be time-consuming, is not guaranteed and may result in the delay or loss of sales opportunities. Changes in export or import laws and regulations, shifts in the enforcement or scope of existing laws and regulations, or changes in the countries, governments, persons, products or services targeted by such laws and regulations, could also result in decreased use of our products by, or in our decreased ability to export or sell our products to, existing or potential customers. A decreased use of our products or limitation on our ability to export or sell our products could adversely affect our business, financial condition and results of operations.
We also incorporate encryption technology into our products. These encryption products may be exported outside of the United States only with the required export authorizations, including by a license, a license exception or other appropriate government authorizations, including the filing of an encryption registration or product classification request. We previously deployed certain of our Metasploit products prior to obtaining the appropriate export authorizations. As such, we did not fully comply with applicable encryption controls in the U.S. Export Administration Regulations. Further, U.S. export control laws and economic sanctions prohibit the shipment of certain products and services to U.S. embargoed or sanctioned countries, governments or persons. Although we take precautions to prevent our products from being provided to those subject to U.S. sanctions, such measures may be circumvented. We are aware of previous exports in the form of downloads of certain of our Metasploit products by persons and organizations that appear to be located in countries that are the subject of U.S. embargoes, and by certain other persons and organizations without the requisite export authorizations. In September 2014, we initiated and filed a voluntary self-disclosure with the U.S. Department of Commerce’s Bureau of Industry and Security, or BIS, concerning our previous failure to obtain required authorizations for certain exports, as well as apparent historical exports of free and trial software to embargoed countries. In March 2015, we filed a supplement to the voluntary self-disclosure to BIS containing additional information regarding unauthorized exports to certain foreign government end-users. Also in March 2015, we filed a voluntary self-disclosure with the U.S. Department of Treasury’s Office of Foreign Assets Control, or OFAC, concerning exports of free and trial versions of our Metasploit products to embargoed countries, specifically Cuba, Iran, Sudan and Syria. As these transactions involved free downloads of our software, we did not derive any revenue from such transactions. On May 22, 2015, OFAC determined not to pursue a civil monetary penalty against us and issued us a Cautionary Letter to resolve our voluntary self-disclosure regarding the free downloads in embargoed countries. The voluntary self-disclosure submitted to BIS currently remains under review, and we are cooperating with BIS. It is possible that the matters discussed in the BIS voluntary self-disclosure could result in monetary penalties or other penalties being assessed against us.
In addition, various countries regulate the import and domestic use of certain encryption technology, including through import permitting and licensing requirements, and have enacted laws that could limit our ability to distribute our products or could limit our customers’ ability to implement our products in those countries.
30
Table of Contents
Encryption products and the underlying technology may also be subject to export control restrictions. Governmental regulation of encryption technology and regulation of imports or exports of encryption products, or our failure to obtain required import or export approval for our products, when applicable, could harm our international sales and adversely affect our revenue. Compliance with applicable laws and regulations regarding the export and import of our products, including with respect to new products or changes in existing products, may create delays in the introduction of our products in international markets, prevent our customers with international operations from deploying our products globally or, in some cases, could prevent the export or import of our products to certain countries, governments, entities or persons altogether.
Finally, there are currently multinational efforts underway as part of the Wassenaar Arrangement on Export Controls for Conventional Arms and Dual-Use Goods and Technologies, or the Wassenaar Arrangement, to impose additional restrictions on certain cyber security products. To implement the controls under the Wassenaar Arrangement in the United States, on May 20, 2015, BIS published a proposed rule for public comment that would amend the Export Administration Regulations with regard to exports, reexports and transfers (in-country) of specified intrusion software, surveillance items and related software and technology. Under the proposed rule, intrusion software and surveillance items are defined broadly and would establish an export license requirement for all countries other than the United States and Canada for many commercially-available penetration testing and network monitoring products, including commercial versions of Metasploit. Obtaining the necessary licenses or authorizations for a particular sale may be time-consuming, is not guaranteed and may result in the delay or loss of sales opportunities. We are evaluating the potential implications of the Wassenaar Arrangement on the commercial versions of Metasploit and plan to submit comments to BIS regarding the proposed rule, which remains subject to public comment, is not currently in effect and may undergo substantial modification before it becomes effective.
Because our products collect and store user and related information, domestic and international privacy and cyber security concerns, and other laws and regulations, could result in additional costs and liabilities to us or inhibit sales of our products.
We, and our customers, are subject to a number of domestic and international laws and regulations that apply to online services and the internet generally. These laws, rules and regulations address a range of issues including data privacy and cyber security, and restrictions or technological requirements regarding the collection, use, storage, protection, retention or transfer of data. The regulatory framework for online services, data privacy and cyber security issues worldwide can vary substantially from jurisdiction to jurisdiction, is rapidly evolving and is likely to remain uncertain for the foreseeable future. Many federal, state and foreign government bodies and agencies have adopted or are considering adopting laws, rules and regulations regarding the collection, use, storage and disclosure of information, web browsing and geolocation data collection, data analytics, cyber security and breach notification procedures. Interpretation of these laws, rules and regulations and their application to our products and professional services in the U.S. and foreign jurisdictions is ongoing and cannot be fully determined at this time.
In the United States, these include rules and regulations promulgated under the authority of the Federal Trade Commission, the Electronic Communications Privacy Act, Computer Fraud and Abuse Act, HIPAA, the Gramm Leach Bliley Act and state breach notification laws, as well as regulator enforcement positions and expectations reflected in federal and state regulatory actions, settlements, consent decrees and guidance documents. Internationally, virtually every jurisdiction in which we operate has established its own data security and privacy legal frameworks with which we, or our customers, must comply, including the Data Protection Directive established in the European Union and the Federal Data Protection Act recently implemented in Germany. Further, many federal, state and foreign government bodies and agencies have introduced, and are currently considering, additional laws and regulations. If passed, we will likely incur additional expenses and costs associated with complying with such laws.
In addition to government regulation, privacy advocates and industry groups may propose new and different self-regulatory standards that either legally or contractually apply to us. Because the interpretation and application of
31
Table of Contents
privacy and data protection laws are still uncertain, it is possible that these laws may be interpreted and applied in a manner that is inconsistent with our existing practices or the features of our products. We may also be subject to claims of liability or responsibility for the actions of third parties with whom we interact or upon whom we rely in relation to various services, including but not limited to vendors and business partners. If so, in addition to the possibility of fines, lawsuits and other claims, we could be required to fundamentally change our business activities and practices or modify our products, which could have an adverse effect on our business. Any inability to adequately address privacy concerns, even if unfounded, or comply with applicable privacy or data protection laws, regulations and policies, could result in additional cost and liability to us, damage our reputation, inhibit sales and adversely affect our business.
The costs of compliance with, and other burdens imposed by, the laws, rules, regulations and policies that are applicable to the businesses of our customers may limit the use and adoption of, and reduce the overall demand for, our software. Privacy or cyber security concerns, whether valid or not valid, may inhibit market adoption of our products particularly in certain industries and foreign countries.
Further, there are active legislative discussions regarding the implementation of laws or regulations that could restrict the manner in which security research is conducted and that could restrict or possibly bar the conduct of penetration testing and the use of exploits, which are an essential component of our Metasploit product and our business strategy more generally. Our failure to comply with existing laws, rules or regulations, changes to existing laws or their interpretation, or the imposition of new laws, rules or regulations, could have a material and adverse impact on our business, results of operations, and financial condition.
Failure to protect our proprietary technology and intellectual property rights could substantially harm our business and operating results.
Our future success and competitive position depend in part on our ability to protect our intellectual property and proprietary technologies. To safeguard these rights, we rely on a combination of patent, trademark, copyright and trade secret laws and contractual protections in the United States and other jurisdictions, all of which provide only limited protection and may not now or in the future provide us with a competitive advantage.
As of March 31, 2015, we had four issued patents and 15 patent applications pending in the United States relating to our products. We cannot assure you that any patents will issue from any patent applications, that patents that issue from such applications will give us the protection that we seek or that any such patents will not be challenged, invalidated, or circumvented. Any patents that may issue in the future from our pending or future patent applications may not provide sufficiently broad protection and may not be enforceable in actions against alleged infringers. We have registered the “Rapid7,” “Nexpose” and “Metasploit” names and logos in the United States and certain other countries. We have registrations and/or pending applications for additional marks in the United States and other countries; however, we cannot assure you that any future trademark registrations will be issued for pending or future applications or that any registered trademarks will be enforceable or provide adequate protection of our proprietary rights. We also license software from third parties for integration into our products, including open source software and other software available on commercially reasonable terms. We cannot assure you that such third parties will maintain such software or continue to make it available.
In order to protect our unpatented proprietary technologies and processes, we rely on trade secret laws and confidentiality agreements with our employees, consultants, channel partners, vendors and others. Despite our efforts to protect our proprietary technology and trade secrets, unauthorized parties may attempt to misappropriate, reverse engineer or otherwise obtain and use them. In addition, others may independently discover our trade secrets, in which case we would not be able to assert trade secret rights, or develop similar technologies and processes. Further, the contractual provisions that we enter into may not prevent unauthorized use or disclosure of our proprietary technology or intellectual property rights and may not provide an adequate remedy in the event of unauthorized use or disclosure of our proprietary technology or intellectual property rights. Moreover, policing unauthorized use of our technologies, trade secrets and intellectual property is difficult, expensive and time-consuming, particularly in foreign countries where the laws may not be as
32
Table of Contents
protective of intellectual property rights as those in the United States and where mechanisms for enforcement of intellectual property rights may be weak. We may be unable to determine the extent of any unauthorized use or infringement of our solutions, technologies or intellectual property rights.
From time to time, legal action by us may be necessary to enforce our patents and other intellectual property rights, to protect our trade secrets, to determine the validity and scope of the intellectual property rights of others or to defend against claims of infringement or invalidity. Such litigation could result in substantial costs and diversion of resources and could negatively affect our business, operating results and financial condition.
Assertions by third parties of infringement or other violations by us of their intellectual property rights, whether or not correct, could result in significant costs and harm our business and operating results.
Patent and other intellectual property disputes are common in our industry. We are currently involved in a lawsuit brought by a non-practicing entity alleging that we have infringed upon a now-expired patent held by such entity and we may from time to time be involved in other such disputes in the ordinary course of our business. Some companies, including some of our competitors, own large numbers of patents, copyrights and trademarks, which they may use to assert claims against us. Third parties have in the past and may in the future assert claims of infringement, misappropriation or other violations of intellectual property rights against us. They may also assert such claims against our customers or channel partners, whom we typically indemnify against claims that our solutions infringe, misappropriate or otherwise violate the intellectual property rights of third parties. As the numbers of products and competitors in our market increase and overlaps occur, claims of infringement, misappropriation and other violations of intellectual property rights may increase. Any claim of infringement, misappropriation or other violation of intellectual property rights by a third party, even those without merit, could cause us to incur substantial costs defending against the claim and could distract our management from our business.
The patent portfolios of our most significant competitors are larger than ours. This disparity may increase the risk that they may sue us for patent infringement and may limit our ability to counterclaim for patent infringement or settle through patent cross-licenses. In addition, future assertions of patent rights by third parties, and any resulting litigation, may involve patent holding companies or other adverse patent owners who have no relevant product revenues and against whom our own patents may therefore provide little or no deterrence or protection. There can be no assurance that we will not be found to infringe or otherwise violate any third-party intellectual property rights or to have done so in the past.
An adverse outcome of a dispute may require us to:
| l | pay substantial damages, including treble damages, if we are found to have willfully infringed a third party’s patents or copyrights; |
| l | cease making, licensing or using solutions that are alleged to infringe or misappropriate the intellectual property of others; |
| l | expend additional development resources to attempt to redesign our solutions or otherwise develop non-infringing technology, which may not be successful; |
| l | enter into potentially unfavorable royalty or license agreements in order to obtain the right to use necessary technologies or intellectual property rights; and |
| l | indemnify our partners and other third parties. |
In addition, royalty or licensing agreements, if required or desirable, may be unavailable on terms acceptable to us, or at all, and may require significant royalty payments and other expenditures. Some licenses may also be
33
Table of Contents
non-exclusive, and therefore our competitors may have access to the same technology licensed to us. Any of the foregoing events could seriously harm our business, financial condition and results of operations.
Our operating results may be harmed if we are required to collect sales and use or other related taxes for our products and professional services in jurisdictions where we have not historically done so.
Taxing jurisdictions, including state, local and foreign taxing authorities, have differing rules and regulations governing sales and use or other taxes, and these rules and regulations are subject to varying interpretations that may change over time. In particular, significant judgment is required in evaluating our tax positions and our worldwide provision for taxes. While we believe that we are in material compliance with our obligations under applicable taxing regimes, one or more states, localities or countries may seek to impose additional sales or other tax collection obligations on us, including for past sales by us or our channel partners. It is possible that we could face sales tax audits and that such audits could result in tax-related liabilities for which we have not accrued. For example, we are currently subject to audits by the Commonwealth of Massachusetts and the State of Washington. A successful assertion that we should be collecting additional sales or other taxes on our offerings in jurisdictions where we have not historically done so and do not accrue for sales taxes could result in substantial tax liabilities for past sales, discourage customers from purchasing our offerings or otherwise harm our business and operating results.
In addition, our tax obligations and effective tax rates could be adversely affected by changes in the relevant tax, accounting and other laws, regulations, principles and interpretations, including those relating to income tax nexus, by recognizing tax losses or lower than anticipated earnings in jurisdictions where we have lower statutory rates and higher than anticipated earnings in jurisdictions where we have higher statutory rates, by changes in foreign currency exchange rates, or by changes in the valuation of our deferred tax assets and liabilities. Although we believe our tax estimates are reasonable, the final determination of any tax audits or litigation could be materially different from our historical tax provisions and accruals, which could have a material adverse effect on our operating results or cash flows in the period or periods for which a determination is made.
Our intercompany relationships are subject to complex transfer pricing regulations, which may be challenged by taxing authorities.
We generally conduct our international operations through wholly-owned subsidiaries and report our taxable income in various jurisdictions worldwide based upon our business operations in those jurisdictions. Our intercompany relationships are and will continue to be subject to complex transfer pricing regulations administered by taxing authorities in various jurisdictions. The relevant taxing authorities may disagree with our determinations as to the income and expenses attributable to specific jurisdictions. If such a disagreement were to occur, and our position were not sustained, we could be required to pay additional taxes, interest and penalties, which could result in one-time tax charges, higher effective tax rates, reduced cash flows and lower overall profitability of our operations.
Our ability to use net operating losses to offset future taxable income may be subject to certain limitations.
As of December 31, 2014, we had federal and state net operating loss carryforwards, or NOLs, of $71.7 million and $59.1 million, respectively, available to offset future taxable income, which expire in various years beginning in 2029 if not utilized. A lack of future taxable income would adversely affect our ability to utilize these NOLs before they expire. Under the provisions of the Internal Revenue Code of 1986, as amended, or the Internal Revenue Code, substantial changes in our ownership may limit the amount of pre-change NOLs that can be utilized annually in the future to offset taxable income. Section 382 of the Internal Revenue Code, or Section 382, imposes limitations on a company’s ability to use NOLs if a company experiences a more-than-50-percent ownership change over a three-year testing period. Based upon our analysis as of December 31, 2014, we determined that although a small limitation on our historical NOLs exists, we do not expect this limitation to impair our ability to use our NOLs prior to expiration. However, if changes in our ownership occur in the future,
34
Table of Contents
our ability to use our NOLs may be further limited. For these reasons, we may not be able to utilize a material portion of the NOLs, even if we achieve profitability. If we are limited in our ability to use our NOLs in future years in which we have taxable income, we will pay more taxes than if we were able to fully utilize our NOLs. This could adversely affect our operating results and the market price of our common stock.
The enactment of legislation implementing changes in the U.S. taxation of international business activities or the adoption of other tax reform policies could materially impact our financial position and results of operations.
Recent changes to U.S. tax laws, including limitations on the ability of taxpayers to claim and utilize foreign tax credits and the deferral of certain tax deductions until earnings outside of the United States are repatriated to the United States, as well as changes to U.S. tax laws that may be enacted in the future, could impact the tax treatment of our foreign earnings. Due to expansion of our international business activities, any changes in the U.S. taxation of such activities may increase our worldwide effective tax rate and adversely affect our financial condition and operating results.
Risk Related to our Common Stock and this Offering
Our stock price may be volatile, and you may lose some or all of your investment.
The initial public offering price for the shares of our common stock will be determined by negotiations between us and the representatives of the underwriters and may not be indicative of the market price of our common stock following this offering. The market price of our common stock may be highly volatile and may fluctuate substantially as a result of a variety of factors, some of which are related in complex ways, including:
| l | actual or anticipated fluctuations in our financial condition and operating results; |
| l | variance in our financial performance from expectations of securities analysts; |
| l | changes in the prices of our products and professional services; |
| l | changes in our projected operating and financial results; |
| l | changes in laws or regulations applicable to our products or professional services; |
| l | announcements by us or our competitors of significant business developments, acquisitions or new offerings; |
| l | our involvement in any litigation; |
| l | our sale of our common stock or other securities in the future; |
| l | changes in senior management or key personnel; |
| l | trading volume of our common stock; |
| l | changes in the anticipated future size and growth rate of our market; and |
| l | general economic, regulatory and market conditions. |
Recently, the stock markets have experienced extreme price and volume fluctuations that have affected and continue to affect the market prices of equity securities of many companies. These fluctuations have often been
35
Table of Contents
unrelated or disproportionate to the operating performance of those companies. Broad market and industry fluctuations, as well as general economic, political, regulatory and market conditions, may negatively impact the market price of our common stock. If the market price of our common stock after this offering does not exceed the initial public offering price, you may lose some or all of your investment. In the past, companies that have experienced volatility in the market price of their securities have been subject to securities class action litigation. We may be the target of this type of litigation in the future, which could result in substantial costs and divert our management’s attention.
No public market for our common stock currently exists, and an active public trading market may not develop or be sustained following this offering.
No public market for our common stock currently exists. An active public trading market may not develop following the completion of this offering or, if developed, may not be sustained. The lack of an active market may impair your ability to sell your shares at the time you wish to sell them or at a price that you consider reasonable. The lack of an active market may also reduce the fair value of your shares. An inactive market may also impair our ability to raise capital to continue to fund operations by selling shares and may impair our ability to acquire other companies or technologies by using our shares as consideration.
If securities or industry analysts do not publish research or reports about our business, or publish negative reports about our business, our stock price and trading volume could decline.
The trading market for our common stock will depend, in part, on the research and reports that securities or industry analysts publish about us or our business. We do not have any control over these analysts. If our financial performance fails to meet analyst estimates or one or more of the analysts who cover us downgrade our shares or change their opinion of our shares, our share price would likely decline. If one or more of these analysts cease coverage of our company or fail to regularly publish reports on us, we could lose visibility in the financial markets, which could cause our share price or trading volume to decline.
We do not intend to pay dividends for the foreseeable future and, as a result, your ability to achieve a return on your investment will depend on appreciation in the price of our common stock.
We have never declared or paid any cash dividends on our common stock and do not intend to pay any cash dividends in the foreseeable future. We anticipate that we will retain all of our future earnings for use in the development of our business and for general corporate purposes. Any determination to pay dividends in the future will be at the discretion of our board of directors. Accordingly, investors must rely on sales of their common stock after price appreciation, which may never occur, as the only way to realize any future gains on their investments.
Concentration of ownership among our existing directors, executive officers and holders of 5% or more of our outstanding common stock may prevent new investors from influencing significant corporate decisions.
Following this offering and the concurrent private placement, our directors, executive officers and holders of more than 5% of our common stock, some of whom are represented on our board of directors, together with their affiliates will beneficially own % of the voting power of our outstanding capital stock. As a result, these stockholders will, immediately following this offering, be able to determine the outcome of matters submitted to our stockholders for approval. Some of these persons or entities may have interests that are different from yours, and this ownership could affect the value of your shares of common stock if, for example, these stockholders elect to delay, defer or prevent a change in corporate control, merger, consolidation, takeover or other business combination. This concentration of ownership may also adversely affect the market price of our common stock.
36
Table of Contents
We may invest or spend the proceeds of this offering in ways with which you may not agree or in ways which may not yield a return.
We anticipate that the net proceeds from this offering and the concurrent private placement will be used for working capital and other general corporate purposes, including the payment of our outstanding term loan and associated termination fee. We may also use a portion of the net proceeds to acquire complementary businesses, products or technologies. However, we do not have any agreements or commitments for any acquisitions at this time. Our management will have considerable discretion in the application of the net proceeds, and you will not have the opportunity, as part of your investment decision, to assess whether the proceeds are being used effectively. The net proceeds may be invested with a view towards long-term benefits for our stockholders and this may not increase our operating results or market value. The failure by our management to apply these funds effectively may adversely affect the return on your investment.
Future sales of our common stock in the public market could cause our share price to decline.
After this offering and the concurrent private placement, there will be shares of our common stock outstanding, assuming no exercise of the underwriters’ over-allotment option. Sales of a substantial number of shares of our common stock in the public market after this offering, or the perception that these sales might occur, could depress the market price of our common stock and could impair our ability to raise capital through the sale of additional equity securities. Of our issued and outstanding shares of our common stock, all of the shares sold in this offering will be freely transferable without restrictions or further registration under the Securities Act of 1933, as amended, or the Securities Act, except for any shares acquired by our affiliates, as defined in Rule 144 under the Securities Act. The remaining shares outstanding after this offering and the concurrent private placement will be restricted as a result of securities laws, lock-up agreements or other contractual restrictions that restrict transfers for 180 days after the date of this prospectus.
Additionally, following the completion of this offering and the concurrent private placement, stockholders holding approximately % of our common stock outstanding, will, after the expiration of the lock-up periods specified above, have the right, subject to various conditions and limitations, to include their shares of our common stock in registration statements relating to our securities. If the offer and sale of these shares are registered, they will be freely tradable without restriction under the Securities Act. Shares of common stock sold under such registration statements can be freely sold in the public market. In the event such registration rights are exercised and a large number of shares of common stock are sold in the public market, such sales could reduce the trading price of our common stock. See “Description of Capital Stock—Registration Rights” and “Shares Eligible for Future Sale—Lock-Up Agreements” for a more detailed description of these registration rights and the lock-up period.
We intend to file a registration statement on Form S-8 under the Securities Act to register the total number of shares of our common stock that may be issued under our equity incentive plans. See the information under the heading “Shares Eligible for Future Sale—Form S-8 Registration Statements” for a more detailed description of the shares of common stock that will be available for future sale upon the registration and issuance of such shares, subject to any applicable vesting or lock-up period or other restrictions provided under the terms of the applicable plan and/or the option agreements entered into with the option holders. In addition, in the future we may issue common stock or other securities if we need to raise additional capital. The number of new shares of our common stock issued in connection with raising additional capital could constitute a material portion of the then outstanding shares of our common stock.
You will experience immediate and substantial dilution in the net tangible book value of the shares of common stock you purchase in this offering.
The initial public offering price of our common stock will be substantially higher than the pro forma net tangible book value per share of our common stock, as of March 31, 2015, immediately after this offering and the concurrent private placement. Therefore, if you purchase shares of our common stock in this offering, you will
37
Table of Contents
suffer immediate dilution of $ per share, or $ per share if the underwriters exercise their over-allotment option in full, in net tangible book value after giving effect to the sale of common stock in this offering at an assumed public offering price of $ per share, the midpoint of the estimated initial public offering price range set forth on the cover page of this prospectus. See “Dilution.” If outstanding options or warrants to purchase our common stock are exercised in the future, you will experience additional dilution.
We are an “emerging growth company” and we cannot be certain if the reduced disclosure requirements applicable to emerging growth companies will make our common stock less attractive to investors.
We are an “emerging growth company,” as defined in the JOBS Act, and we may take advantage of certain exemptions from various reporting requirements that are applicable to other public companies that are not “emerging growth companies” including, but not limited to, the auditor attestation requirements of Section 404 of the Sarbanes-Oxley Act, reduced disclosure obligations regarding executive compensation in our periodic reports and proxy statements, and exemptions from the requirements of holding a nonbinding advisory vote on executive compensation and stockholder approval of any golden parachute payments not previously approved. We cannot predict if investors will find our common stock less attractive if we choose to rely on these exemptions. If some investors find our common stock less attractive as a result, there may be a less active trading market for our common stock and our stock price may be more volatile.
We will incur increased costs as a result of operating as a public company, and our management will be required to devote substantial time to compliance with our public company responsibilities and corporate governance practices.
As a public company, and particularly after we are no longer an “emerging growth company,” we will incur significant legal, accounting and other expenses that we did not incur as a private company. The Sarbanes-Oxley Act, the Dodd-Frank Wall Street Reform and Consumer Protection Act, the listing requirements of the NASDAQ Stock Market and other applicable securities rules and regulations impose various requirements on public companies. Our management and other personnel will need to devote a substantial amount of time to compliance with these requirements. Moreover, these rules and regulations will increase our legal and financial compliance costs and will make some activities more time-consuming and costly. For example, we expect that these rules and regulations may make it more difficult and more expensive for us to obtain directors’ and officers’ liability insurance, which could make it more difficult for us to attract and retain qualified members of our board of directors. We cannot predict or estimate the amount of additional costs we will incur as a public company or the timing of such costs.
As a result of becoming a public company, we will be obligated to develop and maintain proper and effective internal controls over financial reporting and any failure to maintain the adequacy of these internal controls may adversely affect investor confidence in our company and, as a result, the value of our common stock.
We will be required, pursuant to Section 404 of the Sarbanes-Oxley Act, or Section 404, to furnish a report by management on, among other things, the effectiveness of our internal control over financial reporting for the first fiscal year beginning after the effective date of this offering. This assessment will need to include disclosure of any material weaknesses identified by our management in our internal control over financial reporting. Our independent registered public accounting firm will not be required to attest to the effectiveness of our internal control over financial reporting until our first annual report required to be filed with the SEC following the date we are no longer an “emerging growth company,” as defined in the JOBS Act. We will be required to disclose significant changes made in our internal control procedures on a quarterly basis.
We have commenced the costly and challenging process of compiling the system and processing documentation necessary to perform the evaluation needed to comply with Section 404, and we may not be able to complete our evaluation, testing and any required remediation in a timely fashion. Our compliance with Section 404 will require that we incur substantial accounting expense and expend significant management efforts. We currently do not have an internal audit group, and we will need to hire additional accounting and financial staff with
38
Table of Contents
appropriate public company experience and technical accounting knowledge and compile the system and process documentation necessary to perform the evaluation needed to comply with Section 404.
During the evaluation and testing process of our internal controls, if we identify one or more material weaknesses in our internal control over financial reporting, we will be unable to assert that our internal control over financial reporting is effective. We cannot assure you that there will not be material weaknesses or significant deficiencies in our internal control over financial reporting in the future. Any failure to maintain internal control over financial reporting could severely inhibit our ability to accurately report our financial condition or results of operations. If we are unable to conclude that our internal control over financial reporting is effective, or if our independent registered public accounting firm determines we have a material weakness or significant deficiency in our internal control over financial reporting, we could lose investor confidence in the accuracy and completeness of our financial reports, the market price of our common stock could decline, and we could be subject to sanctions or investigations by the NASDAQ Stock Market, the SEC or other regulatory authorities. Failure to remedy any material weakness in our internal control over financial reporting, or to implement or maintain other effective control systems required of public companies, could also restrict our future access to the capital markets.
Anti-takeover provisions in our charter documents and under Delaware law could make an acquisition of us more difficult, limit attempts by our stockholders to replace or remove our current management and limit the market price of our common stock.
Provisions in our amended and restated certificate of incorporation and amended and restated bylaws, as will be in effect upon the completion of this offering, may have the effect of delaying or preventing a change in control or changes in our management. Our amended and restated certificate of incorporation and amended and restated bylaws will include provisions that:
| l | authorize our board of directors to issue preferred stock without further stockholder action and with voting liquidation, dividend and other rights superior to our common stock; |
| l | require that any action to be taken by our stockholders be effected at a duly called annual or special meeting and not by written consent, and limit the ability of our stockholders to call special meetings; |
| l | establish an advance notice procedure for stockholder proposals to be brought before an annual meeting, including proposed nominations of persons for director nominees; |
| l | establish that our board of directors is divided into three classes, with directors in each class serving three-year staggered terms; |
| l | require the approval of holders of two-thirds of the shares entitled to vote at an election of directors to adopt, amend or repeal our amended and restated bylaws or amend or repeal the provisions of our amended and restated certificate of incorporation regarding the election and removal of directors and the ability of stockholders to take action by written consent or call a special meeting; |
| l | prohibit cumulative voting in the election of directors; and |
| l | provide that vacancies on our board of directors may be filled only by a majority of directors then in office, even though less than a quorum. |
These provisions may frustrate or prevent any attempts by our stockholders to replace or remove our current management by making it more difficult for stockholders to replace members of our board of directors, which is responsible for appointing the members of our management. In addition, because we are incorporated in Delaware, we are governed by the provisions of Section 203 of the Delaware General Corporation Law, which
39
Table of Contents
generally prohibits a Delaware corporation from engaging in any of a broad range of business combinations with any “interested” stockholder for a period of three years following the date on which the stockholder became an “interested” stockholder. Any of the foregoing provisions could limit the price that investors might be willing to pay in the future for shares of our common stock, and they could deter potential acquirers of our company, thereby reducing the likelihood that you would receive a premium for your shares of our common stock in an acquisition.
Our amended and restated certificate of incorporation will designate the Court of Chancery of the State of Delaware as the exclusive forum for certain litigation that may be initiated by our stockholders, which could limit our stockholders’ ability to obtain a favorable judicial forum for disputes with us.
Pursuant to our amended and restated certificate of incorporation, as will be in effect upon the completion of this offering, unless we consent in writing to the selection of an alternative forum, the Court of Chancery of the State of Delaware will be the sole and exclusive forum for (1) any derivative action or proceeding brought on our behalf, (2) any action asserting a claim of breach of a fiduciary duty owed by any of our directors, officers or other employees to us or our stockholders, (3) any action asserting a claim arising pursuant to any provision of the Delaware General Corporation Law, our amended and restated certificate of incorporation or our amended and restated bylaws or (4) any action asserting a claim governed by the internal affairs doctrine. Our amended and restated certificate of incorporation will further provide that any person or entity purchasing or otherwise acquiring any interest in shares of our common stock is deemed to have notice of and consented to the foregoing provision. The forum selection clause in our amended and restated certificate of incorporation may limit our stockholders’ ability to obtain a favorable judicial forum for disputes with us.
40
Table of Contents
SPECIAL NOTE REGARDING FORWARD-LOOKING STATEMENTS
This prospectus contains forward-looking statements that involve substantial risks and uncertainties. The forward-looking statements are contained principally in the sections of this prospectus entitled “Prospectus Summary,” “Risk Factors,” “Management’s Discussion and Analysis of Financial Condition and Results of Operations” and “Business,” but are also contained elsewhere in this prospectus. In some cases, you can identify forward-looking statements by the words “anticipate,” “believe,” “continue,” “could,” “estimate,” “expect,” “intend,” “may,” “might,” “objective,” “ongoing,” “plan,” “predict,” “project,” “potential,” “should,” “will,” or “would,” or the negative of these terms, or other comparable terminology intended to identify statements about the future. These statements involve known and unknown risks, uncertainties and other factors that may cause our actual results, levels of activity, performance or achievements to be materially different from the information expressed or implied by these forward-looking statements. Although we believe that we have a reasonable basis for each forward-looking statement contained in this prospectus, we caution you that these statements are based on a combination of facts and factors currently known by us and our expectations of the future, about which we cannot be certain. Forward-looking statements include statements about:
| l | our ability to continue to add new customers, maintain existing customers and sell new products and professional services to new and existing customers; |
| l | the effects of increased competition as well as innovations by new and existing competitors in our market; |
| l | our ability to adapt to technological change and effectively enhance, innovate and scale our solutions; |
| l | our ability to effectively manage or sustain our growth and to attain and sustain profitability; |
| l | our ability to diversify our sources of revenue; |
| l | potential acquisitions and integration of complementary business and technologies; |
| l | our expected use of proceeds; |
| l | our ability to maintain, or strengthen awareness of, our brand; |
| l | perceived or actual security, integrity, reliability, quality or compatibility problems with our solutions, including related to security breaches in our customers’ systems, unscheduled downtime or outages; |
| l | statements regarding future revenue, hiring plans, expenses, capital expenditures, capital requirements and stock performance; |
| l | our ability to attract and retain qualified employees and key personnel and further expand our overall headcount; |
| l | our ability to grow, both domestically and internationally; |
| l | our ability to stay abreast of new or modified laws and regulations that currently apply or become applicable to our business both in the United States and internationally including laws and regulations related to export compliance; |
| l | our ability to maintain, protect and enhance our intellectual property; |
| l | costs associated with defending intellectual property infringement and other claims; and |
| l | the future trading prices of our common stock and the impact of securities analysts’ reports on these prices. |
41
Table of Contents
We caution you that the foregoing list may not contain all of the forward-looking statements made in this prospectus.
You should refer to the “Risk Factors” section of this prospectus for a discussion of important factors that may cause our actual results to differ materially from those expressed or implied by our forward-looking statements. As a result of these factors, we cannot assure you that the forward-looking statements in this prospectus will prove to be accurate. Furthermore, if our forward-looking statements prove to be inaccurate, the inaccuracy may be material. In light of the significant uncertainties in these forward-looking statements, you should not regard these statements as a representation or warranty by us or any other person that we will achieve our objectives and plans in any specified time frame or at all. We undertake no obligation to publicly update any forward-looking statements, whether as a result of new information, future events or otherwise, except as required by law. The Private Securities Litigation Reform Act of 1995 and Section 27A of the Securities Act do not protect any forward-looking statements that we make in connection with this offering.
You should read this prospectus and the documents that we reference in this prospectus and have filed as exhibits to the registration statement, of which this prospectus is a part, completely and with the understanding that our actual future results may be materially different from what we expect. We qualify all of our forward-looking statements by these cautionary statements.
42
Table of Contents
Unless otherwise indicated, information contained in this prospectus concerning our industry and the market in which we operate, including our general expectations and market position, market opportunity and market size is based on information from various sources, including independent industry publications by Frost & Sullivan, Gartner, Inc., or Gartner, International Data Corporation, Mandiant, a FireEye, Inc. company, PricewaterhouseCoopers LLP, RAND Corporation and Verizon Communications Inc. The reports published by Gartner and described herein, or the Gartner Reports, represent data, research opinions or viewpoints published, as part of a syndicated service, by Gartner, and are not representations of fact. Each Gartner Report speaks as of its original publication date (and not as of the date of this prospectus) and the opinions expressed in each Gartner Report are subject to change without notice.
In presenting this information, we have also made assumptions based on such data and other similar sources, and on our knowledge of, and in our experience to date in, the markets for our solutions. This information involves a number of assumptions and limitations, and you are cautioned not to give undue weight to such estimates. Although neither we nor the underwriters have independently verified the accuracy or completeness of any third-party information, we believe the market position, market opportunity and market size information included in this prospectus is reliable. The industry in which we operate is subject to a high degree of uncertainty and risk due to a variety of factors, including those described in the “Risk Factors” section. These and other factors could cause results to differ materially from those expressed in the estimates made by the independent parties and by us.
43
Table of Contents
We estimate that the net proceeds from our issuance and sale of shares of our common stock in this offering will be approximately $ million, or approximately $ million if the underwriters exercise their over-allotment option in full, based upon an assumed initial public offering price of $ per share, the midpoint of the price range set forth on the cover page of this prospectus, after deducting underwriting discounts and commissions and estimated offering expenses payable by us. Our net proceeds from the concurrent private placement will be $5.0 million.
Each $1.00 increase or decrease in the assumed initial public offering price of $ per share, the midpoint of the price range set forth on the cover page of this prospectus, would increase or decrease the net proceeds to us from this offering by approximately $ million, assuming that the number of shares offered by us, as set forth on the cover page of this prospectus, remains the same, and after deducting underwriting discounts and commissions payable by us. We may also increase or decrease the number of shares we are offering. Each 1,000,000 share increase or decrease in the number of shares offered by us would increase or decrease the net proceeds to us from this offering by approximately $ million, assuming that the assumed initial price to the public remains the same, and after deducting underwriting discounts and commissions payable by us. We do not expect that a change in the initial price to the public or the number of shares by these amounts would have a material effect on uses of the proceeds from this offering, although it may accelerate the time at which we will need to seek additional capital.
The principal purposes of this offering are to increase our financial flexibility, create a public market for our common stock, and facilitate our future access to the capital markets. Although we have not yet determined with certainty the manner in which we will allocate the net proceeds of this offering, we expect to use the net proceeds from this offering and the concurrent private placement for working capital and other general corporate purposes, including investments in sales and marketing in the United States and internationally and in research and development. We also intend to use $ million of the net proceeds to pay all remaining outstanding principal and interest, together with a termination fee, under our term loan with Silicon Valley Bank, which carries a current interest rate of 12% and expires in December 2017. We may also use a portion of the proceeds from this offering for acquisitions or strategic investments in complementary businesses or technologies, although we do not currently have any plans for any such acquisitions or investments. We have not allocated specific amounts of net proceeds for any of these purposes.
The expected use of net proceeds from this offering and the concurrent private placement represents our intentions based upon our present plans and business conditions. We cannot predict with certainty all of the particular uses for the proceeds of this offering or the amounts that we will actually spend on the uses set forth above. Accordingly, our management will have significant flexibility in applying the net proceeds of this offering. The timing and amount of our actual expenditures will be based on many factors, including cash flows from operations and the anticipated growth of our business. Pending their use, we intend to invest the net proceeds of this offering in a variety of capital-preservation investments, including short- and intermediate-term, interest-bearing investment-grade securities.
44
Table of Contents
We have never declared or paid any dividends on our capital stock. We currently intend to retain all available funds and any future earnings for the operation and expansion of our business and, therefore, we do not anticipate declaring or paying cash dividends in the foreseeable future. The payment of dividends will be at the discretion of our board of directors and will depend on our results of operations, capital requirements, financial condition, prospects, contractual arrangements, any limitations on payment of dividends present in our current and future debt agreements and other factors that our board of directors may deem relevant.
45
Table of Contents
The following table sets forth our cash and our capitalization as of March 31, 2015:
| l | on an actual basis; |
| l | on a pro forma basis to reflect (1) the conversion of all outstanding shares of our preferred stock into shares of common stock immediately prior to the closing of this offering, including the Additional Series D Conversion Shares and (2) the filing of our amended and restated certificate of incorporation, which will become effective immediately prior to the closing of this offering; and |
| l | on a pro forma as adjusted basis to reflect (1) the sale of shares of common stock in this offering at an assumed initial public offering price of $ per share, the midpoint of the price range set forth on the cover page of this prospectus, after deducting underwriting discounts and commissions and estimated offering expenses payable by us and shares of common stock in the concurrent private placement to entities affiliated with Technology Crossover Ventures at an assumed initial public offering price of $ per share, the midpoint of the price range set forth on the cover page of this prospectus and (2) repayment of our outstanding term loan and the elimination of the related debt discount. |
See “Prospectus Summary—The Offering” for a description of the Additional Series D Conversion Shares as the number of Additional Series D Conversion Shares that will be issued depends on the initial public offering price of our common stock.
You should read this table together with “Selected Consolidated Financial Statements,” “Management’s Discussion and Analysis of Financial Condition and Results of Operations” and our consolidated financial statements and the related notes appearing elsewhere in this prospectus.
| As of March 31, 2015 | ||||||||||||
| Actual | Pro Forma | Pro Forma As Adjusted(1) |
||||||||||
| (in thousands, except share and per share data) | ||||||||||||
| Cash |
$ | 33,343 | $ | $ | ||||||||
|
|
|
|
|
|
|
|||||||
| Debt |
17,009 | |||||||||||
| Capital lease obligation |
261 | |||||||||||
| Redeemable convertible preferred stock, $0.01 par value per share; 16,392,603 shares authorized, 16,382,615 shares issued and outstanding, actual; no shares authorized, issued or outstanding, pro forma and pro forma as adjusted |
222,871 | — | — | |||||||||
| Stockholders’ (deficit) equity: |
||||||||||||
| Preferred stock, $0.01 par value per share; no shares authorized, issued or outstanding, actual; 10,000,000 shares authorized, no shares issued or outstanding, pro forma and pro forma as adjusted |
— | — | — | |||||||||
| Common stock, $0.01 par value per share; 35,700,000 shares authorized, 12,699,802 shares issued and outstanding, actual; 100,000,000 shares authorized, shares issued and outstanding, pro forma; 100,000,000 shares authorized, shares issued and outstanding, pro forma as adjusted |
127 | |||||||||||
| Additional paid-in capital |
— | |||||||||||
| Accumulated deficit |
(261,435) | |||||||||||
| Treasury stock |
(3,526) | |||||||||||
|
|
|
|
|
|
|
|||||||
| Total stockholders’ (deficit) equity |
(264,834) | |||||||||||
|
|
|
|
|
|
|
|||||||
| Total capitalization |
$ | (24,693) | $ | $ | ||||||||
|
|
|
|
|
|
|
|||||||
| (1) | The pro forma as adjusted information set forth above is illustrative only and will change based on the actual initial public offering price and other terms of this offering determined at pricing. Each $1.00 increase or decrease in the assumed initial public offering price of |
46
Table of Contents
| $ per share, the midpoint of the price range set forth on the cover page of this prospectus, would increase or decrease pro forma as adjusted cash, additional paid-in capital, total stockholders’ (deficit) equity and total capitalization by approximately $ million, assuming that the number of shares offered by us, as set forth on the cover page of this prospectus, remains the same, and after deducting underwriting discounts and commissions payable by us, and assuming that the number of shares that we sell to entities affiliated with Technology Crossover Ventures in the concurrent private placement remains the same. We may also increase or decrease the number of shares we are offering. A 1,000,000 share increase or decrease in the number of shares offered by us would increase or decrease pro forma as adjusted cash, additional paid-in capital, total stockholders’ (deficit) equity and total capitalization by approximately $ million, assuming that the assumed initial public offering price remains the same, and after deducting underwriting discounts and commissions payable by us, and assuming that the number of shares that we sell to entities affiliated with Technology Crossover Ventures in the concurrent private placement remains the same. |
The number of shares of our common stock shown as issued and outstanding on a pro forma as adjusted basis in the table above is based on the number of shares of our common stock outstanding as of March 31, 2015, and excludes:
| l | 4,006,962 shares of common stock issuable upon the exercise of options outstanding as of March 31, 2015, at a weighted-average exercise price of $5.44 per share; |
| l | 200,000 shares of common stock issuable upon the exercise of warrants outstanding as of March 31, 2015, at an exercise price of $10.00 per share; |
| l | shares of our common stock reserved for future issuance pursuant to our 2015 Plan which will become effective prior to the completion of this offering and will include provisions that automatically increase the number of shares of common stock reserved for issuance thereunder each year; and |
| l | shares of common stock reserved for future issuance under our 2015 Employee Stock Purchase Plan, which will become effective prior to the completion of this offering and will include provisions that automatically increase the number of shares of common stock reserved for issuance thereunder each year. |
47
Table of Contents
If you invest in our common stock, your interest will be diluted to the extent of the difference between the initial public offering price per share of our common stock and the pro forma as adjusted net tangible book value per share of our common stock immediately after the completion of this offering.
Our historical net tangible book value as of March 31, 2015 was $(277.1) million, or $(21.82) per share of common stock. Our historical net tangible book value per share represents our total tangible assets less our total liabilities and preferred stock (which is not included within stockholders’ (deficit) equity), divided by the number of shares of common stock outstanding as of March 31, 2015.
Our pro forma net tangible book value as of March 31, 2015 was $ million, or $ per share of common stock. Pro forma net tangible book value per share represents our total tangible assets less our total liabilities, divided by the number of shares of common stock outstanding as of March 31, 2015, after giving effect to the conversion of all of our outstanding shares of our preferred stock into shares of common stock immediately prior to the closing of this offering, including the issuance of the Additional Series D Conversion Shares. See “Prospectus Summary—The Offering” for a description of the Additional Series D Conversion Shares as the number of Additional Series D Conversion Shares that will be issued depends on the initial public offering price of our common stock.
Our pro forma as adjusted net tangible book value represents our pro forma net tangible book value, plus the effect of (1) the sale of shares of common stock in this offering at an assumed initial public offering price of $ per share, the midpoint of the price range set forth on the cover page of this prospectus, after deducting underwriting discounts and commissions and estimated offering expenses payable by us and shares of common stock in the concurrent private placement to entities affiliated with Technology Crossover Ventures at an assumed initial public offering price of $ per share, the midpoint of the price range set forth on the cover page of this prospectus and (2) repayment of our outstanding term loan and the elimination of the related debt discount. Our pro forma as adjusted net tangible book value as of March 31, 2015 was $ million, or $ per share of common stock. This amount represents an immediate increase in pro forma as adjusted net tangible book value of $ per share to our existing stockholders and an immediate dilution of $ per share to investors participating in this offering. We determine dilution per share to investors participating in this offering by subtracting pro forma as adjusted net tangible book value per share after this offering from the assumed initial public offering price per share paid by investors participating in this offering.
The following table illustrates this dilution on a per share basis to new investors:
| Assumed initial public offering price per share |
$ | |||||||||
| Historical net tangible book value per share as of March 31, 2015 |
$ | (21.82) | ||||||||
| Increase per share attributable to the pro forma transactions described above |
||||||||||
| Pro forma net tangible book value per share as of March 31, 2015 |
||||||||||
| Increase in pro forma net tangible book value per share attributed to new investors purchasing shares from us in this offering |
||||||||||
|
|
|
|||||||||
| Pro forma as adjusted net tangible book value per share after giving effect to this offering |
||||||||||
|
|
| |||||||||
| Dilution in pro forma as adjusted net tangible book value per share to new investors in this offering |
$ | |||||||||
|
|
| |||||||||
The dilution information discussed above is illustrative only and will change based on the actual initial public offering price and other terms of this offering determined at pricing. Each $1.00 increase or decrease in the assumed initial public offering price of $ per share, the midpoint of the price range set forth on the cover page of this prospectus, would increase or decrease the pro forma as adjusted net tangible book value per share by $ per share and the dilution per share to investors participating in this offering by $ per share, assuming that the number of shares offered by us, as set forth on the cover page of this prospectus, remains the same, after deducting underwriting discounts and commissions payable by us and after repayment of our
48
Table of Contents
outstanding term loan and the elimination of the related debt discount. We may also increase or decrease the number of shares we are offering. A 1,000,000 share increase in the number of shares offered by us, as set forth on the cover page of this prospectus, would increase the pro forma as adjusted net tangible book value per share by $ and decrease the dilution per share to investors participating in this offering by $ , assuming the assumed initial public offering price of $ per share, the midpoint of the price range set forth on the cover page of this prospectus, remains the same, after deducting underwriting discounts and commissions payable by us and after repayment of our outstanding term loan and the elimination of the related debt discount. A 1,000,000 share decrease in the number of shares offered by us, as set forth on the cover page of this prospectus, would decrease the pro forma as adjusted net tangible book value per share after this offering by $ and increase the dilution per share to new investors participating in this offering by $ , assuming the assumed initial public offering price of $ per share, the midpoint of the price range set forth on the cover page of this prospectus, remains the same, after deducting underwriting discounts and commissions payable by us and after repayment of our outstanding term loan and the elimination of the related debt discount. The pro forma as adjusted information discussed above is illustrative only and will adjust based on the actual initial public offering price and other terms of this offering determined at pricing.
If the underwriters exercise their over-allotment option in full to purchase an additional shares of our common stock in this offering, the pro forma as adjusted net tangible book value of our common stock would increase to $ per share, representing an immediate increase to existing stockholders of $ per share and an immediate dilution of $ per share to investors participating in this offering.
The following table summarizes as of March 31, 2015, on the pro forma as adjusted basis described above, the number of shares of our common stock, the total consideration and the average price per share (1) paid to us by our existing stockholders (including shares of common stock purchased by entities affiliated with Technology Crossover Ventures in the concurrent private placement) and (2) to be paid by investors purchasing our common stock in this offering at an assumed initial public offering price of $ per share, the midpoint of the price range set forth on the cover page of this prospectus, before deducting underwriting discounts and commissions and estimated offering expenses payable by us.
| Shares Purchased | Total Consideration | Weighted- Average Price Per Share |
||||||||||||||||
| Number | Percent | Amount | Percent | |||||||||||||||
| Existing stockholders |
% | $ | % | $ | ||||||||||||||
| New investors |
||||||||||||||||||
|
|
|
|
|
|
|
|
|
|
||||||||||
| Total |
100.0 | % | $ | 100.0 | % | $ | ||||||||||||
|
|
|
|
|
|
|
|
|
|
||||||||||
Except as otherwise indicated, the above discussion and tables assume no exercise of the underwriters’ over-allotment option. If the underwriters exercise their over-allotment option in full, our existing stockholders would own % and our new investors would own % of the total number of shares of our common stock outstanding after the completion of this offering.
The tables and calculations above are based on the number of shares of our common stock outstanding as of March 31, 2015, and exclude:
| l | 4,006,962 shares of common stock issuable upon the exercise of options outstanding as of March 31, 2015, at a weighted-average exercise price of $5.44 per share; |
| l | 200,000 shares of common stock issuable upon the exercise of warrants outstanding as of March 31, 2015, at an exercise price of $10.00 per share; |
| l | shares of our common stock reserved for future issuance pursuant to our 2015 Plan which will become effective prior to the completion of this offering and will include provisions that |
49
Table of Contents
| automatically increase the number of shares of common stock reserved for issuance thereunder each year; and |
| l | shares of common stock reserved for future issuance under our 2015 Employee Stock Purchase Plan, which will become effective prior to the completion of this offering and will include provisions that automatically increase the number of shares of common stock reserved for issuance thereunder each year. |
To the extent that options or warrants are exercised, new options or other securities are issued under our equity incentive plans, or we issue additional shares of common stock in the future, there will be further dilution to investors participating in this offering. In addition, we may choose to raise additional capital because of market conditions or strategic considerations, even if we believe that we have sufficient funds for our current or future operating plans. If we raise additional capital through the sale of equity or convertible debt securities, the issuance of these securities could result in further dilution to our stockholders.
50
Table of Contents
SELECTED CONSOLIDATED FINANCIAL DATA
We derived the selected consolidated statements of operations data for the years ended December 31, 2012, 2013 and 2014 and the selected consolidated balance sheet data as of December 31, 2013 and 2014 from our audited consolidated financial statements included elsewhere in this prospectus. We derived the selected consolidated statements of operations data for the year ended December 31, 2011 and the selected consolidated balance sheet data as of December 31, 2011 and 2012 from our audited consolidated financial statements not included in this prospectus. We derived the selected consolidated statement of operations data for the three months ended March 31, 2014 and 2015 and the selected consolidated balance sheet data as of March 31, 2015 from our unaudited financial statements included elsewhere in this prospectus. We have prepared the unaudited financial statements on the same basis as the audited financial statements, and the unaudited financial data include, in our opinion, all adjustments, consisting only of normal recurring adjustments, that we consider necessary for a fair presentation of our financial position and results of operations for these periods. Our historical results are not necessarily indicative of the results to be expected in the future.
When you read this selected consolidated financial data, it is important that you read it together with the historical consolidated financial statements and related notes to those statements, as well as “Management’s Discussion and Analysis of Financial Condition and Results of Operations,” included elsewhere in this prospectus.
| Year Ended December 31, | Three Months Ended March 31, |
|||||||||||||||||||||||
| 2011 | 2012 | 2013 | 2014 | 2014 | 2015 | |||||||||||||||||||
| (in thousands, except share and per share data) | ||||||||||||||||||||||||
| (unaudited) | ||||||||||||||||||||||||
| Consolidated Statements of Operations Data: |
||||||||||||||||||||||||
| Revenue: |
||||||||||||||||||||||||
| Products |
$ | 19,332 | $ | 29,414 | $ | 38,633 | $ | 47,030 | $ | 10,615 | $ | 13,645 | ||||||||||||
| Maintenance and support |
6,711 | 9,727 | 14,017 | 19,016 | 4,145 | 5,799 | ||||||||||||||||||
| Professional services |
4,909 | 6,903 | 7,380 | 10,834 | 1,976 | 4,127 | ||||||||||||||||||
|
|
|
|
|
|
|
|
|
|
|
|
|
|||||||||||||
| Total revenue |
30,952 | 46,044 | 60,030 | 76,880 | 16,736 | 23,571 | ||||||||||||||||||
| Cost of revenue:(1) |
||||||||||||||||||||||||
| Products |
1,260 | 1,691 | 4,048 | 4,557 | 1,239 | 1,546 | ||||||||||||||||||
| Maintenance and support |
1,546 | 2,069 | 3,388 | 4,495 | 988 | 1,210 | ||||||||||||||||||
| Professional services |
3,201 | 4,462 | 5,442 | 9,420 | 1,631 | 3,736 | ||||||||||||||||||
|
|
|
|
|
|
|
|
|
|
|
|
|
|||||||||||||
| Total cost of revenue |
6,007 | 8,222 | 12,878 | 18,472 | 3,858 | 6,492 | ||||||||||||||||||
| Operating expenses:(1) |
||||||||||||||||||||||||
| Research and development |
11,579 | 17,820 | 21,411 | 25,570 | 6,120 | 6,414 | ||||||||||||||||||
| Sales and marketing |
19,648 | 23,278 | 31,779 | 49,007 | 11,004 | 13,230 | ||||||||||||||||||
| General and administrative |
5,468 | 9,436 | 12,586 | 12,972 | 3,482 | 4,053 | ||||||||||||||||||
|
|
|
|
|
|
|
|
|
|
|
|
|
|||||||||||||
| Total operating expense |
36,695 | 50,534 | 65,776 | 87,549 | 20,606 | 23,697 | ||||||||||||||||||
|
|
|
|
|
|
|
|
|
|
|
|
|
|||||||||||||
| Loss from operations |
(11,750 | ) | (12,712 | ) | (18,624 | ) | (29,141 | ) | (7,728 | ) | (6,618 | ) | ||||||||||||
| Interest income (expense), net |
(288 | ) | (71 | ) | (122 | ) | (2,802 | ) | (695 | ) | (685 | ) | ||||||||||||
| Other income (expense), net |
(47 | ) | (29 | ) | 43 | (305 | ) | 41 | (305 | ) | ||||||||||||||
|
|
|
|
|
|
|
|
|
|
|
|
|
|||||||||||||
| Loss before income taxes |
(12,085 | ) | (12,812 | ) | (18,703 | ) | (32,248 | ) | (8,382 | ) | (7,608 | ) | ||||||||||||
| Provision for (benefit from) income taxes |
22 | (418 | ) | 170 | 379 | 96 | 74 | |||||||||||||||||
|
|
|
|
|
|
|
|
|
|
|
|
|
|||||||||||||
| Net loss |
(12,107 | ) | (12,394 | ) | (18,873 | ) | (32,627 | ) | (8,478 | ) | (7,682 | ) | ||||||||||||
| Accretion of preferred stock to redemption value(2) |
(12,006 | ) | (25,606 | ) | (33,553 | ) | (52,336 | ) | (12,178 | ) | (11,273 | ) | ||||||||||||
|
|
|
|
|
|
|
|
|
|
|
|
|
|||||||||||||
| Net loss attributable to common stockholders |
$ | (24,113 | ) | $ | (38,000 | ) | $ | (52,426 | ) | $ | (84,963 | ) | $ | (20,656 | ) | $ | (18,955 | ) | ||||||
|
|
|
|
|
|
|
|
|
|
|
|
|
|||||||||||||
| Net loss per share attributable to common stockholders, basic and diluted(2) | $ | (1.96 | ) | $ | (3.09 | ) | $ | (4.18 | ) | $ | (6.65 | ) | $ | (1.62 | ) | $ | (1.50 | ) | ||||||
|
|
|
|
|
|
|
|
|
|
|
|
|
|||||||||||||
| Weighted-average common shares outstanding, basic and diluted | 12,274,938 | 12,308,428 | 12,549,266 | 12,770,916 | 12,716,675 | 12,642,188 | ||||||||||||||||||
| Pro forma net loss per share attributable to common stockholders, basic and diluted(3) | $ | $ | ||||||||||||||||||||||
|
|
|
|
|
|||||||||||||||||||||
| Pro forma weighted-average common shares outstanding, basic and diluted(3) | ||||||||||||||||||||||||
51
Table of Contents
| (1) | Includes stock-based compensation expense and depreciation and amortization expense as follows: |
| Year Ended December 31, | Three Months Ended March 31, |
|||||||||||||||||||||||
| 2011 | 2012 | 2013 | 2014 | 2014 | 2015 | |||||||||||||||||||
| (in thousands) | ||||||||||||||||||||||||
| (unaudited) | ||||||||||||||||||||||||
| Stock-based compensation expense: |
||||||||||||||||||||||||
| Cost of revenue |
$ | 100 | $ | 61 | $ | 67 | $ | 167 | $ | 39 | $ | 49 | ||||||||||||
| Research and development |
236 | 375 | 426 | 499 | 120 | 144 | ||||||||||||||||||
| Sales and marketing |
100 | 293 | 249 | 496 | 119 | 115 | ||||||||||||||||||
| General and administrative |
33 | 991 | 1,305 | 997 | 250 | 267 | ||||||||||||||||||
|
|
|
|
|
|
|
|
|
|
|
|
|
|||||||||||||
| Total stock-based compensation expense |
$ | 469 | $ | 1,720 | $ | 2,047 | $ | 2,159 | $ | 528 | $ | 575 | ||||||||||||
|
|
|
|
|
|
|
|
|
|
|
|
|
|||||||||||||
| Depreciation and amortization expense: |
||||||||||||||||||||||||
| Cost of revenue |
$ | 282 | $ | 547 | $ | 1,107 | $ | 1,275 | $ | 291 | $ | 352 | ||||||||||||
| Research and development |
229 | 406 | 649 | 1,093 | 217 | 241 | ||||||||||||||||||
| Sales and marketing |
338 | 444 | 675 | 1,396 | 294 | 371 | ||||||||||||||||||
| General and administrative |
66 | 132 | 200 | 376 | 76 | 170 | ||||||||||||||||||
|
|
|
|
|
|
|
|
|
|
|
|
|
|||||||||||||
| Total depreciation and amortization expense |
$ | 915 | $ | 1,529 | $ | 2,631 | $ | 4,140 | $ | 878 | $ | 1,134 | ||||||||||||
|
|
|
|
|
|
|
|
|
|
|
|
|
|||||||||||||
| (2) | See Note (11) to our consolidated financial statements appearing elsewhere in this prospectus for further details on the calculation of accretion of preferred stock to redemption value and basic and diluted net loss per share attributable to common stockholders. |
| (3) | Pro forma basic and diluted net loss per share represents net loss divided by the pro forma weighted-average shares of common stock outstanding. Pro forma weighted-average shares outstanding reflects the conversion of preferred stock (using the if-converted method) into common stock as though the conversion had occurred on the first day of the relevant period or the original issuance date, if later. |
| As of December 31, | As of March 31, |
|||||||||||||||||||||||||||||
| 2011 | 2012 | 2013 | 2014 | 2015 | ||||||||||||||||||||||||||
| (in thousands) | ||||||||||||||||||||||||||||||
| (unaudited) | ||||||||||||||||||||||||||||||
| Consolidated Balance Sheet Data: |
||||||||||||||||||||||||||||||
| Cash |
$ | 21,255 | $ | 7,667 | $ | 20,612 | $ | 36,823 | $ | 33,343 | ||||||||||||||||||||
| Working capital, excluding deferred revenue |
21,744 | 12,655 | 28,206 | 50,359 | 45,927 | |||||||||||||||||||||||||
| Total assets |
37,676 | 41,782 | 59,855 | 86,966 | 79,382 | |||||||||||||||||||||||||
| Total deferred revenue |
28,261 | 44,728 | 59,855 | 85,056 | 88,643 | |||||||||||||||||||||||||
| Total debt |
96 | 18 | 16,318 | 16,871 | 17,009 | |||||||||||||||||||||||||
| Total liabilities |
43,017 | 58,797 | 92,432 | 122,230 | 121,345 | |||||||||||||||||||||||||
| Redeemable convertible preferred stock |
69,343 | 94,891 | 128,444 | 211,598 | 222,871 | |||||||||||||||||||||||||
| Accumulated deficit |
(74,812 | ) | (112,031 | ) | (161,149 | ) | (243,462 | ) | (261,435 | ) | ||||||||||||||||||||
| Total stockholders’ deficit |
(74,684 | ) | (111,906 | ) | (161,021 | ) | (246,862 | ) | (264,834 | ) | ||||||||||||||||||||
52
Table of Contents
MANAGEMENT’S DISCUSSION AND ANALYSIS OF FINANCIAL CONDITION AND RESULTS OF OPERATIONS
You should read the following discussion and analysis of our financial condition and results of operations together with our consolidated financial statements and the related notes and other financial information included elsewhere in this prospectus. Some of the information contained in this discussion and analysis or set forth elsewhere in this prospectus, including information with respect to our plans and strategy for our business, includes forward-looking statements that involve risks and uncertainties. You should review the “Risk Factors” section of this prospectus for a discussion of important factors that could cause actual results to differ materially from the results described in or implied by the forward-looking statements contained in the following discussion and analysis.
Overview
Rapid7 is a leading provider of security data and analytics solutions that enable organizations to implement an active, analytics-driven approach to cyber security. Our security data and analytics platform was purpose built for today’s increasingly complex and chaotic IT environment. We combine our extensive experience in security data and analytics and deep insight into attacker behaviors and techniques to make sense of the wealth of data available to organizations about their IT environments and users. There has been an explosion of increasingly sophisticated cyber attacks as the proliferation of mobile devices, cloud-based applications and solutions relying on user credentials has eliminated the boundaries that previously defined an organization’s network perimeter and expanded the threat surface that organizations must now defend. Our powerful and proprietary analytics enable organizations to contextualize and prioritize the threats facing their physical, virtual and cloud assets, including those posed by the behaviors of their users. Leveraging our security data and analytics platform, our solutions enable organizations to strategically and dynamically manage their cyber security exposure. Our solutions empower organizations to prevent attacks by providing visibility into vulnerabilities and to rapidly detect compromises, respond to breaches and correct the underlying causes of attacks. This balanced and analytics-focused approach ultimately better secures organizations’ environments and reduces the likelihood of, and risks associated with, cyber attacks. We believe our technology and solutions revolutionize the practice of cyber security and are central and critical to implementing a modern security program.
We developed our flagship software offering, Nexpose, to address the lack of comprehensive, real-time visibility organizations have over critical points of IT security vulnerability that are frequently targeted for cyber attacks. The data collection and technology architecture underlying this product continues to serve as a key underpinning of our security data and analytics platform. As the security and threat landscape evolved, we believed that it was important to provide organizations with a more fulsome view of their true vulnerability profile by adding external exploit-based insights to our internal vulnerability assessment capabilities. We added these vulnerability validation capabilities that highlight exploits and test security defenses by simulating real-world attacks with our acquisition of Metasploit in 2009.
We continued to invest in and innovate our vulnerability management offerings and added deep security data collection and analytics capabilities to our products. Beginning in 2013, we more fully integrated our Nexpose and Metasploit products and added securities data and analytics capabilities around remediation and attacker insights to create a holistic threat exposure management offering that has significant enhancements over traditional vulnerability assessment tools alone. Our threat exposure management offerings enable organizations to address important cyber security vulnerability needs in today’s IT environment such as contextual risk prioritization, critical threat awareness and impactful remediation guidance.
In 2013, building on the security data collection and analytics at the core of our technology architecture, we further developed our platform and added key user-based and behavioral analytics capabilities. With this technology, we developed and introduced our incident detection and response offerings, including UserInsight and our incident response services, to provide organizations with the ability to rapidly detect and respond to
53
Table of Contents
cyber security incidents and breaches. In 2014, we introduced our security advisory services to further support our product offerings and to provide customers with critical security strategy expertise, allowing us to serve as a trusted advisor to help organizations develop a holistic approach to their cyber security programs and implement an analytics-driven security strategy.
We primarily market and sell our products and professional services to global organizations of all sizes, including mid-market businesses, enterprises, non-profits, educational institutions and government agencies. Our customers span a wide variety of industries such as energy, financial services, healthcare and life sciences, manufacturing, media and entertainment, retail, professional services and technology. As of March 31, 2015, we had over 3,900 customers in more than 90 countries, including over 300 of the Fortune 1000. In 2014, 88% of our revenue was derived from customers in North America. Our revenue was not concentrated with any individual customer or group of customers, and no customer represented more than 2% of our revenue in 2012, 2013 or 2014.
We sell our products and services through our direct inside sales team, a direct field sales team established and significantly expanded in 2014 and indirect channel partner relationships. Our sales teams are organized by geography as well as by target organization size. Our global channel partner network complements our sales organization, working closely with our sales teams to extend our geographic reach and to close sales of our offerings as part of larger purchases, particularly in key markets such as Europe, the Middle East and Africa, Asia Pacific and Latin America.
We have experienced strong revenue growth, with revenue increasing from $31.0 million in 2011 to $76.9 million in 2014, representing a 35% compound annual growth rate. We believe that we have high recurring revenue, which provides us with visibility into our future revenue as a result of our customer subscriptions and maintenance and support agreements. 53% of the revenue recognized in 2014 was recorded on our balance sheet as deferred revenue as of December 31, 2013 and 85% of the revenue recognized in the first quarter of 2015 was recorded on our balance sheet as deferred revenue as of December 31, 2014. We incurred a net loss of $32.6 million in 2014, as we continue to invest for growth given what we believe is a large market opportunity for our products and services. From inception to March 31, 2015, we received net proceeds of $93.4 million from the sale of shares of common and preferred stock.
Our Business Model
We have three offerings: (1) threat exposure management, which includes our Nexpose, Metasploit and AppSpider products, (2) incident detection and response, which includes our UserInsight product and our incident response services and (3) security advisory services. Our customers typically engage with us based on their current IT organizational needs, whether to address a current breach or to help them mature their security programs. An organization that has just detected that it has been breached, for example, may initially purchase our incident detection and response products and services, whereas a customer with a new chief information security officer looking to gain insight into the organization’s security environment may initially purchase our threat exposure management solutions, and a customer whose board has mandated a security review may initially purchase our security advisory services.
We generate revenue from selling products, maintenance and support, and professional services. In 2014, 86% of our revenue was derived from sales of products and associated maintenance and support, while the remaining 14% was derived from the sale of professional services. In 2014, 62% of our total revenue was derived from sales of content subscriptions, managed services, cloud-based subscriptions and maintenance and support, which we refer to as recurring revenue. We generally bill customers and collect payment for both our products and services up front.
54
Table of Contents
We offer our products through a variety of delivery models to meet the needs of our diverse customer base, including:
| l | Licensed software, including both term and perpetual licenses, and the simultaneous sale of maintenance and support. With the purchase of software licenses, we also offer content subscriptions that provide our customers with real-time access to the latest vulnerabilities and exploits, which are critical for customers in today’s rapidly evolving IT environment and threat landscape. |
| l | Cloud-based subscriptions, where our software capabilities are provided to our customers through cloud access and on a SaaS basis. |
| l | Managed services, where we operate our software and provide our capabilities on behalf of our customers. |
Licensed Software
Our Nexpose, Metasploit and AppSpider products are offered through perpetual or term software licenses, with a substantial majority of our customers selecting a perpetual license. Substantially all customers who purchase software licenses also purchase an agreement for maintenance and support, which generally represents approximately 15% of the software list price per year and provides our customers with telephone and web-based support and ongoing bug fixes and repairs during the term of the maintenance and support agreement.
Importantly, generally all customers also purchase vulnerability and exploit content subscriptions at the time of their software purchase, which generally represents approximately 20% of the software list price per year. These content subscriptions are critical to keeping our customers’ security programs current by providing them with real-time access to the latest vulnerabilities and exploits over time, and differentiate our threat exposure management offerings from typical vulnerability assessment tools.
Our maintenance and support and content subscription agreements are typically for one to three-year terms.
Cloud-Based Subscriptions
Our UserInsight and AppSpider products are offered on a cloud-based subscription basis, generally with one to three-year terms.
Managed Services
Our Nexpose, AppSpider and UserInsight products are offered on a managed service basis, generally pursuant to one to three-year agreements.
Professional Services
We offer different forms of professional services across all of our offerings, including deployment and training services related to our Nexpose, Metasploit, AppSpider and UserInsight software products, incident response services and security advisory services. Customers can purchase our professional services together with our product offerings or on a stand-alone basis pursuant to fixed fee or time-and-materials agreements.
Acquisitions
In August 2009, we acquired all of the outstanding membership interests of Metasploit LLC to complement our Nexpose product with vulnerability validation capabilities that highlight exploits and test security defenses.
In October 2012, we acquired all of the outstanding stock of Mobilisafe, Inc., a mobile vulnerability software company, and have since integrated Mobilisafe’s technology into our technology platform and Nexpose product.
In April 2015, we acquired all of the outstanding stock of NT OBJECTives, Inc. to enhance our threat exposure management solutions with AppSpider to provide robust web application scanning capabilities.
55
Table of Contents
Key Factors Affecting Our Performance
Our historical financial performance has been, and we expect our financial performance in the future to be, primarily driven by the following factors:
Market Adoption. We believe our future success will depend in large part on the growth in the market for cyber security data and analytics. To date, the majority of enterprise spend on cyber security has been on threat prevention-centric products, such as network, endpoint and web security that are designed to stop threats from penetrating organizations’ networks. Although organizations have not historically had a specific portion of their IT budgets allocated for security data and analytics products beyond traditional “block and protect” and compliance-oriented spending categories, we believe that organizations are shifting their cyber security spending to a risk-based approach as they recognize that it is not possible to completely prevent attacks, and that they should instead focus more on managing risk and mitigating breaches as they occur. Further, Gartner, Inc. estimates that by 2020, 60% of enterprise information security budgets will be allocated for rapid detection and response approaches – up from less than 10% in 2014. We believe that we are well positioned to capitalize on this expected shift. The degree to which prospective customers recognize the need for security data and analytics solutions that enable organizations to implement an active, analytics driven approach to cyber security, and subsequently allocate budget dollars for our products and professional services, will drive our ability to acquire new customers and increase sales to existing customers, which, in turn, will affect our future financial performance.
Add New Customers. We believe that our ability to add new customers is a key indicator of our increasing market adoption and future revenue potential. Our customer count grew by 21% from 2012 to 2013 and by 37% from 2013 to 2014. In 2014, 59% of our sales orders, excluding renewals, were with new customers. We are intensely focused on continuing to grow our customer base. We have continuously enhanced our technology platform and product offerings with a focus on pioneering active, analytics-driven solutions to cyber security, and we have expanded both our domestic and international sales force to drive new customer acquisition. However, our ability to continue to grow our customer base is dependent upon our ability to compete within the increasingly competitive markets in which we participate.
Maintain Strong Renewal Rates. An important component of our revenue growth strategy is to have our existing customers renew their agreements with us and purchase additional products from us. To assess our performance against this objective, we monitor the renewal rates of our existing customers. We calculate our overall renewal rate by dividing the dollar value of renewed customer agreements, including upsells and cross-sells of additional products, but excluding professional services, on a monthly basis in a trailing 12-month period by the dollar value of the corresponding expiring customer agreements, and then determining the average for the applicable period. We also calculate an expiring renewal rate that does not take into account any upsells or cross-sells. As a result of this methodology, we would not expect our expiring renewal rate to exceed 100%. We believe that we have strong renewal rates. Our overall renewal rate was 109% in 2013 and 111% in 2014 and our expiring renewal rate was 83% in 2013 and 85% in 2014. Our goal is to maintain, and work to increase, our renewal rates over time. However, our renewal rates may decline or fluctuate as a result of a number of factors, including customers’ satisfaction or dissatisfaction with our products and professional services, pricing, economic conditions or overall reductions in our customers’ spending levels.
Increase Sales to Existing Customers. We believe that our current customer base provides us with a significant opportunity to drive incremental sales. We focus on generating more revenue from the products and services that they already purchase from us as they grow and deploy our solutions across other areas of their organizations. We are also focused on cross-selling other products and services in our portfolio to our existing customers. In most cases, customers initially engage with us within a single solution category, threat exposure management, incident detection and response or security advisory services, based on their immediate IT security
56
Table of Contents
needs and the maturity of their security program. Once we are in a customer’s IT environment, we are able to gain insight into the robustness of its security programs and vulnerabilities, which allows us to educate the customer about how our other products and professional services can enhance its cyber security posture. In 2014, 41% of our new sales orders, excluding renewals, were from existing customers. Our ability to increase sales to existing customers will depend on a number of factors, including customers’ satisfaction or dissatisfaction with our products and professional services, pricing, economic conditions or overall reductions in our customers’ spending levels.
Invest in Growth. We will continue to focus on long-term revenue growth. We believe that our market opportunity is large and we will continue to invest significantly in sales and marketing to grow our customer base, both domestically and internationally. We also expect to continue to invest in research and development to enhance our technology platform and continue to develop cyber security solutions. We expect to use a portion of the proceeds from this offering to fund these growth strategies.
Key Metrics
We monitor the following key metrics to help us measure and evaluate the effectiveness of our operations:
| Year Ended December 31, | Three Months Ended March 31, |
|||||||||||||||||||||||||||||
| 2012 | 2013 | 2014 | 2014 | 2015 | ||||||||||||||||||||||||||
| (dollars in thousands) | ||||||||||||||||||||||||||||||
| (unaudited) | ||||||||||||||||||||||||||||||
| Total revenue |
$ | 46,044 | $ | 60,030 | $ | 76,880 | $ | 16,736 | $ | 23,571 | ||||||||||||||||||||
| Year-over-year growth |
49 | % | 30 | % | 28 | % | 23 | % | 41 | % | ||||||||||||||||||||
| Operating cash flow |
$ | (691 | ) | $ | (613 | ) | $ | (3,356 | ) | $ | (2,139 | ) | $ | (3,012 | ) | |||||||||||||||
| Deferred revenue |
$ | 44,728 | $ | 59,855 | $ | 85,056 | $ | 61,137 | $ | 88,643 | ||||||||||||||||||||
| Number of customers |
2,255 | 2,733 | 3,733 | 2,860 | 3,902 | |||||||||||||||||||||||||
Total Revenue and Growth. We are focused on driving continued revenue growth through increased sales of our products and professional services to new and existing customers.
Operating Cash Flow. We monitor our operating cash flow as a measure of our overall business performance, which enables us to analyze our financial performance without the effects of certain non-cash items such as stock-based compensation expenses and depreciation and amortization. Additionally, operating cash flow takes into account the increase in deferred revenue as a result of increases in sales of products and services, which reflects the receipt of cash payment for products before they are recognized into revenue. Our operating cash flow is significantly impacted by changes in deferred revenue, timing of commission and bonus payments and collections of accounts receivable.
Deferred Revenue. We believe that deferred revenue is an important metric as it provides visibility into the revenue to be recognized in future periods. Our deferred revenue consists of amounts that have been invoiced to customers but that have not yet been recognized as revenue. Our deferred revenue balance consists of the portion of products, maintenance and support and professional services revenue that will be recognized ratably over the applicable maintenance and support contract period. Revenue from professional services that are sold on a stand-alone basis is recognized as those services are rendered.
Number of Customers. We believe that the size of our customer base is an indicator of our global market penetration and that our net customer additions are an indicator of the growth of our business.
57
Table of Contents
Components of Results of Operations
Revenue
We generate revenue primarily from selling products, maintenance and support and professional services through a variety of delivery models to meet the needs of our diverse customer base. We generally bill customers and collect payment for both our products and services up front.
Products
We generate products revenue from the sale of (1) perpetual or term software licenses and associated content subscriptions for our Nexpose, Metasploit and AppSpider products, (2) managed services for our Nexpose, AppSpider and UserInsight products and (3) cloud-based subscriptions for our UserInsight and AppSpider products. We also generate an immaterial amount of appliance revenue that is included in our products revenue and that is associated with hardware sold as part of our Nexpose product to certain customers. Revenue for software licenses and any other products and services that are sold along with the software license is deferred on our balance sheet and recognized as revenue on the consolidated statements of operations ratably over the contractual period of the maintenance and support, which is typically one to three years.
Maintenance and Support
We generate maintenance and support revenue when customers purchase or renew agreements for maintenance and support of their Nexpose, Metasploit and AppSpider deployments. Substantially all customers purchase an agreement for maintenance and support in connection with their purchase of a Nexpose or Metasploit software license. Revenue from maintenance and support is typically recognized ratably over the term of the applicable agreement.
Professional Services
We generate professional service revenue from the sale of deployment and training services related to our products, incident response services and security advisory services. Revenue from professional services sold together with our other offerings is recognized ratably over the term of the applicable agreement. Revenue from professional services sold on a stand-alone basis is recognized as those services are rendered.
Cost of Revenue
Our total cost of revenue consists of the costs of products, maintenance and support and professional services revenue.
Cost of Products
Cost of products consists of personnel and related costs for our content and cloud operations team, including salaries, benefits, bonuses, payroll taxes, stock-based compensation and allocated overhead costs, which consists of IT, information security, facilities and depreciation and is allocated based on relative headcount. Also included in cost of products are software license fees, hosting costs and internet connectivity expenses directly related to delivering our products, as well as amortization of intangible assets.
Cost of Maintenance and Support
Cost of maintenance and support consists of personnel and related costs for our support team, including salaries, benefits, bonuses, payroll taxes, stock-based compensation and allocated overhead.
58
Table of Contents
Cost of Professional Services
Cost of professional services consists of personnel and related costs for our professional services team, including salaries, benefits, bonuses, payroll taxes, stock-based compensation, costs of contracted third-party vendors, travel and entertainment expenses and allocated overhead.
We expect our cost of revenue to increase on an absolute dollar basis in the near term as we continue to grow our revenue, but to remain relatively consistent as a percentage of total revenue.
Gross Margin
Gross margin, or gross profit as a percentage of revenue, has been and will continue to be affected by a variety of factors, including the average sales price of our products and services, the mix of products sold, transaction volume growth and the mix of revenue among products and services. We expect our gross margins to fluctuate over time depending on the factors described above.
Operating Expenses
Operating expenses consist of research and development, sales and marketing, and general and administrative expenses.
Research and Development Expense
Research and development expense consists of personnel costs for our research and development team, including salaries, bonuses, stock-based compensation and other related costs. Additional expenses include subcontracting, consulting and professional fees for third-party development resources as well as allocated overhead.
We expect research and development expense to increase on an absolute dollar basis in the near term as we continue to increase investments in our products and technology platform innovation, but to decrease as a percentage of total revenue.
Sales and Marketing Expense
Sales and marketing expense consists of personnel costs for our sales and marketing team, including salaries, commissions, bonuses, stock-based compensation and other related costs. Additional expenses include marketing activities and promotional events, travel and entertainment, training costs and allocated overhead.
We expect sales and marketing expense to increase on an absolute dollar basis in the near term as we continue to increase investments to drive our revenue growth, but to decrease as a percentage of total revenue.
General and Administrative Expense
General and administrative expense consists of personnel costs for our administrative, legal, human resources, finance and accounting team, including salaries, bonuses, stock-based compensation and other related costs. Additional expenses include travel and entertainment, subcontracting, professional fees, insurance and allocated overhead as well as changes in the fair market value of the contingent consideration liability associated with acquisitions, which are subject to revaluation.
We expect general and administrative expense to increase on an absolute dollar basis in the near term as we continue to increase investments to support our growth and as a result of our becoming a public company, but to decrease as a percentage of total revenue.
Interest Income (Expense), Net
Interest income (expense), net consists of interest incurred on our outstanding term loan obligation and related discount amortization offset by interest income on our cash balances.
59
Table of Contents
Other Income (Expense), Net
Other income (expense), net consists of unrealized and realized gains and losses related to changes in foreign currency exchange rates.
Provision for (Benefit from) Income Taxes
Provision for (benefit from) income taxes relates primarily to U.S. federal and state, as well as certain foreign jurisdiction, income taxes. We have generated net losses in all periods to date and recorded a full valuation allowance against our deferred tax assets. We expect to maintain a full valuation allowance in the near term. Realization of any of our deferred tax assets depends upon future earnings, the timing and amount of which are uncertain.
Results of Operations
The following table sets forth our selected consolidated statements of operations data:
| Year Ended December 31, | Three Months Ended March 31, |
|||||||||||||||||||
| 2012 | 2013 | 2014 | 2014 | 2015 | ||||||||||||||||
| (in thousands) | ||||||||||||||||||||
| (unaudited) | ||||||||||||||||||||
| Consolidated Statements of Operations Data: |
||||||||||||||||||||
| Revenue: |
||||||||||||||||||||
| Products |
$ | 29,414 | $ | 38,633 | $ | 47,030 | $ | 10,615 | $ | 13,645 | ||||||||||
| Maintenance and support |
9,727 | 14,017 | 19,016 | 4,145 | 5,799 | |||||||||||||||
| Professional services |
6,903 | 7,380 | 10,834 | 1,976 | 4,127 | |||||||||||||||
|
|
|
|
|
|
|
|
|
|
|
|||||||||||
| Total revenue |
46,044 | 60,030 | 76,880 | 16,736 | 23,571 | |||||||||||||||
| Cost of revenue:(1) |
||||||||||||||||||||
| Products |
1,691 | 4,048 | 4,557 | 1,239 | 1,546 | |||||||||||||||
| Maintenance and support |
2,069 | 3,388 | 4,495 | 988 | 1,210 | |||||||||||||||
| Professional services |
4,462 | 5,442 | 9,420 | 1,631 | 3,736 | |||||||||||||||
|
|
|
|
|
|
|
|
|
|
|
|||||||||||
| Total cost of revenue |
8,222 | 12,878 | 18,472 | 3,858 | 6,492 | |||||||||||||||
| Operating expenses:(1) |
||||||||||||||||||||
| Research and development |
17,820 | 21,411 | 25,570 | 6,120 | 6,414 | |||||||||||||||
| Sales and marketing |
23,278 | 31,779 | 49,007 | 11,004 | 13,230 | |||||||||||||||
| General and administrative |
9,436 | 12,586 | 12,972 | 3,482 | 4,053 | |||||||||||||||
|
|
|
|
|
|
|
|
|
|
|
|||||||||||
| Total operating expenses |
50,534 | 65,776 | 87,549 | 20,606 | 23,697 | |||||||||||||||
|
|
|
|
|
|
|
|
|
|
|
|||||||||||
| Loss from operations |
(12,712 | ) | (18,624 | ) | (29,141 | ) | (7,728 | ) | (6,618 | ) | ||||||||||
| Interest income (expense), net |
(71 | ) | (122 | ) | (2,802 | ) | (695 | ) | (685 | ) | ||||||||||
| Other income (expense), net |
(29 | ) | 43 | (305 | ) | 41 | (305 | ) | ||||||||||||
|
|
|
|
|
|
|
|
|
|
|
|||||||||||
| Loss before income taxes |
(12,812 | ) | (18,703 | ) | (32,248 | ) | (8,382 | ) | (7,608 | ) | ||||||||||
| Provision for (benefit from) income taxes |
(418 | ) | 170 | 379 | 96 | 74 | ||||||||||||||
|
|
|
|
|
|
|
|
|
|
|
|||||||||||
| Net loss |
(12,394 | ) | (18,873 | ) | (32,627 | ) | (8,478 | ) | (7,682 | ) | ||||||||||
| Accretion of preferred stock to redemption value |
(25,606 | ) | (33,553 | ) | (52,336 | ) | (12,178 | ) | (11,273 | ) | ||||||||||
|
|
|
|
|
|
|
|
|
|
|
|||||||||||
| Net loss attributable to common stockholders |
$ | (38,000 | ) | $ | (52,426 | ) | $ | (84,963 | ) | $ | (20,656 | ) | $ | (18,955 | ) | |||||
|
|
|
|
|
|
|
|
|
|
|
|||||||||||
60
Table of Contents
(1) Cost of revenue and operating expenses include stock-based compensation expense and depreciation and amortization expense as follows:
| Year Ended December 31, | Three Months Ended March 31 |
|||||||||||||||||||
| 2012 | 2013 | 2014 | 2014 | 2015 | ||||||||||||||||
| (in thousands) | ||||||||||||||||||||
| (unaudited) | ||||||||||||||||||||
| Stock-based compensation expense: |
||||||||||||||||||||
| Cost of revenue |
$ | 61 | $ | 67 | $ | 167 | $ | 39 | $ | 49 | ||||||||||
| Research and development |
375 | 426 | 499 | 120 | 144 | |||||||||||||||
| Sales and marketing |
293 | 249 | 496 | 119 | 115 | |||||||||||||||
| General and administrative |
991 | 1,305 | 997 | 250 | 267 | |||||||||||||||
|
|
|
|
|
|
|
|
|
|
|
|||||||||||
| Total stock-based compensation expense |
$ | 1,720 | $ | 2,047 | $ | 2,159 | $ | 528 | 575 | |||||||||||
|
|
|
|
|
|
|
|
|
|
|
|||||||||||
| Depreciation and amortization expense: |
||||||||||||||||||||
| Cost of revenue |
$ | 547 | $ | 1,107 | $ | 1,275 | $ | 291 | $ | 352 | ||||||||||
| Research and development |
406 | 649 | 1,093 | 217 | 241 | |||||||||||||||
| Sales and marketing |
444 | 675 | 1,396 | 294 | 371 | |||||||||||||||
| General and administrative |
132 | 200 | 376 | 76 | 170 | |||||||||||||||
|
|
|
|
|
|
|
|
|
|
|
|||||||||||
| Total depreciation and amortization expense |
$ | 1,529 | $ | 2,631 | $ | 4,140 | $ | 878 | $ | 1,134 | ||||||||||
|
|
|
|
|
|
|
|
|
|
|
|||||||||||
The following table sets forth our selected consolidated statements of operations data expressed as a percentage of revenue:
| Year Ended December 31, | Three Months Ended March 31, |
|||||||||||||||||||
| 2012 | 2013 | 2014 | 2014 | 2015 | ||||||||||||||||
| (unaudited) | ||||||||||||||||||||
| Consolidated Statements of Operations Data: |
||||||||||||||||||||
| Revenue: |
||||||||||||||||||||
| Products |
63.9 | % | 64.4 | % | 61.2 | % | 63.4 | % | 57.9 | % | ||||||||||
| Maintenance and support |
21.1 | 23.3 | 24.7 | 24.8 | 24.6 | |||||||||||||||
| Professional services |
15.0 | 12.3 | 14.1 | 11.8 | 17.5 | |||||||||||||||
|
|
|
|
|
|
|
|
|
|
|
|||||||||||
| Total revenue |
100.0 | 100.0 | 100.0 | 100.0 | 100.0 | |||||||||||||||
| Cost of revenue: |
||||||||||||||||||||
| Products |
3.7 | 6.7 | 5.9 | 7.4 | 6.6 | |||||||||||||||
| Maintenance and support |
4.5 | 5.6 | 5.8 | 5.9 | 5.1 | |||||||||||||||
| Professional services |
9.7 | 9.1 | 12.3 | 9.8 | 15.8 | |||||||||||||||
|
|
|
|
|
|
|
|
|
|
|
|||||||||||
| Total cost of revenue |
17.9 | 21.4 | 24.0 | 23.1 | 27.5 | |||||||||||||||
| Operating expenses: |
||||||||||||||||||||
| Research and development |
38.7 | 35.7 | 33.3 | 36.6 | 27.2 | |||||||||||||||
| Sales and marketing |
50.6 | 52.9 | 63.7 | 65.7 | 56.1 | |||||||||||||||
| General and administrative |
20.5 | 21.0 | 16.9 | 20.8 | 17.2 | |||||||||||||||
|
|
|
|
|
|
|
|
|
|
|
|||||||||||
| Total operating expenses |
109.8 | 109.6 | 113.9 | 123.1 | 100.5 | |||||||||||||||
|
|
|
|
|
|
|
|
|
|
|
|||||||||||
| Loss from operations |
(27.7 | ) | (31.0 | ) | (37.9 | ) | (46.2 | ) | (28.0 | ) | ||||||||||
| Interest income (expense), net |
(0.1 | ) | (0.2 | ) | (3.6 | ) | (4.2 | ) | (3.0 | ) | ||||||||||
| Other income (expense), net |
— | 0.1 | (0.4 | ) | 0.3 | (1.3 | ) | |||||||||||||
|
|
|
|
|
|
|
|
|
|
|
|||||||||||
| Loss before income taxes |
(27.8 | ) | (31.1 | ) | (41.9 | ) | (50.1 | ) | (32.3 | ) | ||||||||||
| Provision for (benefit from) income taxes |
(0.9 | ) | 0.3 | 0.5 | 0.6 | 0.3 | ||||||||||||||
|
|
|
|
|
|
|
|
|
|
|
|||||||||||
| Net loss |
(26.9 | ) | (31.4 | ) | (42.4 | ) | (50.7 | ) | (32.6 | ) | ||||||||||
| Accretion of preferred stock to redemption value |
(55.6 | ) | (55.9 | ) | (68.1 | ) | (72.7 | ) | (47.8 | ) | ||||||||||
|
|
|
|
|
|
|
|
|
|
|
|||||||||||
| Net loss attributable to common stock holders |
(82.5 | )% | (87.3 | )% | (110.5 | )% | (123.4 | )% | (80.4 | )% | ||||||||||
|
|
|
|
|
|
|
|
|
|
|
|||||||||||
61
Table of Contents
Three Months Ended March 31, 2014 and 2015
Revenue
| Three Months Ended March 31, |
2014 v. 2015 Change | |||||||||||||||
| 2014 | 2015 | $ | % | |||||||||||||
| (dollars in thousands) | ||||||||||||||||
| Revenue: |
||||||||||||||||
| Products |
$ | 10,615 | $ | 13,645 | $ | 3,030 | 28.5 | % | ||||||||
| Maintenance and support |
4,145 | 5,799 | 1,654 | 39.9 | ||||||||||||
| Professional services |
1,976 | 4,127 | 2,151 | 108.9 | ||||||||||||
|
|
|
|
|
|
|
|||||||||||
| Total revenue |
$ | 16,736 | $ | 23,571 | $ | 6,835 | 40.8 | % | ||||||||
|
|
|
|
|
|
|
|||||||||||
Total revenue increased by $6.8 million in three months ended March 31, 2015 compared to the same period in 2014 primarily due to an increase of $6.1 million recognized from our deferred revenue balance. The remaining increase was the result of a net increase of $0.2 million from sales to existing customers and $0.5 million from sales to new customers. The increase in total revenue in the three months ended March 31, 2015 was comprised of $5.3 million from North America and $1.5 million from the rest of the world. Products revenue and maintenance and support revenue increased by $3.0 million and $1.7 million, respectively, primarily due to the same contributors that drove our increase in total revenue. Professional services revenue increased by $2.1 million primarily due to increased demand for deployment, training and security assessment services.
Cost of Revenue
| Three Months Ended March 31, |
2014 v. 2015 Change | |||||||||||||||
| 2014 | 2015 | $ | % | |||||||||||||
| (dollars in thousands) | ||||||||||||||||
| Cost of revenue: |
||||||||||||||||
| Products |
$ | 1,239 | $ | 1,546 | $ | 307 | 24.8 | % | ||||||||
| Maintenance and support |
988 | 1,210 | 222 | 22.5 | ||||||||||||
| Professional services |
1,631 | 3,736 | 2,105 | 129.1 | ||||||||||||
|
|
|
|
|
|
|
|||||||||||
| Total cost of revenue |
$ | 3,858 | $ | 6,492 | $ | 2,634 | 68.3 | % | ||||||||
|
|
|
|
|
|
|
|||||||||||
| Gross margin %: |
||||||||||||||||
| Products |
88.3 | % | 88.7 | % | ||||||||||||
| Maintenance and support |
76.2 | 79.1 | ||||||||||||||
| Professional services |
17.5 | 9.5 | ||||||||||||||
|
|
|
|
|
|||||||||||||
| Total gross margin % |
76.9 | % | 72.5 | % | ||||||||||||
|
|
|
|
|
|||||||||||||
Total cost of revenue increased by $2.6 million in the three months ended March 31, 2015 compared to the same period in 2014 primarily due to a $2.0 million increase in personnel costs and a $0.4 million increase in allocated overhead both as a result of our increase in headcount from 78 as of March 31, 2014 to 117 as of March 31, 2015 to support our growing customer base. Our increase in total cost of revenue also included a $0.2 million increase in travel and entertainment expenses. The same factors were the primary contributors to the increases in products, maintenance and support and professional services cost of revenue.
Gross margin percentage decreased slightly as we continued our investment in growing our professional services team to help promote adoption of our analytics-driven approach to cyber security.
62
Table of Contents
Operating Expenses
Research and Development Expense
| Three Months Ended March 31, |
2014 v. 2015 Change | |||||||||||||||
| 2014 | 2015 | $ | % | |||||||||||||
| (dollars in thousands) | ||||||||||||||||
| Research and development |
$ | 6,120 | $ | 6,414 | $ | 294 | 4.8 | % | ||||||||
| % of revenue |
36.6 | % | 27.2 | % | ||||||||||||
Research and development expense increased by $0.3 million in the three months ended March 31, 2015 compared to the same period in 2014 primarily due to a $0.2 million increase in allocated overhead and a $0.2 million increase in personnel costs, both as a result of our increase in headcount to support our product innovation, partially offset by a $0.1 million decrease in travel and entertainment expense.
Sales and Marketing Expense
| Three Months Ended March 31, |
2014 v. 2015 Change | |||||||||||||||
| 2014 | 2015 | $ | % | |||||||||||||
| (dollars in thousands) | ||||||||||||||||
| Sales and marketing |
$ | 11,004 | $ | 13,230 | $ | 2,226 | 20.2 | % | ||||||||
| % of revenue |
65.7 | % | 56.1 | % | ||||||||||||
Sales and marketing expense increased by $2.2 million in the three months ended March 31, 2015 compared to the same period in 2014 primarily due to a $2.1 million increase in personnel costs, including sales commissions, and a $0.6 million increase in allocated overhead, both as a result of our increase in headcount from 206 as of March 31, 2014 to 245 as of March 31, 2015 to drive additional sales of our products and services, partially offset by a $0.3 million decrease in marketing program expenses, a $0.1 million decrease in professional fees and a $0.1 million decrease in travel and entertainment expenses.
General and Administrative Expense
| Three Months Ended March 31, |
2014 v. 2015 Change | |||||||||||||||
| 2014 | 2015 | $ | % | |||||||||||||
| (dollars in thousands) | ||||||||||||||||
| General and administrative |
$ | 3,482 | $ | 4,053 | $ | 571 | 16.4 | % | ||||||||
| % of revenue |
20.8 | % | 17.2 | % | ||||||||||||
General and administrative expense increased by $0.6 million in the three months ended March 31, 2015 compared to the same period in 2014 primarily due to a $0.8 million increase in personnel costs as a result of our increase in headcount from 52 as of March 31, 2014 to 73 as of March 31, 2015 to support our overall company growth as well as our preparation to operate as a public company. Our general and administrative expense also included a $0.3 million increase in professional fees and a $0.1 million increase in travel and entertainment expenses, partially offset by a $0.6 million decrease in allocated overhead.
Interest Income (Expense), Net
| Three Months Ended March 31, |
2014 v. 2015 Change | |||||||||||||||
| 2014 | 2015 | $ | % | |||||||||||||
| (dollars in thousands) | ||||||||||||||||
| Interest income (expense), net |
$ (695) | $ | (685) | $ | 10 | (1.4) | % | |||||||||
| % of revenue |
(4.2) | % | (3.0) | % | ||||||||||||
63
Table of Contents
Interest income (expense), net decreased slightly in the three months ended March 31, 2015 compared to the same period in 2014 due to interest expense related to capital leases.
Other Income (Expense), Net
| Three Months Ended March 31, |
2014 v. 2015 Change | |||||||||||||||
| 2014 | 2015 | $ | % | |||||||||||||
| (dollars in thousands) | ||||||||||||||||
| Other income (expense), net |
$ | 41 | $ | (305) | $ | (346) | NM | |||||||||
| % of revenue |
0.3 | % | (1.3) | % | ||||||||||||
Other income (expense), net changed from de minimis income in the three months ended March 31, 2014 to expense of $0.3 million in the three months ended March 31, 2015 primarily due to unrealized and realized foreign currency fluctuations, specifically in European currencies.
Provision for (Benefit from) Income Taxes
| Three Months Ended March 31, |
2014 v. 2015 Change | |||||||||||||||
| 2014 | 2015 | $ | % | |||||||||||||
| (dollars in thousands) | ||||||||||||||||
| Provision for (benefit from) income taxes |
$ | 96 | $ | 74 | $ | (22) | (22.9) | % | ||||||||
| % of revenue |
0.6 | % | 0.3 | % | ||||||||||||
Provision for income taxes remained relatively consistent in the three months ended March 31, 2015 compared to the same period in 2014.
Years Ended December 31, 2012, 2013 and 2014
Revenue
| Year Ended December 31, | 2012 v. 2013 Change | 2013 v. 2014 Change | ||||||||||||||||||||||||||
| 2012 | 2013 | 2014 | $ | % | $ | % | ||||||||||||||||||||||
| (dollars in thousands) | ||||||||||||||||||||||||||||
| Revenue: |
||||||||||||||||||||||||||||
| Products |
$ | 29,414 | $ | 38,633 | $ | 47,030 | $ | 9,219 | 31.3 | % | $ | 8,397 | 21.7 | % | ||||||||||||||
| Maintenance and support |
9,727 | 14,017 | 19,016 | 4,290 | 44.1 | 4,999 | 35.7 | |||||||||||||||||||||
| Professional services |
6,903 | 7,380 | 10,834 | 477 | 6.9 | 3,454 | 46.8 | |||||||||||||||||||||
|
|
|
|
|
|
|
|
|
|
|
|||||||||||||||||||
| Total revenue |
$ | 46,044 | $ | 60,030 | $ | 76,880 | $ | 13,986 | 30.4 | % | $ | 16,850 | 28.1 | % | ||||||||||||||
|
|
|
|
|
|
|
|
|
|
|
|||||||||||||||||||
2014 Compared to 2013
Total revenue increased by $16.9 million in 2014 compared to 2013 primarily due to an increase of $8.5 million recognized from our deferred revenue balance. The remaining increase was the result of a net increase of $5.2 million from sales to existing customers and $3.2 million from sales to new customers. We added 1,000 net new customers globally in 2014. The increase in total revenue in 2014 was comprised of $13.6 million from North America and $3.3 million from the rest of the world. Products revenue and maintenance and support revenue increased by $8.4 million and $5.0 million, respectively, primarily due to the same contributors that drove our increase in total revenue. Professional services revenue increased by $3.5 million primarily due to increased demand for deployment, training and security assessment services.
64
Table of Contents
2013 Compared to 2012
Total revenue increased by $14.0 million in 2013 compared to 2012 primarily due to an increase of $11.2 million recognized from our deferred revenue balance. The remaining increase was the result of a net increase of $3.6 million from sales to existing customers offset by a net decrease of $0.8 million related to sales to new customers. We added 478 net new customers globally in 2013. The increase in total revenue in 2013 was comprised of $12.0 million from North America and $2.0 million from the rest of the world. Products revenue and maintenance and support revenue increased by $9.2 million and $4.3 million, respectively, primarily due to the same contributors that drove our increase in total revenue. Professional services revenue increased by $0.5 million primarily due to slightly increased customer demand for these service offerings.
Cost of Revenue
| Year Ended December 31, | 2012 v. 2013 Change | 2013 v. 2014 Change | ||||||||||||||||||||||||||
| 2012 | 2013 | 2014 | $ | % | $ | % | ||||||||||||||||||||||
| (dollars in thousands) | ||||||||||||||||||||||||||||
| Cost of revenue: |
||||||||||||||||||||||||||||
| Products |
$ | 1,691 | $ | 4,048 | $ | 4,557 | $ | 2,357 | 139.4 | % | $ | 509 | 12.6 | % | ||||||||||||||
| Maintenance and support |
2,069 | 3,388 | 4,495 | 1,319 | 63.8 | 1,107 | 32.7 | |||||||||||||||||||||
| Professional services |
4,462 | 5,442 | 9,420 | 980 | 22.0 | 3,978 | 73.1 | |||||||||||||||||||||
|
|
|
|
|
|
|
|
|
|
|
|||||||||||||||||||
| Total cost of revenue |
$ | 8,222 | $ | 12,878 | $ | 18,472 | $ | 4,656 | 56.6 | % | $ | 5,594 | 43.4 | % | ||||||||||||||
|
|
|
|
|
|
|
|
|
|
|
|||||||||||||||||||
| Gross margin %: |
||||||||||||||||||||||||||||
| Products |
94.3 | % | 89.5 | % | 90.3 | % | ||||||||||||||||||||||
| Maintenance and support |
78.7 | 75.8 | 76.4 | |||||||||||||||||||||||||
| Professional services |
35.4 | 26.3 | 13.1 | |||||||||||||||||||||||||
|
|
|
|
|
|
|
|||||||||||||||||||||||
| Total gross margin % |
82.1 | % | 78.5 | % | 76.0 | % | ||||||||||||||||||||||
|
|
|
|
|
|
|
|||||||||||||||||||||||
2014 Compared to 2013
Total cost of revenue increased by $5.6 million in 2014 compared to 2013 primarily due to a $4.4 million increase in personnel costs and a $0.6 million increase in overhead allocations, both as a result of our increase in headcount from 67 as of December 31, 2013 to 104 as of December 31, 2014 to support our growing customer base. Our increase in total cost of revenue also included a $0.5 million increase in travel and entertainment expenses and a $0.1 million increase in hardware and hosting costs. The same factors were the primary contributors to the increases in products, maintenance and support and professional services cost of revenue.
Gross margin percentage decreased slightly as we continued our investment in growing our professional services team to help promote adoption of our analytics-driven approach to cyber security.
2013 Compared to 2012
Total cost of revenue increased by $4.7 million in 2013 compared to 2012 primarily due to a $3.4 million increase in personnel costs and a $0.3 million increase in overhead allocations, both as a result of our increase in headcount from 37 as of December 31, 2012 to 67 as of December 31, 2013 to support our growing customer base. Our increase in total cost of revenue also included a $0.8 million increase in hosting costs and amortization of intellectual property. The same factors were the primary contributors to the increases in products, maintenance and support and professional services cost of revenue.
Gross margin percentage decreased primarily due to increased investment in our content operations and our investment in a strategic professional services team to help promote adoption of our analytics-driven approach to cyber security.
65
Table of Contents
Operating Expenses
Research and Development Expense
| Year Ended December 31, | 2012 v. 2013 Change | 2013 v. 2014 Change | ||||||||||||||||||||||||||
| 2012 | 2013 | 2014 | $ | % | $ | % | ||||||||||||||||||||||
| (dollars in thousands) | ||||||||||||||||||||||||||||
| Research and development |
$ | 17,820 | $ | 21,411 | $ | 25,570 | $ | 3,591 | 20.2 | % | $ | 4,159 | 19.4 | % | ||||||||||||||
| % of revenue |
38.7 | % | 35.7 | % | 33.3 | % | ||||||||||||||||||||||
2014 Compared to 2013
Research and development expense increased by $4.2 million in 2014 compared to 2013 primarily due to a $3.4 million increase in personnel costs and a $0.6 million increase in allocated overhead, both as a result of our increase in headcount from 100 as of December 31, 2013 to 114 as of December 31, 2014 to support our product innovation. Our increase in research and development expense also included a $0.1 million increase in travel and entertainment expenses and $0.1 million increase in professional fees. In 2014, we expanded our research and development presence to Belfast, United Kingdom.
2013 Compared to 2012
Research and development expense increased by $3.6 million in 2013 compared to 2012 primarily due to a $2.3 million increase in personnel costs and a $1.0 million increase in allocated overhead, both as a result of our higher average headcount in 2013 to support our continued investment in product functionality, technology platform innovation and new product offerings. Our increase in research and development expense also included a $0.4 million increase in travel and entertainment expenses, partially offset by a $0.1 million decrease in professional fees.
Sales and Marketing Expense
| Year Ended December 31, | 2012 v. 2013 Change | 2013 v. 2014 Change | ||||||||||||||||||||||||||
| 2012 | 2013 | 2014 | $ | % | $ | % | ||||||||||||||||||||||
| (dollars in thousands) | ||||||||||||||||||||||||||||
| Sales and marketing |
$ | 23,278 | $ | 31,779 | $ | 49,007 | $ | 8,501 | 36.5 | % | $ | 17,228 | 54.2 | % | ||||||||||||||
| % of revenue |
50.6 | % | 52.9 | % | 63.7 | % | ||||||||||||||||||||||
2014 Compared to 2013
Sales and marketing expense increased by $17.2 million in 2014 compared to 2013 primarily due to a $14.2 million increase in personnel costs, including sales commissions, and a $2.6 million increase in allocated overhead, both as a result of our increase in headcount from 173 as of December 31, 2013 to 227 as of December 31, 2014 to drive additional sales of our products and services. In 2014, we invested in lead generation activities as well as trade shows and security regional events to strengthen awareness and educate the IT community about our offerings. Our increase in sales and marketing expense also included a $0.6 million increase in travel and entertainment costs as a result of our increased headcount, partially offset by a $0.2 million decrease in professional fees.
2013 Compared to 2012
Sales and marketing expense increased by $8.5 million in 2013 compared to 2012 primarily due to a $6.1 million increase in personnel costs, including sales commissions, and a $1.0 million increase in allocated overhead, both as a result of our increase in headcount from 113 as of December 31, 2012 to 173 as of December 31, 2013 to drive additional sales of our products and services. Our increase in sales and marketing expense also included a $0.6 million increase in travel and entertainment expenses, a $0.5 million increase in marketing expenses and $0.3 million increase in professional fees.
66
Table of Contents
General and Administrative Expense
| Year Ended December 31, | 2012 v. 2013 Change | 2013 v. 2014 Change | ||||||||||||||||||||||||||
| 2012 | 2013 | 2014 | $ | % | $ | % | ||||||||||||||||||||||
| (dollars in thousands) | ||||||||||||||||||||||||||||
| General and administrative |
$ | 9,436 | $ | 12,586 | $ | 12,972 | $ | 3,150 | 33.4 | % | $ | 386 | 3.1 | % | ||||||||||||||
| % of revenue |
20.5 | % | 21.0 | % | 16.9 | % | ||||||||||||||||||||||
2014 Compared to 2013
General and administrative expense increased by $0.4 million in 2014 compared to 2013 primarily due to a $1.4 million increase in personnel costs as a result of our increase in headcount from 58 as of December 31, 2013 to 66 as of December 31, 2014 to support our overall company growth as well as our preparation to operate as a public company, partially offset by a $0.6 million decrease in professional fees and a $0.1 million decrease in allocated overhead.
2013 Compared to 2012
General and administrative expense increased by $3.2 million in 2013 compared to 2012 primarily due to a $1.1 million reduction in 2012 for the contingent consideration liability associated with an acquisition, a $0.5 million increase in personnel costs and a $0.5 million increase in allocated overhead, both as a result of our increase in headcount from 45 as of December 31, 2012 to 58 as of December 31, 2013 to support our overall company growth. Our general and administrative expense also included a $0.8 million increase in professional fees.
Interest Income (Expense), Net
| Year Ended December 31, | 2012 v. 2013 Change | 2013 v. 2014 Change | ||||||||||||||||||||||||||
| 2012 | 2013 | 2014 | $ | % | $ | % | ||||||||||||||||||||||
| (dollars in thousands) | ||||||||||||||||||||||||||||
| Interest income (expense), net |
$ | (71 | ) | $ | (122 | ) | $ | (2,802 | ) | $ | (51 | ) | (71.8 | )% | $ | (2,680 | ) | NM | ||||||||||
| % of revenue |
(0.1 | )% | (0.2 | )% | (3.6 | )% | ||||||||||||||||||||||
2014 Compared to 2013
Interest income (expense), net increased by $2.7 million in 2014 compared to 2013 due to interest expense and discount amortization related to our term loan entered into in December 2013.
2013 Compared to 2012
Interest income (expense), net increased by $0.1 million in 2013 compared to 2012 due to interest expense related to capital leases.
Other Income (Expense), Net
| Year Ended December 31, | 2012 v. 2013 Change | 2013 v. 2014 Change | ||||||||||||||||||||||||||
| 2012 | 2013 | 2014 | $ | % | $ | % | ||||||||||||||||||||||
| (dollars in thousands) | ||||||||||||||||||||||||||||
| Other income (expense), net |
$ | (29 | ) | $ | 43 | $ | (305 | ) | $ | 72 | 248.3 | % | $ | (348 | ) | NM | ||||||||||||
| % of revenue |
— | % | 0.1 | % | (0.4 | )% | ||||||||||||||||||||||
2014 Compared to 2013
Other income (expense), net changed from de minimis income in 2013 to expense of $0.3 million in 2014 primarily due to unrealized and realized foreign currency fluctuations, specifically in European currencies.
67
Table of Contents
2013 Compared to 2012
Other income (expense), net remained relatively consistent in 2013 compared to 2012.
Provision for (Benefit from) Income Taxes
| Year Ended December 31, | 2012 v. 2013 Change | 2013 v. 2014 Change | ||||||||||||||||||||||||||
| 2012 | 2013 | 2014 | $ | % | $ | % | ||||||||||||||||||||||
| (dollars in thousands) | ||||||||||||||||||||||||||||
| Provision for (benefit from) income taxes |
$ | (418 | ) | $ | 170 | $ | 379 | $ | 588 | 140.7 | % | $ | 209 | 122.9 | % | |||||||||||||
| % of revenue |
(0.9 | )% | 0.3 | % | 0.5 | % | ||||||||||||||||||||||
2014 Compared to 2013
Provision for income taxes increased by $0.2 million in 2014 compared to 2013 due to our increased operations in foreign jurisdictions where we are subject to income taxes on profits arising from our intercompany transfer pricing arrangements.
2013 Compared to 2012
Provision for income taxes increased by $0.6 million in 2013 compared to 2012 due to our increased operations in foreign jurisdictions. In 2012, we released our valuation allowance related to an acquisition.
68
Table of Contents
Quarterly Results of Operations
The following table sets forth our unaudited quarterly consolidated statements of operations data for each of the nine quarters in the period ended March 31, 2015. We have prepared the quarterly financial data on the same basis as the audited consolidated financial statements included in this prospectus. In our opinion, the quarterly financial data reflects all adjustments, consisting only of normal recurring adjustments, that we consider necessary for a fair presentation of this data. This quarterly financial data should be read in conjunction with our consolidated financial statements and related notes included elsewhere in this prospectus. Our historical results are not necessarily indicative of the results to be expected in the future.
| Three Months Ended | ||||||||||||||||||||||||||||||||||||
| March 31, 2013 |
June 30, 2013 |
September 30, 2013 |
December 31, 2013 |
March 31, 2014 |
June 30, 2014 |
September 30, 2014 |
December 31, 2014 |
March 31, 2015 |
||||||||||||||||||||||||||||
| (in thousands) (unaudited) |
||||||||||||||||||||||||||||||||||||
| Consolidated Statements of Operations Data: |
||||||||||||||||||||||||||||||||||||
| Revenue: |
||||||||||||||||||||||||||||||||||||
| Products |
$ | 8,806 | $ | 9,404 | $ | 10,092 | $ | 10,331 | $ | 10,615 | $ | 11,013 | $ | 12,428 | $ | 12,974 | $ | 13,645 | ||||||||||||||||||
| Maintenance and support |
3,050 | 3,376 | 3,671 | 3,920 | 4,145 | 4,474 | 5,011 | 5,386 | 5,799 | |||||||||||||||||||||||||||
| Professional services |
1,805 | 1,765 | 1,688 | 2,122 | 1,976 | 2,393 | 2,890 | 3,575 | 4,127 | |||||||||||||||||||||||||||
|
|
|
|
|
|
|
|
|
|
|
|
|
|
|
|
|
|
|
|||||||||||||||||||
| Total revenue |
13,661 | 14,545 | 15,451 | 16,373 | 16,736 | 17,880 | 20,329 | 21,935 | 23,571 | |||||||||||||||||||||||||||
| Cost of revenue: |
||||||||||||||||||||||||||||||||||||
| Products |
979 | 809 | 1,266 | 994 | 1,239 | 1,022 | 1,105 | 1,191 | 1,546 | |||||||||||||||||||||||||||
| Maintenance and support |
790 | 851 | 876 | 871 | 988 | 1,152 | 1,118 | 1,237 | 1,210 | |||||||||||||||||||||||||||
| Professional services |
1,343 | 1,271 | 1,217 | 1,611 | 1,631 | 2,036 | 2,433 | 3,320 | 3,736 | |||||||||||||||||||||||||||
|
|
|
|
|
|
|
|
|
|
|
|
|
|
|
|
|
|
|
|||||||||||||||||||
| Total cost of revenue |
3,112 | 2,931 | 3,359 | 3,476 | 3,858 | 4,210 | 4,656 | 5,748 | 6,492 | |||||||||||||||||||||||||||
| Operating expenses: |
||||||||||||||||||||||||||||||||||||
| Research and development |
5,265 | 5,292 | 5,419 | 5,435 | 6,120 | 6,328 | 6,330 | 6,792 | 6,414 | |||||||||||||||||||||||||||
| Sales and marketing |
6,626 | 6,999 | 8,157 | 9,997 | 11,004 | 11,561 | 12,155 | 14,287 | 13,230 | |||||||||||||||||||||||||||
| General and administrative |
2,523 | 2,734 | 3,269 | 4,060 | 3,482 | 3,174 | 3,136 | 3,180 | 4,053 | |||||||||||||||||||||||||||
|
|
|
|
|
|
|
|
|
|
|
|
|
|
|
|
|
|
|
|||||||||||||||||||
| Total operating expense |
14,414 | 15,025 | 16,845 | 19,492 | 20,606 | 21,063 | 21,621 | 24,259 | 23,697 | |||||||||||||||||||||||||||
|
|
|
|
|
|
|
|
|
|
|
|
|
|
|
|
|
|
|
|||||||||||||||||||
| Loss from operations |
(3,865 | ) | (3,411 | ) | (4,753 | ) | (6,595 | ) | (7,728 | ) | (7,393 | ) | (5,948 | ) | (8,072 | ) | (6,618 | ) | ||||||||||||||||||
| Interest income (expense), net |
(2 | ) | (32 | ) | (20 | ) | (68 | ) | (695 | ) | (703 | ) | (703 | ) | (701 | ) | (685 | ) | ||||||||||||||||||
| Other income (expense), net |
(53 | ) | 4 | 61 | 31 | 41 | 4 | (227 | ) | (123 | ) | (305 | ) | |||||||||||||||||||||||
|
|
|
|
|
|
|
|
|
|
|
|
|
|
|
|
|
|
|
|||||||||||||||||||
| Loss before income taxes |
(3,920 | ) | (3,439 | ) | (4,712 | ) | (6,632 | ) | (8,382 | ) | (8,092 | ) | (6,878 | ) | (8,896 | ) | (7,608 | ) | ||||||||||||||||||
| Provision for (benefit from) income taxes |
40 | 40 | 43 | 47 | 96 | 95 | 89 | 99 | 74 | |||||||||||||||||||||||||||
|
|
|
|
|
|
|
|
|
|
|
|
|
|
|
|
|
|
|
|||||||||||||||||||
| Net loss |
$ | (3,960 | ) | $ | (3,479 | ) | $ | (4,755 | ) | $ | (6,679 | ) | $ | (8,478 | ) | $ | (8,187 | ) | $ | (6,967 | ) | $ | (8,995 | ) | $ | (7,682 | ) | |||||||||
|
|
|
|
|
|
|
|
|
|
|
|
|
|
|
|
|
|
|
|||||||||||||||||||
| Selected Consolidated Balance Sheet Data: |
||||||||||||||||||||||||||||||||||||
| Total deferred revenue |
$ | 46,322 | $ | 49,729 | $ | 52,734 | $ | 59,885 | $ | 61,137 | $ | 67,388 | $ | 72,294 | $ | 85,056 | $ | 88,643 | ||||||||||||||||||
69
Table of Contents
Quarterly Trends
The sequential increases in our quarterly products, maintenance and support and professional services revenue has resulted primarily from increases in our number of new customers as well as increased revenue from existing customers as they expanded their use of our solutions.
Total costs and expenses generally increased sequentially for the periods presented due primarily to the addition of personnel in connection with the expansion of our business and other related expenses to support our growth. We anticipate these expenses will continue to increase in future periods as we continue to focus on investing in the long-term growth of our business. Our quarterly operating results may fluctuate due to various factors affecting our performance.
Liquidity and Capital Resources
Since our inception, we have generated significant losses and expect to continue to generate losses for the foreseeable future. As of March 31, 2015, we had $33.3 million in cash and an accumulated deficit of $261.4 million.
We believe that our existing cash balance together with cash generated from our operations will be sufficient to meet our working capital expenditure requirements for at least the next 12 months. Our future capital requirements will depend on many factors, including our growth rate, the timing and extent of spending to support research and development efforts, the expansion of sales and marketing activities, particularly internationally, and the introduction of new and enhanced products and professional service offerings. In the event that additional financing is required from outside sources, we may be unable to raise the funds on acceptable terms, if at all. If we are unable to raise additional capital when desired, our business, operating results and financial condition could be adversely affected.
The following table shows a summary of our cash flows for the years ended December 31, 2012, 2013 and 2014 and for the three months ended March 31, 2014 and 2015:
| Year Ended December 31, | Three Months Ended March 31, |
|||||||||||||||||||||||||||
| 2012 | 2013 | 2014 | 2014 | 2015 | ||||||||||||||||||||||||
| (in thousands) | ||||||||||||||||||||||||||||
| (unaudited) | ||||||||||||||||||||||||||||
| Cash at beginning of period |
$ | 21,255 | $ | 7,667 | $ | 20,612 | $ 20,612 | $ 36,823 | ||||||||||||||||||||
| Net cash used in operating activities |
(691 | ) | (613 | ) | (3,356 | ) | (2,139 | ) | (3,012 | ) | ||||||||||||||||||
| Net cash used in investing activities |
(6,924 | ) | (2,778 | ) | (7,082 | ) | (5,014 | ) | (573 | ) | ||||||||||||||||||
| Net cash (used in) provided by financing activities |
(5,973 | ) | 16,322 | 26,669 | (31 | ) | 349 | |||||||||||||||||||||
| Effects of exchange rates on cash |
— | 14 | (20 | ) | 1 | (244 | ) | |||||||||||||||||||||
|
|
|
|
|
|
|
|
|
|
|
|||||||||||||||||||
| Cash at end of period |
$ | 7,667 | $ | 20,612 | $ | 36,823 | $ 13,429 | $ 33,343 | ||||||||||||||||||||
|
|
|
|
|
|
|
|
|
|
|
|||||||||||||||||||
Sources of Funds
We have financed our operations in large part with equity and debt financing arrangements, including net proceeds of $93.4 million from the sale of shares of common and preferred stock.
Subordinated Loan and Security Agreement with Silicon Valley Bank
We are also party to a subordinated loan and security agreement with Silicon Valley Bank, which we entered into in December 2013, pursuant to which we borrowed $18.0 million. Interest on the outstanding principal balance
70
Table of Contents
accrues monthly at a rate of 12% per annum. Interest-only payments are payable from January 2014 through December 2015. Commencing in January 2016, principal payments of $0.8 million per month, along with associated interest, will be payable for a period of 24 months, or until the debt is repaid. Pursuant to the loan agreement, we pledged certain assets as collateral, including our intellectual property and accounts receivable. We intend to repay the full outstanding principal balance, together with all accrued interest and a termination fee, with a portion of the proceeds from this offering. In addition, we have a line of credit with Silicon Valley Bank pursuant to a loan and security agreement, as modified in December 2013, for up to $10.0 million that has no balance drawn as of March 31, 2015.
Uses of Funds
Our historical uses of cash have primarily consisted of cash used for operating activities such as expansion of our sales and marketing operations, research and development activities and other working capital needs.
Operating Activities
Operating activities used $3.0 million of cash in the three months ended March 31, 2015, which reflected growth in revenue, offset by continuing investment in our operations. Cash used in operating activities reflected our net loss of $7.7 million, partially offset by our net decrease in operating assets and liabilities of $2.4 million and non-cash charges of $2.3 million related to depreciation and amortization, stock-based compensation and provision for doubtful accounts. The decrease in our net operating assets and liabilities was primarily due to a $4.2 million decrease in accounts receivable, a $3.6 million increase in deferred revenue from sales of our products and services and a $0.1 million increase in other liabilities, partially offset by a $4.0 million decrease in accrued expenses, a $0.8 million increase in prepaid expenses and other assets and a $0.7 million decrease in accounts payable.
Operating activities used $2.1 million in cash in the three months ended March 31, 2014, which reflected growth in revenue, offset by continuing investment in our operations. Cash used in operating activities reflected our net loss of $8.5 million, partially offset by our net decrease in operating assets and liabilities of $4.6 million and non-cash charges of $1.8 million related to depreciation and amortization, stock-based compensation and provision for doubtful accounts. The decrease in our net operating assets and liabilities was primarily due to a $2.6 million decrease in accounts receivable, a $2.0 million increase in other liabilities, a $1.3 million increase in deferred revenue from sales of our products and services and a $0.3 million increase in accrued expenses, partially offset by a $0.9 million decrease in accounts payable and a $0.7 million increase in prepaid expenses and other assets.
Operating activities used $3.4 million of cash in 2014, which reflected growth in revenue, offset by continuing investment in our operations. Cash used in operating activities reflected our net loss of $32.6 million, offset by our net increase in operating assets and liabilities of $21.6 million and non-cash charges of $7.6 million related to depreciation and amortization, stock-based compensation and provision for doubtful accounts. The increase in our net operating assets and liabilities was primarily due to a $25.2 million increase in deferred revenue from sales of our products and services, a $3.5 million increase in accrued expense, a $2.2 million increase in other liabilities and a $0.6 million increase in accounts payable, partially offset by an increase of $7.1 million in accounts receivable and an increase of $2.2 million in prepaid expenses.
Operating activities used $0.6 million in cash in 2013, which reflected growth in revenue. Cash used in operating activities reflected our net loss of $18.9 million, offset by our increase in operating assets and liabilities of $13.0 million and non-cash charges of $5.2 million related to depreciation and amortization, stock-based compensation, provision for doubtful accounts and deferred income taxes. The increase in our net operating assets and liabilities was primarily due to a $15.1 million increase in deferred revenue from sales of our products and services, a $1.1 million increase in accounts payable due to the growth of our business and a $3.0 million increase in accrued expense as a result of headcount growth, partially offset by a $4.0 million increase in accounts receivable and a $3.1 million payment of contingent consideration.
71
Table of Contents
Operating activities used $0.7 million in cash in 2012, which reflected growth in revenue, offset by continuing investment in our operations. Cash used in operating activities reflected our net loss of $12.4 million, offset by our net increase in operating assets and liabilities of $8.4 million and non-cash charges of $3.3 million related to stock-based compensation, depreciation and amortization and provision for doubtful accounts. The increase in our net operating assets and liabilities was primarily due to a $16.5 million increase in deferred revenue from sales of our products and services, partially offset by a $6.6 million increase in accounts receivable and a $1.1 million decrease in contingent liability balances related to acquisitions.
Investing Activities
Investing activities used $0.6 million in cash in the three months ended March 31, 2015 and $5.0 million in cash in the three months ended March 31, 2014, primarily for capital expenditures to purchase property and equipment. In the three months ended March 31, 2014, the capital expenditures primarily related to leasehold improvements for our new corporate headquarters.
Investing activities used $7.1 million in cash in 2014 and $2.8 million in cash in 2013, primarily for capital expenditures to purchase property and equipment, principally related to leasehold improvements for our new corporate headquarters.
Investing activities used $6.9 million in cash in 2012, which consisted of $4.8 million paid in consideration for an acquisition and $2.1 million of capital expenditures.
Financing Activities
Financing activities provided $0.3 million in cash in three months ended March 31, 2015, which consisted primarily of $0.4 million in proceeds from exercises of stock options, partially offset by $0.1 million in payments on capital lease obligations.
Financing activities used de minimis cash in the three months ended March 31, 2014, which consisted of payments on capital lease obligations, partially offset by proceeds from exercises of stock options.
Financing activities provided $26.7 million in cash in 2014, which consisted primarily of $30.8 million in net proceeds from the issuance of shares of Series D preferred stock and $0.5 million in proceeds from exercises of stock options, partially offset by $3.5 million in repurchases of common stock, $0.8 million in payments of contingent consideration related to acquisitions and $0.3 million in payments on capital lease obligations.
Financing activities provided $16.3 million in cash in 2013, which consisted primarily of $18.0 million in proceeds from our term loan borrowing from Silicon Valley Bank and $0.3 million in proceeds from exercises of stock options, partially offset by $1.5 million in payments of contingent consideration related to acquisitions and $0.3 million in payments on capital lease obligations.
Financing activities used $6.0 million of cash in 2012, which consisted primarily of $3.3 million in repurchases of capital stock and $2.6 million in payments of contingent consideration related to acquisitions.
Contractual Obligations and Commitments
The following table summarizes our commitments to settle contractual obligations as of December 31, 2014:
| Less than 1 Year |
1 to 3 Years |
3 to 5 Years |
More than 5 Years |
Total | ||||||||||||||||||||||||
| (in thousands) | ||||||||||||||||||||||||||||
| Term loan payable |
$ | — | $ | 18,000 | $ | — | $ | — | $ | 18,000 | ||||||||||||||||||
| Capital leases |
278 | 70 | — | — | 348 | |||||||||||||||||||||||
| Operating leases |
3,578 | 7,190 | 3,524 | — | 14,292 | |||||||||||||||||||||||
|
|
|
|
|
|
|
|
|
|
|
|||||||||||||||||||
| Total |
$ | 3,856 | $ | 25,260 | $ | 3,524 | $ | — | $ | 32,640 | ||||||||||||||||||
|
|
|
|
|
|
|
|
|
|
|
|||||||||||||||||||
72
Table of Contents
The commitment amounts in the table above are associated with agreements that are enforceable and legally binding and that specify all significant terms, including fixed or minimum services to be used, fixed, minimum or variable price provisions and the approximate timing of the actions under the agreements. The table does not include obligations under agreements that we can cancel without a significant penalty.
We lease our office facilities under non-cancellable operating leases. As of December 31, 2014, we have leases that expire at various dates through 2019.
Off-Balance Sheet Arrangements
We do not have any relationships with unconsolidated entities or financial partnerships, including entities sometimes referred to as structured finance or special purpose entities that were established for the purpose of facilitating off-balance sheet arrangements or other contractually narrow or limited purposes. We do not engage in off-balance sheet financing arrangements. In addition, we do not engage in trading activities involving non-exchange traded contracts. We therefore believe that we are not materially exposed to any financing, liquidity, market or credit risk that could arise if we had engaged in these relationships.
Critical Accounting Policies
Our consolidated financial statements are prepared in accordance with generally accepted accounting principles in the United States, or GAAP. The preparation of our consolidated financial statements requires us to make estimates, assumptions and judgments that affect the reported amounts of assets, liabilities, revenue, costs and expenses. We base our estimates and assumptions on historical experience and other factors that we believe to be reasonable under the circumstances. We evaluate our estimates and assumptions on an ongoing basis. Our actual results may differ from these estimates. Our most critical accounting policies are summarized below. See Note (2) to our consolidated financial statements beginning on page F-1 of this prospectus for a description of our other significant accounting policies.
Revenue Recognition
We generate revenue primarily from selling products, maintenance and support, and professional services through a variety of delivery models. We generally bill customers and collect payment for both our products and services up front.
We generate products revenue from the sale of (1) perpetual or term software licenses and associated content subscriptions for our Nexpose and Metasploit products, (2) managed services for our Nexpose and UserInsight products and (3) cloud-based subscriptions for our UserInsight product. We also generate an immaterial amount of appliance revenue that is included in our products revenue and that is associated with hardware sold as part of our Nexpose product to certain customers. We generate maintenance and support revenue associated with customers’ purchases of our software licenses for Nexpose and Metasploit. We generate professional service revenue from the sale of our deployment and training services related to our solutions, incident response services and security advisory services.
Revenue is only recognized when all of the following criteria are met:
| l | Persuasive evidence of an arrangement exists. Binding agreements or purchase orders are generally evidence of an arrangement. |
| l | Delivery has occurred. Delivery occurs (1) upon delivery of the software license key or when the customer has access to the software product or (2) when we perform the services. |
| l | The sales price is fixed or determinable. Fees are considered fixed and determinable when the fees are contractually agreed upon with the customer. |
73
Table of Contents
| l | Collectability is probable. Collectability is deemed probable based on review of a number of factors, including creditworthiness and customer payment history. If collectability is not reasonably assured, revenue is deferred until collection becomes reasonably assured, which is generally upon the receipt of payment. |
Substantially all of our software licenses are sold in multiple-element arrangements that include maintenance and support, content subscriptions, cloud-based subscriptions, professional services and/or managed services. All of these elements are considered to be software elements other than cloud-based subscriptions, which are non-software elements, and managed services, which can be either software elements or non-software elements. Non-software elements included in multiple-element arrangements consist of a single deliverable that has stand-alone value and that represents a single unit of accounting. We have determined that we do not have vendor-specific objective evidence, or VSOE, of the selling price for the elements comprising these multiple-element arrangements as our software licenses are generally not sold on a stand-alone basis and we purposefully employ variable pricing for our offerings in order to meet customer purchase requirements along the multiple price points of the demand curve.
When all of the elements of a multiple-element arrangement are software elements, the revenue for software licenses and any other products and services that are sold along with the license is generally deferred on our balance sheet and recognized as revenue on our consolidated statements of operations ratably over the contractual period of the maintenance and support, typically one to three years, which is longer than the period over which the professional services are performed. Revenue recognition begins upon delivery of the software license, assuming that all other criteria for revenue recognition have been met.
When a multiple-element arrangement includes both software elements and non-software elements, the total arrangement consideration is first allocated between the software elements and the non-software elements based on the selling price hierarchy, which includes (1) VSOE, if available, (2) third-party evidence, or TPE, if VSOE is not available or (3) best estimate of selling price, or BESP, if neither VSOE nor TPE is available. We have not been able to establish a selling price for any element using VSOE or TPE. We determine BESP by considering our overall pricing objectives and market conditions. Significant pricing practices taken into consideration include our discounting practices, the size and volume of our transactions, our price lists, our go-to-market strategy, historical standalone sales and contract prices. The determination of BESP is made in consultation with, and is approved by, our management. Our multiple-element arrangements can include a single non-software element, in which case the portion of the consideration allocated to the non-software element is recognized ratably over the service period of the non-software element, assuming all other criteria for revenue recognition have been met. The portion of the consideration allocated to software elements is recognized as described above.
With respect to our managed services and cloud-based subscription offerings sold on a stand-alone basis, we recognize revenue ratably over the term of the managed service agreement or subscription, assuming that the other criteria for revenue recognition are met.
We recognize revenue from professional services sold on a stand-alone basis as those services are rendered.
For purposes of disclosing revenue by class, we allocate the arrangement consideration for multiple-element software arrangements among the individual elements utilizing BESP, as we do not have VSOE or third-party evidence, or TPE, of selling price for any of the elements.
Stock-Based Compensation
We measure and recognize compensation expense for all stock options and restricted stock awards based on the estimated fair value of the award on the grant date. We use the Black-Scholes option pricing model to estimate the fair value of stock option awards. The fair value is recognized as expense, net of estimated forfeitures, over the requisite service period, which is generally the vesting period of the respective award, on a straight-line basis
74
Table of Contents
when the only condition to vesting is continued service. If vesting is subject to a market or performance condition, recognition is based on the derived service period of the award. Expense for awards with performance conditions is estimated and adjusted on a quarterly basis based upon the assessment of the probability that the performance condition will be met.
The determination of the grant date fair value of options using the Black-Scholes option pricing model is affected principally by the estimated fair value of our common stock and requires management to make a number of other assumptions, including the expected life of the option, the volatility of the underlying stock, the risk-free interest rate and expected dividends. The assumptions used in our Black-Scholes option-pricing model represent management’s best estimates at the time of grant. These estimates are complex, involve a number of variables, uncertainties and assumptions and the application of management’s judgment, as they are inherently subjective. If any assumptions change, our stock-based compensation expense could be materially different in the future.
These assumptions are estimated as follows:
| l | Fair Value of Common Stock. As our common stock has not historically been publicly traded, we estimated the fair value of common stock. See “—Common Stock Valuations” below. |
| l | Expected Term. The expected term represents the period that our stock options are expected to be outstanding. We calculated the expected term using the simplified method based on the average of each option’s vesting term and the contractual period during which the option can be exercised, which is typically 10 years following the date of grant. |
| l | Expected Volatility. The expected volatility was based on the historical stock volatility of several of our comparable publicly traded companies over a period of time equal to the expected term of the options, as we do not have any trading history to use the volatility of our own common stock. |
| l | Risk-Free Interest Rate. The risk-free interest rate was based on an average of the five and seven-year U.S. Treasury zero-coupon issues for each option grant date with maturities approximately equal to the option’s expected term. |
| l | Expected Dividend Yield. We have not paid dividends on our common stock nor do we expect to pay dividends in the foreseeable future. |
The following table reflects the weighted average assumptions used to estimate the fair value of options granted during the periods presented:
| Year Ended December 31, | Three Months Ended March 31, | |||||||||
| 2012 | 2013 | 2014 | 2014 | 2015 | ||||||
| Expected term (years) |
6.3 | 6.3 | 6.3 | 6.3 | 6.3 | |||||
| Expected volatility |
52 - 54% | 50 - 52% | 47 - 49% | 49% | 45% | |||||
| Risk-free interest rate |
0.9 - 1.4% | 0.9 -1.7% | 1.5 - 1.7% | 1.5% | 1.5% | |||||
| Expected dividend yield |
— | — | — | — | — | |||||
Common Stock Valuation
Historically, for all periods prior to this offering, the exercise price of options to purchase shares of our common stock was the estimated fair market value of our common stock as determined by our board of directors on each grant date. In order to determine the fair market value of our common stock underlying option grants, our board of directors considered, among other things, valuations of our common stock prepared by unrelated third-party valuation firms in accordance with the guidance provided by the American Institute of Certified Public Accountants 2004 Practice Aid, Valuation of Privately-Held-Company Equity Securities Issued as Compensation, or the Practice Aid. Given the absence of a public trading market of our common stock, our board
75
Table of Contents
of directors exercised reasonable judgment and considered a number of objective and subjective factors to determine the best estimate of the fair market value of our common stock, including:
| l | contemporaneous third-party valuations of our common stock; |
| l | the prices, rights, preferences and privileges of our preferred stock relative to the common stock; |
| l | our business, financial condition and results of operations, including related industry trends affecting our operations; |
| l | the likelihood of achieving a liquidity event, such as an initial public offering or sale of our company, given prevailing market conditions; |
| l | the lack of marketability of our common stock; |
| l | the market performance of comparable publicly traded technology companies; and |
| l | the United States and global economic and capital market conditions and outlook. |
Based on an assumed initial public offering price of $ per share, the midpoint of the price range set forth on the cover page of this prospectus, the intrinsic value of vested and unvested stock options outstanding as of March 31, 2015 was $ million and $ million, respectively.
The following table summarizes by grant date the number of shares of common stock subject to stock options granted from January 1, 2014 through March 31, 2015, as well as the associated per share exercise price and the estimated fair value per share of our common stock as of the grant date:
| Grant Date |
Number of Options Granted | Exercise Price Per Share of Common Stock |
Estimated Fair Value Per Share of Common Stock |
|||||||||
| February 4, 2014 |
457,907 | $ | 7.73 | $ | 7.73 | |||||||
| April 30, 2014 |
197,758 | 7.73 | (1) | 8.66 | (2) | |||||||
| September 3, 2014 |
126,100 | 7.73 | (1) | 8.78 | (2) | |||||||
| October 29, 2014 |
10,100 | 8.78 | (1) | 9.77 | (2) | |||||||
| February 4, 2015 |
619,539 | 9.77 | 9.77 | |||||||||
| May 5, 2015 |
321,364 | 10.88 | 10.88 | |||||||||
| (1) | The exercise price per share of common stock was approved by our the board of directors principally based on contemporaneous valuations of our common stock prepared by unrelated third-party valuation firms in accordance with the Practice Aid, among other factors. |
| (2) | In December 2014, we undertook retrospective valuations of the fair market value of our common stock. |
In addition to the stock options granted, we also granted 416,117 shares of restricted common stock on April 30, 2015.
Common Stock Valuation Methodology
In valuing our common stock, our board of directors determined the equity value of our business generally using a combination of the income approach and the market approach valuation methods.
The income approach estimates value based on the expectation of future cash flows that a company will generate, such as cash earnings, cost savings, tax deductions and the proceeds from disposition. These future cash flows are discounted to their present values using a discount rate derived based on an analysis of the cost of capital of comparable publicly traded companies in similar lines of business, as of each valuation date, and is adjusted to reflect the risks inherent in our cash flows.
76
Table of Contents
The market approach estimates the fair value of a company by applying market multiples of comparable publicly traded companies in a similar line of business. The market multiples are based on relevant metrics implied by the price that investors have paid for the equity of publicly traded companies. Given our significant focus on investing in and growing our business, we primarily utilized the revenue multiple when performing valuation assessments under the market approach. When considering which companies to include as our comparable industry peer companies, we focused on U.S.-based publicly traded companies that were broadly comparable to us based on consideration of industry, market and line of business. From the comparable companies, a representative market value multiple was determined and applied to our operating results to estimate the value of our company. The market value multiple was determined based on consideration of multiples of revenue to each of the comparable companies’ last twelve-month revenue and the forecasted future twelve-month revenue. In addition, the market approach considers merger and acquisition transactions involving companies similar to the company’s business being valued. Multiples of revenue are calculated for these transactions and then applied to the business being valued, after reduction by an appropriate discount.
Historically, our enterprise value was determined using a weighted average combination of the income approach and the market approach. Once an equity value was determined, we utilized a hybrid of the option pricing method, or OPM, and probability-weighted expected return method, or PWERM, to allocate the overall value of equity to the various share classes.
The OPM treats common stock and convertible preferred stock as call options on a company’s enterprise value with exercise prices based on the liquidation preferences of the convertible preferred stock. Under this method, the common stock only has value if the funds available for distribution to stockholders exceed the value of the liquidation preference at the time of an assumed liquidity event. The value assigned to the common stock is the remaining value after the convertible preferred stock is liquidated. The OPM prices the call option using the Black-Scholes model. The OPM is used when the range of possible future outcomes is difficult to predict.
The PWERM relies on a forward-looking analysis to predict the possible future value of a company. Under this method, discrete future outcomes, including an initial public offering, or IPO, and non-IPO scenarios, are weighted based on the estimated the probability of each scenario. The PWERM is used when discrete future outcomes can be predicted with reasonable certainty based on a probability distribution.
The hybrid method is generally preferred for a company expecting a liquidity event in the near future but where, due to market or other factors, the liquidity event is uncertain. In the application of the hybrid method, we relied on the PWERM to allocate the value of equity under a near-term liquidity scenario and the OPM to allocate the value of equity under a long-term liquidity scenario. The projected equity value relied upon in the PWERM scenario was based on (1) guideline IPO transactions involving companies that were considered broadly comparable to us and (2) our expectation of the pre-money valuation that we needed to achieve to consider an IPO as a viable exit strategy. The projected equity value relied upon in the OPM was based on a weighted average indication of the value using the discounted cash flow method, which is an income approach, and the guideline public company method, which is a market approach.
Contemporaneous Valuations
February 2014 Grants
Our board of directors granted stock options in February 2014 with an exercise price of $7.73 per share, which was also the value per share used for financial reporting purposes. For these stock option grants, our board of directors determined the fair market value of our common stock on the date of grant to be $7.73 per share based on a number of factors, including a contemporaneous third-party valuation as of December 31, 2013 and our earnings history and financial performance, as well as our current prospects and expected operating results. More specifically, our board of directors considered, among other things: (1) the present value of our anticipated future cashflows, (2) the value of our tangible and intangible assets, (3) recent material events, (4) our operating results, (5) the market value of equity interests in substantially similar businesses, which equity interests can be valued
77
Table of Contents
through nondiscretionary, objective means, (6) recent arm’s length transactions involving the sale or transfer of our common stock or other equity interests, (7) changes in control premiums or discounts for lack of marketability and (8) other factors that our board of directors deemed material in order to determine in good faith the fair market value per share of our common stock.
The valuation as of December 31, 2013 was determined using the hybrid method. The OPM was weighted assuming a 70% probability of occurrence of a long-term liquidity event and the PWERM was weighted assuming a 30% probability of occurrence of an IPO. With respect to the OPM, the enterprise value was determined by using a combination of income and market approaches. An enterprise value under the income approach was estimated based on the estimated present value of our estimated future cash flows, which was weighted at 50% in the OPM. An enterprise value under the market approaches was estimated based on the application of market multiples to our last-twelve-months and forward-looking revenues and comparable market transactions, each of which was weighted at 25%. With respect to the present value of future estimated cash flows under the income approach, we applied a discount rate of 25% and a revenue multiple terminal value that was determined based upon a guideline public company analysis considering companies of relative size, growth and profitability. Finally, our enterprise value reflected a non-marketability discount of 20%. With respect to the PWERM, the enterprise value was estimated based upon a revenue multiple that fell between the range of the 25th percentile and the median of guideline IPO transactions. For the purposes of the PWERM, we estimated an IPO date of June 30, 2015 and used a risk adjusted discount rate of 35%.
April 2014 Grants
Our board of directors granted stock options in April 2014 with an exercise price of $7.73 per share. For these stock option grants, our board of directors determined the fair market value of our common stock on the date of grant to be $7.73 per share based on a number of factors, including a contemporaneous third-party valuation as of December 31, 2013 described above and our earnings history and financial performance, as well as our current prospects and expected operating results. More specifically, our board of directors considered, among other things: (1) the present value of our anticipated future cashflows, (2) the value of our tangible and intangible assets, (3) recent material events, (4) our operating results, (5) the market value of equity interests in substantially similar businesses, which equity interests can be valued through nondiscretionary, objective means, (6) recent arm’s length transactions involving the sale or transfer of our common stock or other equity interests, (7) changes in control premiums or discounts for lack of marketability and (8) other factors that our board of directors deemed material in order to determine in good faith the fair market value per share of our common stock.
Based on the factors noted above, our board of directors concluded that the grant date fair value for the April 2014 option grants did not materially change from the December 31, 2013 valuation.
September 2014 Grants
Our board of directors granted stock options in September 2014 with an exercise price of $7.73 per share. For these stock option grants, our board of directors determined the fair market value of our common stock on the date of grant to be $7.73 per share based on a number of factors, including a contemporaneous third-party valuation as of December 31, 2013 described above and our earnings history and financial performance, as well as our current prospects and expected operating results. More specifically, our board of directors considered, among other things: (1) the present value of our anticipated future cashflows, (2) the value of our tangible and intangible assets, (3) recent material events, (4) our operating results, (5) the market value of equity interests in substantially similar businesses, which equity interests can be valued through nondiscretionary, objective means, (6) recent arm’s length transactions involving the sale or transfer of our common stock or other equity interests, (7) changes in control premiums or discounts for lack of marketability and (8) other factors that our board of directors deemed material in order to determine in good faith the fair market value per share of our common stock.
Based on the factors noted above, our board of directors concluded that the grant date fair value for the September 2014 option grants did not materially change from the December 31, 2013 valuation.
78
Table of Contents
October 2014 Grants
Our board of directors granted stock options in October 2014 with an exercise price of $8.78 per share. For these stock option grants, our board of directors determined the fair market value of our common stock on the date of grant to be $8.78 per share based on a number of factors, including a contemporaneous third-party valuation as of September 30, 2014 and our earnings history and financial performance, as well as our current prospects and expected operating results. More specifically, our board of directors considered, among other things: (1) the present value of our anticipated future cashflows, (2) the value of our tangible and intangible assets, (3) recent material events, (4) our operating results, (5) the market value of equity interests in substantially similar businesses, which equity interests can be valued through nondiscretionary, objective means, (6) recent arm’s length transactions involving the sale or transfer of our common stock or other equity interests, (7) changes in control premiums or discounts for lack of marketability and (8) other factors that our board of directors deemed material in order to determine in good faith the fair market value per share of our common stock.
Due to the timing of the October 2014 option grants relative to the third-party valuation of our common stock conducted as of December 31, 2014 discussed below, we determined that it was appropriate to use the fair value of our common stock reflected in the December 31, 2014 valuation to determine our stock-based compensation expense for the October 2014 option grants for financial reporting purposes.
February 2015 Grants
Our board of directors granted stock options in February 2015 with an exercise price of $9.77 per share, which was also the value per share used for financial reporting purposes. For these stock option grants, our board of directors determined the fair market value of our common stock on the date of grant to be $9.77 per share based on a number of factors, including a contemporaneous third-party valuation as of December 31, 2014 and our earnings history and financial performance, as well as our current prospects and expected operating results. More specifically, our board of directors considered, among other things: (1) the present value of our anticipated future cashflows, (2) the value of our tangible and intangible assets, (3) recent material events, (4) our operating results, (5) the market value of equity interests in substantially similar businesses, which equity interests can be valued through nondiscretionary, objective means, (6) recent arm’s length transactions involving the sale or transfer of our common stock or other equity interests, (7) changes in control premiums or discounts for lack of marketability and (8) other factors that our board of directors deemed material in order to determine in good faith the fair market value per share of our common stock.
The valuation as of December 31, 2014 was determined using the hybrid method. The OPM was weighted assuming a 60% probability of occurrence of a long-term liquidity event and the PWERM was weighted assuming a 40% probability of occurrence of an IPO. With respect to the OPM, the enterprise value was determined by using a combination of an income and market approaches. An enterprise value under the income approach was estimated based on the estimated present value of our future cash flows, which was weighted at 50%. An enterprise value under the market approach was based on the application of market multiples to our last-twelve-months and forward-looking revenues, which was weighted at 50%. With respect to the present value of future estimated cash flows under the income approach, we applied a discount rate of 25% and a revenue multiple terminal value that was determined based upon a guideline public company analysis considering companies of relative size, growth and profitability. Finally, our enterprise value reflected a non-marketability discount of 15%. With respect to the PWERM, the enterprise value was estimated based upon a revenue multiple that fell between the range of the 25th percentile and the median of guideline IPO transactions. For the purposes of the PWERM, we estimated an IPO date of December 31, 2015 and used a risk adjusted discount rate of 35%.
May 2015 Grants
Our board of directors granted stock options in May 2015 with an exercise price of $10.88 per share, which was also the value per share used for financial reporting purposes. For these stock option grants, our board of directors determined the fair market value of our common stock on the date of grant to be $10.88 per share based
79
Table of Contents
on a number of factors, including a contemporaneous third-party valuation as of March 31, 2015 and our earnings history and financial performance, as well as our current prospects and expected operating results. More specifically, our board of directors considered, among other things: (1) the present value of our anticipated future cashflows, (2) the value of our tangible and intangible assets, (3) recent material events, (4) our operating results, (5) the market value of equity interests in substantially similar businesses, which equity interests can be valued through nondiscretionary, objective means, (6) recent arm’s length transactions involving the sale or transfer of our common stock or other equity interests, (7) changes in control premiums or discounts for lack of marketability and (8) other factors that our board of directors deemed material in order to determine in good faith the fair market value per share of our common stock.
The valuation as of March 31, 2015 was determined using the hybrid method. The OPM was weighted assuming a 40% probability of occurrence of a long-term liquidity event and the PWERM was weighted assuming a 60% probability of occurrence of an IPO. With respect to the OPM, the enterprise value was determined by using a combination of an income and market approaches. An enterprise value under the income approach was estimated based on the estimated present value of our future cash flows, which was weighted at 50%. An enterprise value under the market approach was based on the application of market multiples to our last-twelve-months and forward-looking revenues, which was weighted at 50%. With respect to the present value of future estimated cash flows under the income approach, we applied a discount rate of 25% and a revenue multiple terminal value that was determined based upon a guideline public company analysis considering companies of relative size, growth and profitability. Finally, our OPM enterprise value reflected a non-marketability discount of 15%. With respect to the PWERM, the enterprise value was estimated based upon a revenue multiple that fell between the range of the 25th percentile and the median of guideline IPO transactions. For the purposes of the PWERM, we estimated an IPO date of September 30, 2015 and used a risk adjusted discount rate of 35%. Finally, our PWERM enterprise value reflected a non-marketability discount of 10%.
In addition, we granted 416,117 shares of restricted common stock on April 30, 2015, which, by definition, do not have an exercise price. When assessing the appropriate fair value for purposes of calculating the related stock-based compensation expense for these awards for financial reporting, we evaluated the contemporaneous third-party valuation as of March 31, 2015, which is described above.
The difference in the sale price of our Series D preferred stock issued in December 2014 relative to the contemporaneous fair market value per share of our common stock, as determined by our board of directors, is attributable to the fact that holders our Series D preferred stock are entitled to accruing dividends, liquidation preferences, protective provisions, registration rights and other rights and privileges to which holders of our common stock are not entitled.
Retrospective Valuations
In connection with the preparation of the financial statements necessary for the filing of the registration statement of which this prospectus forms a part, in December 2014, we undertook retrospective valuations of the fair market value of our common stock.
March 2014 Valuation
For purposes of calculating stock-based compensation expense for financial reporting purposes, we calculated the fair value of our common stock underlying the April 2014 option grants based on a retrospective third-party valuation as of March 31, 2014. As a result of this retrospective valuation, we determined that the grant date fair market value of the common stock underlying the options granted in April 2014 for financial statement purposes was $8.66 per share.
The valuation as of March 31, 2014 was determined using the hybrid method. The OPM was weighted assuming a 70% probability of occurrence of a long-term liquidity event and the PWERM was weighted assuming a 30% probability of occurrence of an IPO. With respect to the OPM, the enterprise value was determined by using a
80
Table of Contents
combination of an income and market approaches. An enterprise value under the income approach was estimated based on the estimated present value of our future cash flows, which was weighted at 50%. An enterprise value under the market approach was based on the application of market multiples to our last-twelve-months and forward-looking revenues, which was weighted at 50%. With respect to the present value of future estimated cash flows under the income approach, we applied a discount rate of 25% and a revenue multiple terminal value that was determined based upon a guideline public company analysis considering companies of relative size, growth and profitability. Finally, our enterprise value reflected a non-marketability discount of 20%. With respect to the PWERM, the enterprise value was estimated based upon a revenue multiple that fell between the range of the 25th percentile and the median of guideline IPO transactions. For the purposes of the PWERM, we estimated an IPO date of September 30, 2015 and used a risk adjusted discount rate of 35%.
September 2014 Valuation
For purposes of calculating stock-based compensation expense for financial reporting purposes, we calculated the fair value of our common stock underlying the September 2014 option grants based on a retrospective third-party valuation as of September 30, 2014. As a result of this retrospective valuation, we determined that the grant date fair market value of the common stock underlying the options granted in September 2014 for financial statement purposes was $8.78 per share.
The valuation as of September 30, 2014 was determined using the hybrid method. The OPM was weighted assuming a 70% probability of occurrence of a long-term liquidity event and the PWERM was weighted assuming a 30% probability of occurrence of an IPO. With respect to the OPM, the enterprise value was determined by using a combination of an income and market approaches. An enterprise value under the income approach was estimated based on the estimated present value of our future cash flows, which was weighted at 50%. An enterprise value under the market approach was based on the application of market multiples to our last-twelve-months and forward-looking revenues, which was weighted at 50%. With respect to the present value of future estimated cash flows under the income approach, we applied a discount rate of 25% and a revenue multiple terminal value that was determined based upon a guideline public company analysis considering companies of relative size, growth and profitability. Finally, our enterprise value reflected a non-marketability discount of 17.5%. With respect to the PWERM, the enterprise value was estimated based upon a revenue multiple that fell between the range of the 25th percentile and the median of guideline IPO transactions. For the purposes of the PWERM, we estimated an IPO date of December 31, 2015 and used a risk adjusted discount rate of 35%.
Following the closing of this offering, the fair value of our common stock will be determined based on the closing price of our common stock on the NASDAQ Global Market.
Preferred Stock Valuation Methodology
At any time after November 16, 2018, the holders of (1) a majority of the then-outstanding shares of Series A preferred stock and Series B preferred stock, voting together as a single class on an as-converted basis and (2) a majority of the then-outstanding shares of Series C preferred stock, voting as a single class, may request that we redeem all the outstanding shares of preferred stock. The preferred stock would be redeemed in an amount in cash equal to the greater of (1) the aggregate original issuance price of such preferred stock plus all accrued and unpaid dividends thereon, whether or not declared or (2) the fair market value of such preferred stock. As redemption of the preferred stock is outside our control, all shares of preferred stock have been presented outside of stockholders’ deficit in our consolidated balance sheets. We recognize changes in the redemption value as they occur and adjust the carrying amount of the preferred stock to equal the redemption value at the end of each reporting period.
We determine the fair value of our preferred stock as of each reporting period using the guidance prescribed by the Practice Aid, which is consistent with the way we have valued our common stock described above.
81
Table of Contents
Income Taxes
Income taxes are accounted for using the asset and liability method. Under this method, deferred tax assets and liabilities are recognized for the future tax consequences attributable to differences between the financial statement carrying amounts of existing assets and liabilities and their respective income tax bases, and operating loss and tax credit carryforwards. Valuation allowances are provided when we determine that it is more likely than not that all of, or a portion of, deferred tax assets will not be utilized in the future.
We account for unrecognized tax benefits using a more-likely-than-not threshold for financial statement recognition and measurement of tax positions taken or expected to be taken in a tax return.
Significant judgment is required in determining any valuation allowance recorded against deferred tax assets. In assessing the need for a valuation allowance, we consider all available evidence, including past operating results, estimates of future taxable income and the feasibility of tax planning strategies. In the event that we change our determination as to the amount of deferred tax assets that can be realized, we will adjust our valuation allowance with a corresponding impact to the provision for income taxes in the period in which such determination is made.
Estimates of future taxable income are based on assumptions that are consistent with our plans. Assumptions represent management’s best estimates and involve inherent uncertainties and the application of management’s judgment. Should actual amounts differ from our estimates, the amount of our tax expense and liabilities could be materially impacted.
Goodwill and Other Intangible Assets
Goodwill is an asset representing the future economic benefits arising from other assets acquired in a business combination that are not individually identified and separately recognized. We allocate the cost of an acquired entity to the assets acquired and liabilities assumed based on their estimated fair values at the date of acquisition. The excess of the purchase price for acquisitions over the fair value of the net assets acquired, including other intangible assets, is recorded as goodwill. Goodwill is not amortized but is tested for impairment at least annually or more frequently when events or circumstances occur that indicate that it is more likely than not that an impairment has occurred.
For our goodwill impairment analysis, we operate with a single reporting unit. The two step impairment test begins with an estimation of the fair value of a reporting unit. Goodwill impairment exists when a reporting unit’s carrying value of goodwill exceeds its implied fair value. Significant judgment is applied when goodwill is assessed for impairment. In performing the first step of the goodwill impairment testing and measurement process, we compare our entity-wide estimated fair value to net book value to identify potential impairment. Management estimates the entity-wide fair value utilizing a weighted-average of the income approach using discounted cash flows, guideline public company and guideline transaction methods. If the fair value of the reporting unit is less than the book value, the second step is performed to determine if goodwill is impaired. If we determine through the impairment evaluation process that goodwill has been impaired, an impairment charge would be recorded in our consolidated statements of operations. There has been no impairment of goodwill for any periods presented. In addition, based on the results of our impairment test, our reporting unit was not at risk of having its carrying value, including goodwill, exceed its fair value.
Other intangible assets acquired in a business combination are recognized at fair value using generally accepted valuation methods appropriate for the type of intangible asset and reported separately from goodwill. Intangible assets with definite lives are amortized over the estimated useful lives and are tested for impairment when events or circumstances occur that indicate that it is more likely than not that an impairment has occurred. We test other intangible assets with definite lives for impairment by comparing the carrying amount to the sum of the net undiscounted cash flows expected to be generated by the asset whenever events or changes in circumstances indicate that the carrying amount of the asset may not be recoverable. If the carrying amount of the asset exceeds its net undiscounted cash flows, then an impairment loss is recognized for the amount by which the carrying amount exceeds its fair value. There has been no impairment of other intangible assets for any periods presented.
82
Table of Contents
Recent Accounting Pronouncements
In May 2014, the Financial Accounting Standards Board issued Accounting Standards Update 2014-09, Revenue from Contracts with Customers (Topic 606). This guidance outlines a single, comprehensive model for accounting for revenue from contracts with customers and will become effective in the first quarter of 2017 for public companies with calendar year ends. We are currently evaluating the impact that the standard will have on our consolidated financial statements.
Qualitative and Quantitative Disclosures about Market Risk
Market risk represents the risk of loss that may impact our financial position due to adverse changes in financial market prices and rates. Our market risk exposure is primarily the result of fluctuations in interest rates and foreign exchange rates as well as, to a lesser extent, inflation.
Interest Rate Risk
We are exposed to interest rate risk in the ordinary course of our business. Our cash is held in readily available checking and money market accounts. These securities are not dependent on interest rate fluctuations that may cause the principal amount of these assets to fluctuate. Additionally, the interest rate on our term loan is fixed and we intend to pay the full outstanding principal balance and accrued interest with a portion of the proceeds from this offering. We have a working capital line of credit with an annual interest rate equal to the prime rate plus 1.25%. As of March 31, 2015, there was no outstanding balance on this facility.
Foreign Currency Exchange Risk
Our results of operations and cash flows are subject to fluctuations due to changes in foreign currency exchange rates. Substantially all of our customers enter into contracts that are denominated in U.S. dollars. Our expenses are generally denominated in the currencies of the countries where our operations are located, which is primarily in the United States and to a lesser extent in the United Kingdom, other Euro-zone countries within mainland Europe, Hong Kong, Canada, Singapore and Australia. Our results of operations and cash flows are, therefore, subject to fluctuations due to changes in foreign currency exchange rates and may be adversely affected in the future due to changes in foreign currency exchange rates. The effect of a hypothetical 10% change in foreign currency exchanges rates applicable to our business would not have a material impact on our historical consolidated financial statements. To date, we have not engaged in any hedging strategies. As our international operations grow, we will continue to reassess our approach to manage our risk relating to fluctuations in foreign currency rates.
Inflation Risk
We do not believe that inflation had a material effect on our business, financial condition or results of operations in the last three years. If our costs were to become subject to significant inflationary pressures, we may not be able to fully offset such higher costs through price increases. Our inability or failure to do so could harm our business, financial condition and results of operations.
JOBS Act Transition Period
In April 2012, the Jumpstart Our Business Startups Act of 2012, or the JOBS Act, was enacted. Section 107 of the JOBS Act provides that an “emerging growth company” can take advantage of the extended transition period provided in Section 7(a)(2)(B) of the Securities Act for complying with new or revised accounting standards. Thus, an emerging growth company can delay the adoption of certain accounting standards until those standards would otherwise apply to private companies. We have irrevocably elected not to avail ourselves of this extended transition period and, as a result, we will adopt new or revised accounting standards on the relevant dates on which adoption of such standards is required for other public companies.
83
Table of Contents
We are in the process of evaluating the benefits of relying on other exemptions and reduced reporting requirements under the JOBS Act. Subject to certain conditions, as an emerging growth company, we may rely on certain of these exemptions, including without limitation, (i) providing an auditor’s attestation report on our system of internal controls over financial reporting pursuant to Section 404(b) of the Sarbanes-Oxley Act and (ii) complying with any requirement that may be adopted by the Public Company Accounting Oversight Board regarding mandatory audit firm rotation or a supplement to the auditor’s report providing additional information about the audit and the financial statements, known as the auditor discussion and analysis. We will remain an emerging growth company until the earlier to occur of (1) the last day of the fiscal year (a) following the fifth anniversary of the completion of this offering, (b) in which we have total annual gross revenues of at least $1.0 billion or (c) in which we are deemed to be a “large accelerated filer” under the rules of the U.S. Securities and Exchange Commission, which means the market value of our common stock that is held by non-affiliates exceeds $700 million as of the prior June 30th, and (2) the date on which we have issued more than $1.0 billion in non-convertible debt during the prior three-year period.
84
Table of Contents
Overview
Rapid7 is a leading provider of security data and analytics solutions that enable organizations to implement an active, analytics-driven approach to cyber security. Our security data and analytics platform was purpose built for today’s increasingly complex and chaotic IT environment. We combine our extensive experience in security data and analytics and deep insight into attacker behaviors and techniques to make sense of the wealth of data available to organizations about their IT environments and users. There has been an explosion of increasingly sophisticated cyber attacks as the proliferation of mobile devices, cloud-based applications and solutions relying on user credentials has eliminated the boundaries that previously defined an organization’s network perimeter and expanded the threat surface that organizations must now defend. Our powerful and proprietary analytics enable organizations to contextualize and prioritize the threats facing their physical, virtual and cloud assets, including those posed by the behaviors of their users. Leveraging our security data and analytics platform, our solutions enable organizations to strategically and dynamically manage their cyber security exposure. Our solutions empower organizations to prevent attacks by providing visibility into vulnerabilities and to rapidly detect compromises, respond to breaches and correct the underlying causes of attacks. This balanced and analytics-focused approach ultimately better secures organizations’ environments and reduces the likelihood of, and risks associated with, cyber attacks. We believe our technology and solutions revolutionize the practice of cyber security and are central and critical to implementing a modern security program.
With our security data and analytics platform at our core, we are pioneering active, analytics-driven solutions to cyber security that enable organizations to find and eliminate critical weaknesses and detect attacks in their IT environments. Our threat exposure management offerings include our industry-leading vulnerability management products, which we enhance with deep security analytics capabilities to quickly deliver contextual risk prioritization, critical threat awareness and impactful remediation guidance. Similarly, we added analytics and automation to traditional manual penetration testing to be able to deliver robust ongoing attack simulation solutions that provide organizations with visibility into real world threats. By providing and combining analytics and actionable insights related to both an organization’s attack surface and the dynamic threat landscape, our security data and analytics platform enables organizations to manage their threat exposure above and beyond traditional vulnerability management products on the market.
Further leveraging our technology platform and analytics capabilities, we recently introduced our incident detection product to provide organizations with the ability to rapidly detect and respond to cyber security incidents and breaches. Proprietary behavioral and pattern-recognition analytics are central to this capability, which functions in part by automatically mapping an organization’s assets and users relative to the threat landscape, such that aberrant and risky user-specific and asset-specific behaviors are rapidly identified, escalated for investigation and prioritized by threat level. To complement our incident detection product, we also recently introduced our incident response services, which provide our customers with critical access to our security experts and experience, enabling them to accelerate incident response and containment. We also offer security advisory services that help organizations develop a holistic approach to their cyber security programs and advance their cyber security program maturity. All of our products have been designed with an intuitive user interface, focused on ease-of-use and fast time-to-value for our customers.
85
Table of Contents
The Rapid7 Security Data and Analytics Evolution
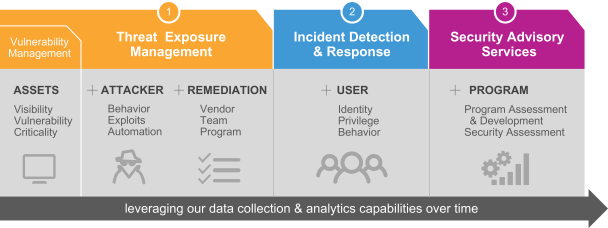
Cyber security has become a strategic imperative for organizations globally, driven by increased focus by boards of directors and senior management in the wake of numerous recent high profile breaches and data thefts. Organizations are increasingly at risk of being compromised, with the number of reported security incidents within enterprises increasing 48% in 2014 over the prior year, according to a report by PricewaterhouseCoopers LLP, or PWC. There are three converging macro drivers that are changing the cyber security landscape for organizations and driving the increase in cyber breaches. First, mobile and connected devices, cloud-based applications and more open and interconnected networks have increased IT complexity, expanding the exploitable attack surface across an organization and resulting in more sources of potential vulnerability. Second, there has been a dramatic change in the tools available to cyber attackers. Attackers can now purchase highly effective and easy-to-use software that is designed to circumvent traditional prevention-based tools at very low cost, thereby lowering the bar for nearly anyone to launch advanced cyber attacks. Third, the economic motives for attackers are more compelling, with new, vibrant markets providing attackers an efficient and effective way to monetize stolen customer information and employee data.
The confluence of these factors has rendered the old model of “block and protect” prevention-based cyber security programs ineffective. These traditional “block and protect” approaches to cyber security typically rely disproportionately on network perimeter protection tools such as firewalls and antivirus software to stop attackers. However, as the network perimeter rapidly disappears, the effectiveness of these legacy solutions diminishes greatly. In addition, prevention-centric models are often passive and implemented with a “deploy and forget” mentality, lacking a holistic cyber security strategy. While prevention-based approaches can alert IT professionals to potentially suspicious activity, the data generated is often raw and in “machine form,” making it difficult for an organization to develop actionable insights that reflect a real-time understanding of the organization’s assets, user behavior and the dynamic threat landscape that it faces. Developing these insights has historically been complex and resource intensive, requiring security expertise, data scientists and analytical modeling skills, which many organizations lack. Further, preventative solutions are generally not able to identify or deter attacks that involve stolen or weak credentials, which are used in 76% of cyber attacks according to the 2013 Verizon Data Breach Investigations Report. When an attacker gains access to an organization’s network through compromised credentials or otherwise, the attacker can freely exploit assets within the breached environment until they are detected, which took a median of 205 days in 2014 according to a report by Mandiant.
The decreasing effectiveness of a traditional prevention-focused approach to cyber security is causing a significant shift to a new model that uses an active, analytics-driven approach to reduce and manage risks to the organization. This new model disrupts the historical focus on “block and protect” solutions and balances organizations’ investments in prevention, detection and correction to reduce the likelihood of, and risks
86
Table of Contents
associated with, cyber attacks. Effective implementation of this new model demands data and analytics to assess the effectiveness of tools and programs, identify attacker behaviors and prioritize and remediate exposures. Rapid7 empowers organizations to better secure their dynamic IT environments by providing the security data and analytics that are at the core of a holistic and active, analytics-driven approach to cyber security. Given the shift to the new cyber security model and the needs of organizations to address their security issues, we estimate that the market opportunity for security data and analytics is $12.6 billion in 2015.
As of March 31, 2015, we had more than 3,900 customers, including over 30% of the organizations in the Fortune 1000. We have experienced strong revenue growth with revenue increasing from $31.0 million in 2011 to $76.9 million in 2014, representing a 35% compound annual growth rate. We have strong visibility to our revenue as 53% of the revenue recognized in 2014 was recorded on our balance sheet as deferred revenue as of December 31, 2013 and 85% of the revenue recognized in the first quarter of 2015 was recorded on our balance sheet as deferred revenue as of December 31, 2014. We incurred a net loss of $32.6 million in 2014 as we continued to invest for growth given our large market opportunity.
Industry Background
Industry Overview
Cyber security is a critical focus area for executives, boards of directors and IT professionals at organizations globally. Security breaches are becoming more common, higher profile and have increasingly negative consequences for organizations. In response, organizations are enlarging cyber security budgets in order to thwart potential attacks. IT professionals face a rapidly evolving and dynamic threat landscape and an increasingly fragmented mosaic of security technology vendors offering point solutions to prevent specific threats and protect against specific attack vectors. Forced to make choices and allocate cyber security budgets with limited information, IT professionals are often left feeling overwhelmed. At the same time, threats continue to escalate due to three converging macro drivers that are changing the practice of cyber security:
Increasingly Complex IT Environment is Expanding Organizations’ Attack Surfaces
The transformation of the IT environment is being driven by the proliferation of mobile and other connected devices, cloud-based applications and the increasing empowerment of business users. IT departments are required to deliver more applications faster, often in the cloud, in order to meet growing user demands for innovation and productivity tools. As a result, it has become increasingly difficult for IT departments to secure the increasing number of systems against the growing number of known security vulnerabilities. For example, in 2014, many organizations were affected by the exploitation of widespread vulnerabilities such as “Heartbleed” and “Shellshock,” with many IT departments unprepared and under-resourced as they attempted to understand the impact of these vulnerabilities and then quickly operationalize a remediation effort to minimize the risks and exposures to their organizations.
Increasing user empowerment has also led to an increase in the number of applications and devices and the amount of data that individual users can access with their credentials, which further expands the attack surface of an organization exposed to potential cyber criminals. According to the 2013 Verizon Data Breach Investigations Report, 76% of network intrusions exploited weak or stolen credentials in that year. Users can be the subject of targeted phishing attacks, where an attacker masquerades as a trustworthy entity in an electronic communication in order to gain control of a user’s device and/or credentials. These credentials can then be used to access the enterprise and its network more broadly, as well as give the attacker access to cloud-based software and applications, where they may gain access to even more protected data. Through 2015, more than 75 percent of mobile applications will fail basic security tests, according to Gartner, Inc., or Gartner. Firewalls and other traditional prevention-based techniques are less capable of protecting this complex and expanded attack surface, leaving IT professionals overwhelmed by new threats and looking for new technologies and ways to respond.
87
Table of Contents
Weaponized Malware Evades Traditional Prevention-Based Tools and Expands the Cyber-Attacker Universe
The historical threat landscape used to be defined by amateur cyber criminals launching attacks for fame or mischief. Those attacks caused relatively little damage and could often be detected and prevented by signature-based security solutions. However, today there are sophisticated software toolkits and malware that can be used to launch a cyber attack, which are readily available online for free or at a low cost. These toolkits are specifically designed to circumvent the preventative security measures typically put in place by organizations, allowing cyber criminals with rudimentary IT knowledge to launch sophisticated attacks on enterprise users and networks. With this weaponized software, cyber attacks are no longer just the domain of advanced attackers, and the number of security breaches is rapidly increasing. According to PWC, the total number of security incidents reported by enterprises increased by 48% in 2014.
A Vibrant Cyber-Crime Economy Further Incents Cyber Attackers
The dependence of organizations on information technology and the sensitive and valuable nature of digitally stored data have raised the stakes for cyber attackers, with financial gain becoming a primary motive for many attackers. Economic incentives for attackers continue to become more compelling, as new and vibrant black markets for stolen data, including credit card information, email account information and healthcare information, enable attackers to efficiently and effectively monetize stolen information. This more recent dynamic has led to a proliferation of data from successful attacks being offered for sale by cyber criminals, and the formation of a lucrative and growing underground economy. According to a 2014 report by the RAND Corporation, hacker black markets are growing in size and complexity and in certain respects can be more profitable than the illegal drug trade because worldwide distribution is accomplished electronically such that resource requirements are negligible.
Enterprise Security Shifting from Passive “Block and Protect” to Actively-Managed Security Programs
As a result of the above trends in the cyber security landscape, organizations are increasingly faced with unwieldy chaos as they are challenged to deliver solutions that increase user and employee productivity while ensuring overall organizational integrity and security. This chaos is overwhelming for IT professionals as they seek to protect their organizations against increasingly high profile, damaging and costly breaches. A new model for cyber security is needed and organizations are shifting from the traditional “block and protect” prevention-centric strategies to actively-managed security programs for the following reasons:
Passive, Prevention-Based Security Infrastructure is Inadequate
Organizations have traditionally taken a passive approach to cyber security, relying on deploying “block and protect” security tools aimed at thwarting attackers at the perimeter of the network. “Block and protect” security tools include firewalls, intrusion prevention, identity and access management, endpoint security and network access controls, among others. To address newly discovered vulnerabilities and security threats, IT professionals traditionally added new prevention-centric devices and technologies to their existing tools, with little consideration for overall management or ecosystem optimization. On the other hand, sophisticated software-enabled technologies and techniques are increasingly used by cyber criminals to evade prevention-based security solutions. Additionally, the explosion of cloud-based applications and mobile devices accessing enterprise data are blurring the previously rigid lines that once defined enterprise network boundaries. Without these boundaries, prevention-based tools are easily circumvented by attackers.
Equally problematic for today’s organizations, traditional “block and protect” solutions are ineffective against cyber attacks using compromised user credentials. Traditional security protocols rely on procedures to grant individual users only the specific security privileges that they require, which results in many organizations managing a compliance-focused approach to cyber security. However, compliance and monitoring is becoming increasingly impractical in light of the expansion of endpoints and proliferation of mobile and other connected
88
Table of Contents
devices. The risks and exposures are further increased because many users have administrator-level credentials on their devices to maximize their productivity, but these credentials are relatively easily stolen and can be exploited by attackers in order to gain access to an organization’s network, assets and information. Use of stolen credentials in cyber attacks is becoming a significant issue, with 76% of all network intrusions involving stolen or weak credentials, according to the 2013 Verizon Data Breach Investigations Report. Once an attacker has gained access to an IT system with valid credentials, most prevention-based technologies cannot identify the threat. According to a 2015 report by Mandiant, in 2014 attackers were present on a victim’s network on average for more than six months before detection. Without knowledge of a breach, IT professionals cannot react to limit the damage and attackers may have months to explore an organization’s network and steal critical data before being detected.
Organizations Must Move to an Active, Data and Analytics-Driven Approach
In light of high profile and costly security breaches, IT professionals are increasingly focused on developing comprehensive security programs to better protect their organizations against attacks. While prevention-based approaches can alert IT professionals to potentially suspicious activity, the data generated is often raw and in “machine form,” making it difficult for an organization to develop actionable insights that reflect a real-time understanding of the organization’s assets, user behavior and the dynamic threat landscape that it faces. Developing these insights has historically been complex and resource intensive, requiring security expertise, data scientists and analytical modeling skills, which many organizations lack. By contrast, active, analytics-driven security approaches require more than just the deployment of technology to prevent breaches. To improve the overall effectiveness of an organization’s cyber security program, an actively-managed approach focuses on analytics and an understanding of risks and threats in context, and facilitates the allocation of security budgets to the specific tools that enable the organization to process and analyze significant amounts of data in real time to quickly identify, understand and react to attacks and breaches as they occur. Through security data and analytics, organizations can recognize behavior patterns associated with breaches, even if the attack vector is completely novel. The organization can then develop and improve its cyber security programs in order to reduce its exposures and better detect and respond to compromises using a holistic approach across the following overall vectors of a security program:
| l | Prevention. Identifying, prioritizing, addressing and reducing risks in a manner that reflects each organization’s unique IT infrastructure as well as the dynamic and evolving threat landscape. |
| l | Detection. Analyzing an organization’s attack surface along with user and attacker behaviors to quickly identify security breaches and facilitate a timely and effective response to cyber attacks. |
| l | Correction. Implementing techniques to remediate high-priority risks both tactically and at the program level. |
89
Table of Contents
The following graphic illustrates the shift that we believe is occurring with respect to how organizations manage their cyber security programs:
Shift to Analytics-Driven, Risk-Based Approach to Cyber Security
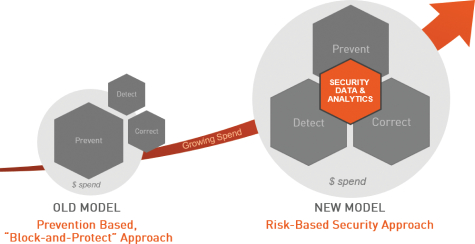
Analytics provides the critical context and prioritization to underlying security data to facilitate effective, informed and proactive decisions that allow for the systemic and dynamic management of security programs across each of these areas. An active, analytics-driven security program can prevent attacks through increased visibility into vulnerabilities, rapidly detecting and responding to compromises and correcting the underlying causes of attacks. This balanced and analytics-focused approach ultimately secures organizations’ environments and reduces both the likelihood of, and risks associated with, cyber attacks better than a traditional “block and protect” security strategy.
Our Market Opportunity
According to Gartner, advanced targeted attacks make prevention-centric strategies obsolete. Securing enterprises in 2020 will require a shift to information- and people-centric security strategies, combined with pervasive internal monitoring and sharing of security intelligence. Accordingly, we believe that our market opportunity is large and growing and will be positively impacted by the ongoing shift in security spending from a traditional passive, “block and protect” approach to an active, analytics-driven approach to cyber security. Gartner, Inc. estimates that by 2020, 60% of enterprise information security budgets will be allocated for rapid detection and response approaches – up from less than 10% in 2014.
Our estimate, based on International Data Corporation data, is that the overall market for security data and analytics is a $12.6 billion opportunity in 2015. Included in our estimates are all or a portion of the markets for Security and Vulnerability Management, Network Intrusion Detection and Prevention, Endpoint Security Suites and Security Services. We believe that our market opportunity will grow as organizations continue to move away from prevention-based solutions and toward analytics-driven security environments.
Benefits of Our Solutions
We are a leading provider of security data and analytics solutions that enable organizations to implement an active, analytics-driven approach to cyber security. Key benefits of our solutions include:
Decreased Risk of Security Breach. Our technology platform and solutions provide IT professionals with a complete view of their dynamic attack surface and automatically assess an organization’s vulnerabilities relative
90
Table of Contents
to the evolving threat landscape. We provide robust and relevant analytics and insight into attacker behaviors and techniques so that IT professionals are able to identify and prioritize risks effectively to reduce risks and ultimately create a more secure IT environment for their organization.
Enhanced Attack Preparedness. Our solutions allow our customers to test their defenses by simulating real-world attacks on their IT environments, using the same techniques and exploits as attackers. Our attack simulation solutions leverage our security data and analytics expertise as well as the insights from our community of thousands of active Metasploit users who provide us with real-time, real-world insight into attacker behavior across the global IT attack surface. By using the same techniques as attackers and simulating real-world attacks on IT environments, we enable our customers to uncover critical gaps in their preventative measures and identify shortcomings in their incident detection and response capabilities.
Fast, Effective and Confident Intrusion Response. Our product offerings can help mitigate the impact of a breach by automatically identifying the root cause of a breach and providing clear and actionable insight into effective mitigation and correction. Our technology automatically monitors each user and IT asset within an organization without the need to build and maintain complicated detection rules or data queries or deploy collection agents. Rather than sending numerous alerts and alarms that become an onslaught of overwhelming and unintelligible data, our solutions provide timely, prioritized and clear analysis and instructions to IT professionals so that they can quickly, confidently and effectively respond to cyber security breaches. Complementing our products, when an organization is breached, our incident response professionals leverage our deep security expertise to help guide customers through critical breach response tactics and implementation of mitigation strategies.
A Continually Relevant and Effective Security Program. We serve as a trusted security advisor to our customers, providing both products and professional services that enable organizations to implement an active, analytics-driven approach to cyber security. Our solutions are continually relevant as they evolve with, and react to, the dynamic threat landscape. Guided by our holistic approach balancing prevention, detection and correction solutions, we provide strategic, technology-agnostic guidance tailored to an organization’s security maturity and optimized to an organization’s IT environment.
Our Competitive Strengths
We have developed the following key competitive advantages that we believe will allow us to maintain a leadership position in the market for security data and analytics:
Automated Data Collection from the Endpoint to the Cloud. We have deep technology expertise in cyber security data collection from 15 years of experience in vulnerability management. Our technology platform provides robust data collection capabilities across multiple data sources, from endpoint information, to user behaviors, to cloud activity. As an organization’s infrastructure evolves and expands, additional data sources are quickly and efficiently integrated into our platform. Further, our platform collects data through an agentless architecture, which allows our platform to amass data from multiple sources quickly and without significant customer installation expertise, while providing greater visibility to IT professionals. We believe that the simplicity of integrating our products into a customer’s IT environment is a key competitive differentiator for us, as it provides a significant advantage for IT professionals who may otherwise be unable to collect and process the necessary data from across their organization.
Customer-Specific Security Analytics. We understand the cyber security risks specific to each of our customer’s organizations and IT environments. Our technology platform collects and organizes data from each customer’s unique IT environment, which allows us to systemically and automatically profile the key risks specific to each customer. By utilizing our powerful, proprietary analytics to assess and understand the context and relationships around users, IT assets and cyber threats within a customer’s environment, we can provide our customers with specific, actionable insights specific to their environments.
91
Table of Contents
Robust and Relevant Knowledge of Attacker Activity. Our database of more than 50,000 known vulnerabilities is continuously expanding through the efforts of our internal security experts and the broader Metasploit community. Our ties to the security research community through our Metasploit framework, an open source project with an active community of contributors and users that was downloaded over 200,000 times in 2014, provides us with real-time insight into new attacks and exploits. The size and accuracy of our exploit database and the speed at which our threat exposure management offerings are updated provides significant value to IT professionals looking to secure their networks in a dynamic and evolving threat environment.
Intuitive Product Design Focused on Speed to Insight. Our solutions are designed for ease-of-use by IT professionals. Our underlying technology platform can easily become part of our customers’ operational fabric without requiring internal expertise in systems integration, data science or data scripting. Our solutions are designed to abstract the powerful underlying capabilities of our security data and analytics platform so that users interact with a simple, elegant interface. We believe that this clean user interface and intuitive design of our products differentiate Rapid7 products from the competition and enables our customers to develop actionable insights quickly and with limited training. We believe that our solutions are resource efficient for our customers and provide them with a fast time-to-value, which makes it easy for organizations to understand the benefits of an active, analytics-driven approach to cyber security.
Deep Security Domain Expertise Across Technology, Operations and People. We leverage our deep domain expertise in security data and analytics to better serve our customers, who frequently have limited ability to carry deep expertise in-house. We offer security advisory services to help customers assess the quality of their security programs and implement changes to make them more effective and cost efficient. We also offer incident detection and response services to help customers find and respond to attacks and compromises that they may be missing on their own. Ultimately, we serve as a trusted security advisor to our customers, encompassing a powerful combination of technology, services and operations expertise to support our customers’ success in managing their cyber security exposure. We believe that this differentiates our offerings, resulting in strong customer retention and our ability to expand our share of our customers’ security spending over time.
User Behavior Analytics. We believe that our user-centric approach to analytics is a key differentiator of our technology platform and offerings. Our software solutions automatically create a behavior profile for each user in a customer’s IT environment. We compare these profiles against dynamic attacker behavior profiles to distinguish normal user behavior from suspicious behavior and incorporate additional data about how systems are likely to respond when under real-world attack. Within our technology platform, our prioritization engine triangulates on the most important data to determine potentially compromised user credentials and reduce false signals and alerts. These powerful user-centric analytics allow IT professionals to make informed and proactive decisions.
Our Growth Strategy
Our mission is to deliver security data and analytics that revolutionize the practice of cyber security. Key elements of our growth strategy include:
Drive New Customer Additions. We believe that most organizations with IT infrastructure would benefit from our products and services, regardless of size or industry, and we have a significant opportunity to increase our penetration across these organizations. We have principally sold our products and services through our direct inside sales team and recently augmented our sales capabilities with a direct field sales team. In 2014, we made a significant investment in our sales organization, growing our headcount by 31% and our total net number of customers by 1,000, or 37%. We intend to continue to invest in building our global sales and go-to-market organizations.
Increase Customer Economics and Success. Our customer base includes more than 3,900 customers, as of March 31, 2015. We believe that these customers provide us with a significant opportunity to drive incremental sales by both selling larger volumes of the offerings that a customer is already purchasing from us and cross
92
Table of Contents
selling other offerings from our portfolio to these customers. For example, customers acquired in 2011 have spent, in the aggregate, 2.4 times their initial 2011 spend with us through 2014, which we believe reflects both our strong renewal rates and our ability to drive upsells and cross-sells since our license agreements with a majority of these customers are perpetual in nature and therefore not subject to renewal. We believe that we currently only capture a percentage of the total cyber security budgets of our enterprise customers and we believe that they will increase their spending with us as they continue to shift their programs to security data and analytics-centric strategies. We have a dedicated customer success team focused on engagement and education to drive customer loyalty and increased purchases of our solutions.
Continue to Expand Internationally. In 2014, we generated 12% of our revenue from customers outside of North America, while 54% of the total cyber security market is outside of North America, according to a report by Frost & Sullivan. We believe that cyber attacks are increasingly global in nature and that organizations globally are increasingly shifting to an active, data and analytics-driven approach to cyber security. We will continue to increase our international sales, service and support organizations to target additional sales across Europe and Asia and will also continue to expand our number of channel partners internationally.
Continue to Innovate with Our Products and Technology Platform. We plan to build upon our current performance and technology leadership in security data and analytics to enhance our technology platform and product capabilities. For example, in early 2014 we launched our cloud-based UserInsight product as part of our incident detection and response offering, which builds on our data collection and analytics platform and our deep understanding of attacker behavior, to provide organizations with actionable insights into security incidents.
Serve as the Hub for Cyber Security. Our robust and comprehensive data collection capabilities, deep understanding of the attacker, analytics-driven approach and industry leadership through our Metasploit community position us to fundamentally change the way that organizations approach cyber security. Moreover, our technology platform was developed with open application program interfaces, or APIs, to allow other developers to access the security data that we collect and the powerful analytics that we provide. We expect to continue to offer new analytics-based solutions for cyber security operations and that third-party application developers will continue to leverage our data collection and analytics capabilities.
Our Security Data and Analytics Platform
Our technology platform is at the core of our security data and analytics product offerings. The platform was built using our extensive experience in collecting and analyzing data to enable our customers to create and manage active, analytics-driven cyber security programs. There are two fundamental and competitively differentiating capabilities of our technology platform: (1) the breadth and depth of data that we collect and (2) the powerful analytics, and resulting correlation and context, that we apply to the data. Our robust data collection architecture supports gathering a wide swath of organizational and environmental data from endpoints to the cloud, including key data about user-specific behavior. Further, by using agentless data collection architecture, we can provide IT professionals with seamless integration and automatic visibility into their dynamic and rapidly-expanding attack surfaces. By utilizing our powerful, proprietary analytics to assess and understand the context and relationships around users, IT assets and cyber threats within a customer’s environment, we can provide our customers with specific, actionable insights.
93
Table of Contents
The Rapid7 Security Data and Analytics Platform
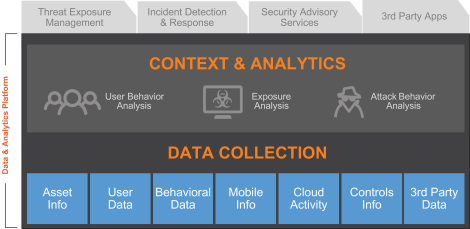
Our technology platform was architected from inception to be secure, reliable, scalable and extensible, enabling both us and third-party developers to create and add new applications that leverage our powerful data collection and analytics competencies. The design and development of our security data and analytics platform includes the following key attributes:
Holistic Dataset for Managing Cyber Security. Our platform collects information from multiple sources to provide a holistic view across an organization’s ecosystem from network and endpoint data, to enterprise cloud data, to user information. We collect data from the following sources: cyber security assets such as firewalls, intrusion detection systems, or IDS, intrusion prevention systems, or IPS, identity and access management, or IAM, and security information and event management, or SIEM; users; endpoints such as computers, mobile and connected devices and servers; applications; cloud activity; IT environment permissions, policies and controls; and third parties, such as cloud-based email and business productivity solution providers.
Robust Platform and Customer Data Security. Our technology platform was designed to provide a secure environment for both our data and that of our customers. We deploy a variety of technologies and industry-leading practices such as physical and logical customer data segregation, network segmentation, audited and monitored access level controls, data anonymization and separated development-staging-production environments to help ensure that the data collected from a customer’s environment remains proprietary and secure, including encrypting data when appropriate. Further, we regularly run penetration tests of our platform.
Agentless Architecture and Automated Analytics. We have designed our solutions to be easy to deploy with minimal manual input from our customers. We developed our platform utilizing an agentless data collection architecture, which enables rapid and seamless integration of our products into our customers’ IT environments and provides IT professionals with instant visibility into their dynamic and rapidly-expanding attack surfaces. Proprietary analytics are embedded in our solutions and are continuously curated based on the latest security research such that organizations are not required to develop customized detection rules or write scripts to yield actionable insights.
Enterprise-Grade Scalability. Our technology platform provides a high level of horizontal scalability. We leverage on premise deployment models and Amazon Web Services, or AWS, to achieve a high degree of redundancy, fault tolerance and cost-effective operations. We are currently deployed in two AWS regions, with plans to add additional geographies. Our automated deployment technologies enable us to add new AWS instances or additional services rapidly. Within our platform, we use a variety of SQL and NoSQL technologies to enable broad scalability, while keeping each customer’s data entirely separate. Our infrastructure architecture
94
Table of Contents
is designed to process large amounts of data and easily incorporate new data sources, including on premise, cloud and mobile. Our platform is designed to support customers with large numbers of users or with geographically dispersed environments, and we have scaled to meet the needs of customers with over 1.0 million active assets and 50,000 active users.
Extensible Modern Platform. Our technology platform provides a rich set of APIs and services that enable customers, partners and developers to import and export data and utilize our analytics capabilities. This allows us to easily integrate with other security tools in the customer’s environment and also enables customers to build bespoke applications and analysis on top of the data that we gather.
Our Products and Services
We offer products and professional services that leverage our security data and analytics platform. We typically engage with customers based on their current needs, offering three broad solution groups: threat exposure management, incident detection and response and security advisory services. An organization that has just detected that it has been breached, for example, may initially purchase our incident detection and response products and services whereas a customer with a new chief information security officer looking to gain insight into the organization’s security environment may initially purchase our threat exposure management solutions, and a customer whose board of directors has mandated a security review may initially purchase our security advisory services.
Our threat exposure management solutions reflect our evolution and enhancement of traditional vulnerability management tools to encompass a broader set of data, including real-world threat information, and analytics that facilitate systematic remediation. By providing IT professionals with a complete view of their changing attack surface and an automated way to assess the evolving threat landscape, our customers can implement a data and analytics-driven cyber security program to minimize high-priority risks.
Our incident detection and response solutions offer customers a combination of product-based analytics as well as expert services to help detect attackers and respond to attacks once they are discovered.
We offer our products through a combination of perpetual and term software licenses, cloud-based subscriptions and managed services offerings. All of our products have been designed with an intuitive user interface, focused on ease-of-use and fast time-to-value for our customers.
Our security advisory services help organizations implement and manage an analytics-driven security approach by looking strategically and holistically at their security programs and providing them with advice related to prevention, detection and correction. We believe that our professional services drive incremental customer adoption and usage of our products.
95
Table of Contents
Rapid7’s Products and Services Offerings
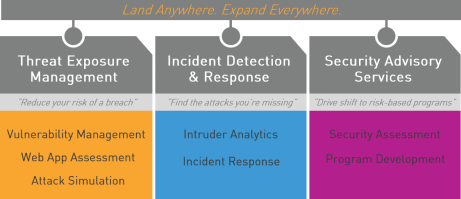
Threat Exposure Management
Our threat exposure management solutions help organizations systematically and dynamically manage cyber vulnerabilities, allowing them to understand their exposures and prevent attacks through insights into their IT environments. In building our threat exposure management offerings, we brought security data and analytics capabilities to our core competencies around vulnerability management to drive insights into customer exposures, management and remediation. Our threat exposure management offerings are available to customers through perpetual and term software licenses with content subscriptions that provide our customers with real-time access to the latest vulnerabilities and exploits, and also as a managed service. Additionally, we provide deployment support and training.
Our threat exposure management offerings include:
Nexpose
Nexpose enables customers to assess and remediate their overall exposure to cyber risk across their increasingly complex IT environments. This includes analyzing vulnerabilities, detecting security misconfigurations and determining the effectiveness of controls across an IT environment. The key features of Nexpose include: automatic vulnerability updates; exception management, which allows organizations to track when risk is knowingly introduced into the IT environment; executive remediation and security testing reporting; interactive charting; scan scheduling and alerting; RealContext classification, which allows organizations to apply business context to threats including by identifying where sensitive data is stored; web application, virtual, unified vulnerability, perimeter and discovery scanning; policy compliance and management, including with standards such as PCI and HIPAA; report and scan customization; Open API and third-party integrations; advanced report templates and uploading; dynamic discovery; user role customization; integrated vulnerability validation; controls effectiveness testing; and prioritized guidance based on customized threat models. We offer five editions of Nexpose including Ultimate, Enterprise, Consultant, Express and Community, each of which has varying combinations of features and is geared to the requirements of different organizations, based on size and need.
Metasploit
Metasploit is an industry-leading penetration testing software, developed on an open source framework. Metasploit can be used to safely simulate attacks on an organization’s network in order to uncover vulnerabilities before they are exploited by cyber attackers and assess the effectiveness of an organization’s existing defenses, security controls and mitigation efforts. The key features of Metasploit include: wizards for standard baseline audits; task chains for automated custom workflows; modules for discrete tasks, such as network segmentation testing; dynamic payloads, designed to evade leading antivirus solutions; closed-loop vulnerability validation to
96
Table of Contents
prioritize remediation; phishing awareness management and spear phishing; web-based interface; and integrations via remote APIs. We sell two editions of Metasploit: Metasploit Pro is our advanced penetration testing and security program solution targeted at penetration testers and IT security teams and Metasploit Express is our baseline penetration testing product targeted at IT generalists. Metasploit Pro integrates with Nexpose to enable IT professionals to prioritize remediation efforts and understand the impact of an attack before it happens. We also offer a free community version of Metasploit for small companies and students, as well as the open source framework, which is geared toward developers and security researchers.
AppSpider
AppSpider is a comprehensive dynamic application security testing solution that continuously analyzes web applications for security vulnerabilities and enhances organizations’ ability to effectively reduce IT security risk. The key features of AppSpider include: a universal translator to enable IT professionals to analyze complex applications, including rich internet applications built using AJAX or GWT and web services such as REST and JSON; customized attack simulation capabilities that allow IT professionals to automatically test complex business workflows such as shopping carts; scanning automation; live vulnerability reports and attack replay, which allows IT professionals to replay vulnerabilities in real time in order to verify that vulnerabilities are exploitable and that successful remediation has occurred; continuous site monitoring, which detects changes in application ecosystems and triggers a re-scan according to configurable settings; and integration with protection technologies to automatically generate web application firewalls, or WAFs, custom rules that help to protect vulnerable applications while the vulnerabilities are being remediated. AppSpider supports most leading WAFs, including F5, Sourcefire and Imperva. AppSpider is offered through perpetual and term software licenses, on a cloud-based subscription basis or as a managed service.
Incident Detection and Response
Our incident detection and response solutions help IT professionals detect and respond quickly and effectively to cyber attacks. These solutions leverage our unique understanding of the attacker and our proprietary risk-driven behavioral analysis to detect attacks. Our incident detection products are available to customers as a cloud-based subscription or as a managed service. We also provide incident response services to support our product offerings and provide customers with critical support and expertise in the wake of a breach.
Our incident detection and response offerings include:
UserInsight
UserInsight is a cloud-based offering that enables customers to detect intruders quickly, reducing the probability that an incident becomes a breach. The product collects data from across an organization’s IT environment, including network data, endpoint data and information from mobile and other connected devices and cloud services. UserInsight uses heuristic and behavioral analysis to create a behavioral profile for each user that can be used to identify anomalous activity, such as lateral movement across the network, which may suggest that an attacker is present. UserInsight is designed to identify attacks such as those launched with compromised credentials as well as the use of common attack tools that other monitoring tools can miss. UserInsight also assists in compliance by highlighting for IT professionals risky user practices such as shared accounts and unapproved cloud-based applications within an IT environment. Once an incident has been identified, UserInsight allows IT professionals to perform a rapid and targeted review of relevant security data, going back months or years, so that a streamlined and effective response plan can be implemented quickly and efficiently.
Incident Response Services
Our incident response services give our customers access to our industry-leading security experts and experience, enabling customers to accelerate incident investigation and containment. Our incident response professionals collaborate with an organization’s in-house IT professionals on all stages of incident response from analysis and detection through containment, remediation and cleanup.
97
Table of Contents
Security Advisory Services
Our security advisory services help customers transform their organizations’ security programs to be relevant, actionable and sustainable through a data and analytics-driven cyber security program. Our security advisory services offerings include Cyber Security Maturity Assessment, Incident Response Program Development, Security Program Development, Security Assessment, Security Awareness Training and Threat Modeling. Customers can take control of their organizations’ security with help from our seasoned security professionals who have deep experience building and managing security programs, with expertise in vulnerability management, fraud detection, threat intelligence and incident response.
Our security advisory services enhance our ability to serve as a trusted advisor in assisting organizations to think proactively about IT security and implement strategic, analytics-driven security strategies. We believe that our role as trusted advisor helps drive customer success and loyalty and further usage of our products.
Our Customers
Our customer base has grown from approximately 1,750 customers at the end of 2011 to more than 3,900 customers as of March 31, 2015, in more than 90 countries, including more than 300 of the organizations in the Fortune 1000. We provide products and services to customers of varying sizes, including enterprises, non-profit organizations, educational institutions and government agencies. 61% of our revenue in 2014 was generated by large enterprises, which we define as organizations that have either annual revenue greater than $1.0 billion or more than 2,500 employees, and the balance was generated by middle-market businesses. Our customers span a wide variety of industries including technology, energy, financial services, healthcare and life sciences, manufacturing, media and entertainment, retail and professional services, with customers in the technology industry representing 15% of our revenue for the three months ended March 31, 2015. We believe that our business has low revenue exposure to individual customers. While our top five customers by revenue in 2014 were each party to multi-year aggregate deals with us ranging in value from $0.8 million to $2.2 million, each of these customers accounted for less than 1% of our total 2014 revenue, with 2014 revenue for each of these individual customers being between $0.5 million and $0.7 million.
Rapid7 Case Studies
Multi-national Software Corporation
Challenge: A Fortune Global 500 enterprise software company was having performance issues with a competitor’s vulnerability management solution due to its failure to scale across the organization, weak reporting features and static deployment. Reports generated by this solution took IT professionals hours each day to review, as they did not prioritize network vulnerabilities based on risk and were therefore ineffective for remediation efforts.
Solution: During a proof of concept deployment, Nexpose demonstrated that it could yield valuable operational cost savings with automated scanning, actionable reporting and dynamic asset grouping. Nexpose saved IT professionals approximately 40 hours per month, required fewer scan engines and enabled faster, more effective remediation. The customer made an initial purchase of Nexpose Enterprise to scan fewer than 10,000 internet protocol addresses, or IPs, in 2014 and thereafter made an additional purchase of Nexpose to scan more than 100,000 additional IPs, Metasploit Pro and Security Advisory Services. More recently, the customer purchased Nexpose to scan additional IPs and UserInsight. Over a two year period, the customer’s investment in Rapid7 products and professional services grew to 5.6 times the amount of the original purchase.
Major State University
Challenge: A major state university was using a competitor’s vulnerability management solution, which did not offer flexible reporting or risk analytics, and needed to prioritize vulnerabilities and execute effective remediation. The customer also struggled with the fact that it received thousands of unintelligible alerts from its SIEM, IDS and firewall logs.
98
Table of Contents
Solution: The customer initially purchased Nexpose to scan 15,000 IPs and Metasploit Pro in 2012 based on the strength of Nexpose’s analytic capabilities. Nexpose’s analytics allowed the IT department to streamline operations by focusing on high-impact actions to reduce risk effectively. Nexpose’s executive summary reports enabled more effective communication between IT professionals and the university’s senior management, making it easier to show progress and get buy-in for security initiatives. In late 2014, the customer also purchased UserInsight based on its ability to monitor endpoints, correlate users and actions and flag suspicious activity such as a user logging in from multiple countries within a suspiciously short time span. Since its initial purchase, the customer quadrupled its investment in Rapid7 products. In that time, it has reported a 32% reduction in vulnerabilities and reduced incident investigation time from two to three business days to approximately 60 seconds.
Fortune 500 Financial Services Company
Challenge: A Fortune 500 financial services company needed to improve its security team’s level of visibility into its large network and overall security posture.
Solution: In 2010, the customer bought Metasploit to conduct penetration tests. In 2012, it added Nexpose to scan 250,000 IPs and, in 2013, purchased training services in order to derive maximum value from Nexpose. In 2014, the customer purchased Nexpose to scan additional IPs and engaged our Security Advisory Services team. Over the course of the five-year relationship, the customer’s investment in Rapid7 products and professional services grew to 65.8 times the amount of its original spend.
Leading Sales and Marketing Agency
Challenge: A leading outsourced sales and marketing agency needed to effectively manage and reduce the risk associated with its highly mobile, geographically distributed workforce. It sought a solution with advanced analytics that would enable the security team to find and investigate attacks, gain actionable insight into potentially risky user behavior, effectively identify when an account may have been compromised and shorten the time needed for investigation of incidents.
Solution: In 2013, the customer purchased Nexpose and Metasploit to make it easier to identify, prioritize and remediate vulnerabilities in its IT environment. Later that year, the customer purchased UserInsight to monitor activity from endpoints to the cloud. By integrating Nexpose and UserInsight, the customer was able to appreciate how vulnerabilities impact users and was able to better prioritize remediation efforts. The customer now leverages UserInsight on a daily basis, and has reported that incident investigation time has been reduced by a factor of 20. Rapid7’s products give the customer’s IT professionals the ability to quickly and easily see where a user has been and what applications the user has been running. The customer’s total investment in Rapid7 products has grown to two times the amount of its original purchase.
Leading Provider of Integrated Payment Solutions
Challenge: A leading provider of integrated payment solutions was dissatisfied with the level of support and attention that it was receiving from one of our competitors. It began looking for a vulnerability management solution that could deliver greater business value and provide a better customer support experience.
Solution: The customer initially purchased Metasploit in 2011 and our professional services team was engaged to develop an understanding of the customer’s key business drivers and reporting needs. The customer thereafter purchased Nexpose and engaged our professional services team to perform a penetration test. The customer leverages Nexpose’s customized reporting as a key feature of its PCI compliance efforts. The customer was also able to gain benefits from the integration of Nexpose and Metasploit, such as streamlined vulnerability validation workflow. The customer’s total investment in Rapid7 products has grown to 18 times the amount of its original purchase.
99
Table of Contents
Rapid7’s Community
Our online community provides us with a rapidly growing network of active users and influencers who promote the usage of our software, identify cyber risks and provide technical support to each other. Our community includes paid customers of our software, users of our free community edition and open source Metasploit framework and security researchers and contributors to our Metasploit framework, which is used to simulate attacks and test an organization’s defenses against real-world threats.
The Metasploit project has an active community of contributors and users and was downloaded over 200,000 times in 2014. This online security community provides us with a robust and rapidly growing network of active users and influencers who promote the usage of our software. Security researchers contribute modules to the Metasploit framework that serve as a resource about real-world attacker techniques. The community also provides us with near real-time visibility into new cyber attacks as they occur and a deep understanding of attacker behaviors. In April 2015, the Metasploit framework ranked in the top 10 of the more than 45,000 active Ruby open source projects based on the number of project forks, according to GitHub.
We also operate a global scanning project that scans 3.7 billion assets across the internet each week and makes the raw data available to the public for research, decision making and vulnerability prioritization.
Technology Alliance Partnerships
Our security data and analytics platform has the ability to leverage a broad partner ecosystem with over 50 technology platform integrations. We allow other developers to access the security data that we collect and the powerful analytics that we provide. We also built our platform with the ability to leverage APIs and data collection from other technologies. This allows us to integrate with other IT and security technologies that our customer may already have in place in three primary ways.
| l | Data Collaboration. Our data collaboration integrations provide two-way data sharing to enhance our platform value. For example, we can ingest data from an existing SIEM technology and also share our analysis of user behavior activity with the SIEM technology. |
| l | Data Workflow. Our data workflow integrations enable IT security integration to streamline the process of correction and improve efficiencies. For example, we make remediation data from our platform available to IT ticketing systems in order to drive operational efficiencies and tracking of IT performance. |
| l | Data Ingestion. Our data ingestion integrations enhance our analytical capabilities by funneling increased volumes of security data to our platform. For example, we ingest firewall data into our platform, which allows us to better understand user activity in the context of attacks. |
We believe that these integrations with our technology alliance partners enhance the value of our platform to our customers.
Sales and Marketing
Our sales and marketing organizations collaborate to create brand preference, efficiently and effectively generate leads, build a strong sales pipeline and cultivate customer relationships to help drive revenue growth. Our go-to-market strategy consists of a strong thought-leadership program, digital marketing engine and a diversified sales organization designed to efficiently sell to organizations of all sizes.
Sales
We sell our products and services through our direct inside sales team, a direct field sales team established and significantly expanded in 2014 and indirect channel partner relationships. Our global sales teams focus on both
100
Table of Contents
new customer acquisition and up-selling and cross-selling additional and new offerings, respectively, to our existing customers. Our sales teams are organized by geography, consisting of the Americas; Europe, the Middle East and Africa, or EMEA; and Asia Pacific, or APAC, as well as by target organization size. Our inside sales team focuses typically on small and middle-market transactions, while larger or more complex transactions are generally handled by our globally distributed direct field sales teams. Our highly trained sales engineers help define customer use cases, manage solution evaluations and train channel partners.
We maintain a global channel partner network that complements our sales organization. Our channel partner network expands our geographic sales reach by providing language support and broader distribution capabilities, particularly in key markets such as EMEA, APAC and Latin America. Our channel partners also provide us with additional leverage by assisting in closing customer transactions as part of larger security purchases, sourcing new prospects and securing maintenance renewals. Our sales force works directly with, and are involved in sales to, substantially all of the end customers of our channel partners and we sometimes engage a channel partner solely to assist with finalizing a purchase, for example, in the event a customer is working on broader software initiatives with that channel partner.
We intend to invest in our international sales organization to continue to drive market penetration. We also have a dedicated sales team focused on government customers, which covers U.S. federal, state and local government entities.
Marketing
We focus our marketing efforts on increasing the strength of the Rapid7 brand, communicating product advantages and business benefits, generating leads for our sales force and channel partners and driving product adoption. We deliver targeted content to demonstrate our thought leadership in security and use digital advertising methods to drive downloads of our free community and trial software, which deliver opportunities to our sales organization. We engage with existing customers to provide community-based education and awareness and to promote expanded use of our software within these customers. We work with our own researchers, as well as the broader security community, to share important information about vulnerabilities and threats. We share that research through our active online community, social media and traditional public relations. In addition, we host regional and national events to engage both customers and prospects, deliver product training and foster community collaboration.
Research and Development
We invest substantial resources in research and development to enhance our core technology platform and products, develop new end market-specific solutions and applications, and conduct product and quality assurance testing. Our technical and engineering team monitors and tests our products on a regular basis, and we maintain a regular release process to refine, update, and enhance our existing products. Research and development expense totaled $17.8 million, $21.4 million, $25.6 million and $6.4 million for 2012, 2013, 2014 and the three months ended March 31, 2015, respectively.
Our Competition
The market for cyber security solutions is highly fragmented, intensely competitive and constantly evolving. We compete with an array of established and emerging security software and services vendors. With the introduction of new technologies and market entrants, we expect the competitive environment to remain intense going forward. Our competitors include: vulnerability management and assessment vendors, including Qualys and Tenable Network Security; diversified security software and services vendors, including McAfee (a subsidiary of Intel), IBM and HP; security services specialists, including Mandiant (a subsidiary of FireEye); and providers of point solutions that compete with some of the features present in our solutions.
101
Table of Contents
We compete on the basis of a number of factors, including:
| l | product functionality; |
| l | breadth of offerings; |
| l | performance; |
| l | brand name, reputation and customer satisfaction; |
| l | ease of implementation, use and maintenance; |
| l | total cost of ownership; and |
| l | scalability, reliability and security. |
We believe that we compete favorably with respect to all of these factors and that we are well positioned as a leading provider of cyber security and data analytics products and professional services.
Intellectual Property
Our future success and competitive position depend in part on our ability to protect our intellectual property and proprietary technologies. To safeguard these rights, we rely on a combination of patent, trademark, copyright and trade secret laws and contractual protections in the United States and other jurisdictions.
As of March 31, 2015, we had four issued patents and 15 patent applications pending in the United States relating to our products. We cannot assure you that any patents will issue from any patent applications, that patents that issue from such applications will give us the protection that we seek or that any such patents will not be challenged, invalidated, or circumvented. Any patents that may issue in the future from our pending or future patent applications may not provide sufficiently broad protection and may not be enforceable in actions against alleged infringers.
We have registered the “Rapid7,” “Nexpose” and “Metasploit” names and logos in the United States and certain other countries. We have registrations and/or pending applications for additional marks in the United States and other countries; however, we cannot assure you that any future trademark registrations will be issued for pending or future applications or that any registered trademarks will be enforceable or provide adequate protection of our proprietary rights.
We also license software from third parties for integration into our offerings, including open source software and other software available on commercially reasonable terms. We cannot assure you that such third parties will maintain such software or continue to make it available.
We are the registered holder of a variety of domestic and international domain names that include rapid7.com and metasploit.com, as well as similar variations on those names.
In order to protect our unpatented proprietary technologies and processes, we rely on trade secret laws and confidentiality agreements with our employees, consultants, channel partners, vendors and others. Despite our efforts to protect our proprietary technology and trade secrets, unauthorized parties may attempt to misappropriate, reverse engineer or otherwise obtain and use them. In addition, others may independently discover our trade secrets, in which case we would not be able to assert trade secret rights, or develop similar technologies and processes. Further, the contractual provisions that we enter into may not prevent unauthorized use or disclosure of our proprietary technology or intellectual property rights and may not provide an adequate remedy in the event of unauthorized use or disclosure of our proprietary technology or intellectual property rights.
102
Table of Contents
If we become more successful, we believe that competitors will be more likely to try to develop solutions and services that are similar to ours and that may infringe our proprietary rights. It may also be more likely that competitors or other third parties will claim that our platform infringes their proprietary rights.
Patent and other intellectual property disputes are common in our industry and we have been involved in such disputes from time to time in the ordinary course of our business. Some companies, including some of our competitors, own large numbers of patents, copyrights and trademarks, which they may use to assert claims against us. Third parties may in the future assert claims of infringement, misappropriation or other violations of intellectual property rights against us. They may also assert such claims against our customers or channel partners whom we typically indemnify against claims that our solutions infringe, misappropriate or otherwise violate the intellectual property rights of third parties. As the numbers of products and competitors in our market increase and overlaps occur, claims of infringement, misappropriation and other violations of intellectual property rights may increase. Any claim of infringement, misappropriation or other violation of intellectual property rights by a third party, even those without merit, could cause us to incur substantial costs defending against the claim and could distract our management from our business.
Government Regulation
Like other U.S.-based IT security products, our products are subject to U.S. export control laws and regulations, specifically the Export Administration Regulations, or EAR, U.S. economic and trade sanctions regulations, and applicable foreign government import, export, and use requirements. Certain of our products are subject to encryption controls under the EAR due to the nature of the product and/or its use or incorporation of encryption functionality. Under the encryption controls in the EAR, applicable products may only be exported outside of the United States with required export authorizations, including by a license, a license exception or other appropriate government authorizations. To qualify for this authorization, developers of encryption products are generally required to file an encryption registration, and in some cases subject their encryption product to a one-time technical review. In addition to the restrictions under the EAR, U.S. export control laws and economic sanctions prohibit the export of certain products and services to countries, governments, entities or persons subject to U.S. embargoes or trade sanctions.
We believe that we have completed the necessary technical reviews of the products and services that we currently export, but new products that we acquire or develop may require technical review before we can export them. In addition, some of our products are subject to an export license requirement when shipped to certain foreign government end users. We would need to apply for these individual licenses on a case-by-case basis, the acceptance and granting of which may be issued at the discretion of the U.S. Department of Commerce.
We previously deployed certain of our products prior to obtaining the required export authorizations under the EAR. In addition, we are aware of exports of certain of our software products to persons and organizations in countries that are the subject of U.S. embargoes. We initiated and filed a voluntary self-disclosure with the U.S. Department of Commerce’s Bureau of Industry and Security, or BIS, in September 2014 regarding our previous failure to obtain required export authorizations under the EAR for these historical downloads, as well as exports to embargoed countries, namely Cuba, Iran, Sudan and Syria. We filed a supplement to the voluntary disclosure to BIS in March 2015 with additional information regarding unauthorized apparent historical exports of software to certain foreign government end users. Also in March 2015, we filed a voluntary self-disclosure with the U.S. Department of Treasury’s Office of Foreign Assets Control, or OFAC, concerning exports of free and trial versions of software to Cuba, Iran, Sudan and Syria. As these transactions involved free downloads of our software, we did not derive any revenue from such transactions. On May 22, 2015, OFAC determined not to pursue a civil monetary penalty against us and issued us a Cautionary Letter to resolve our voluntary self-disclosure regarding the free downloads in embargoed countries. The voluntary self-disclosure submitted to BIS currently remains under review and we are fully cooperating with BIS. We have also been improving our procedures for screening transactions to ensure compliance with U.S. export control and trade sanctions laws and have restricted the ability of individuals or entities outside of the United States and Canada to download our free Metasploit products absent pre-screening.
103
Table of Contents
In addition, there is currently a multinational effort underway as part of the Wassenaar Arrangement on Export Controls for Conventional Arms and Dual-Use Goods and Technologies, or the Wassenaar Arrangement, to impose additional restrictions on specified intrusion software, which may encompass our commercial Metasploit products. To implement the controls under the Wassenaar Agreement in the United States, on May 20, 2015, BIS published a proposed rule for public comment that would amend the EAR with regard to exports, reexports and transfers (in-country) of specified intrusion software, surveillance items and related software and technology. The proposed rule would establish an export license requirement for intrusion software and surveillance items for all countries other than the United States and Canada. Such proposed modifications to the export regulations applicable to our products could put us at a disadvantage in competing for international sales compared to companies located outside of the United States that would not be subject to these licensing, approval and other requirements. We are evaluating the potential implications of the Wassenaar Arrangement on the commercial versions of Metasploit and plan to submit comments to BIS regarding the proposed rule, which remains subject to public comment, is not currently in effect and may undergo substantial modification before it becomes effective.
Employees
As of March 31, 2015, we had 554 full-time employees, including 117 in product delivery and support, 245 in sales and marketing, 119 in research and development and 73 in general and administrative. As of March 31, 2015, we had 448 full-time employees in the United States and 106 full-time employees internationally. None of our U.S. employees are covered by collective bargaining agreements. We believe our employee relations are good and we have not experienced any work stoppages.
Facilities
Our principal executive offices are located in Boston, Massachusetts, where we occupy a facility of approximately 68,000 square feet. Our lease expires on August 31, 2019. We have additional U.S. offices in Austin, Texas; Cambridge, Massachusetts; Los Angeles, California; and Seattle, Washington. We also have offices in Belfast, United Kingdom; Reading, United Kingdom; Singapore; and Toronto, Canada.
Legal Proceedings
From time to time we may become involved in legal proceedings or be subject to claims arising in the ordinary course of our business. We are not presently a party to any legal proceedings that, if determined adversely to us, would individually or taken together have a material adverse effect on our business, operating results, financial condition or cash flows. Regardless of the outcome, litigation can have an adverse impact on us because of defense and settlement costs, diversion of management resources and other factors.
104
Table of Contents
Executive Officers and Directors
The following table sets forth information concerning our executive officers and directors as of May 31, 2015:
| Name |
Age |
Position(s) | ||||
| Executive Officers |
||||||
| Corey Thomas |
39 | President, Chief Executive Officer and Director | ||||
| Steven Gatoff |
47 | Chief Financial Officer | ||||
| Lee Weiner |
41 | Senior Vice President, Products & Engineering | ||||
| Richard Moseley |
49 | Senior Vice President, Global Sales | ||||
| Michael McKee |
45 | Senior Vice President, Services & Customer Success | ||||
| Non-Employee Directors |
||||||
| Michael Berry |
52 | Director | ||||
| Benjamin Holzman |
40 | Director | ||||
| Timothy McAdam |
47 | Director | ||||
| Alan Matthews |
57 | Chairman of the Board of Directors | ||||
| J. Benjamin Nye |
49 | Director | ||||
| John Sweeney |
57 | Director | ||||
| Christopher Young |
43 | Director | ||||
Executive Officers
Corey Thomas has served as our President and Chief Executive Officer and as a member of our board of directors since October 2012. From November 2008 to September 2012, Mr. Thomas held various other roles at Rapid7, including serving as Chief Operating Officer. From March 2007 to October 2008, Mr. Thomas served as Vice President of Marketing at Parallels, Inc., a virtualization technology company, and from June 2002 to February 2007, Mr. Thomas held various roles at Microsoft, including Group Project Manager of the Microsoft Server and Tools division, launching the worldwide availability of SQL Server 2005 and steering product planning for Microsoft’s data platform. Prior to that, he was a consultant at Deloitte Consulting from July 1998 to October 2000. Mr. Thomas received a B.E. in electrical engineering and computer science from Vanderbilt University and a M.B.A. from Harvard Business School. Our board of directors believes that Mr. Thomas’ financial and business expertise and his daily insight into corporate matters as our Chief Executive Officer qualify him to serve on our board of directors.
Steven Gatoff has served as our Chief Financial Officer since February 2013. Prior to joining Rapid7, Mr. Gatoff was Senior Vice President and Chief Financial Officer at iPass Inc., a cloud-based mobility management platform, from May 2009 to February 2013. Previously, Mr. Gatoff has held financial executive leadership roles at United Online, Inc., a provider of internet consumer products and services, Sterling Commerce, a software company, and VeriSign, Inc., a provider of network infrastructure and security offerings. Mr. Gatoff also spent nearly a decade in investment banking with Morgan Stanley, Credit Suisse First Boston and Bear Stearns. He is a CPA and received a B.S. in business administration and accounting from the University of Vermont and a M.B.A. from Columbia University.
Lee Weiner has served as our Senior Vice President, Products & Engineering since March 2013. From June 2012 to March 2013, Mr. Weiner served as our Vice President of Products. From October 2008 to June 2012, Mr. Weiner served as Vice President, Products at LogMeIn, Inc., a provider of cloud-based remote connectivity solutions. Previously, Mr. Weiner held leadership roles at software security firms including Netegrity, Inc., IMlogic, Inc. and Symantec Corporation. Mr. Weiner received a B.A. in communications from the University of Massachusetts.
105
Table of Contents
Richard Moseley has served as our Senior Vice President, Global Sales since January 2015. From August 2013 to December 2014, Mr. Moseley served as our Vice President of International Sales. Prior to joining Rapid7, he was the Vice President, Data Protection for Europe, the Middle East and Africa and Asia Pacific at Quest Software, an enterprise application management solutions provider, from July 2000 to June 2013. He received a B.Sc. double degree in law and accounting from Oxford Brookes University in England.
Michael McKee has served as our Senior Vice President, Services & Customer Success since January 2015. From June 2013 to December 2014, Mr. McKee served as our Senior Vice President for Services and Support. From July 2012 to May 2013, Mr. McKee was Senior Vice President, CAD Operations & Strategy, at PTC, Inc., a software company. Previously, Mr. McKee also worked at HighWired.com, an e-commerce solution provider, Broadview Associates, Ltd., an investment bank, McKinsey & Company and Goldman Sachs. Mr. McKee received a B.A. in economics and politics from Princeton University and a M.B.A. from Harvard Business School.
Non-Employee Directors
Alan Matthews has served as the chairman of our board of directors since July 2008. Mr. Matthews co-founded Rapid7 in July 2000 and was employed in various capacities at Rapid7 until October 2009, including as our Chief Executive Officer from April 2004 to July 2009. Previously, Mr. Matthews was a consultant to the investment banking group at Merrill Lynch, developed mortgage-backed securities software at First Boston, developed a computer graphics lab at HBO/Time Warner and served as a programmer and designer for the VM operating system at IBM from 1976 to 1979 in the United Kingdom. Our board of directors believes that Mr. Matthew’s deep understanding of our products and technology and his role as a co-founder of our company qualify him to serve on our board of directors.
Michael Berry has served as a member of our board of directors since November 2012. Since November 2014, Mr. Berry has served as the Executive Vice President and Chief Financial Officer of Informatica Corporation, a provider of data integration software. From October 2013 to October 2014, Mr. Berry served as Chief Financial Officer of IO Data Centers. Previously, Mr. Berry served as Executive Vice President and Chief Financial Officer of SolarWinds, Inc., a developer of information technology infrastructure management software, from November 2011 to October 2013, after joining SolarWinds as Senior Vice President and Chief Financial Officer in March 2010. Mr. Berry was also Executive Vice President, Finance and Accounting, and Chief Financial Officer of i2 Technologies, Inc., a supply chain management software and services company, from August 2005 to January 2010. Prior to i2, Mr. Berry held various positions at The Reynolds and Reynolds Company, Inc., an automobile dealer support company, including as Senior Vice President of Solutions Management, Development and Operations and Senior Vice President of Services. Mr. Berry received a B.A. in finance from Augsburg College and a M.B.A. in finance from the University of St. Thomas. Our board of directors believes that Mr. Berry’s financial expertise and experience in the software and technology industries qualify him to serve on our board of directors.
Benjamin Holzman has served as a member of our board of directors since August 2008. Since July 2007, Mr. Holzman has worked at Bain Capital Venture Partners, LLC, where he currently serves as a Managing Director. Prior to joining Bain Capital Venture Partners, Mr. Holzman was Vice President of Sales Operations at Iron Mountain, a provider of storage and information management. Prior to Iron Mountain, Mr. Holzman was an investor with Fidelity Ventures and a consultant with McKinsey & Company. Mr. Holzman received a B.S.E. in biomedical and electrical engineering from Duke University and a M.B.A. from the MIT Sloan School of Management. Our board of directors believes that Mr. Holzman’s extensive experience with a wide range of technology companies qualifies him to serve on our board of directors.
Timothy McAdam has served as a member of our board of directors since November 2011. Since June 2010, Mr. McAdam has served as a General Partner of Technology Crossover Ventures and has been in the venture
capital industry since 1991. Mr. McAdam received a B.A. in Classics from Dartmouth College and a M.B.A.
106
Table of Contents
from the Stanford Graduate School of Business. Our board of directors believes Mr. McAdam’s expertise as an investor in technology companies qualifies him to serve on our board of directors.
J. Benjamin Nye has served as a member of our board of directors since August 2008. Mr. Nye is a Managing Director and leads the technology and infrastructure investing efforts for Bain Capital Venture Partners, LLC, which he joined in October 2004. Mr. Nye has also served as the Chief Executive Officer of VMTurbo, Inc., a software company that provides virtualization management solutions for control cloud and virtualized environments, since September 2013. From June 2003 until October 2004, Mr. Nye was a Senior Vice President at VERITAS Software Corporation, a software company. Mr. Nye served as the Chief Operating Officer and Chief Financial Officer of Precise Software Solutions, Ltd., an application performance management company, where Mr. Nye joined in January 2000. Mr. Nye has served as a director of SolarWinds since December 2005. He also serves on the boards of directors of several private companies, including AppNeta, AppAssure and VMTurbo. Mr. Nye received a B.A. in government from Harvard College and a M.B.A. from Harvard Business School. Our board of directors believes that Mr. Nye’s financial and business expertise, including his experience in managing and directing technology companies, qualifies him to serve on our board of directors.
John Sweeney has served as a member of our board of directors since May 2010. Since July 2013, Mr. Sweeney has served as the Chief Executive Officer of SevOne, Inc., a network performance management software company. He has also served as an Operating Partner at Bain Capital Venture Partners, LLC since March 2013. Previously, Mr. Sweeney was the Chief Executive Officer at Axeda Corporation, a provider of cloud-based service and software for managing connected products and implementing innovative machine-to-machine applications, from January 2011 to April 2013. Prior to that, Mr. Sweeney was Chief Executive Officer at Apparent Networks, a provider of cloud-based IT performance management services. He attended the Stanford University Executive Program and received a B.S. in management from Bridgewater State College. Our board of directors believes that Mr. Sweeney’s experience in the technology industry qualifies him to serve on our board of directors.
Christopher Young has served as a member of our board of directors since January 2011. He has been the Senior Vice President and General Manager of the Intel Security Group at Intel Corporation since October 2014. Mr. Young joined Intel from Cisco Systems, Inc., where he was Senior Vice President of the Security and Government Group from November 2011 to September 2014. Prior to Cisco, he held executive roles at VMware, Inc., a provider of cloud and virtualization software and services, RSA, an information security company, and America Online, Inc. Earlier in his career, Mr. Young was founder and president of Cyveillance, Inc., an internet monitoring and threat intelligence company, and also spent several years in various advisory positions with Mercer Management Consulting. He received a B.A. in Public Policy from Princeton University and a M.B.A. from Harvard Business School. Our board of directors believes that Mr. Young’s extensive experience in the information security industry qualifies him to serve on our board of directors.
Family Relationships
There are no family relationships among any of our executive officers or directors.
Board Composition
Our board of directors currently consists of eight members. Each director is currently elected to the board of directors for a one-year term, to serve until the election and qualification of a successor director at our annual meeting of stockholders, or until the director’s earlier removal, resignation or death.
All of our directors currently serve on the board of directors pursuant to the voting provisions of a voting agreement between us and several of our stockholders. This agreement will terminate upon the completion of this offering, after which there will be no further contractual obligations regarding the election of our directors.
107
Table of Contents
In accordance with our amended and restated certificate of incorporation, which will become effective immediately prior to the completion of this offering, our board of directors will be divided into three classes with staggered three-year terms. At each annual meeting of stockholders, the successors to directors whose terms then expire will be elected to serve from the time of election and qualification until the third annual meeting following election. Our directors will be divided among the three classes as follows:
| l | Class I, which will consist of Messrs. Thomas, McAdam and Nye, and whose term will expire at our first annual meeting of stockholders to be held after the completion of this offering; |
| l | Class II, which will consist of Messrs. Holzman and Sweeney, and whose term will expire at our second annual meeting of stockholders to be held after the completion of this offering; and |
| l | Class III, which will consist of Messrs. Berry, Matthews and Young, and whose term will expire at our third annual meeting of stockholders to be held after the completion of this offering. |
Our amended and restated bylaws, which will become effective upon completion of this offering, will provide that the authorized number of directors may be changed only by resolution approved by a majority of our board of directors. Any additional directorships resulting from an increase in the number of directors will be distributed among the three classes so that, as nearly as possible, each class will consist of one-third of the directors.
The division of our board of directors into three classes with staggered three-year terms may delay or prevent a change of our management or a change in control.
Director Independence
Our board of directors has undertaken a review of the independence of the directors and considered whether any director has a material relationship with us that could compromise his or her ability to exercise independent judgment in carrying out his or her responsibilities. Based upon information requested from and provided by each director concerning such director’s background, employment and affiliations, including family relationships, our board of directors determined that Messrs. Berry, Holzman, Matthews, McAdam, Nye, Sweeney and Young, representing seven of our eight directors, are “independent directors” as defined under current rules and regulations of the SEC and the listing standards of the NASDAQ Stock Market. In making these determinations, our board of directors considered the current and prior relationships that each non-employee director has with our company and all other facts and circumstances that our board of directors deemed relevant in determining their independence, including the beneficial ownership of our capital stock by each non-employee director and the transactions involving them described in “Certain Relationships and Related Party Transactions.”
Board Committees
Our board of directors has established an audit committee, a compensation committee and a nominating and corporate governance committee, each of which has the composition and responsibilities described below. From time to time, our board of directors may establish other committees to facilitate the management of our business. Members will serve on these committees until their resignations or until otherwise determined by our board of directors.
Audit Committee
Our audit committee consists of three directors, Messrs. Berry, Holzman and Sweeney. Our board of directors has determined that each of Messrs. Berry and Sweeney satisfies the independence requirements for audit committee members under the listing standards of the NASDAQ Stock Market and Rule 10A-3 of the Securities Exchange Act of 1934, as amended, or the Exchange Act. Mr. Holzman is an “affiliated person” under Rule 10A-3 of the Exchange Act and therefore does not meet the independence criteria for audit committee
108
Table of Contents
membership pursuant to the listing standard of the NASDAQ Stock Market. However, we are permitted to phase-in our compliance with the independent audit committee requirements set forth in the rules of the NASDAQ Stock Market and the Exchange Act, as follows: (1) we must have one independent member at the time of listing, (2) we must have a majority of independent members within 90 days of listing and (3) we must have all independent members within one year of listing. We expect that, within one year of our listing on the NASDAQ Stock Market, Mr. Holzman will either have (1) ceased to be an “affiliated person” under Rule 10A-3 of the Exchange Act or (2) resigned from our audit committee and an independent director for audit committee purposes (as determined under the listing standards of the NASDAQ Stock Market and Exchange Act rules) will have been added to our audit committee. Each member of our audit committee meets the financial literacy requirements of the listing standards of the NASDAQ Stock Market. Mr. Berry is the chairman of the audit committee and our board of directors has determined that Mr. Berry is an audit committee “financial expert” as defined by Item 407(d) of Regulation S-K under the Securities Act. The principal duties and responsibilities of our audit committee include, among other things:
| l | selecting a qualified firm to serve as the independent registered public accounting firm to audit our financial statements; |
| l | helping to ensure the independence and performance of the independent registered public accounting firm; |
| l | discussing the scope and results of the audit with the independent registered public accounting firm, and reviewing, with management and the independent accountants, our interim and year-end operating results; |
| l | developing procedures for employees to submit concerns anonymously about questionable accounting or audit matters; |
| l | reviewing our policies on risk assessment and risk management; |
| l | reviewing related party transactions; |
| l | obtaining and reviewing a report by the independent registered public accounting firm at least annually, that describes our internal quality-control procedures, any material issues with such procedures and any steps taken to deal with such issues when required by applicable law; and |
| l | approving (or, as permitted, pre-approving) all audit and all permissible non-audit services, other than de minimis non-audit services, to be performed by the independent registered public accounting firm. |
Our audit committee will operate under a written charter, to be effective immediately prior to the completion of this offering, that satisfies the applicable rules of the SEC and the listing standards of the NASDAQ Stock Market.
Compensation Committee
Our compensation committee consists of two directors, Messrs. McAdam and Nye, each of whom our board of directors has determined is a non-employee member of our board of directors as defined in Rule 16b-3 under the Exchange Act and an outside director as that term is defined in Section 162(m) of the Internal Revenue Code of 1986, as amended, or the Code. Mr. Nye is the chairman of the compensation committee. The composition of our compensation committee meets the requirements for independence under current listing standards of the NASDAQ Stock Market and current SEC rules and regulations. The principal duties and responsibilities of our compensation committee include, among other things:
| l | reviewing and approving, or recommending that our board of directors approve, the compensation of our executive officers; |
109
Table of Contents
| l | reviewing and recommending to our board of directors the compensation of our directors; |
| l | reviewing and approving, or recommending that our board of directors approve, the terms of compensatory arrangements with our executive officers; |
| l | administering our stock and equity incentive plans; |
| l | reviewing and approving, or recommending that our board of directors approve, incentive compensation and equity plans; and |
| l | reviewing and establishing general policies relating to compensation and benefits of our employees and reviewing our overall compensation philosophy. |
Our compensation committee will operate under a written charter, to be effective immediately prior to the completion of this offering, that satisfies the applicable rules of the SEC and the listing standards of the NASDAQ Stock Market.
Nominating and Corporate Governance Committee
Our nominating and corporate governance committee consists of two directors, Messrs. Sweeney and Young. Mr. Young is the chairman of the nominating and corporate governance committee. The composition of our nominating and governance committee meets the requirements for independence under current listing standards of the NASDAQ Stock Market and current SEC rules and regulations. The nominating and corporate governance committee’s responsibilities include, among other things:
| l | identifying, evaluating and selecting, or recommending that our board of directors approve, nominees for election to our board of directors and its committees; |
| l | evaluating the performance of our board of directors and of individual directors; |
| l | considering and making recommendations to our board of directors regarding the composition of our board of directors and its committees; |
| l | reviewing developments in corporate governance practices; |
| l | evaluating the adequacy of our corporate governance practices and reporting; |
| l | developing and making recommendations to our board of directors regarding corporate governance guidelines and matters; and |
| l | overseeing an annual evaluation of the board’s performance. |
Our nominating and governance committee will operate under a written charter, to be effective immediately prior to the completion of this offering, that satisfies the applicable rules of the SEC and the listing standards of the NASDAQ Stock Market.
110
Table of Contents
Code of Business Conduct and Ethics
We have adopted a Code of Business Conduct and Ethics, or the Code of Conduct, that will be applicable to all of our employees, executive officers and directors immediately prior to the completion of this offering. Following the completion of this offering, the Code of Conduct will be available on our website at www.rapid7.com. The nominating and corporate governance committee of our board of directors will be responsible for overseeing the Code of Conduct and must approve any waivers of the Code of Conduct for employees, executive officers and directors. We expect that any amendments to the Code of Conduct, or any waivers of its requirements, will be disclosed on our website.
Compensation Committee Interlocks and Insider Participation
None of our executive officers currently serves, or in the past year has served, as a member of the board of directors or compensation committee of any entity that has one or more executive officers serving on our board of directors or compensation committee. None of the members of our compensation committee is an officer or employee of our company, nor have they ever been an officer or employee of our company.
111
Table of Contents
EXECUTIVE AND DIRECTOR COMPENSATION
2014 Summary Compensation Table
The following table sets forth information regarding compensation earned with respect to the year ended December 31, 2014 by our principal executive officer and the next two most highly compensated executive officers in 2014. These individuals are our named executive officers for 2014.
| Name and Principal Position |
Salary | Option Awards(1) |
Nonequity Incentive Plan Compensation(2) |
All Other Compensation |
Total | |||||||||||||||
| Corey Thomas(3) President and Chief Executive Officer |
$ | 250,000 | $ | — | $ | 169,500 | $ | — | $419,500 | |||||||||||
| Steven Gatoff Chief Financial Officer |
300,000 | — | 113,000 | — | 413,000 | |||||||||||||||
| Richard Moseley(4) Senior Vice President, Global Sales |
253,143 | 226,800 | 328,529 | 32,219 | (5) | 840,691 | ||||||||||||||
| (1) | This column reflects the full grant date fair value of options granted during the year as measured pursuant to Financial Accounting Standard Board Accounting Standards Codification Topic 718 (ASC 718) as stock-based compensation in our consolidated financial statements. Unlike the calculations contained in our consolidated financial statements, this calculation does not give effect to any estimate of forfeitures related to service-based vesting, but assumes that the named executive officer will perform the requisite service for the award to vest in full. The assumptions we used in valuing options are described in Note (9) to our consolidated financial statements included in this prospectus. |
| (2) | See “—Employment Arrangements—2014 Bonus Plan” and “—Employment Arrangements—Sales Commission Plans” below for a description of the material terms of the plans pursuant to which this compensation was awarded. |
| (3) | Mr. Thomas is also a member of our board of directors but did not receive any additional compensation in his capacity as a director. |
| (4) | Mr. Moseley’s compensation is paid in British pounds; all amounts have been converted to U.S. dollars based on the inverse noon buying rate of the Federal Reserve Bank of New York for the British pound on December 31, 2014. |
| (5) | Consists of $21,071 related to a car allowance provided to Mr. Moseley and $11,148 in contributions to a personal pension plan for Mr. Moseley’s benefit. See “—Employment Arrangements” below for a description of the pension plan contributions provided to Mr. Moseley. |
Outstanding Equity Awards as of December 31, 2014
The following table sets forth certain information about outstanding equity awards granted to our named executive officers that remain outstanding as of December 31, 2014.
| Option awards(1) | Stock Awards | |||||||||||||||||||||||||||
| Name |
Grant Date | Number of Securities Underlying Unexercised Options (#) Exercisable |
Number of Securities Underlying Unexercised Options (#) Unexercisable |
Option Exercise Price(2) |
Option Expiration Date |
Number of Shares or Units of Stock That Have Not Vested (#) |
Market Value of Shares or Units of Stock That Have Not Vested |
|||||||||||||||||||||
| Corey Thomas |
3/21/2012 | 485,366 | — | $ 2.17 | 3/21/2022 | — | $— | |||||||||||||||||||||
| 1/3/2013 | 319,901 | 347,719 | (3) | 5.05 | 1/3/2023 | — | — | |||||||||||||||||||||
| — | — | — | — | — | 4,185 | (4) | ||||||||||||||||||||||
| Steven Gatoff |
3/12/2013 | 152,125 | 152,126 | (5) | 5.05 | 3/12/2023 | — | — | ||||||||||||||||||||
| Richard Moseley |
2/4/2014 | 20,000 | 40,000 | (6) | 7.73 | 8/26/2023 | — | — | ||||||||||||||||||||
112
Table of Contents
| (1) | All of the option awards listed in the table above were granted under our 2011 Stock Option and Grant Plan, the terms of which are described below under “—Equity Incentive Plans.” |
| (2) | All of the option awards listed in the table above were granted with a per share exercise price equal to the fair market value of one share of our common stock on the date of grant, as determined in good faith by our board of directors with the assistance of a third-party valuation expert. |
| (3) | Option vests over a four year period in 48 equal monthly installments at the end of each calendar month following January 1, 2013, subject to Mr. Thomas’ continuous service through each vesting date. See “—Potential Payments upon Termination or Change of Control” for a description of vesting acceleration applicable to stock options held by Mr. Thomas. |
| (4) | The market price of our common stock is based on an assumed initial public offering price of $ per share, the midpoint of the price range set forth on the cover page of this prospectus. |
| (5) | Option vests over a four year period as to 25% of the common stock underlying the option on December 15, 2013 and as to 75% of the common stock underlying the option in 36 equal monthly installments at the end of each calendar month thereafter, subject to Mr. Gatoff’s continuous service through each vesting date. See “—Potential Payments upon Termination or Change of Control” for a description of vesting acceleration applicable to stock options held by Mr. Gatoff. |
| (6) | Option vests over a four year period as to 25% of the common stock underlying the option on August 24, 2014 and as to 75% of the common stock underlying the option in 36 equal monthly installments at the end of each calendar month thereafter, subject to Mr. Moseley’s continuous service through each vesting date. |
On February 4, 2015, we granted Messrs. Thomas, Gatoff and Moseley options to purchase 200,000, 37,739, and 60,000 shares of our common stock, respectively, at an exercise price of $9.77 per share.
Pension Benefits
Except for Mr. Moseley, none of our named executive officers participate, or have an account balance, in any qualified or non-qualified defined benefit plans sponsored by us.
See “—Employment Arrangements” for a description of the pension benefits that we provide to Mr. Moseley.
Employment Arrangements
Below are written descriptions of our employment agreements or offer letters, as applicable, with each of our named executive officers. Each of our named executive officers’ employment is “at will” and may be terminated at any time.
Corey Thomas. We entered into an employment agreement with Mr. Thomas in January 2013 setting forth the terms of his employment. Mr. Thomas was entitled to an initial annual base salary of $250,000, which has been subsequently increased, most recently in February 2015, to $350,000. Pursuant to the agreement, Mr. Thomas was granted a stock option to purchase 667,620 shares of our common stock in January 2013 that is subject to vesting in equal monthly installments over 48 months following January 3, 2013, subject to Mr. Thomas’ continued service. Mr. Thomas is also eligible to receive annual performance bonuses pursuant to the company bonus plans described below, with a target bonus of $150,000 for 2015. Mr. Thomas’ employment agreement also provides for certain severance benefits, the terms of which are described below under “—Potential Payments Upon Termination or Change of Control.”
Steven Gatoff. We entered into an offer letter agreement with Mr. Gatoff in December 2012 setting forth the terms of his employment. Mr. Gatoff’s annual base salary is $300,000. Pursuant to the agreement, Mr. Gatoff was granted a stock option to purchase 304,251 shares of our common stock in March 2013 that is subject to vesting as to 25% of the underlying shares on December 15, 2013 and as to the remaining underlying shares in equal monthly installments over 36 months thereafter, subject to Mr. Gatoff’s continued service. Mr. Gatoff is also eligible to receive annual performance bonuses pursuant to the company bonus plans described below, with a target bonus of $100,000 for 2015. Mr. Gatoff’s offer letter agreement also provides for certain severance benefits, the terms of which are described below under “—Potential Payments Upon Termination or Change of Control.”
113
Table of Contents
Richard Moseley. Through our United Kingdom subsidiary, we entered into an offer letter agreement with Mr. Moseley in June 2013 setting forth the terms of his employment. Mr. Moseley was entitled to an initial annual base salary of £150,000, which has been subsequently increased, most recently in October 2014, to £200,000. Pursuant to the agreement, Mr. Moseley was granted a stock option to purchase 60,000 shares of our common stock in February 2014 that is subject to vesting as to 25% of the underlying shares on August 26, 2014 and as to the remaining underlying shares in equal monthly installments over 36 months thereafter, subject to Mr. Moseley’s continued service. Further, Mr. Moseley’s offer letter agreement provides that we will contribute an amount equal to 8% of his base salary to a personal pension plan for his benefit. Mr. Moseley is also eligible to participate in our sales commission plans, with a target aggregate commission of £150,000 for 2015. Mr. Moseley’s offer letter agreement also provides for certain severance benefits, the terms of which are described below under “—Potential Payments Upon Termination or Change of Control.”
2014 Bonus Plan
In 2014, our executive officers were eligible to participate in our 2014 bonus plan. Bonuses were measured as of December 31, 2014 and paid in February 2015. The bonus plan was designed to motivate and reward executives for the attainment of company-wide performance goals. The annual cash targets for Messrs. Thomas and Gatoff were set at $150,000 and $100,000, respectively, 80% of which was subject to the achievement of certain revenue targets and 20% of which was subject to the achievement of other company objectives. The annual cash target for Mr. Moseley was £30,000, 50% of which was subject to the achievement of certain revenue targets and 50% of which was subject to the achievement of other company objectives, and Mr. Moseley was also a participant in our sales commission plan for 2014, which is described below. Messrs. Thomas, Gatoff and Moseley were eligible to receive more than 100% of their target bonuses if the company’s performance exceeded the targets set forth in the 2014 bonus plan. Messrs. Thomas, Gatoff and Moseley received bonuses of $169,500, $113,000 and £30,750, respectively, pursuant to the 2014 bonus plan.
2015 Bonus Plan
Messrs. Thomas and Gatoff and each of our other executive officers, other than Mr. Moseley, are eligible to participate in our 2015 bonus plan. The bonus plan is designed to motivate and reward executives for the attainment of company-wide performance goals. The annual cash targets for Messrs. Thomas and Gatoff are set at $150,000 and $100,000 respectively, 100% of which is subject to the achievement of certain revenue targets. Messrs. Thomas and Gatoff are eligible to receive more than 100% of their target bonuses if the company’s revenue exceeds the target set forth in the 2015 bonus plan, up to a maximum of 120%.
Sales Commission Plan
We establish sales commission plans to encourage and reward contributions to our long-term revenue growth. Mr. Moseley was, and continues to be, eligible to receive compensation under our sales commission plans. Under our sales commission plan for 2014, Mr. Moseley’s target commission was £120,000. Mr. Moseley received commissions of £180,143 pursuant to our sales commission plan for 2014. Under our sales commission plan for 2015, Mr. Moseley’s target commission is £150,000.
Potential Payments Upon Termination or Change of Control
Regardless of the manner in which a named executive officer’s service terminates, the named executive officer is entitled to receive amounts earned during his term of service, including salary.
Corey Thomas. Pursuant to his employment agreement, if Mr. Thomas’ employment with us ends due to his resignation for “good reason,” his termination by us other than for “cause” or as a result of his death or disability, he is entitled to (1) continued payment of his base salary for nine months following his termination, (2) payment of premiums for continued health benefits under COBRA for up to nine months and (3) a pro-rated portion of his target performance bonus for the year in which the termination occurs. In addition, (a) if Mr. Thomas’
114
Table of Contents
employment with us ends due to his resignation for “good reason” or his termination by us other than for “cause,” Mr. Thomas’ outstanding stock options will vest as to one half of the then-unvested underlying shares of common stock and (b) if Mr. Thomas’ employment with us or our successor ends due to his resignation for “good reason” or his termination by us or our successor other than for “cause,” in each case in connection with or within 24 months following a change of control of our company, Mr. Thomas’ outstanding stock options will vest as to all then-unvested underlying shares of common stock. Mr. Thomas’ benefits are conditioned, among other things, on his complying with his post-termination obligations under his employment agreement and signing a general release of claims in our favor.
Steven Gatoff. Pursuant to his offer letter agreement, if Mr. Gatoff’s employment with us ends due to his resignation for “good reason,” his termination by us other than for “cause” or as a result of his death or disability, he is entitled to (1) continued payment of his base salary for nine months following his termination and (2) payment of premiums for continued health benefits under COBRA for up to nine months. In addition, (a) if our company undergoes a change of control and Mr. Gatoff is employed by us immediately prior to the consummation of such change of control, Mr. Gatoff’s outstanding stock options will vest as to one half of the then-unvested underlying shares of common stock and (b) if Mr. Gatoff’s employment with us or our successor ends due to his resignation for “good reason” or his termination by us or our successor other than for “cause,” in each case in connection with or within 24 months following a change of control of our company, Mr. Gatoff’s outstanding stock options will vest as to all then-unvested underlying shares of common stock. Mr. Gatoff’s benefits are conditioned, among other things, on his complying with his post-termination obligations under his offer letter agreement, signing a general release of claims in our favor and resigning from all positions that he holds with us.
Richard Moseley. Pursuant to his offer letter agreement, Mr. Moseley is entitled to receive notice of termination of his employment equal to one month, plus an additional one week of notice for each year of employment with us in excess of four years, up to a maximum of 12 weeks’ notice; provided, that in lieu of providing Mr. Moseley with such notice, we may terminate his employment immediately at any time and pay Mr. Moseley the amounts that we would owe to him during the notice period.
Non-Employee Director Compensation
Historically, we have provided equity-based compensation to our independent directors who are not employees or affiliated with our largest investors for the time and effort necessary to serve as a member of our board of directors. However, our directors are not currently entitled to receive any compensation in connection with their service on our board of directors, except for reimbursement of direct expenses incurred in connection with attending meetings of the board or committees thereof.
We expect that our board of directors will adopt a director compensation policy for non-employee directors following the completion of this offering.
115
Table of Contents
2014 Director Compensation Table
The following table sets forth information regarding the compensation earned for service on our board of directors during the year ended December 31, 2014 by our directors who were not also our employees. Corey Thomas, our President and Chief Executive Officer, is also a member of our board of directors, but did not receive any additional compensation for his service as a director. Mr. Thomas’s compensation as an executive officer is set forth above under “Executive and Director Compensation—2014 Summary Compensation Table.”
| Name |
Fees Earned or Paid in Cash |
Option Awards(1)(2) | All Other Compensation |
Total | ||||||||||||
| Michael Berry |
$ | — | $ | 75,600 | $ | — | $ | 75,600 | ||||||||
| Benjamin Holzman |
— | — | — | — | ||||||||||||
| Timothy McAdam. |
— | — | — | — | ||||||||||||
| Alan Matthews |
— | — | 22,292(3) | 22,292 | ||||||||||||
| J. Benjamin Nye |
— | — | — | — | ||||||||||||
| John Sweeney |
— | 75,600 | — | 75,600 | ||||||||||||
| Christopher Young |
— | 75,600 | — | 75,600 | ||||||||||||
| (1) | This column reflects the full grant date fair value for options granted during the year as measured pursuant to Financial Accounting Standard Board Accounting Standards Codification Topic 718 (ASC 718) as stock-based compensation in our consolidated financial statements. Unlike the calculations contained in our consolidated financial statements, this calculation does not give effect to any estimate of forfeitures related to service-based vesting, but assumes that directors will perform the requisite service for the award to vest in full. The assumptions we used in valuing options are described in Note (9) to our consolidated financial statements included in this prospectus. |
| (2) | The table below shows the aggregate number of option awards outstanding for each of our non-employee directors as of December 31, 2014: |
| Name |
Option Awards (#)(1) |
|||
| Michael Berry |
80,000 | |||
| Benjamin Holzman |
— | |||
| Timothy McAdam |
— | |||
| Alan Matthews |
— | |||
| J. Benjamin Nye |
— | |||
| John Sweeney |
20,000 | |||
| Christopher Young |
20,000 | |||
(1) Options vest over a four year period as to 25% of the common stock underlying the option on the first anniversary of the grant date and as to 75% of the common stock underlying the option in 36 equal monthly installments thereafter at the end of each calendar month, subject to the recipient’s continued service through each vesting date; provided, that 60,000 shares of common stock underlying options granted to Mr. Berry will vest in full if Mr. Berry’s service as a director is terminated by us or our successor following a change of control of our company.
| (3) | Reflects the amount that we paid for medical benefits for Mr. Matthews and his former spouse. |
On May 5, 2015, we granted each of Messrs. Berry, Sweeney and Young options to purchase 10,000 shares of our common stock at an exercise price of $10.88 per share.
Equity Incentive Plans
2015 Equity Incentive Plan
Our board of directors has adopted, and we expect that our stockholders will approve prior to the completion of this offering, our 2015 Equity Incentive Plan, or 2015 Plan. We do not expect to utilize our 2015 Plan until after the completion of this offering, at which point no further grants will be made under our 2011 Stock Option and Grant Plan, or 2011 Plan, as described below under “2011 Stock Option and Grant Plan.” No awards have been granted and no shares of our common stock have been issued under our 2015 Plan.
Stock Awards. The 2015 Plan provides for the grant of incentive stock options within the meaning of Section 422 of the Internal Revenue Code of 1986, as amended, or the Code, nonstatutory stock options, stock
116
Table of Contents
appreciation rights, restricted stock awards, restricted stock unit awards, performance-based stock awards, and other forms of equity compensation, which are collectively referred to as stock awards. Additionally, the 2015 Plan provides for the grant of performance cash awards. Incentive stock options may be granted only to employees. All other awards may be granted to employees, including officers, and to non-employee directors and consultants.
Share Reserve. Initially, the aggregate number of shares of our common stock that may be issued pursuant to stock awards under the 2015 Plan after the 2015 Plan becomes effective is the sum of (1) shares, and (2) the number of shares reserved for issuance under our 2011 Plan at the time our 2015 Plan becomes effective. Additionally, any shares subject to stock options or other stock awards granted under our 2011 Plan that would have otherwise returned to our 2011 Plan (such as upon the expiration or termination of a stock award prior to vesting) will be added to, and available for issuance under, our 2015 Plan and the number of shares of our common stock reserved for issuance under our 2015 Plan will automatically increase on January 1 of each year, beginning on January 1, 2016 (assuming the 2015 Plan becomes effective before such date) and continuing through and including January 1, 2025, by % of the total number of shares of our capital stock outstanding on December 31 of the preceding calendar year, or a lesser number of shares determined by our board of directors. The maximum number of shares that may be issued upon the exercise of incentive stock options under our 2015 Plan is shares.
No person may be granted stock awards covering more than shares of our common stock under our 2015 Plan during any calendar year pursuant to stock options, stock appreciation rights and other stock awards whose value is determined by reference to an increase over an exercise or strike price of at least 100% of the fair market value on the date the stock award is granted. Additionally, no person may be granted in a calendar year a performance stock award covering more than shares or a performance cash award having a maximum value in excess of $ . Such limitations are designed to help assure that any deductions to which we would otherwise be entitled with respect to such awards will not be subject to the $1,000,000 limitation on the income tax deductibility of compensation paid to any covered executive officer imposed by Section 162(m) of the Code.
If a stock award granted under the 2015 Plan expires or otherwise terminates without being exercised in full, or is settled in cash, the shares of our common stock not acquired pursuant to the stock award again will become available for subsequent issuance under the 2015 Plan. In addition, the following types of shares under the 2015 Plan may become available for the grant of new stock awards under the 2015 Plan: (1) shares that are forfeited to or repurchased by us prior to becoming fully vested; (2) shares withheld to satisfy income or employment withholding taxes; or (3) shares used to pay the exercise or purchase price of a stock award. Shares issued under the 2015 Plan may be previously unissued shares or reacquired shares bought by us on the open market.
Administration. Our board of directors, or a duly authorized committee thereof, has the authority to administer the 2015 Plan. Our board of directors may also delegate to one or more of our officers the authority to (1) designate employees (other than other officers) to be recipients of certain stock awards, (2) determine the number of shares of common stock to be subject to such stock awards, and (3) specify the other terms and conditions, including the strike price or purchase price and vesting schedule, applicable to such awards. Subject to the terms of the 2015 Plan, our board of directors or the authorized committee, referred to as the plan administrator, determines recipients, dates of grant, the numbers and types of stock awards to be granted and the terms and conditions of the stock awards, including the period of their exercisability and vesting schedule applicable to a stock award. Subject to the limitations set forth below, the plan administrator will also determine the exercise price, strike price or purchase price of awards granted and the types of consideration to be paid for the award.
The plan administrator has the authority to modify outstanding awards under our 2015 Plan. Subject to the terms of our 2015 Plan, the plan administrator has the authority, without stockholder approval, to reduce the exercise, purchase or strike price of any outstanding stock award, cancel any outstanding stock award in exchange for new stock awards, cash or other consideration, or take any other action that is treated as a repricing under generally accepted accounting principles, with the consent of any adversely affected participant.
117
Table of Contents
Stock Options. Incentive and nonstatutory stock options are evidenced by stock option agreements adopted by the plan administrator. The plan administrator determines the exercise price for a stock option, within the terms and conditions of the 2015 Plan, provided that the exercise price of a stock option generally cannot be less than 100% of the fair market value of our common stock on the date of grant. Options granted under the 2015 Plan vest at the rate specified by the plan administrator.
The plan administrator determines the term of stock options granted under the 2015 Plan, up to a maximum of 10 years. Unless the terms of an option holder’s stock option agreement provide otherwise, if an option holder’s service relationship with us, or any of our affiliates, ceases for any reason other than disability, death or cause, the option holder may generally exercise any vested options for a period of three months following the cessation of service. The option term will automatically be extended in the event that exercise of the option following such a termination of service is prohibited by applicable securities laws or our insider trading policy. If an option holder’s service relationship with us or any of our affiliates ceases due to disability or death, or an optionholder dies within a certain period following cessation of service, the optionholder or a beneficiary may generally exercise any vested options for a period of 12 months in the event of disability and 18 months in the event of death. In the event of a termination for cause, options generally terminate immediately. In no event may an option be exercised beyond the expiration of its term.
Acceptable consideration for the purchase of common stock issued upon the exercise of a stock option will be determined by the plan administrator and may include (1) cash, check, bank draft or money order, (2) a broker-assisted cashless exercise, (3) the tender of shares of our common stock previously owned by the optionholder, (4) a net exercise of the option if it is a nonqualified stock option and (5) other legal consideration approved by the plan administrator.
Unless the plan administrator provides otherwise, options generally are not transferable except by will, the laws of descent and distribution, or pursuant to a domestic relations order. An optionholder may designate a beneficiary, however, who may exercise the option following the option holder’s death.
Tax Limitations on Incentive Stock Options. The aggregate fair market value, determined at the time of grant, of our common stock with respect to incentive stock options that are exercisable for the first time by an optionholder during any calendar year under all of our stock plans may not exceed $100,000. Options or portions thereof that exceed such limit will be treated as nonqualified stock options. No incentive stock option may be granted to any person who, at the time of the grant, owns or is deemed to own stock possessing more than 10% of our total combined voting power or that of any of our affiliates unless (1) the option exercise price is at least 110% of the fair market value of the stock subject to the option on the date of grant and (2) the term of the incentive stock option does not exceed five years from the date of grant.
Restricted Stock Awards. Restricted stock awards are evidenced by restricted stock award agreements adopted by the plan administrator. Restricted stock awards may be granted in consideration for (1) cash, check, bank draft or money order, (2) services rendered to us or our affiliates or (3) any other form of legal consideration. Common stock acquired under a restricted stock award may, but need not, be subject to a share repurchase option in our favor in accordance with a vesting schedule as determined by the plan administrator. Rights to acquire shares under a restricted stock award may be transferred only upon such terms and conditions as set by the plan administrator. Except as otherwise provided in the applicable award agreement, restricted stock awards that have not vested will be forfeited upon the participant’s cessation of continuous service for any reason.
Restricted Stock Unit Awards. Restricted stock unit awards evidenced by restricted stock unit award agreements adopted by the plan administrator. Restricted stock unit awards may be granted in consideration for any form of legal consideration or for no consideration. A restricted stock unit award may be settled by cash, delivery of stock, a combination of cash and stock as deemed appropriate by the plan administrator, or in any other form of consideration set forth in the restricted stock unit award agreement. Additionally, dividend equivalents may be credited in respect of shares covered by a restricted stock unit award. Rights under a restricted stock units award
118
Table of Contents
may be transferred only upon such terms and conditions as set by the plan administrator. Restricted stock unit awards may be subject to vesting as determined by the plan administrator. Except as otherwise provided in the applicable award agreement, restricted stock units that have not vested will be forfeited upon the participant’s cessation of continuous service for any reason.
Stock Appreciation Rights. Stock appreciation rights are evidenced by stock appreciation grant agreements adopted by the plan administrator. The plan administrator determines the strike price for a stock appreciation right, which generally cannot be less than 100% of the fair market value of our common stock on the date of grant. Upon the exercise of a stock appreciation right, we will pay the participant an amount in cash or stock equal to (1) the excess of the per share fair market value of our common stock on the date of exercise over the strike price, multiplied by (2) the number of shares of common stock with respect to which the stock appreciation right is exercised. A stock appreciation right granted under the 2015 Plan vests at the rate specified in the stock appreciation right agreement as determined by the plan administrator.
The plan administrator determines the term of stock appreciation rights granted under the 2015 Plan, up to a maximum of ten years. Unless the terms of a participant’s stock appreciation right agreement provide otherwise, if a participant’s service relationship with us or any of our affiliates ceases for any reason other than cause, disability or death, the participant may generally exercise any vested stock appreciation right for a period of three months following the cessation of service. The stock appreciation right term will be further extended in the event that exercise of the stock appreciation right following such a termination of service is prohibited by applicable securities laws. If a participant’s service relationship with us, or any of our affiliates, ceases due to disability or death, or a participant dies within a certain period following cessation of service, the participant or a beneficiary may generally exercise any vested stock appreciation right for a period of 12 months in the event of disability and 18 months in the event of death. In the event of a termination for cause, stock appreciation rights generally terminate immediately upon the occurrence of the event giving rise to the termination of the individual for cause. In no event may a stock appreciation right be exercised beyond the expiration of its term.
Unless the plan administrator provides otherwise, stock appreciation rights generally are not transferable except by will, the laws of descent and distribution, or pursuant to a domestic relations order. A stock appreciation right holder may designate a beneficiary, however, who may exercise the stock appreciation right following the holder’s death.
Performance Awards. The 2015 Plan permits the grant of performance-based stock and cash awards that may qualify as performance-based compensation that is not subject to the $1,000,000 limitation on the income tax deductibility of compensation paid to a covered executive officer imposed by Section 162(m) of the Code. To help assure that the compensation attributable to certain types of performance-based awards will so qualify, our compensation committee can structure such awards so that stock or cash will be issued or paid pursuant to such award only after the achievement of certain pre-established performance goals during a designated performance period.
The performance goals that may be selected include one or more of the following: (1) earnings (including earnings per share and net earnings); (2) earnings before interest, taxes and depreciation; (3) earnings before interest, taxes, depreciation and amortization; (4) total stockholder return; (5) return on equity or average stockholders’ equity; (6) return on assets, investment, or capital employed; (7) stock price; (8) margin (including gross margin); (9) income (before or after taxes); (10) operating income; (11) operating income after taxes; (12) pre-tax profit; (13) operating cash flow; (14) sales or revenue targets; (15) increases in revenue or product revenue; (16) expenses and cost reduction goals; (17) improvement in or attainment of working capital levels; (18) economic value added (or an equivalent metric); (19) market share; (20) cash flow; (21) cash flow per share; (22) share price performance; (23) debt reduction; (24) implementation or completion of projects or processes; (25) subscriber satisfaction; (26) stockholders’ equity; (27) capital expenditures; (28) debt levels; (29) operating profit or net operating profit; (30) workforce diversity; (31) growth of net income or operating income; (32) billings; and (33) to the extent that an award is not intended to comply with Section 162(m) of the Code, other measures of performance selected by our board of directors.
119
Table of Contents
The performance goals may be based on company-wide performance or performance of one or more business units, divisions, affiliates, or business segments, and may be either absolute or relative to the performance of one or more comparable companies or the performance of one or more relevant indices. Unless specified otherwise (1) in the award agreement at the time the award is granted or (2) in such other document setting forth the performance goals at the time the goals are established, we will appropriately make adjustments in the method of calculating the attainment of performance goals as follows: (a) to exclude restructuring and/or certain other specified nonrecurring charges; (b) to exclude exchange rate effects, as applicable, for non-U.S. dollar denominated goals; (c) to exclude the effects of changes to generally accepted accounting principles; (d) to exclude the effects of any statutory adjustments to corporate tax rates; and (e) to exclude the effects of any “extraordinary items” as determined under generally accepted accounting principles. In addition, we retain the discretion to reduce or eliminate the compensation or economic benefit due upon attainment of the goals. The performance goals may differ from participant to participant and from award to award.
Other Stock Awards. The plan administrator may grant other awards based in whole or in part by reference to our common stock. The plan administrator will set the number of shares under the stock award and all other terms and conditions of such awards.
Changes to Capital Structure. In the event that there is a specified type of change in our capital structure, such as a stock split or recapitalization, appropriate adjustments will be made to (1) the class and maximum number of shares reserved for issuance under the 2015 Plan, (2) the class and maximum number of shares by which the share reserve may increase automatically each year, (3) the class and maximum number of shares that may be issued upon the exercise of incentive stock options, (4) the class and maximum number of shares subject to stock awards that can be granted in a calendar year or as performance stock awards (as established under the 2015 Plan pursuant to Section 162(m) of the Code) and (5) the class and number of shares and exercise price, strike price, or purchase price, if applicable, of all outstanding stock awards.
Corporate Transactions. In the event of certain specified significant corporate transactions, the plan administrator has the discretion to take any of the following actions with respect to stock awards:
| l | arrange for the assumption, continuation or substitution of a stock award by a surviving or acquiring entity or parent company; |
| l | arrange for the assignment of any reacquisition or repurchase rights held by us to the surviving or acquiring entity or parent company; |
| l | accelerate the vesting of the stock award and provide for its termination prior to the effective time of the corporate transaction; |
| l | arrange for the lapse of any reacquisition or repurchase right held by us; |
| l | cancel or arrange for the cancellation of the stock award in exchange for such cash consideration, if any, as our board of directors may deem appropriate or for no consideration; or |
| l | make a payment equal to the excess of (1) the value of the property the participant would have received upon exercise of the stock award over (2) the exercise price or strike price otherwise payable in connection with the stock award. |
Our plan administrator is not obligated to treat all stock awards, even those that are of the same type, in the same manner.
Under the 2015 Plan, a significant corporate transaction is generally the consummation of (1) a sale or other disposition of all or substantially all of our consolidated assets, (2) a sale or other disposition of at least 50% of our outstanding securities, (3) a merger, consolidation or similar transaction following which we are not the surviving corporation or (4) a merger, consolidation or similar transaction following which we are the surviving corporation but the shares of our common stock outstanding immediately prior to such transaction are converted or exchanged into other property by virtue of the transaction.
120
Table of Contents
Change in Control. The plan administrator may provide, in an individual award agreement or in any other written agreement between a participant and us that the stock award will be subject to additional acceleration of vesting and exercisability or settlement in the event of a change in control. Under the 2015 Plan, a change in control is generally (1) the acquisition by a person or entity of more than 50% of our combined voting power other than by merger, consolidation or similar transaction; (2) a consummated merger, consolidation or similar transaction immediately after which our stockholders cease to own more than 50% of the combined voting power of the surviving entity; or (3) a consummated sale, lease or exclusive license or other disposition of all or substantially all of our consolidated assets.
Amendment and Termination. Our board of directors has the authority to amend, suspend or terminate our 2015 Plan, provided that such action does not materially impair the existing rights of any participant without such participant’s written consent and provided further that certain types of amendments will require the approval of our stockholders. No incentive stock options may be granted after the tenth anniversary of the date our board of directors adopted our 2015 Plan.
2011 Stock Option and Grant Plan
Our 2011 Stock Option and Grant Plan, or 2011 Plan, was adopted by our board of directors and approved by our stockholders on November 16, 2011 and was last amended by our board of directors and approved by our stockholders on December 8, 2014. As of March 31, 2015, 805,121 shares of our common stock have been issued pursuant to the exercise of options granted under our 2011 Plan, options to purchase 4,006,962 shares of our common stock were outstanding at a weighted-average exercise price of $5.44 per share, 2,325,089 shares of our common stock have been issued pursuant to restricted stock awards and 1,025,391 shares remained available for future grant under our 2011 Plan. Following this offering, no further grants will be made under our 2011 Plan and all outstanding stock awards granted under our 2011 Plan will continue to be governed by the terms of our 2011 Plan.
Stock Awards. Our 2011 Plan provides for the grant of incentive stock options, nonqualified stock options, restricted stock, unrestricted stock and restricted stock units, collectively stock awards, to our employees, including officers, non-employee directors, consultants and key persons providing services to us.
Share Reserve. The aggregate number of shares of our common stock reserved for issuance pursuant to stock awards under the 2011 Plan is 8,162,563 shares, subject to adjustment as provided in the 2011 Plan.
Administration. Our board of directors, or a duly authorized committee thereof, each referred to as the plan administrator, has the authority to administer the 2011 Plan. Subject to the terms of the 2011 Plan, the plan administrator determines recipients, dates of grant, the numbers and types of stock awards to be granted and the terms and conditions of the stock awards, including the period of their exercisability and vesting schedule applicable to a stock award.
The plan administrator has the authority to modify outstanding stock awards under our 2011 Plan, including, without stockholder approval, the discretion to reduce the exercise price of outstanding stock options or to effect repricing through cancellation of outstanding stock options and by granting holders new stock awards in replacement of the cancelled stock options. The plan administrator is not obligated to treat all stock awards, even those that are of the same type, in the same manner. Subject to the terms of the 2011 Plan, the plan administrator has full authority and discretion to interpret the 2011 Plan, prescribe and rescind rules and regulations related to it, and to amend, terminate or discontinue the 2011 Plan.
Changes to Capital Structure. In the event that there is a specified type of change in our capital structure, such as a stock split or recapitalization, appropriate adjustments will be made to (1) the maximum number of shares reserved for future issuance under the 2011 Plan, (2) the number and kind of shares or other securities subject to each outstanding stock award, (3) the repurchase price, if any, for each share subject to an outstanding award and (4) the exercise price of each outstanding stock option.
121
Table of Contents
Sale Event. In the event of a sale event, the plan administrator has the discretion to arrange for the assumption or continuation of a stock award by the surviving or acquiring entity or for the substitution of the shares subject to the stock award for new stock awards or other awards with an equitable or proportionate adjustment as to the number and kind of shares and if appropriate, the per share exercise price, as we and the successor entity agree. In the event that a successor entity does not assume, continue or substitute stock awards, the stock awards shall terminate upon, or be forfeited immediately prior to, the effective time of the sale event. In addition to or in lieu of the foregoing, with respect to outstanding options that are exercisable or will become exercisable as a result of the sale event, the plan administrator may provide that the option must be exercised within a time period provided by the plan administrator otherwise such option shall either terminate outright at the time of the sale event or terminate in exchange for a cash payment equal to the excess of the value of the consideration payable per share of our common stock pursuant to the sale event times the number of shares subject to the stock options being cancelled over the aggregate exercise price of such vested options. If not assumed, continued or substituted, outstanding options that are not exercisable and will not become exercisable as a result of the sale event, and restricted shares and restricted stock units that will not become vested as a result of the sale event, will terminate or be forfeited upon the effective time of the sale event (in the event of forfeiture of restricted shares in connection with the sale event, we will repurchase such shares from the holder at a price equal to the lower of the original per share purchase price paid by the holder or the then current fair market value of the shares). If not assumed, continued or substituted, the plan administrator may make or provide for a cash payment to holders of restricted shares and restricted stock unit awards that will become vested as a result of the sale event in exchange for the cancellation of such stock awards in an amount equal to the value of the consideration payable per share of our common stock pursuant to the sale event times the number of shares subject to the stock awards that will vest.
Under the 2011 Plan, a sale event is generally (1) our dissolution or liquidation, (2) the sale of all or substantially all of our assets, (3) consummation of a merger or consolidation after which the outstanding voting securities held by our stockholders immediately prior to the transaction represent less than a majority of the combined voting power of the outstanding voting securities of the surviving or acquiring entity after the transaction, (4) the acquisition of all or a majority of our outstanding voting stock by a person or group of persons or capital stock or (5) any other acquisition of our business, as determined by the plan administrator.
Amendment and Termination. As noted above, in connection with this offering, our 2011 Plan will be terminated and no further stock awards will be granted thereunder. All outstanding stock awards under the 2011 Plan will continue to be governed by their existing terms.
2015 Employee Stock Purchase Plan
Our board of directors has adopted, and we expect that our stockholders will approve prior to the completion of this offering, our 2015 Employee Stock Purchase Plan, or 2015 ESPP. We do not expect to grant purchase rights under our 2015 ESPP until after the completion of this offering.
Share Reserve. The maximum number of shares of our common stock that may be issued under our 2015 ESPP is shares. Additionally, the number of shares of our common stock reserved for issuance under our 2015 ESPP will automatically increase on January 1 of each year, beginning on January 1, 2016 (assuming the 2015 ESPP becomes effective before such date) and continuing through and including January 1, 2025, by the lesser of (1) % of the total number of shares of our common stock outstanding on December 31 of the preceding calendar year, (2) shares of our common stock or (3) such lesser number of shares of common stock as determined by our board of directors. Shares subject to purchase rights granted under our 2015 Plan that terminate without having been exercised in full will not reduce the number of shares available for issuance under our 2015 ESPP.
Administration. Our board of directors, or a duly authorized committee thereof, will administer our 2015 ESPP. Our board of directors has delegated its authority to administer our 2015 ESPP to our compensation committee under the terms of the compensation committee’s charter.
122
Table of Contents
Limitations. Our employees, including executive officers, and the employees of any of our designated affiliates will be eligible to participate in our 2015 ESPP, provided they may have to satisfy one or more of the following service requirements before participating in our 2015 ESPP, as determined by the administrator: (1) customary employment with us or one of our affiliates for more than 20 hours per week and more than five months per calendar year or (2) continuous employment with us or one of our affiliates for a minimum period of time, not to exceed two years, prior to the first date of an offering. An employee may not be granted rights to purchase stock under our 2015 ESPP (a) if such employee immediately after the grant would own stock possessing 5% or more of the total combined voting power or value of all classes of our common stock or (b) to the extent that such rights would accrue at a rate that exceeds $25,000 worth of our stock for each calendar year that the rights remain outstanding.
Our 2015 ESPP is intended to qualify as an employee stock purchase plan under Section 423 of the Code. The administrator may specify offerings with a duration of not more than 27 months, and may specify one or more shorter purchase periods within each offering. Each offering will have one or more purchase dates on which shares of our common stock will be purchased for the employees who are participating in the offering. The administrator, in its discretion, will determine the terms of offerings under our 2015 ESPP.
A participant may not transfer purchase rights under our 2015 ESPP other than by will, the laws of descent and distribution or as otherwise provided under our 2015 ESPP.
Payroll Deductions. Our 2015 ESPP permits participants to purchase shares of our common stock through payroll deductions up to 15% of their earnings. Unless otherwise determined by the administrator, the purchase price of the shares will be 85% of the lower of the fair market value of our common stock on the first day of an offering or on the date of purchase. Participants may end their participation at any time during an offering and will be paid their accrued contributions that have not yet been used to purchase shares. Participation ends automatically upon termination of employment with us.
Corporate Transactions. In the event of certain specified significant corporate transactions, such as our merger or change in control, a successor corporation may assume, continue or substitute each outstanding purchase right. If the successor corporation does not assume, continue or substitute for the outstanding purchase rights, the offering in progress will be shortened and a new exercise date will be set. The participants’ purchase rights will be exercised on the new exercise date and such purchase rights will terminate immediately thereafter.
Amendment and Termination. Our board of directors has the authority to amend, suspend or terminate our 2015 ESPP, at any time and for any reason, provided certain types of amendments will require the approval of our stockholders. Our 2015 ESPP will remain in effect until terminated by our board of directors in accordance with the terms of the 2015 ESPP.
401(k) Plan
We maintain a defined contribution retirement plan that provides eligible U.S. employees with an opportunity to save for retirement on a tax advantaged basis. Eligible employees may defer eligible compensation on a pre-tax basis, up to the statutorily prescribed annual limits on contributions under the Internal Revenue Code of 1986, as amended. Contributions are allocated to each participant’s individual account and are then invested in selected investment alternatives according to the participants’ directions. Employees are immediately and fully vested in their contributions. The 401(k) plan is intended to be qualified under Section 401(a) of the Code with the 401(k) plan’s related trust intended to be tax exempt under Section 501(a) of the Code. As a tax-qualified retirement plan, contributions to the 401(k) plan and earnings on those contributions are not taxable to the employees until distributed from the 401(k) plan.
Limitations on Liability and Indemnification Matters
Upon completion of this offering, our amended and restated certificate of incorporation will contain provisions that limit the liability of our current and former directors for monetary damages to the fullest extent permitted by
123
Table of Contents
Delaware law. Delaware law provides that directors of a corporation will not be personally liable for monetary damages for any breach of fiduciary duties as directors, except liability for:
| l | any breach of the director’s duty of loyalty to the corporation or its stockholders; |
| l | any act or omission not in good faith or that involves intentional misconduct or a knowing violation of law; |
| l | unlawful payments of dividends or unlawful stock repurchases or redemptions as provided in Section 174 of the Delaware General Corporation Law; or |
| l | any transaction from which the director derived an improper personal benefit. |
This limitation of liability does not apply to liabilities arising under federal securities laws and does not affect the availability of equitable remedies such as injunctive relief or rescission.
Our amended and restated certificate of incorporation and our amended and restated bylaws to be in effect upon the completion of this offering will provide that we are required to indemnify our directors to the fullest extent permitted by Delaware law. Our amended and restated bylaws will also provide that, upon satisfaction of certain conditions, we are required to advance expenses incurred by a director in advance of the final disposition of any action or proceeding, and permit us to secure insurance on behalf of any officer, director, employee or other agent for any liability arising out of his or her actions in that capacity regardless of whether we would otherwise be permitted to indemnify him or her under the provisions of Delaware law. Our amended and restated bylaws will also provide our board of directors with discretion to indemnify our officers and employees when determined appropriate by our board of directors. We have entered and expect to continue to enter into agreements to indemnify our directors, executive officers and other employees as determined by the board of directors. With certain exceptions, these agreements provide for indemnification for related expenses including, among other things, attorneys’ fees, judgments, fines and settlement amounts incurred by any of these individuals in any action or proceeding. We believe that these provisions and agreements are necessary to attract and retain qualified persons as directors and officers. We also maintain customary directors’ and officers’ liability insurance.
The limitation of liability and indemnification provisions in our amended and restated certificate of incorporation and amended and restated bylaws to be in effect upon the completion of this offering may discourage stockholders from bringing a lawsuit against our directors for breach of their fiduciary duty. They may also reduce the likelihood of derivative litigation against our directors and officers, even though an action, if successful, might benefit us and other stockholders. Further, a stockholder’s investment may be adversely affected to the extent that we pay the costs of settlement and damage awards against directors and officers as required by these indemnification provisions. At present, there is no pending litigation or proceeding involving any of our directors, officers or employees for which indemnification is sought and we are not aware of any threatened litigation that may result in claims for indemnification.
Rule 10b5-1 Sales Plans
Our directors and executive officers may adopt written plans, known as Rule 10b5-1 plans, in which they will contract with a broker to buy or sell shares of our common stock on a periodic basis. Under a Rule 10b5-1 plan, a broker executes trades pursuant to parameters established by the director or executive officer when entering into the plan, without further direction from them. The director or executive officer may amend a Rule 10b5-1 plan in some circumstances and may terminate a plan at any time. Our directors and executive officers also may buy or sell additional shares outside of a Rule 10b5-1 plan when they are not in possession of material nonpublic information subject to compliance with the terms of our insider trading policy. Prior to 180 days after the date of this offering, subject to early termination, the sale of any shares under such plan would be subject to the lock-up agreement that the director or executive officer has entered into with the underwriters.
124
Table of Contents
CERTAIN RELATIONSHIPS AND RELATED PARTY TRANSACTIONS
The following is a summary of transactions since January 1, 2012 to which we have been a participant in which the amount involved exceeded or will exceed $120,000, and in which any of our then directors, executive officers or holders of more than 5% of any class of our capital stock at the time of such transaction, or any members of their immediate family, had or will have a direct or indirect material interest, other than compensation arrangements which are described in “Executive and Director Compensation.”
Concurrent Private Placement
Entities affiliated with Technology Crossover Ventures have agreed to purchase $5.0 million of our common stock in a separate private placement concurrent with the completion of this offering at a price per share equal to the initial public offering price. Entities affiliated with Technology Crossover Ventures are holders of more than 5% of our capital stock and Timothy McAdam, a member of our board of directors, is affiliated with such entities.
Series D Preferred Stock Financing
In December 2014, we entered into a Series D Convertible Preferred Stock Purchase Agreement pursuant to which we issued and sold to investors an aggregate of 2,686,516 shares of our Series D preferred stock at a purchase price of $11.554 per share, for aggregate consideration of $31.0 million.
The participants in the Series D preferred stock financing described above included the following of our executive officers and funds affiliated with certain of our directors and holders of more than 5% of our capital stock.
| Related Party |
Shares of Series D Preferred Stock (#) |
|||||
| Entities affiliated with Technology Crossover Ventures(1) |
1,298,252 | |||||
| Entities affiliated with Bain Capital Venture Partners, LLC(2) |
1,285,269 | |||||
| Steven Gatoff |
17,310 | |||||
| Richard Moseley |
8,655 | |||||
| Michael McKee |
6,491 | |||||
| (1) | Consists of 849,507 shares Series D preferred stock purchased by TCV VII, L.P. (“TCV VII”), 441,169 shares of Series D preferred stock purchased by TCV VII (A), L.P. (“TCV VII (A)”) and 7,576 shares of Series D preferred stock purchased by TCV Member Fund, L.P. (“Member Fund”). Technology Crossover Management VII, Ltd. (“TCM VII”) is a general partner of Member Fund and the general partner of Technology Crossover Management VII, L.P. (“Management VII”), which is the direct general partner of each of TCV VII and TCV VII (A), and may be deemed to have the sole voting and dispositive power over the shares held by TCV VII, TCV VII (A) and Member Fund. Timothy McAdam, a member of our board of directors, is a Class A Director of TCM VII and a limited partner of Management VII and Member Fund, and shares voting and dispositive power over the shares held by TCV VII, TCV VII (A) and Member Fund. |
| (2) | Consists of 1,123,487 shares Series D preferred stock purchased by Bain Capital Venture Fund 2007, L.P. (“Fund 2007”), 159,792 shares of Series D preferred stock purchased by BCIP Venture Associates (“BCIP”) and 1,990 shares of Series D preferred stock purchased by BCIP Venture Associates-B (“BCIP-B” and, together with Fund 2007 and BCIP, the “Bain Entities”). Two of the members of our board of directors, Benjamin Holzman and J. Benjamin Nye, are Managing Directors of Bain Capital Venture Investors, LLC (“BCVI”), which is the general partner of Bain Capital Venture Partners 2007, L.P. (“BCVP 2007”), which is the general partner of Fund 2007 and attorney-in-fact for Bain Capital Investors, LLC (“BCILLC”), which is the sole managing partner of each of BCIP and BCIP-B. |
Investors’ Rights, Voting and Co-Sale Agreements
In connection with our preferred stock financings, we entered into investors’ rights, voting and right of first refusal and co-sale agreements containing registration rights, information rights, voting rights and rights of first refusal, among other things, with certain holders of our redeemable convertible preferred stock and certain
125
Table of Contents
holders of our common stock. These stockholder agreements will terminate upon the closing of this offering, except for the registration rights granted under our investors’ rights agreement, as more fully described in “Description of Capital Stock—Registration Rights.”
All holders of more than 5% of our common stock and each of our executive officers, other than Mr. Weiner, are parties to our investors’ rights agreement, voting agreement and right of first refusal and co-sale agreement. Of our directors who are not otherwise holders of more than 5% of our common stock or our executive officers, (1) no such individuals are parties to our investors’ rights agreement and (2) each of Messrs. Sweeney and Young are parties to our voting agreement and right of first refusal and co-sale agreement.
Employment Agreements and Offer Letter Agreements
We have entered into employment agreements or offer letter agreements with our executive officers. For more information regarding these agreements with our named executive officers, see “Executive and Director Compensation—Employment Arrangements.”
Stock Option Grants to Directors and Executive Officers
We have granted stock options to our certain of our directors and executive officers. For more information regarding the stock options and stock awards granted to our directors and named executive officers see “Executive and Director Compensation—Equity Incentive Plans.”
Indemnification Agreements
We plan to enter into indemnification agreements with each of our directors and executive officers in connection with this offering. The indemnification agreements and our amended and restated certificate of incorporation and our amended and restated bylaws to be in effect upon the completion of this offering will require us to indemnify our directors and executive officers to the fullest extent permitted by Delaware law. For more information regarding these agreements, see “Executive and Director Compensation—Limitations on Liability and Indemnification Matters.”
Related Person Transaction Policy
Prior to this offering, we have not had a formal policy regarding approval of transactions with related parties. Prior to the completion of this offering, we expect to adopt a related person transaction policy that sets forth our procedures for the identification, review, consideration and approval or ratification of related person transactions. The policy will become effective immediately upon the execution of the underwriting agreement for this offering. For purposes of our policy only, a related person transaction is a transaction, arrangement or relationship, or any series of similar transactions, arrangements or relationships, in which we and any related person are, were or will be participants in which the amount involved exceeds $120,000. Transactions involving compensation for services provided to us as an employee or director are not covered by this policy. A related person is any executive officer, director or beneficial owner of more than 5% of any class of our voting securities, including any of their immediate family members and any entity owned or controlled by such persons.
Under the policy, if a transaction has been identified as a related person transaction, including any transaction that was not a related person transaction when originally consummated or any transaction that was not initially identified as a related person transaction prior to consummation, our management must present information regarding the related person transaction to our audit committee, or, if audit committee approval would be inappropriate, to another independent body of our board of directors, for review, consideration and approval or ratification. The presentation must include a description of, among other things, the material facts, the interests, direct and indirect, of the related persons, the benefits to us of the transaction and whether the transaction is on terms that are comparable to the terms available to or from, as the case may be, an unrelated third party or to or from employees generally. Under the policy, we will collect information that we deem reasonably necessary
126
Table of Contents
from each director, executive officer and, to the extent feasible, significant stockholder to enable us to identify any existing or potential related person transactions and to effectuate the terms of the policy.
In addition, under our Code of Conduct, which we intend to adopt in connection with this offering, our employees and directors will have an affirmative responsibility to disclose any transaction or relationship that reasonably could be expected to give rise to a conflict of interest.
In considering related person transactions, our audit committee, or other independent body of our board of directors, will take into account the relevant available facts and circumstances including, but not limited to:
| l | the risks, costs and benefits to us; |
| l | the impact on a director’s independence in the event that the related person is a director, immediate family member of a director or an entity with which a director is affiliated; |
| l | the availability of other sources for comparable services or products; and |
| l | the terms available to or from, as the case may be, unrelated third parties or to or from employees generally. |
The policy requires that, in determining whether to approve, ratify or reject a related person transaction, our audit committee, or other independent body of our board of directors, must consider, in light of known circumstances, whether the transaction is in, or is not inconsistent with, our best interests and those of our stockholders, as our audit committee, or other independent body of our board of directors, determines in the good faith exercise of its discretion.
All of the transactions described above were entered into prior to the adoption of the written policy, but all were approved by our board of directors considering similar factors to those described above.
127
Table of Contents
The following table sets forth the beneficial ownership of our common stock as of May 31, 2015, as adjusted to reflect the sale of common stock offered by us in this offering, for:
| l | each person, or group of affiliated persons, who is known by us to beneficially own more than 5% of our common stock; |
| l | each of our named executive officers; |
| l | each of our directors; and |
| l | all of our executive officers and directors as a group. |
The percentage ownership information shown in the table before this offering is based upon shares of common stock outstanding as of May 31, 2015, after giving effect to the conversion of all outstanding shares of preferred stock into shares of our common stock, including the Additional Series D Conversion Shares, which will occur upon the completion of this offering. See “Prospectus Summary—The Offering” for a description of the Additional Series D Conversion Shares as the number of Additional Series D Conversion Shares that will be issued depends on the initial public offering price of our common stock.
The percentage ownership information shown in the table after this offering is based upon shares outstanding, assuming the sale of shares of our common stock by us in the offering, no exercise of the underwriters’ over-allotment option and the sale of shares of our common stock to entities affiliated with Technology Crossover Ventures in the concurrent private placement.
We have determined beneficial ownership in accordance with the rules of the SEC. These rules generally attribute beneficial ownership of securities to persons who possess sole or shared voting power or investment power with respect to those securities. In addition, the rules include shares of common stock issuable pursuant to the exercise of stock options or warrants that are either immediately exercisable or exercisable on or before July 30, 2015, which is 60 days after May 31, 2015. These shares are deemed to be outstanding and beneficially owned by the person holding those options or warrants for the purpose of computing the percentage ownership of that person, but they are not treated as outstanding for the purpose of computing the percentage ownership of any other person. Unless otherwise indicated, the persons or entities identified in this table have sole voting and investment power with respect to all shares shown as beneficially owned by them, subject to applicable community property laws.
128
Table of Contents
Except as otherwise noted below, the address for persons listed in the table is c/o Rapid7, Inc., 100 Summer Street, Boston, Massachusetts 02110.
| Name of Beneficial Owner |
Number of Shares Beneficially Owned |
Percentage of Shares Beneficially Owned |
||||||||||
| Before Offering | After Offering | |||||||||||
| 5% or greater stockholders: |
||||||||||||
| Entities affiliated with Technology Crossover Ventures(1) | 8,188,044 | % | % | |||||||||
| Entities affiliated with Bain Capital Venture Partners, LLC(2) | 8,053,106 | |||||||||||
| John Devine |
3,292,191 | |||||||||||
| Alan Matthews |
3,192,191 | |||||||||||
| Michael Tuchen |
1,746,776 | |||||||||||
| Named executive officers and directors: |
||||||||||||
| Corey Thomas(3) |
1,262,071 | |||||||||||
| Steven Gatoff(4) |
215,377 | |||||||||||
| Lee Weiner(5) |
108,022 | |||||||||||
| Richard Moseley(6) |
43,653 | |||||||||||
| Michael McKee(7) |
52,323 | |||||||||||
| Michael Berry(8) |
49,582 | |||||||||||
| Benjamin Holzman(9) |
— | |||||||||||
| Timothy McAdam(1) |
8,188,044 | |||||||||||
| J. Benjamin Nye(10) |
8,053,106 | |||||||||||
| John Sweeney(11) |
128,774 | |||||||||||
| Christopher Young(12) |
129,057 | |||||||||||
| All current executive officers and directors as a group (12 persons)(13) |
21,422,200 | % | % | |||||||||
| * | Represents beneficial ownership of less than 1%. |
| (1) | Consists of (1) 5,358,652 shares of common stock held by TCV VII, (2) 2,782,875 shares of common stock held by TCV VII (A) and (3) 46,517 shares of common stock held by Member Fund. TCM VII is a general partner of Member Fund and the general partner of Management VII, which is the direct general partner of each of TCV VII and TCV VII (A), and may be deemed to have the sole voting and dispositive power over the shares held by TCV VII, TCV VII (A) and Member Fund. Jay Hoag, Richard Kimball, Jon Reynolds, Jr., John Drew, Robert Trudeau, Christopher Marshall, Timothy McAdam, John Rosenberg, and David Yuan are the Class A Directors of TCM VII and limited partners of Management VII and Member Fund, and share voting and dispositive power over the shares held by TCV VII, TCV VII (A) and Member Fund. Timothy McAdam is a member of our board of directors. The address of the entities affiliated with Technology Crossover Ventures is 528 Ramona Street, Palo Alto, California 94301. |
| (2) | Consists of (1) 7,039,397 shares of common stock held by Fund 2007, (2) 1,001,191 shares of common stock held by BCIP and (3) 12,518 shares of common stock held by BCIP-B. BCVI is the general partner of BCVP 2007, which is the general partner of Fund 2007. BCILLC is the sole managing partner of each of BCIP and BCIP-B. BCVI is attorney-in-fact for BCILLC with respect to the shares reported in the table above. Voting and investment decisions with respect to the shares of common stock held by the Bain Entities are made by the Executive Committee of BCVI, which is comprised of Michael Krupka and J. Benjamin Nye. By virtue of these relationships, Messrs. Krupka and Nye may be deemed to share voting and dispositive power over the shares held by the Bain Entities. The address of the Bain Entities is John Hancock Tower, 200 Clarendon Street, Boston, Massachusetts 02116. |
| (3) | Includes 923,461 shares of common stock issuable upon the exercise of options. |
| (4) | Includes 198,067 shares of common stock issuable upon the exercise of options. |
| (5) | Consists of 108,022 shares of common stock issuable upon the exercise of options. |
| (6) | Includes 34,998 shares of common stock issuable upon the exercise of options. |
| (7) | Includes 45,832 shares of common stock issuable upon the exercise of options. |
| (8) | Consists of 49,582 shares of common stock issuable upon the exercise of options. |
| (9) | Does not include shares of common stock held by the Bain Entities. Mr. Holzman is a Managing Director of BCVI and as a result, and by virtue of the relationships described in the section of this prospectus titled “Certain Relationships and Related Party Transactions—Series D Preferred Stock Financing,” may be deemed to share beneficial ownership of the shares held by the Bain Entities. The |
129
Table of Contents
| address for Mr. Holzman is c/o Bain Capital Venture Partners, LLC, John Hancock Tower, 200 Clarendon Street, Boston, Massachusetts 02116. |
| (10) | Includes shares of common stock held by the Bain Entities. Mr. Nye is a Managing Director and member of the Executive Committee of BCVI and as a result, and by virtue of the relationships described in note 2 above, may be deemed to share beneficial ownership of the shares held by the Bain Entities. The address for Mr. Nye is c/o Bain Capital Venture Partners, LLC, John Hancock Tower, 200 Clarendon Street, Boston, Massachusetts 02116. |
| (11) | Includes 9,582 shares of common stock issuable upon the exercise of options. |
| (12) | Includes (1) 9,582 shares of common stock issuable upon the exercise of options and (2) 53,317 shares of common stock held by the Christopher D. Young Revocable Trust (the “Trust”), of which Christopher Young is the sole trustee. Mr. Young has sole voting and dispositive power over the held shares by the Trust. |
| (13) | Includes 1,379,126 shares of common stock issuable upon the exercise of options. |
130
Table of Contents
The following description of our capital stock, certain provisions of our amended and restated certificate of incorporation and amended and restated bylaws, as each will be in effect upon the completion of this offering, and certain provisions of Delaware law are summaries. You should also refer to the amended and restated certificate of incorporation and the amended and restated bylaws, which are filed as exhibits to the registration statement of which this prospectus is part. We refer in this section to our amended and restated certificate of incorporation and amended and restated bylaws that we intend to adopt in connection with this offering as our certificate of incorporation and bylaws, respectively.
General
Upon the completion of this offering, our certificate of incorporation will authorize us to issue up to 100,000,000 shares of common stock, $0.01 par value per share, and 10,000,000 shares of preferred stock, $0.01 par value per share, all of which shares of preferred stock will be undesignated. Our board of directors may establish the rights, preference and privileges of the preferred stock from time to time. As of March 31, 2015, after giving effect to the conversion of all outstanding preferred stock into shares of our common stock in connection with the completion of the offering, including the Additional Series D Conversion Shares, there would have been shares of common stock issued and outstanding, held of record by 154 stockholders. See “Prospectus Summary—The Offering” for a description of the Additional Series D Conversion Shares as the number of Additional Series D Conversion Shares that will be issued depends on the initial public offering price of our common stock.
Common Stock
Voting Rights
Each holder of our common stock is entitled to one vote for each share on all matters submitted to a vote of the stockholders, including the election of directors. Under our certificate of incorporation and bylaws, our stockholders will not have cumulative voting rights. Because of this, the holders of a majority of the shares of common stock entitled to vote in any election of directors can elect all of the directors standing for election, if they should so choose.
Dividends
Subject to preferences that may be applicable to any then-outstanding preferred stock, holders of common stock are entitled to receive ratably those dividends, if any, as may be declared from time to time by the board of directors out of legally available funds.
Liquidation
In the event of our liquidation, dissolution or winding up, holders of common stock will be entitled to share ratably in the net assets legally available for distribution to stockholders after the payment of all of our debts and other liabilities and the satisfaction of any liquidation preference granted to the holders of any then-outstanding shares of preferred stock.
Rights and Preferences
Holders of common stock have no preemptive, conversion or subscription rights and there are no redemption or sinking fund provisions applicable to the common stock. The rights, preferences and privileges of the holders of common stock are subject to, and may be adversely affected by, the rights of the holders of shares of any series of preferred stock that we may designate in the future.
131
Table of Contents
Preferred Stock
All currently outstanding shares of preferred stock will be converted to common stock upon the completion of this offering.
Following the completion of this offering, our board of directors will have the authority, without further action by our stockholders, to issue up to 10,000,000 shares of preferred stock in one or more series, to establish from time to time the number of shares to be included in each such series, to fix the rights, preferences and privileges of the shares of each wholly unissued series and any qualifications, limitations or restrictions thereon, and to increase or decrease the number of shares of any such series, but not below the number of shares of such series then outstanding.
Our board of directors may authorize the issuance of preferred stock with voting or conversion rights that could adversely affect the voting power or other rights of the holders of our common stock. The purpose of authorizing our board of directors to issue preferred stock and determine its rights and preferences is to eliminate delays associated with a stockholder vote on specific issuances. The issuance of preferred stock, while providing flexibility in connection with possible acquisitions and other corporate purposes, could, among other things, have the effect of delaying, deferring or preventing a change in control of us and may adversely affect the market price of our common stock and the voting and other rights of the holders of our common stock. It is not possible to state the actual effect of the issuance of any shares of preferred stock on the rights of holders of common stock until the board of directors determines the specific rights attached to that preferred stock.
We have no present plans to issue any shares of preferred stock.
Options
As of March 31, 2015, options to purchase an aggregate of 4,006,962 shares of common stock were outstanding under our 2011 Plan at a weighted-average exercise price of $5.44 per share. For additional information regarding the terms of our 2011 Plan, see “Executive and Director Compensation—Equity Incentive Plans—2011 Stock Option and Grant Plan.”
Warrants
As of March 31, 2015, warrants to purchase an aggregate of 200,000 shares of our common stock at an exercise price of $10.00 per share were outstanding. The warrants contain a provision for the adjustment of the exercise price and the number of shares issuable upon the exercise of the applicable warrant in the event of certain stock dividends, stock splits, reorganizations, reclassifications and consolidations.
Registration Rights
After the completion of this offering, certain holders of shares of our common stock, including those shares of our common stock that will be issued upon conversion of our preferred stock in connection with this offering and the Additional Series D Conversion Shares, will be entitled to certain rights with respect to registration of such shares under the Securities Act pursuant to the terms of an investors’ rights agreement. These shares are collectively referred to herein as registrable securities.
The investors’ rights agreement provides the holders of registrable securities with demand, piggyback and S-3 registration rights as described more fully below. As of March 31, 2015, after giving effect to the conversion of all outstanding shares of preferred stock into shares of our common stock in connection with the completion of the offering and the issuance of the Additional Series D Conversion Shares, there would have been an aggregate of registrable securities were entitled to these demand, piggyback and S-3 registration rights.
132
Table of Contents
See “Prospectus Summary—The Offering” for a description of the Additional Series D Conversion Shares as the number of Additional Series D Conversion Shares that will be issued depends on the initial public offering price of our common stock.
Demand Registration Rights
At any time beginning 180 days following the effective date of the registration statement of which this prospectus forms a part, the holders of 20% of the registrable securities held by (i) affiliates of Bain Capital Venture Partners, LLC and (ii) affiliates of Technology Crossover Ventures each respectively have the right to make up to two demands that we file a registration statement under the Securities Act covering at least 40% of the registrable securities then outstanding (or lesser percentage if the proposed aggregate offering price would exceed $15.0 million, net of underwriting discounts and commissions), subject to specified exceptions.
Piggyback Registration Rights
If we register any securities for public sale, the holders of our registrable securities then outstanding will each be entitled to notice of the registration and will have the right to include their shares in the registration statement. The underwriters of any underwritten offering will have the right to limit the number of shares having registration rights to be included in the registration statement, but not below 30% of the total number of securities included in such registration, unless the offering is our initial public offering and the registration does not include shares of any other selling stockholder, in which event any or all of the registrable securities may be excluded from such registration.
Registration on Form S-3
If we are eligible to file a registration statement on Form S-3, the holders of at least 15% of our registrable securities held by (i) affiliates of Bain Capital Venture Partners, LLC and (ii) affiliates of Technology Crossover Ventures each respectively have the right to demand that we file a registration statement on Form S-3 provided that the aggregate amount of securities to be sold under the registration statement is at least $5.0 million, net of underwriting discounts and commissions. Affiliates of Bain Capital Venture Partners, LLC, on the one hand, and affiliates of Technology Crossover Ventures, on the other hand, each respectively may only demand a registration on Form S-3 once during each 12-month period. The right to have such shares registered on Form S-3 is further subject to other specified conditions and limitations.
Expenses of Registration
We will pay all expenses relating to any demand, piggyback or Form S-3 registration, other than underwriting discounts and commissions, subject to specified conditions and limitations.
Termination of Registration Rights
These registration rights will terminate seven years following the completion of this offering, or, with respect to any particular stockholder, when, following the completion of this offering, such stockholder is able to sell all of its shares pursuant to Rule 144 under the Securities Act or a similar exemption during any three-month period without volume limitations.
Anti-Takeover Provisions
Anti-Takeover Statute
Pursuant to our certificate of incorporation to be in effect upon the completion of this offering, we will be subject to Section 203 of the Delaware General Corporation Law, which generally prohibits a publicly held Delaware
133
Table of Contents
corporation from engaging in any business combination with any interested stockholder for a period of three years after the date that such stockholder became an interested stockholder, with the following exceptions:
| l | before such date, the board of directors of the corporation approved either the business combination or the transaction that resulted in the stockholder becoming an interested stockholder; |
| l | upon completion of the transaction that resulted in the stockholder becoming an interested stockholder, the interested stockholder owned at least 85% of the voting stock of the corporation outstanding at the time the transaction began, excluding for purposes of determining the voting stock outstanding, but not the outstanding voting stock owned by the interested stockholder, (1) those shares owned by persons who are directors and also officers and (2) employee stock plans in which employee participants do not have the right to determine confidentially whether shares held subject to the plan will be tendered in a tender or exchange offer; or |
| l | on or after such date, the business combination is approved by the board of directors and authorized at an annual or special meeting of the stockholders, and not by written consent, by the affirmative vote of at least 662/3% of the outstanding voting stock that is not owned by the interested stockholder. |
Section 203 will not apply to any business combination with an interested stockholder who became an interested stockholder prior to the effective date of our certificate of incorporation.
In general, Section 203 defines a “business combination” to include the following:
| l | any merger or consolidation involving the corporation and the interested stockholder; |
| l | any sale, transfer, pledge or other disposition of 10% or more of the assets of the corporation involving the interested stockholder; |
| l | subject to certain exceptions, any transaction that results in the issuance or transfer by the corporation of any stock of the corporation to the interested stockholder; |
| l | any transaction involving the corporation that has the effect of increasing the proportionate share of the stock or any class or series of the corporation beneficially owned by the interested stockholder; or |
| l | the receipt by the interested stockholder of the benefit of any loans, advances, guarantees, pledges or other financial benefits by or through the corporation. |
In general, Section 203 defines an “interested stockholder” as an entity or person who, together with the person’s affiliates and associates, beneficially owns, or within three years prior to the time of determination of interested stockholder status did own, 15% or more of the outstanding voting stock of the corporation.
Anti-Takeover Effects of Certain Provisions of our Certificate of Incorporation and Bylaws to be in Effect Upon the Completion of this Offering
Our certificate of incorporation will provide for our board of directors to be divided into three classes with staggered three-year terms. Only one class of directors will be elected at each annual meeting of our stockholders, with the other classes continuing for the remainder of their respective three-year terms. Because our stockholders do not have cumulative voting rights, stockholders holding a majority of the shares of common stock outstanding will be able to elect all of our directors. Our certificate of incorporation and bylaws will also provide that directors may be removed by the stockholders only for cause upon the vote of 662/3% or more of our outstanding common stock. Furthermore, the authorized number of directors may be changed only by resolution
134
Table of Contents
of the board of directors, and vacancies and newly created directorships on the board of directors may, except as otherwise required by law or determined by the board, only be filled by a majority vote of the directors then serving on the board, even though less than a quorum.
Our certificate of incorporation and bylaws will also provide that all stockholder actions must be effected at a duly called meeting of stockholders and will eliminate the right of stockholders to act by written consent without a meeting. Our bylaws will also provide that only our chairman of the board, chief executive officer or the board of directors pursuant to a resolution adopted by a majority of the total number of authorized directors may call a special meeting of stockholders.
Our bylaws will also provide that stockholders seeking to present proposals before our annual meeting of stockholders or to nominate candidates for election as directors at a meeting of stockholders must provide timely advance notice in writing, and, subject to applicable law, will specify requirements as to the form and content of a stockholder’s notice.
Our certificate of incorporation and bylaws will provide that the stockholders cannot amend many of the provisions described above except by a vote of 662/3% or more of our outstanding common stock.
The combination of these provisions will make it more difficult for our existing stockholders to replace our board of directors as well as for another party to obtain control of us by replacing our board of directors. Since our board of directors has the power to retain and discharge our officers, these provisions could also make it more difficult for existing stockholders or another party to effect a change in management. In addition, the authorization of undesignated preferred stock makes it possible for our board of directors to issue preferred stock with voting or other rights or preferences that could impede the success of any attempt to change our control.
These provisions are intended to enhance the likelihood of continued stability in the composition of our board of directors and its policies and to discourage coercive takeover practices and inadequate takeover bids. These provisions are also designed to reduce our vulnerability to hostile takeovers and to discourage certain tactics that may be used in proxy fights. However, such provisions could have the effect of discouraging others from making tender offers for our shares and may have the effect of delaying changes in our control or management. As a consequence, these provisions may also inhibit fluctuations in the market price of our stock that could result from actual or rumored takeover attempts. We believe that the benefits of these provisions, including increased protection of our potential ability to negotiate with the proponent of an unfriendly or unsolicited proposal to acquire or restructure our company, outweigh the disadvantages of discouraging takeover proposals, because negotiation of takeover proposals could result in an improvement of their terms.
Choice of Forum
Our certificate of incorporation to be in effect upon the completion of this offering will provide that the Court of Chancery of the State of Delaware will be the exclusive forum for any derivative action or proceeding brought on our behalf; any action asserting a breach of fiduciary duty owed by and of our directors, officers or employees to us or our stockholders; any action asserting a claim against us arising pursuant to the Delaware General Corporation Law, our certificate of incorporation or our bylaws; or any action asserting a claim against us that is governed by the internal affairs doctrine. Several lawsuits have been filed in Delaware challenging the enforceability of similar choice of forum provisions and it is possible that a court determines such provisions are not enforceable.
Transfer Agent and Registrar
The transfer agent and registrar for our common stock is . The transfer agent’s address is .
Listing
We have applied for listing of our common stock on the NASDAQ Global Market under the trading symbol “RPD.”
135
Table of Contents
SHARES ELIGIBLE FOR FUTURE SALE
Prior to this offering, no public market existed for our common stock, and although we expect that our common stock will be approved for listing on the NASDAQ Global Market, we cannot assure investors that there will be an active public market for our common stock following this offering. We cannot predict what effect, if any, sales of our shares in the public market or the availability of shares for sale will have on the market price of our common stock. Future sales of substantial amounts of common stock in the public market, including shares issued upon exercise of outstanding options or warrants, or the perception that such sales may occur, however, could adversely affect the market price of our common stock and also could adversely affect our future ability to raise capital through the sale of our common stock or other equity-related securities at times and prices we believe appropriate.
Based on our shares outstanding as of March 31, 2015, upon completion of this offering and the concurrent private placement to entities affiliated with Technology Crossover Ventures, shares of our common stock will be outstanding, or shares of common stock if the underwriters exercise their over-allotment option in full.
All of the shares of common stock sold in this offering will be freely tradable without restrictions or further registration under the Securities Act, except for any shares sold to our “affiliates,” as that term is defined under Rule 144 under the Securities Act. The remaining outstanding shares of common stock held by existing stockholders and to be issued in the concurrent private placement are “restricted securities,” as that term is defined in Rule 144 under the Securities Act. Restricted securities may be sold in the public market only if the offer and sale is registered under the Securities Act or if the offer and sale of those securities qualifies for exemption from registration, including exemptions provided by Rules 144 and 701 promulgated under the Securities Act.
As a result of lock-up agreements and market standoff provisions described below and the provisions of Rules 144 and 701, the restricted securities will be available for sale in the public market as follows:
| l | shares will be eligible for immediate sale upon the completion of this offering and the concurrent private placement; and |
| l | approximately shares will be eligible for sale upon expiration of lock-up agreements and market standoff provisions described below, beginning 181 days after the date of this prospectus, subject in certain circumstances to the volume, manner of sale and other limitations under Rule 144 and Rule 701. |
We may issue shares of our common stock from time to time for a variety of corporate purposes, including in capital-raising activities through future public offerings or private placements, in connection with exercise of stock options and warrants, vesting of restricted stock units and other issuances relating to our employee benefit plans and as consideration for future acquisitions, investments or other purposes. The number of shares of our common stock that we may issue may be significant, depending on the events surrounding such issuances. In some cases, the shares we issue may be freely tradable without restriction or further registration under the Securities Act; in other cases, we may grant registration rights covering the shares issued in connection with these issuances, in which case the holders of the common stock will have the right, under certain circumstances, to cause us to register any resale of such shares to the public.
Rule 144
In general, persons who have beneficially owned restricted shares of our common stock for at least six months, and any affiliate of the company who owns restricted shares of our common stock, are entitled to sell their securities without registration with the SEC under an exemption from registration provided by Rule 144 under the Securities Act.
136
Table of Contents
Non-Affiliates
Any person who is not deemed to have been one of our affiliates at the time of, or at any time during the three months preceding, a sale may sell an unlimited number of restricted securities under Rule 144 if:
| l | the restricted securities have been held for at least six months, including the holding period of any prior owner other than one of our affiliates; |
| l | we have been subject to the Exchange Act periodic reporting requirements for at least 90 days before the sale; and |
| l | we are current in our Exchange Act reporting at the time of sale. |
Any person who is not deemed to have been an affiliate of ours at the time of, or at any time during the three months preceding, a sale and has held the restricted securities for at least one year, including the holding period of any prior owner other than one of our affiliates, will be entitled to sell an unlimited number of restricted securities without regard to the length of time we have been subject to Exchange Act periodic reporting or whether we are current in our Exchange Act reporting.
Affiliates
Persons seeking to sell restricted securities who are our affiliates at the time of, or any time during the three months preceding, a sale, would be subject to the restrictions described above. They are also subject to additional restrictions, by which such person would be required to comply with the manner of sale and notice provisions of Rule 144 and would be entitled to sell within any three-month period only that number of securities that does not exceed the greater of either of the following:
| l | 1% of the number of shares of our common stock then outstanding, which will equal approximately shares immediately after the completion of this offering based on the number of shares outstanding as of March 31, 2015; or |
| l | the average weekly trading volume of our common stock on the NASDAQ Global Market during the four calendar weeks preceding the filing of a notice on Form 144 with respect to the sale. |
Rule 701
In general, under Rule 701 a person who purchased shares of our common stock pursuant to a written compensatory plan or contract and who is not deemed to have been one of our affiliates during the immediately preceding 90 days may sell these shares in reliance upon Rule 144, but without being required to comply with the notice, manner of sale or public information requirements or volume limitation provisions of Rule 144. Rule 701 also permits affiliates to sell their Rule 701 shares under Rule 144 without complying with the holding period requirements of Rule 144. All holders of Rule 701 shares, however, are required to wait until 90 days after the date of this prospectus before selling such shares pursuant to Rule 701. As of March 31, 2015, 3,067,860 shares of our outstanding common stock had been issued in reliance on Rule 701 as a result of exercises of stock options and issuance of restricted stock. However, substantially all Rule 701 shares are subject to lock-up agreements as described below and in “Underwriters” and will become eligible for sale upon the expiration of the restrictions set forth in those agreements.
Form S-8 Registration Statements
As of March 31, 2015, options to purchase an aggregate 4,006,962 of our common stock were outstanding. As soon as practicable after the completion of this offering, we intend to file with the SEC one or more registration
137
Table of Contents
statements on Form S-8 under the Securities Act to register the shares of our common stock that are issuable pursuant to our equity incentive plans, including pursuant to outstanding options. See “Executive and Director Compensation—Equity Incentive Plans” for a description of our equity incentive plans. These registration statements will become effective immediately upon filing. Shares covered by these registration statements will then be eligible for sale in the public markets, subject to vesting restrictions, any applicable lock-up agreements described below and Rule 144 limitations applicable to affiliates.
Lock-Up Agreements
In connection with this offering, we, our directors and officers and substantially all of the holders of equity securities outstanding immediately prior to this offering have agreed, subject to certain exceptions, not to offer, sell, or transfer any common stock or securities convertible into or exchangeable for our common stock for 180 days after the date of this prospectus without the prior written consent of Morgan Stanley & Co. LLC on behalf of the underwriters.
The agreements do not contain any pre-established conditions to the waiver by Morgan Stanley & Co. LLC on behalf of the underwriters of any terms of the lock-up agreements. Any determination to release shares subject to the lock-up agreements would be based on a number of factors at the time of determination, including but not necessarily limited to the market price of the common stock, the liquidity of the trading market for the common stock, general market conditions, the number of shares proposed to be sold, contractual obligations to release certain shares subject to the lock-up agreements in the event any such shares are released, subject to certain specific limitations and thresholds, and the timing, purpose and terms of the proposed sale.
In addition to the restrictions contained in the lock-up agreements described above, we have entered into agreements with certain of our security holders, including our investors’ rights agreement and our standard forms of option agreements under our equity incentive plans, that contain market stand-off provisions imposing restrictions on the ability of such security holders to offer, sell or transfer our equity securities for a period of 180 days following the date of this prospectus.
Registration Rights
Upon the completion of this offering and the concurrent private placement to entities affiliated with Technology Crossover Ventures, the holders of shares of our common stock, or their transferees, will be entitled to specified rights with respect to the registration of the offer and sale of their shares under the Securities Act. Registration of the offer and sale of these shares under the Securities Act would result in the shares becoming freely tradable without restriction under the Securities Act immediately upon the effectiveness of the registration. See “Description of Capital Stock—Registration Rights” for additional information.
138
Table of Contents
MATERIAL U.S. FEDERAL INCOME TAX AND ESTATE CONSIDERATIONS FOR NON-U.S. HOLDERS
The following is a general discussion of the material U.S. federal income and estate tax consequences of the acquisition, ownership and disposition of our common stock by “Non-U.S. Holders” (as defined below). This discussion is for general information purposes only and does not consider all aspects of U.S. federal income taxation that may be relevant to particular Non-U.S. Holders in light of their individual circumstances or to certain types of Non-U.S. Holders subject to special tax rules, including partnerships or other pass-through entities for U.S. federal income tax purposes, banks, financial institutions or other financial services entities, broker-dealers, insurance companies, tax-exempt organizations, regulated investment companies, real estate investment trusts, controlled foreign corporations, passive foreign investment companies, corporations that accumulate earnings to avoid U.S. federal income tax, persons who use or are required to use mark-to-market accounting, persons that hold our shares as part of a “straddle,” a “hedge,” a “conversion transaction,” “synthetic security,” integrated investment or other risk reduction strategy, certain former citizens or permanent residents of the United States, persons who hold or receive shares of our common stock pursuant to the exercise of an employee stock option or otherwise as compensation, or investors in pass-through entities (or entities that are treated as disregarded entities for U.S. federal income tax purposes). In addition, this discussion does not address, except to the extent discussed below, the effects of any applicable gift or estate tax, and this discussion does not address the potential application of the 3.8% Medicare tax on net investment income, the alternative minimum tax, or any tax considerations that may apply to Non-U.S. Holders of our common stock under state, local or non-U.S. tax laws and any other U.S. federal tax laws.
This discussion is based on the Internal Revenue Code of 1986, as amended, or the Code, and applicable Treasury Regulations, rulings, administrative pronouncements and judicial decisions that are issued and available as of the date of this registration statement, all of which are subject to change or differing interpretations at any time with possible retroactive effect. We have not sought, and will not seek, any ruling from the Internal Revenue Service, or the IRS, with respect to the tax consequences discussed herein, and there can be no assurance that the IRS will not take a position contrary to the tax consequences discussed below or that any position taken by the IRS would not be sustained. This discussion is limited to a Non-U.S. Holder who will hold our common stock as a capital asset within the meaning of the Code (generally, property held for investment). For purposes of this discussion, the term “Non-U.S. Holder” means a beneficial owner of our shares that is not a partnership (or entity or arrangement treated as a partnership for U.S. federal income tax purposes) and is not:
| l | an individual who is a citizen or resident of the United States; |
| l | a corporation (or other entity treated as a corporation) created or organized in the United States or under the laws of the United States or of any state thereof or the District of Columbia; |
| l | an estate, the income of which is subject to U.S. federal income tax regardless of its source; or |
| l | a trust if (1) a court within the United States can exercise primary supervision over the trust’s administration and one or more U.S. persons have the authority to control all of the trust’s substantial decisions or (2) the trust has a valid election in effect under applicable U.S. Treasury Regulations to be treated as a U.S. person. |
If a partnership (or entity or arrangement treated as a partnership for U.S. federal income tax purposes) is a beneficial owner of our common stock, the tax treatment of such partnership and a partner in such partnership generally will depend upon the status of the partner and the activities of the partnership. If you are a partner of a partnership holding our shares, you should consult your tax advisor regarding the tax consequences of the purchase, ownership, and disposition of our common stock.
139
Table of Contents
PROSPECTIVE INVESTORS SHOULD CONSULT THEIR TAX ADVISORS REGARDING THE PARTICULAR U.S. FEDERAL INCOME TAX CONSEQUENCES TO THEM OF ACQUIRING, OWNING AND DISPOSING OF OUR COMMON STOCK, AS WELL AS ANY TAX CONSEQUENCES ARISING UNDER ANY STATE, LOCAL OR FOREIGN TAX LAWS AND ANY OTHER U.S. FEDERAL TAX LAWS.
Distributions on Our Common Stock
In general, subject to the discussion below under the headings “Information Reporting and Backup Withholding” and “Foreign Accounts,” distributions, if any, paid on our common stock to a Non-U.S. Holder (to the extent paid out of our current or accumulated earnings and profits, as determined under U.S. federal income tax principles) will constitute dividends and be subject to U.S. withholding tax at a rate equal to 30% of the gross amount of the dividend, or a lower rate prescribed by an applicable income tax treaty, unless the dividends are effectively connected with a trade or business carried on by the Non-U.S. Holder within the United States. Any distribution not constituting a dividend (because such distribution exceeds our current and accumulated earnings and profits) will be treated first as reducing the Non-U.S. Holder’s basis in its shares of common stock, but not below zero, and to the extent it exceeds the Non-U.S. Holder’s basis, as capital gain (see “Gain on Sale, Exchange or Other Taxable Disposition of Common Stock” below).
A Non-U.S. Holder who claims the benefit of an applicable income tax treaty generally will be required to satisfy certain certification and other requirements prior to the distribution date. Such Non-U.S. Holders must generally provide us or our paying agent with a properly executed IRS Form W-8BEN or IRS Form W-8BEN-E (or other appropriate form) claiming an exemption from or reduction in withholding under an applicable income tax treaty. Such certificate must be provided before the payment of dividends and must be updated periodically. If tax is withheld in an amount in excess of the amount applicable under an income tax treaty, a refund of the excess amount may generally be obtained by timely filing an appropriate claim for refund with the IRS. Non-U.S. Holders should consult their tax advisors regarding their entitlement to benefits under an applicable income tax treaty.
Dividends that are effectively connected with a Non-U.S. Holder’s conduct of a U.S. trade or business (and, if required by an applicable income tax treaty, attributable to a U.S. permanent establishment or fixed base of the Non-U.S. Holder) generally will not be subject to U.S. withholding tax if the Non-U.S. Holder files the required forms, including IRS Form W-8ECI with us or our paying agent, but instead generally will be subject to U.S. federal income tax on a net income basis at the regular graduated rates in the same manner as if the Non-U.S. Holder were a resident of the United States. A corporate Non-U.S. Holder that receives effectively connected dividends may be subject to an additional branch profits tax at a rate of 30%, or a lower rate prescribed by an applicable income tax treaty.
Gain on Sale, Exchange or Other Disposition of Our Common Stock
In general, subject to the discussion below under the headings “Information Reporting and Backup Withholding” and “Foreign Accounts,” a non-U.S. holder will not be subject to U.S. federal income tax or withholding tax on any gain realized upon such holder’s sale, exchange or other disposition of shares of our common stock unless:
(1) the gain is effectively connected with a trade or business carried on by the Non-U.S. Holder within the United States (and, if required by an applicable income tax treaty, attributable to a U.S. permanent establishment or fixed base of the Non-U.S. Holder);
(2) the Non-U.S. Holder is an individual who is present in the United States for 183 days or more in the taxable year of disposition and certain other conditions are met; or
(3) we are or have been a “United States real property holding corporation” for U.S. federal income tax purposes at any time during the shorter of the five-year period ending on the date of disposition or the
140
Table of Contents
period that the Non-U.S. Holder held the common stock, and, in the case where shares of our common stock are regularly traded on an established securities market, the Non-U.S. Holder owns, or is treated as owning, more than 5% of our common stock at any time during the foregoing period.
Net gain realized by a Non-U.S. Holder described in clause (1) above generally will be subject to U.S. federal income tax in the same manner as if the Non-U.S. Holder were a resident of the United States. Any gains of a corporate Non-U.S. Holder described in clause (1) above may also be subject to an additional “branch profits tax” at a 30% rate, or such lower rate as may be specified by an applicable income tax treaty.
Gain realized by an individual Non-U.S. Holder described in clause (2) above will be subject to a flat 30% tax, which gain may be offset by U.S. source capital losses, even though the individual is not considered a resident of the United States.
For purposes of clause (3) above, a corporation is a United States real property holding corporation if the fair market value of its United States real property interests equals or exceeds 50% of the sum of the fair market value of its worldwide real property interests plus its other assets used or held for use in a trade or business. We believe that we are not, and we do not anticipate that we will become, a United States real property holding corporation.
U.S. Federal Estate Tax
An individual who at the time of death is not a citizen or resident of the United States and who is treated as the owner of, or has made certain lifetime transfers of, an interest in our common stock will be required to include the value thereof in his or her taxable estate for U.S. federal estate tax purposes, and may be subject to U.S. federal estate tax unless an applicable estate tax treaty provides otherwise. The test for whether an individual is a resident of the United States for U.S. federal estate tax purposes differs from the test used for U.S. federal income tax purposes. Some individuals, therefore, may be “Non-U.S. Holders” for U.S. federal income tax purposes, but not for U.S. federal estate tax purposes, and vice versa.
Information Reporting and Backup Withholding
Generally, we must report annually to the IRS and to each Non-U.S. Holder the amount of dividends paid, the name and address of the recipient, and the amount, if any, of tax withheld. These information reporting requirements apply even if withholding was not required because the dividends were effectively connected with the Non-U.S. Holder’s conduct of a trade or business within the United States or withholding was reduced by an applicable income tax treaty. Under applicable income tax treaties or other agreements, the IRS may make its reports available to the tax authorities in the Non-U.S. Holder’s country of residence or country in which the Non-U.S. Holder was established.
Dividends paid to a Non-U.S. Holder that is not an exempt recipient generally will be subject to backup withholding, currently at a rate of 28%, unless the Non-U.S. Holder certifies to the payor as to its foreign status, which certification may generally be made on an applicable IRS Form W-8.
Proceeds from the sale or other disposition of common stock by a Non-U.S. Holder effected by or through a U.S. office of a broker will generally be subject to information reporting and backup withholding, currently at a rate of 28%, unless the Non-U.S. Holder certifies to the withholding agent under penalties of perjury as to, among other things, its name, address and status as a Non-U.S. Holder or otherwise establishes an exemption. Payment of disposition proceeds effected outside the United States by or through a non-U.S. office of a non-U.S. broker generally will not be subject to information reporting or backup withholding if the payment is not received in the United States. Information reporting, but generally not backup withholding, will apply to such a payment if the broker has certain connections with the United States unless the broker has documentary evidence in its records that the beneficial owner thereof is a Non-U.S. Holder and specified conditions are met or an exemption is otherwise established.
141
Table of Contents
Backup withholding is not an additional tax. Any amount withheld under the backup withholding rules from a payment to a Non-U.S. Holder that results in an overpayment of taxes generally will be refunded, or credited against the holder’s U.S. federal income tax liability, if any, provided that the required information is timely furnished to the IRS.
Foreign Accounts
A U.S. federal withholding tax of 30% may apply to dividends on, and the gross proceeds of, a disposition of our common stock paid to a “foreign financial institution” (as specially defined under applicable rules) unless such institution enters into an agreement with the U.S. government to withhold on certain payments and to collect and provide to the U.S. tax authorities substantial information regarding certain U.S. account holders of such institution (which includes certain equity holders of such institution, as well as certain account holders that are foreign entities with U.S. owners) or otherwise qualifies for an exemption from these rules. This U.S. federal withholding tax of 30% will also apply to payments of dividends on, and the gross proceeds of, a disposition of our common stock paid to a non-financial foreign entity (as specifically defined by applicable rules), unless such entity either certifies it does not have any substantial direct or indirect U.S. owners or provides the withholding agent with a certification identifying substantial direct and indirect U.S. owners of the entity or otherwise qualifies for an exemption from these rules. The withholding tax described above will not apply if the foreign financial institution or non-financial foreign entity otherwise qualifies for an exemption from the rules. Under certain circumstances, a Non-U.S. Holder might be eligible for refunds or credits of such taxes. The U.S. has entered into agreements with certain countries that modify these general rules for entities located in those countries. Prospective investors are encouraged to consult with their own tax advisors regarding the possible implications of these rules on their investment in our common stock.
The withholding provisions described above currently apply to payments of dividends on our common stock and will apply to payments of gross proceeds from a sale or other disposition of our common stock by a foreign financial institution on or after January 1, 2017.
142
Table of Contents
Under the terms and subject to the conditions in an underwriting agreement dated the date of this prospectus, the underwriters named below, for whom Morgan Stanley & Co. LLC and Barclays Capital Inc. are acting as representatives, have severally agreed to purchase, and we have agreed to sell to them, severally, the number of shares indicated below:
| Name |
Number of Shares | |
| Morgan Stanley & Co. LLC |
||
| Barclays Capital Inc. |
||
| Pacific Crest Securities, a division of KeyBanc Capital Markets Inc. |
||
| William Blair & Company, L.L.C. |
||
| Raymond James & Associates, Inc. |
||
| Cowen and Company, LLC |
||
|
| ||
| Total |
||
|
|
The underwriters and the representatives are collectively referred to as the “underwriters” and the “representatives,” respectively. The underwriters are offering the shares of our common stock subject to their acceptance of the shares from us and subject to prior sale. The underwriting agreement provides that the obligations of the several underwriters to pay for and accept delivery of the shares of our common stock offered by this prospectus are subject to the approval of certain legal matters by their counsel and to certain other conditions. The underwriters are obligated to take and pay for all of the shares of our common stock offered by this prospectus if any such shares are taken. However, the underwriters are not required to take or pay for the shares covered by the underwriters’ over-allotment option described below.
The underwriters initially propose to offer part of the shares of our common stock directly to the public at the offering price listed on the cover page of this prospectus and part to certain dealers. After the initial offering of the shares of our common stock, the offering price and other selling terms may from time to time be varied by the representatives.
We have granted to the underwriters an option, exercisable for 30 days from the date of this prospectus, to purchase up to additional shares of our common stock at the public offering price listed on the cover page of this prospectus, less underwriting discounts and commissions. The underwriters may exercise this option solely for the purpose of covering over-allotments, if any, made in connection with the offering of the shares of our common stock offered by this prospectus. To the extent the option is exercised, each underwriter will become obligated, subject to certain conditions, to purchase about the same percentage of the additional shares of our common stock as the number listed next to the underwriter’s name in the preceding table bears to the total number of shares of our common stock listed next to the names of all underwriters in the preceding table.
The following table shows the per share and total public offering price, underwriting discounts and commissions, and proceeds before expenses to us. These amounts are shown assuming both no exercise and full exercise of the underwriters’ option to purchase up to an additional shares of our common stock.
| Total | ||||||||||||
| Per Share | No Exercise | Full Exercise | ||||||||||
| Public offering price |
$ | $ | $ | |||||||||
| Underwriting discounts and commissions to be paid by us |
||||||||||||
| Proceeds, before expenses, to us |
$ | $ | $ | |||||||||
The shares of common stock being purchased by entities affiliated with Technology Crossover Ventures in the concurrent private placement will not be subject to any underwriting discounts or commissions.
143
Table of Contents
The estimated offering expenses payable by us, exclusive of the underwriting discounts and commissions, are approximately $ . We have agreed to reimburse the underwriters for expenses relating to clearance of this offering with the Financial Industry Regulatory Authority, Inc. up to $ .
The underwriters have informed us that they do not intend sales to discretionary accounts to exceed 5% of the total number of shares of our common stock offered by them.
We have applied to list our common stock on the NASDAQ Global Market under the trading symbol “RPD.”
We have agreed that, without the prior written consent of Morgan Stanley & Co. LLC on behalf of the underwriters, we will not, during the period ending 180 days after the date of this prospectus, or the restricted period:
| (1) | offer, pledge, sell, contract to sell, sell any option or contract to purchase, purchase any option or contract to sell, grant any option, right or warrant to purchase, lend or otherwise transfer or dispose of, directly or indirectly, any shares of our common stock or any securities convertible into or exercisable or exchangeable for shares of our common stock; or |
| (2) | enter into any swap or other arrangement that transfers to another, in whole or in part, any of the economic consequences of ownership of our common stock; |
whether any such transaction described above is to be settled by delivery of our common stock or such other securities, in cash or otherwise. In addition, we have agreed that, without the prior written consent of Morgan Stanley & Co. LLC on behalf of the underwriters, we will not, during the restricted period, file any registration statement with the SEC relating to the offering of any shares of our common stock or any securities convertible into or exercisable or exchangeable for our common stock.
The restrictions described in the immediately preceding paragraph do not apply to:
| (1) | the sale of shares of our common stock to the underwriters; |
| (2) | the issuance of shares of our common stock upon the exercise or conversion of a security outstanding on the date of this prospectus and described herein or of which the underwriters have been advised in writing; |
| (3) | the issuance of shares of common stock, options to purchase shares of common stock, or other equity awards pursuant to our employee benefit plans disclosed herein; |
| (4) | the filing of a registration statement on Form S-8 or a successor form thereto; or |
| (5) | the sale or issuance or entry into an agreement to sell or issue shares of common stock in connection with our acquisition of one or more businesses, products or technologies (whether by means of merger, stock purchase, asset purchase or otherwise) or in connection with joint ventures, commercial relationships or other strategic transactions, provided that the aggregate number of shares of common stock that we may sell or issue or agree to sell or issue pursuant to this clause shall not exceed % of the total number of shares of common stock issued and outstanding immediately following the completion of this offering, and provided further that the recipient of such shares of common stock agrees to be bound in writing by an agreement of the same duration and terms as agreed to by us. |
In addition, the holders of an aggregate of % of our outstanding common stock, including all of our directors and officers, have agreed that, without the prior written consent of Morgan Stanley & Co. LLC on behalf of the underwriters, they will not, during the restricted period:
| (1) | offer, pledge, sell, contract to sell, sell any option or contract to purchase, purchase any option or contract to sell, grant any option, right or warrant to purchase, lend or otherwise transfer or dispose of, directly or indirectly, any shares of our common stock or any securities convertible into or exercisable or exchangeable for shares of our common stock; or |
144
Table of Contents
| (2) | enter into any swap or other arrangement that transfers to another, in whole or in part, any of the economic consequences of ownership of our common stock; |
whether any such transaction described above is to be settled by delivery of our common stock or such other securities, in cash or otherwise. In addition, each such person has agreed that, without the prior written consent of Morgan Stanley & Co. LLC on behalf of the underwriters, such person will not, during the restricted period, make any demand for, or exercise any right with respect to, the registration of any shares of our common stock or any security convertible into or exercisable or exchangeable for our common stock.
The restrictions described in the immediately preceding paragraph do not apply to:
| (1) | transactions relating to shares of our common stock or other securities acquired in open market transactions after the completion of this offering, provided that no filing or public announcement under Section 16(a) of the Exchange Act or otherwise shall be required or shall be voluntarily made in connection with subsequent sales of common stock or other securities acquired in such open market transactions; |
| (2) | transfers of shares of our common stock or any security convertible into our common stock as a bona fide gift or charitable contribution; |
| (3) | distributions by any holder of our common stock to limited partners, members or stockholders of such holder or to any corporation, partnership or other business entity that controls, is controlled by or managed by or is under common control with such holder; |
| (4) | any transfer by will or pursuant to the laws of descent and distribution; |
| (5) | any transfer to or from certain trusts or to a stockholder’s family; |
| (6) | the receipt of our common stock upon the exercise of options or any transfer of common stock or securities convertible into common stock upon the exercise of options to purchase our securities on a “cashless” or “net exercise” basis to the extent permitted by the instruments representing such options so long as such exercise is effected solely by the surrender and cancellation of outstanding options; |
| (7) | any transfer by operation of law pursuant to a qualified domestic order or in connection with a divorce settlement; |
| (8) | any transfer of shares of common stock or any security convertible into or exercisable or exchangeable for common stock pursuant to a bona fide third-party tender offer, merger, consolidation or similar transaction made to all holders of common stock involving a change of control, provided that until such tender offer, merger, consolidation or other such transaction is completed, the common stock shall remain subject to the restrictions contained in the applicable agreement; or |
| (9) | the establishment of a trading plan pursuant to Rule 10b5-1 under the Exchange Act for the transfer of shares of common stock, provided that (i) such plan does not provide for the transfer of common stock during the restricted period and (ii) to the extent a public announcement or filing under the Exchange Act or otherwise, if any, is required or voluntarily made regarding the establishment of such plan, such announcement or filing shall include a statement to the effect that no transfer of common stock may be made under such plan during the restricted period; |
provided that in the case of any receipt, transfer or distribution pursuant to clauses (2) through (9), (i) each recipient, transferee, donee or distributee shall sign and deliver, to the extent not previously signed and delivered, a lock-up agreement prior to any transfer or distribution and (ii) no filing or public announcement under Section 16(a) of the Exchange Act or otherwise shall be required or shall be voluntarily made during the restricted period.
145
Table of Contents
Morgan Stanley & Co. LLC, in its sole discretion, may release our common stock and other securities subject to the lock-up agreements described above in whole or in part at any time.
In order to facilitate this offering of our common stock, the underwriters may engage in transactions that stabilize, maintain or otherwise affect the price of our common stock. Specifically, the underwriters may sell more shares than they are obligated to purchase under the underwriting agreement, creating a short position. A short sale is covered if the short position is no greater than the number of shares available for purchase by the underwriters under the over-allotment option. The underwriters can close out a covered short sale by exercising the over-allotment option or purchasing shares in the open market. In determining the source of shares to close out a covered short sale, the underwriters will consider, among other things, the open market price of shares compared to the price available under the over-allotment option. The underwriters may also sell shares in excess of the over-allotment option, creating a naked short position. The underwriters must close out any naked short position by purchasing shares in the open market. A naked short position is more likely to be created if the underwriters are concerned that there may be downward pressure on the price of our common stock in the open market after pricing that could adversely affect investors who purchase in this offering. As an additional means of facilitating this offering, the underwriters may bid for, and purchase, shares of our common stock in the open market to stabilize the price of our common stock. These activities may raise or maintain the market price of our common stock above independent market levels or prevent or retard a decline in the market price of our common stock. The underwriters are not required to engage in these activities and may end any of these activities at any time. The underwriters may also impose a penalty bid. This occurs when a particular underwriter repays to the underwriters a portion of the underwriting discount received by it because the representatives have repurchased shares sold by or for the account of such underwriter in stabilizing or short covering transactions.
We and the underwriters have agreed to indemnify each other against certain liabilities, including liabilities under the Securities Act.
A prospectus in electronic format may be made available on websites maintained by one or more underwriters, or selling group members, if any, participating in this offering. The representatives may agree to allocate a number of shares of our common stock to underwriters for sale to their online brokerage account holders. Internet distributions will be allocated by the representatives to underwriters that may make internet distributions on the same basis as other allocations.
The underwriters and their respective affiliates are full service financial institutions engaged in various activities, which may include securities trading, commercial and investment banking, financial advisory, investment management, investment research, principal investment, hedging, financing and brokerage activities. Certain of the underwriters and their respective affiliates have, from time to time, performed, and may in the future perform, various financial advisory and investment banking services for us, for which they received or will receive customary fees and expenses.
In addition, in the ordinary course of their various business activities, the underwriters and their respective affiliates may make or hold a broad array of investments and actively trade debt and equity securities (or related derivative securities) and financial instruments (including bank loans) for their own account and for the accounts of their customers and may at any time hold long and short positions in such securities and instruments. Such investment and securities activities may involve our securities and instruments. The underwriters and their respective affiliates may also make investment recommendations or publish or express independent research views in respect of such securities or instruments and may at any time hold, or recommend to clients that they acquire, long or short positions in such securities and instruments.
In the ordinary course of business, we have sold, and may in the future sell, products or services to one or more of the underwriters or their respective affiliates in arms’-length transactions on market competitive terms.
146
Table of Contents
Pricing of the Offering
Prior to the completion of this offering, there has been no public market for our common stock. The initial public offering price was determined by negotiations between us and the representatives. Among the factors considered in determining the initial public offering price were our future prospects and those of our industry in general, our sales, earnings and certain other financial and operating information in recent periods, and the price-earnings ratios, price-sales ratios, market prices of securities, and certain financial and operating information of companies engaged in activities similar to ours. The estimated initial public offering price range set forth on the cover of this preliminary prospectus is subject to change as a result of market conditions and other factors. Neither we nor the underwriters can assure investors that an active trading market for the shares will develop or that after the offering the shares will trade in the public market at or above the initial public offering price.
Directed Share Program
At our request, the underwriters have reserved up to % of the shares of our common stock being offered by this prospectus for sale at the initial public offering price to our directors, officers and employees and their friends and family members. The number of shares of our common stock available for sale to the general public will be reduced to the extent these individuals purchase such reserved shares. Any reserved shares that are not so purchased will be offered by the underwriters to the general public on the same basis as the other shares offered by this prospectus. The shares sold in our directed share program will not be subject to lock-up agreements except to the extent that the purchasers of such shares are otherwise subject to such agreements as a result of their relationships with us.
Selling Restrictions
European Economic Area
In relation to each Member State of the European Economic Area that has implemented the Prospectus Directive (each, a Relevant Member State), an offer to the public of any shares of our common stock may not be made in that Relevant Member State, except that an offer to the public in that Relevant Member State of any shares of our common stock may be made at any time under the following exemptions under the Prospectus Directive, if they have been implemented in that Relevant Member State:
| l | to any legal entity which is a qualified investor as defined in the Prospectus Directive; |
| l | to fewer than 100 or, if the Relevant Member State has implemented the relevant provision of the 2010 PD Amending Directive, 150, natural or legal persons (other than qualified investors as defined in the Prospectus Directive), as permitted under the Prospectus Directive, subject to obtaining the prior consent of the representatives for any such offer; or |
| l | in any other circumstances falling within Article 3(2) of the Prospectus Directive, provided that no such offer of shares of our common stock shall result in a requirement for the publication by us or any underwriter of a prospectus pursuant to Article 3 of the Prospectus Directive. |
For the purposes of this provision, (i) the expression an “offer to the public” in relation to any shares of our common stock in any Relevant Member State means the communication in any form and by any means of sufficient information on the terms of the offer and any shares of our common stock to be offered so as to enable an investor to decide to purchase any shares of our common stock, as the same may be varied in that Member State by any measure implementing the Prospectus Directive in that Member State, (ii) the expression “Prospectus Directive” means Directive 2003/71/EC (and amendments thereto, including the 2010 PD Amending Directive, to the extent implemented in the Relevant Member State), and includes any relevant implementing measure in the Relevant Member State, and (iii) the expression “2010 PD Amending Directive” means Directive 2010/73/EU.
147
Table of Contents
United Kingdom
Each underwriter has represented and agreed that:
| l | it has only communicated or caused to be communicated and will only communicate or cause to be communicated an invitation or inducement to engage in investment activity (within the meaning of Section 21 of the Financial Services and Markets Act 2000 (FSMA)) received by it in connection with the issue or sale of the shares of our common stock in circumstances in which Section 21(1) of the FSMA does not apply to us; and |
| l | it has complied and will comply with all applicable provisions of the FSMA with respect to anything done by it in relation to the shares of our common stock in, from or otherwise involving the United Kingdom. |
Hong Kong
Shares of our common stock may not be offered or sold by means of any document other than (i) in circumstances which do not constitute an offer to the public within the meaning of the Companies Ordinance (Cap.32, Laws of Hong Kong), (ii) to “professional investors” within the meaning of the Securities and Futures Ordinance (Cap.571, Laws of Hong Kong) and any rules made thereunder, or (iii) in other circumstances that do not result in the document being a “prospectus” within the meaning of the Companies Ordinance (Cap.32, Laws of Hong Kong), and no advertisement, invitation or document relating to shares of our common stock may be issued or may be in the possession of any person for the purpose of issue (in each case whether in Hong Kong or elsewhere), which is directed at, or the contents of which are likely to be accessed or read by, the public in Hong Kong (except if permitted to do so under the laws of Hong Kong), other than with respect to shares of our common stock that are or are intended to be disposed of only to persons outside Hong Kong or only to “professional investors” within the meaning of the Securities and Futures Ordinance (Cap. 571, Laws of Hong Kong) and any rules made thereunder.
Japan
Shares of our common stock have not been and will not be registered under the Financial Instruments and Exchange Law of Japan (the Financial Instruments and Exchange Law) and each underwriter has agreed that it will not offer or sell any shares of our common stock, directly or indirectly, in Japan or to, or for the benefit of, any resident of Japan (which term as used herein means any person resident in Japan, including any corporation or other entity organized under the laws of Japan), or to others for re-offering or resale, directly or indirectly, in Japan or to a resident of Japan, except pursuant to an exemption from the registration requirements of, and otherwise in compliance with, the Financial Instruments and Exchange Law and any other applicable laws, regulations and ministerial guidelines of Japan.
Singapore
This prospectus has not been registered as a prospectus with the Monetary Authority of Singapore. Accordingly, this prospectus and any other document or material in connection with the offer or sale, or invitation for subscription or purchase, of shares of our common stock may not be circulated or distributed, nor may the shares of our common stock be offered or sold, or be made the subject of an invitation for subscription or purchase, whether directly or indirectly, to persons in Singapore other than (i) to an institutional investor under Section 274 of the Securities and Futures Act, Chapter 289 of Singapore (the SFA), (ii) to a relevant person, or any person pursuant to Section 275(1A), and in accordance with the conditions specified in Section 275 of the SFA or (iii) otherwise pursuant to, and in accordance with the conditions of, any other applicable provision of the SFA.
Where shares of our common stock are subscribed or purchased under Section 275 by a relevant person that is: (i) a corporation (which is not an accredited investor) the sole business of which is to hold investments and the
148
Table of Contents
entire share capital of which is owned by one or more individuals, each of whom is an accredited investor; or (ii) a trust (where the trustee is not an accredited investor) whose sole purpose is to hold investments and each beneficiary is an accredited investor, shares, debentures and units of shares and debentures of that corporation or the beneficiaries’ rights and interest in that trust shall not be transferable for 6 months after that corporation or that trust has acquired shares of our common stock under Section 275 except: (1) to an institutional investor under Section 274 of the SFA or to a relevant person, or any person pursuant to Section 275(1A), and in accordance with the conditions specified in Section 275 of the SFA; (2) where no consideration is given for the transfer; or (3) by operation of law.
149
Table of Contents
The validity of the shares of common stock being offered by this prospectus will be passed upon for us by Cooley LLP, Boston, Massachusetts. Orrick, Herrington & Sutcliffe LLP, New York, New York, is representing the underwriters in connection with this offering.
The consolidated financial statements of Rapid7, Inc. as of December 31, 2013 and 2014, and for each of the years in the three-year period ended December 31, 2014, have been included herein and in the registration statement in reliance on the report of KPMG LLP, an independent registered public accounting firm, appearing elsewhere herein, and upon the authority of said firm as experts in accounting and auditing.
CHANGE IN INDEPENDENT ACCOUNTING FIRM
On March 14, 2013, we dismissed PricewaterhouseCoopers LLP as our independent auditor. Our board of directors participated in and approved the decision to change our independent auditor. PricewaterhouseCoopers LLP did not audit any of our financial statements as of any date or for any period subsequent to December 31, 2011. During the period from January 1, 2013 through March 14, 2013, there were no disagreements with PricewaterhouseCoopers LLP on any matter of accounting principles or practices, financial statement disclosure or auditing scope or procedure, which disagreements if not resolved to the satisfaction of PricewaterhouseCoopers LLP would have caused them to make reference thereto in their report on our financial statements for such year.
We have requested that PricewaterhouseCoopers LLP furnish us with a letter addressed to the Securities and Exchange Commission stating whether or not it agrees with the above statements. A copy of such letter, dated April 29, 2015, is filed as Exhibit 16.1 to the registration statement of which this prospectus is a part.
WHERE YOU CAN FIND ADDITIONAL INFORMATION
We have filed with the SEC a registration statement on Form S-1 under the Securities Act, with respect to the shares of common stock being offered by this prospectus, which constitutes a part of the registration statement. This prospectus, which constitutes part of the registration statement, does not contain all of the information in the registration statement and its exhibits. For further information with respect to us and the common stock offered by this prospectus, we refer you to the registration statement and its exhibits. Statements contained in this prospectus as to the contents of any contract or any other document referred to are not necessarily complete, and in each instance, we refer you to the copy of the contract or other document filed as an exhibit to the registration statement. Each of these statements is qualified in all respects by this reference.
You can read our SEC filings, including the registration statement, over the internet at the SEC’s website at www.sec.gov. You may also read and copy any document we file with the SEC at its public reference facilities at 100 F Street, N.E., Washington, D.C. 20549. You may also obtain copies of these documents at prescribed rates by writing to the Public Reference Section of the SEC at 100 F Street, N.E., Washington, D.C. 20549. Please call the SEC at 1-800-SEC-0330 for further information on the operation of the public reference facilities.
Upon completion of this offering, we will be subject to the information reporting requirements of the Exchange Act, and we will file reports, proxy statements and other information with the SEC. These reports, proxy statements and other information will be available for inspection and copying at the public reference room and web site of the SEC referred to above. We also maintain a website at www.rapid7.com, at which you may access these materials free of charge as soon as reasonably practicable after they are electronically filed with, or furnished to, the SEC. However, the information contained in or accessible through our website is not part of this prospectus or the registration statement of which this prospectus forms a part, and investors should not rely on such information in making a decision to purchase our common stock in this offering.
150
Table of Contents
| Page | ||||
| F-2 | ||||
| F-3 | ||||
| F-4 | ||||
| F-5 | ||||
| F-6 | ||||
| F-7 | ||||
F-1
Table of Contents
Report of Independent Registered Public Accounting Firm
The Board of Directors and Stockholders
Rapid7, Inc.:
We have audited the accompanying consolidated balance sheets of Rapid7, Inc. and subsidiaries as of December 31, 2013 and 2014, and the related consolidated statements of operations, changes in redeemable convertible preferred stock and stockholders’ deficit, and cash flows for each of the years in the three-year period ended December 31, 2014. These consolidated financial statements are the responsibility of the Company’s management. Our responsibility is to express an opinion on these consolidated financial statements based on our audits.
We conducted our audits in accordance with the standards of the Public Company Accounting Oversight Board (United States). Those standards require that we plan and perform the audit to obtain reasonable assurance about whether the financial statements are free of material misstatement. An audit includes examining, on a test basis, evidence supporting the amounts and disclosures in the financial statements. An audit also includes assessing the accounting principles used and significant estimates made by management, as well as evaluating the overall financial statement presentation. We believe that our audits provide a reasonable basis for our opinion.
In our opinion, the consolidated financial statements referred to above present fairly, in all material respects, the financial position of Rapid7, Inc. and subsidiaries as of December 31, 2013 and 2014, and the results of their operations and their cash flows for each of the years in the three-year period ended December 31, 2014, in conformity with U.S. generally accepted accounting principles.
/s/ KPMG LLP
Boston, Massachusetts
April 29, 2015
F-2
Table of Contents
RAPID7, INC.
(in thousands, except share and per share data)
|
December 31, |
March 31, 2015 (Unaudited) |
Pro Forma at March 31, 2015 (Unaudited) |
||||||||||||||
| Assets | 2013 | 2014 | ||||||||||||||
| Current assets: |
||||||||||||||||
| Cash |
$ | 20,612 | $ | 36,823 | $ | 33,343 | $ | |||||||||
| Accounts receivable, net |
19,475 | 25,412 | 21,027 | |||||||||||||
| Prepaid expenses and other current assets |
2,023 | 4,209 | 4,995 | |||||||||||||
|
|
|
|
|
|
|
|
|
|||||||||
| Total current assets |
42,110 | 66,444 | 59,365 | — | ||||||||||||
| Property and equipment, net |
4,278 | 7,922 | 7,619 | |||||||||||||
| Goodwill |
11,265 | 11,265 | 11,265 | |||||||||||||
| Intangible assets, net |
2,025 | 1,156 | 953 | |||||||||||||
| Other assets |
177 | 179 | 180 | |||||||||||||
|
|
|
|
|
|
|
|
|
|||||||||
| Total assets |
$ | 59,855 | $ | 86,966 | $ | 79,382 | $ | — | ||||||||
|
|
|
|
|
|
|
|
|
|||||||||
| Liabilities, Redeemable Convertible Preferred Stock and Stockholders’ Deficit |
|
|||||||||||||||
| Current liabilities: |
||||||||||||||||
| Accounts payable |
$ | 2,969 | $ | 3,536 | $ | 2,892 | $ | |||||||||
| Accrued expenses |
9,062 | 11,907 | 7,956 | |||||||||||||
| Deferred revenue, current portion |
40,761 | 58,164 | 60,539 | |||||||||||||
| Term loan payable, net of unamortized debt discount |
— | — | 1,703 | |||||||||||||
| Contingent consideration |
1,416 | — | — | |||||||||||||
| Other current liabilities |
457 | 642 | 887 | |||||||||||||
|
|
|
|
|
|
|
|
|
|||||||||
| Total current liabilities |
54,665 | 74,249 | 73,977 | — | ||||||||||||
| Deferred revenue, non-current portion |
19,094 | 26,892 | 28,104 | |||||||||||||
| Term loan payable, net of unamortized debt discount |
16,318 | 16,871 | 15,306 | |||||||||||||
| Other long-term liabilities |
2,355 | 4,218 | 3,958 | |||||||||||||
|
|
|
|
|
|
|
|
|
|||||||||
| Total liabilities |
92,432 | 122,230 | 121,345 | — | ||||||||||||
| Commitments and contingencies (note 12) |
||||||||||||||||
| Redeemable convertible preferred stock: |
||||||||||||||||
| Series A redeemable convertible preferred stock, $0.01 par value per share; 6,303,033 shares authorized, issued and outstanding at December 31, 2013 and 2014 and March 31, 2015 (unaudited) with aggregate liquidation value of $8,770, $9,252 and $9,378 at December 31, 2013 and 2014 and March 31, 2015 (unaudited), respectively |
54,962 | 68,892 | 74,061 | |||||||||||||
| Series B redeemable convertible preferred stock, $0.01 par value per share; 519,269 shares authorized, issued and outstanding at December 31, 2013 and 2014 and March 31, 2015 (unaudited) with aggregate liquidation value of $833, $880 and $892 at December 31, 2013 and 2014 and March 31, 2015 (unaudited), respectively |
4,538 | 5,681 | 6,101 | |||||||||||||
| Series C redeemable convertible preferred stock, $0.01 par value per share; 6,873,797 shares authorized, issued and outstanding at December 31, 2013 and 2014 and March 31, 2015 (unaudited) with aggregate liquidation value of $56,494, $59,829 and $60,700 at December 31, 2013 and 2014 and March 31, 2015 (unaudited), respectively |
68,944 | 80,286 | 83,310 | |||||||||||||
| Series D redeemable convertible preferred stock, $0.01 par value per share; 0 shares authorized at December 31, 2013 and 2,696,504 shares authorized at December 31, 2014 and March 31, 2015 (unaudited); 0 shares issued and outstanding at December 31, 2013 and 2,686,576 shares issued and outstanding at December 31, 2014 and March 31, 2015 (unaudited), with aggregate liquidation value of $0, $31,143 and $31,565 at December 31, 2013 and 2014 and March 31, 2015 (unaudited), respectively |
— | 56,739 | 59,399 | |||||||||||||
| Stockholders’ deficit: |
||||||||||||||||
| Common stock, $0.01 par value per share; 31,550,823 shares authorized at December 31, 2013 and 35,700,000 shares authorized at December 31, 2014 and March 31, 2015 (unaudited); 12,763,521, 12,563,095 and 12,699,802 shares issued and outstanding at December 31, 2013 and 2014 and March 31, 2015 (unaudited), respectively |
128 | 126 | 127 | |||||||||||||
| Accumulated deficit |
(161,149 | ) | (243,462 | ) | (261,435 | ) | ||||||||||
| Treasury stock, at cost, 0 shares at December 31, 2013 and 401,626 shares at December 31, 2014 and March 31, 2015 (unaudited), respectively |
— | (3,526 | ) | (3,526 | ) | |||||||||||
|
|
|
|
|
|
|
|
|
|||||||||
| Total stockholders’ deficit |
(161,021 | ) | (246,862 | ) | (264,834 | ) | — | |||||||||
|
|
|
|
|
|
|
|
|
|||||||||
| Total liabilities, redeemable convertible preferred stock and stockholders’ deficit |
$ | 59,855 | $ | 86,966 | $ | 79,382 | $ | — | ||||||||
|
|
|
|
|
|
|
|
|
|||||||||
See accompanying notes to consolidated financial statements.
F-3
Table of Contents
RAPID7, INC.
Consolidated Statements of Operations
(in thousands, except share and per share data)
| Year Ended December 31, | Three Months Ended March 31, | |||||||||||||||||||
| 2012 | 2013 | 2014 | 2014 | 2015 | ||||||||||||||||
| (Unaudited) | ||||||||||||||||||||
| Revenue: |
||||||||||||||||||||
| Products |
$ | 29,414 | $ | 38,633 | $ | 47,030 | $ | 10,615 | $ | 13,645 | ||||||||||
| Maintenance and support |
9,727 | 14,017 | 19,016 | 4,145 | 5,799 | |||||||||||||||
| Professional services |
6,903 | 7,380 | 10,834 | 1,976 | 4,127 | |||||||||||||||
|
|
|
|
|
|
|
|
|
|
|
|||||||||||
| Total revenue |
46,044 | 60,030 | 76,880 | 16,736 | 23,571 | |||||||||||||||
| Cost of revenue: |
||||||||||||||||||||
| Products |
1,691 | 4,048 | 4,557 | 1,239 | 1,546 | |||||||||||||||
| Maintenance and support |
2,069 | 3,388 | 4,495 | 988 | 1,210 | |||||||||||||||
| Professional services |
4,462 | 5,442 | 9,420 | 1,631 | 3,736 | |||||||||||||||
|
|
|
|
|
|
|
|
|
|
|
|||||||||||
| Total cost of revenue |
8,222 | 12,878 | 18,472 | 3,858 | 6,492 | |||||||||||||||
|
|
|
|
|
|
|
|
|
|
|
|||||||||||
| Total gross profit |
37,822 | 47,152 | 58,408 | 12,878 | 17,079 | |||||||||||||||
|
|
|
|
|
|
|
|
|
|
|
|||||||||||
| Operating expenses: |
||||||||||||||||||||
| Research and development |
17,820 | 21,411 | 25,570 | 6,120 | 6,414 | |||||||||||||||
| Sales and marketing |
23,278 | 31,779 | 49,007 | 11,004 | 13,230 | |||||||||||||||
| General and administrative |
9,436 | 12,586 | 12,972 | 3,482 | 4,053 | |||||||||||||||
|
|
|
|
|
|
|
|
|
|
|
|||||||||||
| Total operating expenses |
50,534 | 65,776 | 87,549 | 20,606 | 23,697 | |||||||||||||||
|
|
|
|
|
|
|
|
|
|
|
|||||||||||
| Loss from operations |
(12,712 | ) | (18,624 | ) | (29,141 | ) | (7,728 | ) | (6,618 | ) | ||||||||||
| Other income (expense), net: |
||||||||||||||||||||
| Interest income (expense), net |
(71 | ) | (122 | ) | (2,802 | ) | (695 | ) | (685 | ) | ||||||||||
| Other income (expense), net |
(29 | ) | 43 | (305 | ) | 41 | (305 | ) | ||||||||||||
|
|
|
|
|
|
|
|
|
|
|
|||||||||||
| Loss before income taxes |
(12,812 | ) | (18,703 | ) | (32,248 | ) | (8,382 | ) | (7,608 | ) | ||||||||||
| Provision for (benefit from) income taxes |
(418 | ) | 170 | 379 | 96 | 74 | ||||||||||||||
|
|
|
|
|
|
|
|
|
|
|
|||||||||||
| Net loss |
(12,394 | ) | (18,873 | ) | (32,627 | ) | (8,478 | ) | (7,682 | ) | ||||||||||
| Accretion of preferred stock to redemption value |
(25,606 | ) | (33,553 | ) | (52,336 | ) | (12,178 | ) | (11,273 | ) | ||||||||||
|
|
|
|
|
|
|
|
|
|
|
|||||||||||
| Net loss attributable to common stockholders, basic and diluted (note 11) |
$ | (38,000 | ) | $ | (52,426 | ) | $ | (84,963 | ) | $ | (20,656 | ) | $ | (18,955 | ) | |||||
|
|
|
|
|
|
|
|
|
|
|
|||||||||||
| Net loss per share attributable to common stockholders, basic and diluted |
$ | (3.09 | ) | $ | (4.18 | ) | $ | (6.65 | ) | $ | (1.62 | ) | $ | (1.50 | ) | |||||
|
|
|
|
|
|
|
|
|
|
|
|||||||||||
| Weighted-average common shares outstanding, basic and diluted |
12,308,428 | 12,549,266 | 12,770,916 | 12,716,675 | 12,642,188 | |||||||||||||||
|
|
|
|
|
|
|
|
|
|
|
|||||||||||
| Pro forma net loss per share attributable to common stockholders, basic and diluted (note 11) (unaudited) |
$ | $ | ||||||||||||||||||
|
|
|
|
|
|||||||||||||||||
| Pro forma weighted-average common shares outstanding, basic and diluted (unaudited) |
||||||||||||||||||||
|
|
|
|
|
|||||||||||||||||
See accompanying notes to consolidated financial statements.
F-4
Table of Contents
RAPID7, INC.
Consolidated Statements of Changes in Redeemable Convertible Preferred Stock and Stockholders’ Deficit
(in thousands, except share data)
| Series A redeemable convertible preferred stock |
Series B redeemable convertible preferred stock |
Series C redeemable convertible preferred stock |
Series D redeemable convertible preferred stock |
Common stock | Additional paid-in capital |
Accumulated deficit |
Treasury stock | Total stockholders’ deficit |
||||||||||||||||||||||||||||||||||||||||||||||||||||
| Shares | Amount | Shares | Amount | Shares | Amount | Shares | Amount | Shares | Amount | Shares | Amount | |||||||||||||||||||||||||||||||||||||||||||||||||
| Balance, December 31, 2011 |
6,303,033 | $ | 17,712 | 551,259 | $ | 1,658 | 6,873,797 | $ | 49,973 | — | $ | — | 12,776,644 | $ | 128 | $ | — | $ | (74,812 | ) | — | $ | — | $ | (74,684 | ) | ||||||||||||||||||||||||||||||||||
| Stock-based compensation expense |
— | — | — | — | — | — | — | — | — | — | 1,720 | — | — | — | 1,720 | |||||||||||||||||||||||||||||||||||||||||||||
| Accretion of preferred stock to redemption value |
— | 17,081 | — | 1,297 | — | 7,228 | — | — | — | — | (967 | ) | (24,639 | ) | — | — | (25,606 | ) | ||||||||||||||||||||||||||||||||||||||||||
| Issuance of stock and options associated with acquisition |
— | — | — | — | — | — | — | — | 411,379 | 4 | 2,127 | — | — | — | 2,131 | |||||||||||||||||||||||||||||||||||||||||||||
| Issuance costs associated with Series C redeemable convertible preferred stock |
— | — | — | — | — | (11 | ) | — | — | — | — | — | — | — | — | — | ||||||||||||||||||||||||||||||||||||||||||||
| Purchase of redeemable convertible preferred and common stock |
— | — | (31,990 | ) | (47 | ) | — | — | — | — | (862,382 | ) | (9 | ) | (3,018 | ) | (186 | ) | — | — | (3,213 | ) | ||||||||||||||||||||||||||||||||||||||
| Issuance of common stock upon exercise of stock options |
— | — | — | — | — | — | — | — | 207,886 | 2 | 138 | — | — | — | 140 | |||||||||||||||||||||||||||||||||||||||||||||
| Net loss |
— | — | — | — | — | — | — | — | — | — | — | (12,394 | ) | — | — | (12,394 | ) | |||||||||||||||||||||||||||||||||||||||||||
|
|
|
|
|
|
|
|
|
|
|
|
|
|
|
|
|
|
|
|
|
|
|
|
|
|
|
|
|
|
|
|||||||||||||||||||||||||||||||
| Balance, December 31, 2012 |
6,303,033 | $ | 34,793 | 519,269 | $ | 2,908 | 6,873,797 | $ | 57,190 | — | $ | — | 12,533,527 | $ | 125 | $ | — | $ | (112,031 | ) | — | $ | — | $ | (111,906 | ) | ||||||||||||||||||||||||||||||||||
|
|
|
|
|
|
|
|
|
|
|
|
|
|
|
|
|
|
|
|
|
|
|
|
|
|
|
|
|
|
|
|||||||||||||||||||||||||||||||
| Stock-based compensation expense |
— | — | — | — | — | — | — | — | — | — | 2,047 | — | — | — | 2,047 | |||||||||||||||||||||||||||||||||||||||||||||
| Accretion of preferred stock to redemption value |
— | 20,169 | — | 1,630 | — | 11,754 | — | — | — | — | (3,308 | ) | (30,245 | ) | — | — | (33,553 | ) | ||||||||||||||||||||||||||||||||||||||||||
| Issuance of common stock warrants |
— | — | — | — | — | — | — | — | — | — | 1,007 | — | — | — | 1,007 | |||||||||||||||||||||||||||||||||||||||||||||
| Issuance of common stock upon exercise of stock options, net of stock withheld for taxes |
— | — | — | — | — | — | — | — | 229,994 | 3 | 254 | — | — | — | 257 | |||||||||||||||||||||||||||||||||||||||||||||
| Net loss |
— | — | — | — | — | — | — | — | — | — | — | (18,873 | ) | — | — | (18,873 | ) | |||||||||||||||||||||||||||||||||||||||||||
|
|
|
|
|
|
|
|
|
|
|
|
|
|
|
|
|
|
|
|
|
|
|
|
|
|
|
|
|
|
|
|||||||||||||||||||||||||||||||
| Balance, December 31, 2013 |
6,303,033 | $ | 54,962 | 519,269 | $ | 4,538 | 6,873,797 | $ | 68,944 | — | $ | — | 12,763,521 | $ | 128 | $ | — | $ | (161,149 | ) | — | $ | — | $ | (161,021 | ) | ||||||||||||||||||||||||||||||||||
|
|
|
|
|
|
|
|
|
|
|
|
|
|
|
|
|
|
|
|
|
|
|
|
|
|
|
|
|
|
|
|||||||||||||||||||||||||||||||
| Stock-based compensation expense |
— | — | — | — | — | — | — | — | — | — | 2,159 | — | — | — | 2,159 | |||||||||||||||||||||||||||||||||||||||||||||
| Accretion of preferred stock to redemption value |
— | 13,930 | — | 1,143 | — | 11,342 | — | 25,921 | — | — | (2,650 | ) | (49,686 | ) | — | — | (52,336 | ) | ||||||||||||||||||||||||||||||||||||||||||
| Issuance of Series D redeemable convertible preferred stock, net of issuance costs |
— | — | — | — | — | — | 2,686,516 | 30,818 | — | — | — | — | — | — | — | |||||||||||||||||||||||||||||||||||||||||||||
| Issuance of common stock upon exercise of stock options |
— | — | — | — | — | — | — | — | 201,200 | 2 | 487 | — | — | — | 489 | |||||||||||||||||||||||||||||||||||||||||||||
| Purchase of common stock |
— | — | — | — | — | — | — | — | (401,626 | ) | (4 | ) | 4 | — | 401,626 | (3,526 | ) | (3,526 | ) | |||||||||||||||||||||||||||||||||||||||||
| Net loss |
— | — | — | — | — | — | — | — | — | — | — | (32,627 | ) | — | — | (32,627 | ) | |||||||||||||||||||||||||||||||||||||||||||
|
|
|
|
|
|
|
|
|
|
|
|
|
|
|
|
|
|
|
|
|
|
|
|
|
|
|
|
|
|
|
|||||||||||||||||||||||||||||||
| Balance, December 31, 2014 |
6,303,033 | $ | 68,892 | 519,269 | $ | 5,681 | 6,873,797 | $ | 80,286 | 2,686,516 | $ | 56,739 | 12,563,095 | $ | 126 | $ | — | $ | (243,462 | ) | 401,626 | $ | (3,526 | ) | $ | (246,862 | ) | |||||||||||||||||||||||||||||||||
|
|
|
|
|
|
|
|
|
|
|
|
|
|
|
|
|
|
|
|
|
|
|
|
|
|
|
|
|
|
|
|||||||||||||||||||||||||||||||
| Stock-based compensation expense (unaudited) |
— | — | — | — | — | — | — | — | — | — | 575 | — | — | — | 575 | |||||||||||||||||||||||||||||||||||||||||||||
| Accretion of preferred stock to redemption value (unaudited) |
— | 5,169 | — | 420 | — | 3,024 | — | 2,660 | — | — | (982 | ) | (10,291 | ) | — | — | (11,273 | ) | ||||||||||||||||||||||||||||||||||||||||||
| Issuance of common stock upon exercise of stock options (unaudited) |
— | — | — | — | — | — | — | — | 136,707 | 1 | 407 | — | — | — | 408 | |||||||||||||||||||||||||||||||||||||||||||||
| Net loss (unaudited) |
— | — | — | — | — | — | — | — | — | — | — | (7,682 | ) | — | — | (7,682 | ) | |||||||||||||||||||||||||||||||||||||||||||
|
|
|
|
|
|
|
|
|
|
|
|
|
|
|
|
|
|
|
|
|
|
|
|
|
|
|
|
|
|
|
|||||||||||||||||||||||||||||||
| Balance, March 31, 2015 (unaudited) |
6,303,033 | $ | 74,061 | 519,269 | $ | 6,101 | 6,873,797 | $ | 83,310 | 2,686,516 | $ | 59,399 | 12,699,802 | $ | 127 | $ | — | $ | (261,435 | ) | 401,626 | $ | (3,526 | ) | $ | (264,834 | ) | |||||||||||||||||||||||||||||||||
|
|
|
|
|
|
|
|
|
|
|
|
|
|
|
|
|
|
|
|
|
|
|
|
|
|
|
|
|
|
|
|||||||||||||||||||||||||||||||
See accompanying notes to consolidated financial statements.
F-5
Table of Contents
RAPID7, INC.
Consolidated Statements of Cash Flows
(in thousands)
| Year Ended December 31, | Three Months Ended March 31, |
|||||||||||||||||||
| 2012 | 2013 | 2014 | 2014 | 2015 | ||||||||||||||||
| (Unaudited) | ||||||||||||||||||||
| Cash flows from operating activities: |
||||||||||||||||||||
| Net loss |
$ | (12,394 | ) | $ | (18,873 | ) | $ | (32,627 | ) | $ | (8,478 | ) | $ | (7,682 | ) | |||||
| Adjustments to reconcile net loss to net cash used in operating activities: |
||||||||||||||||||||
| Depreciation and amortization |
1,529 | 2,631 | 4,140 | 878 | 1,134 | |||||||||||||||
| Amortization of debt discount |
— | — | 553 | 138 | 138 | |||||||||||||||
| Stock-based compensation expense |
1,720 | 2,047 | 2,159 | 528 | 575 | |||||||||||||||
| Provision for doubtful accounts |
431 | 460 | 581 | 172 | 165 | |||||||||||||||
| Deferred income taxes |
(433 | ) | 111 | 196 | — | — | ||||||||||||||
| Loss on sale of property and equipment |
25 | — | — | — | — | |||||||||||||||
| Foreign currency re-measurement loss |
— | — | — | — | 241 | |||||||||||||||
| Change in operating assets and liabilities: |
||||||||||||||||||||
| Accounts receivable |
(6,621 | ) | (4,012 | ) | (7,127 | ) | 2,568 | 4,179 | ||||||||||||
| Prepaid expenses and other assets |
(887 | ) | 28 | (2,165 | ) | (673 | ) | (778 | ) | |||||||||||
| Accounts payable |
91 | 1,064 | 567 | (902 | ) | (688 | ) | |||||||||||||
| Accrued expenses |
45 | 2,971 | 3,534 | 333 | (3,928 | ) | ||||||||||||||
| Deferred revenue |
16,468 | 15,126 | 25,200 | 1,282 | 3,588 | |||||||||||||||
| Contingent consideration |
(1,058 | ) | (3,081 | ) | (560 | ) | 23 | — | ||||||||||||
| Other liabilities |
393 | 915 | 2,193 | 1,992 | 44 | |||||||||||||||
|
|
|
|
|
|
|
|
|
|
|
|||||||||||
| Net cash used in operating activities |
(691 | ) | (613 | ) | (3,356 | ) | (2,139 | ) | (3,012 | ) | ||||||||||
|
|
|
|
|
|
|
|
|
|
|
|||||||||||
| Cash flows from investing activities: |
||||||||||||||||||||
| Business acquisitions, net of cash acquired |
(4,805 | ) | — | — | — | — | ||||||||||||||
| Purchases of property and equipment |
(2,133 | ) | (2,778 | ) | (7,082 | ) | (5,014 | ) | (573 | ) | ||||||||||
| Proceeds from sale of property and equipment |
14 | — | — | — | — | |||||||||||||||
|
|
|
|
|
|
|
|
|
|
|
|||||||||||
| Net cash used in investing activities |
(6,924 | ) | (2,778 | ) | (7,082 | ) | (5,014 | ) | (573 | ) | ||||||||||
|
|
|
|
|
|
|
|
|
|
|
|||||||||||
| Cash flows from financing activities: |
||||||||||||||||||||
| Proceeds from issuance of Series D redeemable convertible preferred stock, net |
— | — | 30,818 | — | — | |||||||||||||||
| Borrowings from term loan |
— | 18,000 | — | — | — | |||||||||||||||
| Borrowings from line of credit |
— | 5,000 | — | — | — | |||||||||||||||
| Repayments on line of credit |
— | (5,000 | ) | — | — | — | ||||||||||||||
| Payments of debt and equity issuance costs |
(11 | ) | (135 | ) | — | — | — | |||||||||||||
| Payments of capital lease obligations |
(220 | ) | (300 | ) | (256 | ) | (70 | ) | (59 | ) | ||||||||||
| Payments of contingent consideration related to business acquisitions |
(2,622 | ) | (1,500 | ) | (856 | ) | — | — | ||||||||||||
| Repurchase of common and preferred stock |
(3,260 | ) | — | (3,526 | ) | — | — | |||||||||||||
| Proceeds from stock option exercises |
140 | 257 | 489 | 39 | 408 | |||||||||||||||
|
|
|
|
|
|
|
|
|
|
|
|||||||||||
| Net cash (used in) provided by financing activities |
(5,973 | ) | 16,322 | 26,669 | (31) | 349 | ||||||||||||||
| Effects of exchange rate changes on cash |
— | 14 | (20 | ) | 1 | (244 | ) | |||||||||||||
|
|
|
|
|
|
|
|
|
|
|
|||||||||||
| Net (decrease) increase in cash |
(13,588 | ) | 12,945 | 16,211 | (7,183 | ) | (3,480 | ) | ||||||||||||
| Cash, beginning of period |
21,255 | 7,667 | 20,612 | 20,612 | 36,823 | |||||||||||||||
|
|
|
|
|
|
|
|
|
|
|
|||||||||||
| Cash, end of period |
$ | 7,667 | $ | 20,612 | $ | 36,823 | $ | 13,429 | $ | 33,343 | ||||||||||
|
|
|
|
|
|
|
|
|
|
|
|||||||||||
| Supplemental cash flow information: |
||||||||||||||||||||
| Cash paid for income taxes |
$ | — | $ | 34 | $ | 61 | $ | 29 | $ | 58 | ||||||||||
| Cash paid for interest |
$ | 13 | $ | 96 | $ | 2,095 | $ | 402 | $ | 549 | ||||||||||
See accompanying notes to consolidated financial statements.
F-6
Table of Contents
RAPID7, INC.
Notes to the Consolidated Financial Statements
| (1) | Nature of the Business |
Rapid7, Inc. and subsidiaries (“we,” “us” or “our”) is a leading provider of security data and analytics solutions that enable organizations to implement an active, analytics-driven approach to cyber security. Our solutions empower organizations to prevent attacks by providing visibility into vulnerabilities and to rapidly detect compromises, respond to breaches and correct the underlying causes of attacks.
| (2) | Summary of Significant Accounting Policies |
| (a) | Basis of Presentation |
The accompanying consolidated financial statements include our results of operations and those of our wholly-owned subsidiaries. All intercompany transactions and balances have been eliminated in consolidation. The accompanying consolidated financial statements have been prepared on the basis of generally accepted accounting principles in the United States of America (U.S. GAAP).
| (b) | Unaudited Interim Financial Information |
The accompanying interim consolidated balance sheet as of March 31, 2015, the related interim consolidated statements of operations and cash flows for the three month periods ended March 31, 2014 and 2015, the consolidated statement of changes in redeemable convertible preferred stock and stockholders’ deficit for the three month period ended March 31, 2015 and the related footnote disclosures are unaudited. These unaudited interim consolidated financial statements have been prepared in accordance with U.S. GAAP. In our opinion, the unaudited interim consolidated financial statements have been prepared on the same basis as the annual financial statements and include all adjustments necessary for the fair presentation of our financial position as of March 31, 2015 and our consolidated results of operations and cash flows for the three months ended March 31, 2014 and 2015. The results for the three months ended March 31, 2015 are not necessarily indicative of the results expected for the full fiscal year.
| (c) | Unaudited Pro Forma Consolidated Balance Sheet |
Upon the consummation of an initial public offering (IPO), it is contemplated that all of our outstanding shares of redeemable convertible preferred stock will automatically convert into shares of our common stock. The March 31, 2015 unaudited pro forma consolidated balance sheet data has been prepared assuming the conversion of our redeemable convertible preferred stock outstanding into shares of our common stock. The shares of common stock include IPO Participation Payment shares assuming an initial public offering price of $ per share, the midpoint of the price range set forth on the cover page of this prospectus. See Note 8 for further details regarding the IPO Participation Payment.
| (d) | Use of Estimates |
The preparation of financial statements in conformity with U.S. GAAP requires management to make estimates, judgments and assumptions that affect the reported amounts of assets, liabilities, revenue and expenses, together with amounts disclosed in the accompanying notes to the financial statements. Actual results could differ from those estimates. Significant items subject to such estimates and assumptions include revenue recognition, stock-based compensation, income taxes and goodwill and other intangible assets. We base our estimates on historical experience and also on assumptions that we believe are reasonable. Changes in facts or circumstances may cause us to change our assumptions and estimates in future periods and it is possible that actual results could differ from our current or revised future estimates.
| (e) | Translation of Foreign Currencies |
The functional currency of our foreign subsidiaries is the U.S. dollar. We translate all monetary assets and liabilities denominated in foreign currencies into U.S. dollars using the exchange rates in effect at the balance sheet dates and other assets and liabilities using historical exchange rates. Foreign currency
F-7
Table of Contents
RAPID7, INC.
Notes to the Consolidated Financial Statements
denominated revenue and expenses have been re-measured using the average exchange rates in effect during each period. Foreign currency re-measurement gains and losses have been included in other income (expense), net and have not been significant through December 31, 2014. For the three months ended March 31, 2015, we recorded foreign currency re-measurement losses of approximately $0.2 million (unaudited) and foreign currency transactional losses of $0.1 million (unaudited). For the three months ended March 31, 2014, the impact of foreign currency re-measurement losses and foreign currency transactional losses on our consolidated statement of operations were not significant (unaudited).
| (f) | Revenue Recognition |
We generate revenue primarily from selling products, maintenance and support, and professional services through a variety of delivery models. We generally bill customers and collect payment for both our products and services up front.
We generate products revenue from the sale of (1) perpetual or term software licenses and associated content subscriptions for our Nexpose and Metasploit products, (2) managed services for our Nexpose and UserInsight products and (3) cloud-based subscriptions for our UserInsight product. We also generate an immaterial amount of appliance revenue that is included in our products revenue and that is associated with hardware sold as part of our Nexpose product to certain customers. We generate maintenance and support revenue associated with customers’ purchases of our software licenses for Nexpose and Metasploit. We generate professional service revenue from the sale of our deployment and training services related to our products, incident response services and security advisory services.
Revenue is only recognized when all of the following criteria are met:
| • | Persuasive evidence of an arrangement exists. Binding agreements or purchase orders are generally evidence of an arrangement. |
| • | Delivery has occurred. Delivery occurs (1) upon delivery of the software license key or when the customer has access to the software product or (2) when we perform the services. |
| • | The sales price is fixed or determinable. Fees are considered fixed and determinable when the fees are contractually agreed upon with the customer. |
| • | Collectability is probable. Collectability is deemed probable based on review of a number of factors, including creditworthiness and customer payment history. If collectability is not reasonably assured, revenue is deferred until collection becomes reasonably assured, which is generally upon the receipt of payment. |
Substantially all of our software licenses are sold in multiple-element arrangements that include maintenance and support, content subscriptions, cloud-based subscriptions, professional services and/or managed services. All of these elements are considered to be software elements other than cloud-based subscriptions, which are non-software elements, and managed services, which can be either software elements or non-software elements. Non-software elements included in multiple-element arrangements consist of a single deliverable that has stand-alone value and that represents a single unit of accounting. We have determined that we do not have vendor-specific objective evidence, or VSOE, of the selling price for the elements comprising these multiple-element arrangements as our software licenses are generally not sold on a stand-alone basis and we purposefully employ variable pricing for our offerings in order to meet customer purchase requirements along the multiple price points of the demand curve.
When all of the elements of a multiple-element arrangement are software elements, the revenue for software licenses and any other products and services that are sold along with the license is generally deferred on our balance sheet and recognized as revenue on our consolidated statements of operations ratably over the contractual period of the maintenance and support, typically one to three years, which
F-8
Table of Contents
RAPID7, INC.
Notes to the Consolidated Financial Statements
is longer than the period over which the professional services are performed. Revenue recognition begins upon delivery of the software license, assuming that all other criteria for revenue recognition have been met.
When a multiple-element arrangement includes both software elements and non-software elements, the total arrangement consideration is first allocated between the software elements and the non-software elements based on the selling price hierarchy, which includes (1) VSOE, if available, (2) third-party evidence, or TPE, if VSOE is not available or (3) best estimate of selling price, or BESP, if neither VSOE nor TPE is available. We have not been able to establish a selling price for any element using VSOE or TPE. We determine BESP by considering our overall pricing objectives and market conditions. Significant pricing practices taken into consideration include our discounting practices, the size and volume of our transactions, our price lists, our go-to-market strategy, historical standalone sales and contract prices. The determination of BESP is made in consultation with, and is approved by, our management. Our multiple-element arrangements can include a single non-software element, in which case the portion of the consideration allocated to the non-software element is recognized ratably over the service period of the non-software element, assuming all other criteria for revenue recognition have been met. The portion of the consideration allocated to software elements is recognized as described above.
With respect to our managed services and cloud-based subscription offerings sold on a stand-alone basis, we recognize revenue ratably over the term of the managed service agreement or subscription, assuming that the other criteria for revenue recognition are met.
We recognize revenue from professional services sold on a stand-alone basis as those services are rendered.
For purposes of disclosing revenue by class, we allocate the arrangement consideration for multiple-element software arrangements among the individual elements utilizing BESP, as we do not have VSOE or third-party evidence, or TPE, of selling price of the elements.
| (g) | Deferred Revenue |
Deferred revenue consists of amounts that have been invoiced but that have not been recognized as revenue. Deferred revenue that will be realized during the succeeding 12-month period is recorded as current, and the remaining deferred revenue is recorded as non-current.
| (h) | Accounts Receivable and Allowance for Doubtful Accounts |
Accounts receivable are recorded at the invoiced amount, net of allowances for doubtful accounts. Management regularly reviews the adequacy of the allowance for doubtful accounts by considering the age of outstanding invoices, the customer’s expected ability to pay and the collection history, when applicable, to determine whether an allowance is appropriate. Accounts receivable are charged against the allowance for doubtful accounts after all means of collection have been exhausted and the potential for recovery is considered remote. The allowance for doubtful accounts was $0.7 million, $0.3 million and $0.5 million (unaudited) as of December 31, 2013 and 2014, and March 31, 2015, respectively. Bad debt expense for 2012, 2013 and 2014 was $0.4 million, $0.5 million and $0.6 million, respectively. Bad debt expense was $0.2 million (unaudited) for each of the three month periods ended March 31, 2014 and 2015. We do not have any off balance sheet credit exposure related to our customers.
| (i) | Concentration of Credit Risk |
Financial instruments that potentially expose us to concentrations of credit risk consist primarily of accounts receivable. We provide credit to customers in the normal course of business. Collateral is not
F-9
Table of Contents
RAPID7, INC.
Notes to the Consolidated Financial Statements
required for accounts receivable, but ongoing credit evaluations of customers’ financial condition are performed. We maintain reserves for potential credit losses. No single customer accounted for 10% or more of our total revenues in 2012, 2013, 2014 or for the three months ended March 31, 2014 or 2015 (unaudited) or accounts receivable as of December 31, 2013, December 31, 2014 or March 31, 2015 (unaudited).
We maintain our cash in bank deposit and checking accounts with major financial institutions, which at times may exceed U.S. federally insured limits. We have not experienced any losses in such accounts and believe that we are not exposed to any significant risk.
| (j) | Fair Value Measurements |
We utilize valuation techniques that maximize the use of observable inputs and minimize the use of unobservable inputs to the extent possible. We determine fair value based on assumptions that market participants would use in pricing an asset or liability in the principal or most advantageous market. When considering market participant assumptions in fair value measurements, the following fair value hierarchy distinguishes between observable and unobservable inputs, which are categorized in one of the following levels:
| • | Level 1 Inputs: Unadjusted quoted prices in active markets for identical assets or liabilities accessible to the reporting entity at the measurement date. |
| • | Level 2 Inputs: Other than quoted prices included in Level 1 inputs that are observable for the asset or liability, either directly or indirectly, for substantially the full term of the asset or liability. |
| • | Level 3 Inputs: Unobservable inputs for the asset or liability used to measure fair value to the extent that observable inputs are not available, thereby allowing for situations in which there is little, if any, market activity for the asset or liability at measurement date. |
| (k) | Property and Equipment |
Property and equipment are recorded at cost and depreciated over their estimated useful lives using the straight-line method. Leasehold improvements are amortized over the shorter of the lease term or the estimated useful life of the related asset. All other asset categories are depreciated over three to five years. Upon sale, the cost of assets disposed and the related accumulated depreciation are removed from the accounts and any resulting gain or loss is recognized in the consolidated statements of operations. Repairs and maintenance costs are expensed as incurred.
| (l) | Capitalized Software Costs |
We capitalize certain costs related to software acquired for internal use and software developed for sale.
With respect to software acquired for internal use, we capitalize qualifying software costs, which include software license fees and third-party implementation and related costs. Total unamortized capitalized costs relating to software acquired for internal use as of December 31, 2013 and 2014 and March 31, 2015 were $0.1 million, $0.4 million and $0.6 million (unaudited), respectively.
With respect to software developed for sale, we expense costs incurred in research and development until technological feasibility has been established for the product. Once technological feasibility is established, all software costs are capitalized until the product is available for general release. As of each of December 31, 2014 and March 31, 2015 (unaudited), total unamortized capitalized costs relating to software developed for sale were $0.4 million. As of December 31, 2013, there were no unamortized capitalized costs relating to software developed for sale.
F-10
Table of Contents
RAPID7, INC.
Notes to the Consolidated Financial Statements
| (m) | Long-Lived Assets |
We review the carrying value of our long-lived assets for impairment whenever events or changes in circumstances indicate that the carrying value of these assets may not be recoverable. When such events or changes in circumstances occur, recoverability of these assets is measured by a comparison of the carrying value of an asset to the future net undiscounted cash flows directly associated with the asset. If assets are considered to be impaired, the impairment recognized is the amount by which the carrying value exceeds the fair value of the asset. We use a discounted cash flow approach or other methods, if appropriate, to assess fair value.
| (n) | Goodwill and Other Intangible Assets |
Goodwill is an asset representing the future economic benefits arising from other assets acquired in a business combination that are not individually identified and separately recognized. We allocate the cost of an acquired entity to the assets acquired and liabilities assumed based on their estimated fair values at the date of acquisition. The excess of the purchase price for acquisitions over the fair value of the net assets acquired, including other intangible assets, is recorded as goodwill. Goodwill is not amortized but is tested for impairment at least annually or more frequently when events or circumstances occur that indicate that it is more likely than not that an impairment has occurred.
For our goodwill impairment analysis, we operate with a single reporting unit. The two-step impairment test begins with an estimation of the fair value of a reporting unit. Goodwill impairment exists when a reporting unit’s carrying value of goodwill exceeds its implied fair value. Significant judgment is applied when goodwill is assessed for impairment. In performing the first step of the goodwill impairment testing and measurement process, we compare our entity-wide estimated fair value to net book value to identify potential impairment. Management estimates the entity-wide fair value utilizing a weighted-average of the income approach using discounted cash flows, guideline public company and guideline transaction methods. If the fair value of the reporting unit is less than the book value, the second step is performed to determine if goodwill is impaired. If we determine through the impairment evaluation process that goodwill has been impaired, an impairment charge would be recorded in our consolidated statements of operations. There has been no impairment of goodwill for any periods presented.
Other intangible assets acquired in a business combination are recognized at fair value using generally accepted valuation methods appropriate for the type of intangible asset and reported separately from goodwill. Intangible assets with definite lives are amortized over the estimated useful lives and are tested for impairment when events or circumstances occur that indicate that it is more likely than not that an impairment has occurred. We test other intangible assets with definite lives for impairment by comparing the carrying amount to the sum of the net undiscounted cash flows expected to be generated by the asset whenever events or changes in circumstances indicate that the carrying amount of the asset may not be recoverable. If the carrying amount of the asset exceeds its net undiscounted cash flows, then an impairment loss is recognized for the amount by which the carrying amount exceeds its fair value. There has been no impairment of other intangible assets for any periods presented.
| (o) | Stock-Based Compensation |
We measure and recognize compensation expense for all stock options and restricted stock awards based on the estimated fair value of the award on the grant date. We use the Black-Scholes option pricing model to estimate the fair value of stock option awards. The fair value is recognized as expense, net of estimated forfeitures, over the requisite service period, which is generally the vesting period of the respective award, on a straight-line basis when the only condition to vesting is continued service. If vesting is subject to a market or performance condition, recognition is based on the derived service period. Expense for awards with performance conditions is estimated and adjusted on a quarterly basis based upon the assessment of the probability that the performance condition will be met.
F-11
Table of Contents
RAPID7, INC.
Notes to the Consolidated Financial Statements
| (p) | Advertising |
Advertising costs are expensed as incurred. Advertising expense was approximately $1.8 million, $1.7 million and $3.2 million in 2012, 2013 and 2014, respectively, and $0.9 million (unaudited) and $0.7 million (unaudited) for the three months ended March 31, 2014 and 2015, respectively.
| (q) | Income Taxes |
Income taxes are accounted for using the asset and liability method. Under this method, deferred tax assets and liabilities are recognized for the future tax consequences attributable to differences between the financial statement carrying amounts of existing assets and liabilities and their respective income tax bases, and operating loss and tax credit carryforwards. Valuation allowances are provided when we determine that it is more likely than not that all of, or a portion of, deferred tax assets will not be utilized in the future.
We account for unrecognized tax benefits using a more-likely-than-not threshold for financial statement recognition and measurement of tax positions taken or expected to be taken in a tax return.
| (r) | Sales Commissions |
Sales commissions are recognized in the period that the commissions are earned by our employees, which is typically upon signing of an arrangement. Under our sales commission policy, the amount of sales commissions expense attributable to the sales arrangement signed in the period is recognized fully in that period; however, the revenue from the sales arrangement is generally recognized ratably over the contractual period of the applicable agreement.
| (s) | Redeemable Convertible Preferred Stock |
At any time after November 16, 2018, the holders of (1) a majority of the then outstanding shares of Series A redeemable convertible preferred stock and Series B redeemable convertible preferred stock, voting together as a single class on an as-converted basis and (2) a majority of the then outstanding shares of Series C redeemable convertible preferred stock, voting as a single class, may request that we redeem all the outstanding shares of redeemable convertible preferred stock. As redemption of the redeemable convertible preferred stock is outside our control, all shares of redeemable convertible preferred stock have been presented outside of stockholders’ deficit in our consolidated balance sheets. We recognize changes in the redemption value as they occur and adjust the carrying amount of the redeemable convertible preferred stock to equal the redemption value at the end of each reporting period.
| (t) | Net Loss per Share Attributable to Common Stockholders |
Basic net loss per share attributable to common stockholders is computed by dividing our net loss attributable to common stockholders by the weighted-average number of common shares used in the loss per share calculation during the period. Diluted net loss per share attributable to common stockholders is computed by giving effect to all potentially dilutive securities, including stock options, warrants and redeemable convertible preferred stock. Basic and diluted net loss per share attributable to common stockholders was the same for all periods presented as the inclusion of all potentially dilutive securities outstanding was anti-dilutive.
| (u) | Recent Accounting Pronouncements |
In May 2014, the Financial Accounting Standard Board (FASB) issued Accounting Standards Update (ASU) 2014-09, Revenue from Contracts with Customers (Topic 606). This guidance outlines a single, comprehensive model for accounting for revenue from contracts with customers and will become effective in the first quarter of 2017 for public companies with calendar year ends. We are currently evaluating the impact that the standard will have on the consolidated financial statements.
F-12
Table of Contents
RAPID7, INC.
Notes to the Consolidated Financial Statements
| (3) | Fair Value Measurements |
Our financial instruments consist of cash, accounts receivable and capital leases. Our estimate of fair value for financial instruments approximates their carrying value as of December 31, 2013 and 2014 and March 31, 2015.
The following table presents our assets and liabilities measured at fair value on a recurring basis as of December 31, 2013 (in thousands):
| Quoted prices in active markets for identical assets Level 1 |
Significant other observable inputs Level 2 |
Significant Unobservable inputs Level 3 |
Fair value | |||||||||||||||
| Contingent consideration related to acquisitions (note 5) | $ | — | $ | — | $ | 1,416 | $ | 1,416 | ||||||||||
Our contingent consideration liabilities are classified within Level 3 because there are currently no active markets or observable market prices. Therefore, the contingent consideration liabilities were valued primarily based on an income approach using an estimate of future bookings which considered the following key inputs:
| • | the underlying structure and probability of achievement of each liability; |
| • | the timing of expected future principal and interest payments; and |
| • | discount rates that are believed to reflect current market conditions and the relevant risk associated with each liability. |
The following table presents reconciliation for all liabilities measured at fair value on a recurring basis using significant unobservable inputs (Level 3) for the years ended December 31, 2013 and 2014:
| Year Ended December 31, | ||||||||
| 2013 | 2014 | |||||||
| (in thousands) | ||||||||
| Beginning balance |
$ | 5,997 | $ | 1,416 | ||||
| Payments |
(5,067 | ) | (1,500 | ) | ||||
| Revaluations |
486 | 84 | ||||||
|
|
|
|
|
|||||
| Ending balance |
$ | 1,416 | $ | — | ||||
|
|
|
|
|
|||||
The contingent consideration related to acquisitions was paid in full during the year ended December 31, 2014. Accordingly, no assets or liabilities measured at fair value on a recurring basis using significant unobservable inputs existed during the three months ended March 31, 2015 (unaudited).
Revaluations of contingent consideration are presented as a component of operating expense in the accompanying consolidated statements of operations.
F-13
Table of Contents
RAPID7, INC.
Notes to the Consolidated Financial Statements
| (4) | Property and Equipment |
Property and equipment are recorded at cost, while maintenance and repairs are expensed as incurred. Property and equipment consists of the following:
| As of December 31, | As of March 31, |
|||||||||||
| 2013 | 2014 | 2015 | ||||||||||
| (in thousands) |
||||||||||||
| (unaudited) | ||||||||||||
| Computer equipment and software |
$ | 5,953 | $ | 8,150 | $ | 8,682 | ||||||
| Furniture and fixtures |
537 | 1,999 | 2,086 | |||||||||
| Leasehold improvements |
2,134 | 5,368 | 5,377 | |||||||||
|
|
|
|
|
|
|
|||||||
| Total |
8,624 | 15,517 | 16,145 | |||||||||
| Less accumulated depreciation |
(4,346 | ) | (7,595 | ) | (8,526 | ) | ||||||
|
|
|
|
|
|
|
|||||||
| Net property and equipment |
$ | 4,278 | $ | 7,922 | $ | 7,619 | ||||||
|
|
|
|
|
|
|
|||||||
We recorded depreciation expense of approximately $1.1 million, $1.7 million and $3.3 million in 2012, 2013 and 2014, respectively, and $0.7 million (unaudited) and $0.9 million (unaudited) for the three months ended March 31, 2014 and 2015, respectively.
| (5) | Business Combinations |
Acquisition in 2012
On October 8, 2012, we completed the acquisition of 100% of the outstanding shares of Mobilisafe, Inc. (Mobilisafe), a mobile vulnerability management software company, for cash consideration of $5.0 million, 411,379 shares of our common stock valued at approximately $2.1 million and vested replacement options valued at less than $0.1 million. Additionally, the former stockholders of Mobilisafe were entitled to future purchase consideration of up to $3.0 million (undiscounted), payment of which was dependent on the successful development of certain technology through October 2014. The acquisition was accounted for using the purchase method of accounting and, accordingly, the purchase price (including estimated future contingent consideration) was allocated to tangible and intangible assets acquired and liabilities assumed based on the estimated fair values as of the acquisition date. As of the acquisition date, we allocated $0.2 million to the Mobilisafe trade name, $1.6 million to the acquired technology, $0.5 million to a covenant not to compete and $7.7 million to goodwill. The mobile technology acquired with Mobilisafe has been incorporated as a feature of our Nexpose product.
The fair value of the contingent consideration arrangement of $2.4 million was based on significant unobservable inputs, including management estimates and assumptions, and was measured based on the probability-weighted present value of the payments expected to be made. Accordingly, the fair value of contingent consideration was classified as Level 3 within the fair value hierarchy. Key assumptions made when determining the fair value as of October 8, 2012 included: (1) the risk adjusted discount rate and (2) the probability of achieving milestones. As of December 31, 2014, we have paid out all remaining contingent consideration associated with the Mobilisafe acquisition. Total contingent consideration paid since the acquisition date totaled $3.0 million. During 2014, we recognized an $0.1 million cumulative increase in the fair value of the contingent consideration.
F-14
Table of Contents
RAPID7, INC.
Notes to the Consolidated Financial Statements
The following table summarizes the consideration paid for Mobilisafe and the amounts of estimated fair value of the assets acquired and liabilities assumed at the acquisition date.
| Consideration (in thousands): |
||||||
| Cash |
$ | 5,001 | ||||
| Stock consideration |
2,096 | |||||
| Contingent consideration |
2,356 | |||||
| Vested replacement options |
35 | |||||
|
|
|
|||||
| Fair value of total consideration transferred |
$ | 9,488 | ||||
|
|
|
|||||
| Recognized amounts of identifiable assets acquired and liabilities assumed (in thousands): |
| |||||
| Cash and cash equivalents |
$ | 196 | ||||
| Net working capital |
(181 | ) | ||||
| Property and equipment |
17 | |||||
| Intangible assets |
2,320 | |||||
| Deferred tax liability |
(523 | ) | ||||
|
|
|
|||||
| Total identifiable net assets assumed |
1,829 | |||||
| Goodwill |
7,659 | |||||
|
|
|
|||||
| Total allocated purchase price |
$ | 9,488 | ||||
|
|
|
|||||
Acquisition in 2009
On August 19, 2009, we acquired Metasploit LLC (Metasploit) for a cash payment of $0.5 million, 593,776 common units of Rapid7, LLC, which subsequently became a wholly-owned subsidiary of ours, with an estimated fair value of $0.6 million and a contingent future payment based on 25% of net product revenue to be paid in six-month increments from February 2010 through August 2013. The acquisition was accounted for using the purchase method of accounting and, accordingly, the purchase price (including the estimated future contingent payment) was allocated to tangible and intangible assets acquired and liabilities assumed based on the estimated fair values as of the acquisition date. As of the acquisition date, we allocated $0.3 million to the Metasploit trade name, $1.0 million to the acquired technology and $3.6 million to goodwill.
The contingent acquisition payment was valued at a net present value of $3.8 million as of the acquisition date based on significant unobservable inputs, including management estimates and assumptions regarding expected future sales. Accordingly, the fair value of contingent consideration was classified as Level 3 within the fair value hierarchy. Valuation changes were made over time to align with the positive development of the business. In 2010, payments were made totaling $0.1 million and we updated our forecast of expected future sales, in turn increasing the estimated fair value of the contingent consideration by $5.0 million. In 2011, payments were made totaling $1.3 million. In 2012, two payments were made totaling $2.6 million and we further updated our forecast of expected future sales, in turn decreasing the estimated fair value of the contingent acquisition consideration by $1.1 million. In 2013, two payments were made totaling $3.6 million, which resulted in the extinguishment of the liability.
F-15
Table of Contents
RAPID7, INC.
Notes to the Consolidated Financial Statements
| (6) | Long-term Debt and Line of Credit |
Long-term debt consists of the following:
| As of December 31, | As of |
|||||||||||||||||
| 2013 | 2014 | 2015 | ||||||||||||||||
| (in thousands) |
||||||||||||||||||
| (unaudited) | ||||||||||||||||||
| Term loan |
$ | 18,000 | $ | 18,000 | $ | 18,000 | ||||||||||||
| Unamortized debt discount |
(1,682 | ) | (1,129 | ) | (991 | ) | ||||||||||||
|
|
|
|
|
|
|
|||||||||||||
| Total short and long-term obligations under term loan |
16,318 | 16,871 | 17,009 | |||||||||||||||
| Less: short-term obligations under term loan |
— | — | 1,703 | |||||||||||||||
|
|
|
|
|
|
|
|||||||||||||
| Total long-term obligations under term loan |
$ | 16,318 | $ | 16,871 | $ | 15,306 | ||||||||||||
|
|
|
|
|
|
|
|||||||||||||
| (a) | Term Loan |
On December 27, 2013, we entered into a Subordinated Loan and Security Agreement (term loan agreement) with a financial institution, whereby we borrowed $18.0 million. Interest is to be paid monthly at a rate of 12% per annum, commencing in January 2014 and continuing through December 2015. During this period, no principal is to be paid. Commencing in January 2016, monthly principal payments of $0.8 million per month, along with interest, will be paid for a period of 24 months, until the debt is repaid in full. Pursuant to the term loan agreement, we have also pledged certain assets as collateral, including intellectual property and accounts receivable.
Upon execution of the term loan agreement, we paid $0.1 million in initial fees to the financial institution, which were recorded as a debt discount and are being amortized over the four-year term of the loan using the effective interest method. The term loan agreement also contains a provision pursuant to which an additional fee of $0.5 million is to be paid in conjunction with the final payment of the term loan. This additional fee was also recorded as a debt discount and is being amortized over the four-year term of the loan using the effective interest method. The liability relating to the additional fee is presented as an other long-term liability in the accompanying consolidated balance sheets.
Additionally, warrants to purchase up to 200,000 shares of our common stock were issued to the financial institution in connection with the term loan agreement. These warrants have a contractual life of 10 years and were issued with an exercise price of $10.00 per share of common stock underlying such warrants. The warrants are classified as permanent equity. Accordingly, we recorded the term loan net of an original issuance discount of $1.0 million, representing the calculated relative fair value of the warrants, which is being amortized over the four-year term of the loan using the effective interest method.
The total unamortized debt discount was $1.7 million and $1.1 million as of December 31, 2013 and 2014, respectively, and $1.0 million (unaudited) as of March 31, 2015.
Pursuant to the term loan agreement, we must maintain an adjusted quick ratio (i.e., current assets divided by current liabilities, excluding deferred revenue) of at least 1.25 at each month-end reporting period. The term loan also contains a material adverse change clause that allows the lender to accelerate payments on outstanding borrowings based on its subjective assessment of our operations. We were in compliance with this covenant as of December 31, 2014 and March 31, 2015 (unaudited) and did not consider the occurrence of the material adverse change clause to be probable.
F-16
Table of Contents
RAPID7, INC.
Notes to the Consolidated Financial Statements
Minimum future principal payments of the term loan as of December 31, 2014 are as follows (in thousands):
| 2016 |
$ | 9,000 | ||||
| 2017 |
9,000 | |||||
|
|
|
|||||
| Total |
$ | 18,000 | ||||
|
|
|
| (b) | Line of Credit |
On April 22, 2013, we entered into a Loan and Security Agreement for a line of credit with a financial institution, which was subsequently modified on December 27, 2013. Under the line of credit, we are able to borrow up to the lesser of $10.0 million or 80% of eligible accounts receivable. The line of credit carries a floating interest rate equal to the prime rate plus 1.25%. As of December 31, 2014 and March 31, 2015 (unaudited), there was no outstanding balance under the line of credit.
| (7) | Goodwill and Other Intangible Assets |
Goodwill was $11.3 million as of December 31, 2013, December 31, 2014 and March 31, 2015 (unaudited), respectively. There were no impairments recorded against goodwill in 2012, 2013, 2014 or the three months ended March 31, 2014 or 2015 (unaudited).
Identifiable intangible assets consist of the following:
| Weighted- average life (years) |
As of December 31, 2013 | As of December 31, 2014 | As of March 31, 2015 | |||||||||||||||||||||||||
| Gross carrying amount |
Accumulated amortization |
Gross carrying amount |
Accumulated amortization |
Gross carrying amount |
Accumulated amortization |
|||||||||||||||||||||||
| (in thousands) | ||||||||||||||||||||||||||||
| (unaudited) | ||||||||||||||||||||||||||||
| Intangible assets subject to amortization: |
||||||||||||||||||||||||||||
| Trade names |
8.8 | $ | 494 | $ | (205 | ) | $ | 494 | $ | (280 | ) | $ | 494 | $ | (295 | ) | ||||||||||||
| Technology |
5.6 | 2,601 | (1,240 | ) | 2,601 | (1,934 | ) | 2,601 | (2,105 | ) | ||||||||||||||||||
| Noncompete |
5.0 | 500 | (125 | ) | 500 | (225 | ) | 500 | (242 | ) | ||||||||||||||||||
|
|
|
|
|
|
|
|
|
|
|
|
|
|||||||||||||||||
| Total intangible assets |
$ | 3,595 | $ | (1,570 | ) | $ | 3,595 | $ | (2,439 | ) | $ | 3,595 | $ | (2,642 | ) | |||||||||||||
|
|
|
|
|
|
|
|
|
|
|
|
|
|||||||||||||||||
Amortization of intangible assets is based on the pattern in which the economic benefit of the assets is expected to be utilized. We recorded amortization expense of approximately $0.4 million, $0.9 million and $0.9 million in 2012, 2013 and 2014, respectively, and $0.2 million (unaudited) for each of the three months ended March 31, 2014 and 2015.
Estimated future amortization expense of the acquired identifiable intangible assets as of March 31, 2015 (unaudited) is as follows (in thousands):
| 2015 (for the remaining nine months) |
$ | 474 | ||
| 2016 |
225 | |||
| 2017 |
166 | |||
| 2018 |
53 | |||
| 2019 and thereafter |
35 | |||
|
|
|
|||
| Total |
$ | 953 | ||
|
|
|
F-17
Table of Contents
RAPID7, INC.
Notes to the Consolidated Financial Statements
| (8) | Redeemable Convertible Preferred Stock and Common Stock |
| (a) | Share Repurchases |
In 2014, we repurchased 401,626 shares of common stock from certain employees and non-employees, for an aggregate amount of $3.5 million. In 2012, we repurchased and retired 31,990 shares of Series B redeemable convertible preferred stock (Series B stock), for an aggregate amount of $0.2 million and 862,382 shares of common stock, for an aggregate amount of $3.1 million.
| (b) | Redeemable Convertible Preferred Stock |
In December 2014, we issued 2,686,516 shares of Series D redeemable convertible preferred stock (Series D stock) at a purchase price of $11.554 per share. We received proceeds from the sale of the Series D stock of $30.8 million, net of $0.2 million in issuance costs.
As of December 31, 2014 and March 31, 2015 (unaudited), we are authorized to issue a total of 16,392,603 shares of redeemable convertible preferred stock, $0.01 par value per share, of which 6,303,033 shares are designated as Series A redeemable convertible preferred stock (Series A stock), 519,269 shares are designated as Series B stock, 6,873,797 shares are designated as Series C redeemable convertible preferred stock (Series C stock), and 2,696,504 shares are designated as Series D stock (collectively referred to as Preferred Stock).
The rights, preferences and privileges of the Preferred Stock are as follows:
Dividends
The holders of Preferred Stock are entitled, prior and in preference to holders of common stock, to cumulative dividends at a rate of 5.5% per annum, compounded annually, from the respective issuance dates. Preferential dividends are paid when and as declared by our board of directors. No dividends were declared or paid in 2012, 2013, 2014 or in the three months ended March 31, 2015 (unaudited).
Liquidation Preferences
In the event we are voluntarily or involuntarily liquidated, dissolved or wound-up, the holders of Preferred Stock are entitled to be paid out of our assets available for distribution to our stockholders before any payment is made to any holders of common stock.
If we are liquidated, dissolved or wound-up, each holder of Series D stock would be entitled to be paid before any distribution or payment is made to any holders of Series A stock, Series B stock, Series C stock or common stock. The amount of the payment due to holders of Series D stock is an amount per share equal to the aggregate original issuance price of all Series D stock held by such holder (plus all accrued and unpaid dividends thereon, whether or not declared). If we are liquidated, dissolved or wound-up and the assets available for distribution to the holders of Series D stock are insufficient to pay such holders the full amount to which they are entitled, the holders would share pro-rata in the assets available for distribution, based on the aggregate original issuance price (plus all accrued and unpaid dividends thereon, whether or not declared) of the Series D stock held by each such holder.
Subject to the payment in full of the amounts payable to the holders of Series D stock as described above, if we are liquidated, dissolved or wound-up, each holder of Series A stock, Series B stock and Series C stock would be entitled to be paid before any distribution or payment is made to any holder of common stock. The amount of the payment due to holders of Series A stock, Series B stock and Series C stock is an amount per share equal to the greater of (1) the aggregate original issuance price of all shares of Series A stock, Series B stock and Series C stock held by such holder (plus all accrued and unpaid dividends thereon, whether or not declared) and (2) the maximum amount to which such holder would be entitled to receive upon such liquidation, dissolution or winding-up if part or all of such
F-18
Table of Contents
RAPID7, INC.
Notes to the Consolidated Financial Statements
holder’s shares of Series A stock, Series B stock and Series C stock were converted into common stock immediately prior to such event. If we are liquidated, dissolved or wound-up and the assets available for distribution to the holders of Series A stock, Series B stock and Series C stock are insufficient to pay such holders the full amount to which they are entitled, the holders would share pro-rata in the assets available for distribution, based on the aggregate original issuance price (plus all accrued and unpaid dividends thereon, whether or not declared) of the shares of Series A stock, Series B stock and Series C stock held by each such holder.
Subject to the payment in full of the amounts payable to the holders of Preferred Stock as described above, if we are liquidated, dissolved or wound-up, our remaining assets available for distribution to our stockholders would be distributed among the holders of the shares of Series D stock and common stock on a pro-rata basis, based on the number of shares held by each such holder on an as converted to common stock basis.
Conversion
Each share of Preferred Stock is convertible at any time at the option of the holder into common stock at a conversion price per share of $11.554, $7.274, $1.563 and $1.01773 (each subject to adjustments upon the occurrence of certain dilutive events) for Series D stock, Series C stock, Series B stock and Series A stock, respectively. We may at any time require the conversion of all, but not less than all, of the outstanding Preferred Stock upon an IPO with a public offering price of at least $14.55 per share and aggregate gross proceeds of at least $60.0 million (Qualified Public Offering).
In addition, upon a Qualified Public Offering, each holder of Series D stock would be entitled to receive additional shares of common stock (the IPO Participation Payment). The number of shares constituting the aggregate IPO Participation Payment would be determined by dividing the aggregate liquidation value of the shares of Series D stock by the offering price per share of common stock in the Qualified Public Offering. Notwithstanding the foregoing, the aggregate number of shares of common stock that holders of Series D stock are entitled to receive in connection with a Qualified Public Offering (including common stock issuable upon conversion of the Series D stock and common stock constituting the IPO Participation Payment) is limited to a number of shares of common stock determined by dividing three (3) times the aggregate liquidation value of Series D stock by the offering price per share of common stock in the Qualified Public Offering. Shares of common stock issuable in connection with the IPO Participation Payment are treated as a beneficial conversion feature and will be measured and recognized if and when a Qualified Public Offering occurs that results in the issuance of such shares.
Voting Rights
The holders of Preferred Stock are entitled to one vote for each share of common stock into which their shares of Preferred Stock may be converted, and the holders of the Preferred Stock and common stock vote together on an as-converted basis. Notwithstanding the foregoing, holders of Series D stock are not entitled to vote with respect to the election or removal of members of our board of directors.
Redemption
At any time after November 16, 2018, the holders of (1) a majority of the then-outstanding shares of Series A stock and Series B stock, voting together as a single class on an as-converted basis and (2) a majority of the then-outstanding shares of Series C stock, voting as a single class, may request that we redeem all the outstanding shares of Preferred Stock. The Preferred Stock shall be redeemed in an amount in cash equal to the greater of (1) the aggregate original issuance price of such Preferred Stock plus all accrued and unpaid dividends thereon (whether or not declared) or (2) the fair market value of such Preferred Stock.
F-19
Table of Contents
RAPID7, INC.
Notes to the Consolidated Financial Statements
| (c) | Common Stock |
As of December 31, 2014 and March 31, 2015 (unaudited), we had 35,700,000 shares of common stock, $0.01 par value per share, authorized for issuance. At December 31, 2013 and 2014, there were 12,763,521 and 12,563,095 shares issued and outstanding, respectively. At March 31, 2015, there were 12,699,802 shares issued and outstanding (unaudited).
| (d) | Common Stock Warrants |
In December 2013, we issued warrants to purchase 200,000 shares of common stock to a financial institution in connection with the term loan agreement. These warrants have a contractual life of 10 years and were issued with an exercise price of $10.00 per share of common stock underlying such warrants. As of December 31, 2014 and March 31, 2015 (unaudited), none of the warrants have been exercised. See note 6 to the consolidated financial statements.
| (9) | Stock-Based Compensation |
| (a) | General |
We issue stock-based awards through the Rapid7, Inc. 2011 Stock Option and Grant Plan (the 2011 Plan). As of December 31, 2013 and 2014, shares of common stock authorized to be issued under the 2011 Plan totaled 6,773,740 and 8,162,563, respectively, and there were 779,101 and 1,607,756 shares of common stock available for grant, respectively. As of March 31, 2015 (unaudited), shares of common stock authorized to be issued under the 2011 Plan totaled 8,162,563, and there were 1,025,391 shares of common stock available for grant.
We recognize compensation cost of all awards on a straight-line basis over the applicable vesting period, which is generally four years.
The stock-based compensation expense for restricted stock and stock options was classified in the accompanying consolidated statements of operations as follows:
| Year Ended December 31, | Three Months Ended March 31, |
|||||||||||||||||||||||||||||
| 2012 | 2013 | 2014 | 2014 | 2015 | ||||||||||||||||||||||||||
| (in thousands) | ||||||||||||||||||||||||||||||
| (unaudited) | ||||||||||||||||||||||||||||||
| Stock-based compensation expense in: |
||||||||||||||||||||||||||||||
| Cost of revenue |
$ | 61 | $ | 67 | $ | 167 | $ | 39 | $ | 49 | ||||||||||||||||||||
| Sales and marketing |
293 | 249 | 496 | 119 | 115 | |||||||||||||||||||||||||
| Research and development |
375 | 426 | 499 | 120 | 144 | |||||||||||||||||||||||||
| General and administrative |
991 | 1,305 | 997 | 250 | 267 | |||||||||||||||||||||||||
|
|
|
|
|
|
|
|
|
|
|
|||||||||||||||||||||
| Total stock-based compensation expense |
$ | 1,720 | $ | 2,047 | $ | 2,159 | $ | 528 | $ | 575 | ||||||||||||||||||||
|
|
|
|
|
|
|
|
|
|
|
|||||||||||||||||||||
F-20
Table of Contents
RAPID7, INC.
Notes to the Consolidated Financial Statements
| (b) | Restricted Stock |
Restricted stock activity under the 2011 Plan during 2012, 2013, 2014 and the three months ended March 31, 2015 was as follows:
| Unvested restricted shares of stock |
Weighted- average grant date fair value per share |
|||||||||
| Outstanding December 31, 2011 |
600,518 | $ | 0.81 | |||||||
| Vested |
(416,368 | ) | 0.59 | |||||||
|
|
|
|||||||||
| Outstanding December 31, 2012 |
184,150 | 1.30 | ||||||||
| Vested |
(115,369 | ) | 1.28 | |||||||
|
|
|
|||||||||
| Outstanding December 31, 2013 |
68,781 | 1.35 | ||||||||
| Vested |
(64,596 | ) | 1.35 | |||||||
|
|
|
|||||||||
| Outstanding December 31, 2014 |
4,185 | 1.35 | ||||||||
| Vested (unaudited) |
(4,185 | ) | 1.35 | |||||||
|
|
|
|||||||||
| Outstanding March 31, 2015 (unaudited) |
— | — | ||||||||
|
|
|
|||||||||
As of December 31, 2014, the unrecognized compensation cost related to shares of unvested restricted stock expected to vest was $3,291. This unrecognized compensation will be recognized over an estimated weighted-average amortization period of 0.1 years.
Restricted stock granted under the 2011 Plan generally vests as to 25% of the shares of common stock one year after grant and then vests ratably on a monthly basis over the next 36 months provided that the participant maintains a service relationship with us. All shares of restricted stock issued pursuant to the 2011 Plan are subject to certain transfer restrictions.
F-21
Table of Contents
RAPID7, INC.
Notes to the Consolidated Financial Statements
| (c) | Options |
The following table summarizes information about stock option activity during the reporting periods:
| Shares | Weighted- average exercise price per share |
|||||||||
| Outstanding as of December 31, 2011 |
825,748 | $ | 0.87 | |||||||
| Granted |
1,873,299 | 3.07 | ||||||||
| Exercised |
(207,886 | ) | 0.67 | |||||||
| Forfeited/Cancelled |
(195,144 | ) | 1.66 | |||||||
|
|
|
|||||||||
| Outstanding as of December 31, 2012 |
2,296,017 | 2.62 | ||||||||
| Granted |
1,447,329 | 5.05 | ||||||||
| Exercised |
(239,407 | ) | 1.08 | |||||||
| Forfeited/Cancelled |
(301,604 | ) | 3.31 | |||||||
|
|
|
|||||||||
| Outstanding as of December 31, 2013 |
3,202,335 | 3.77 | ||||||||
| Granted |
791,865 | 7.74 | ||||||||
| Exercised |
(201,200 | ) | 2.41 | |||||||
| Forfeited/Cancelled |
(231,696 | ) | 5.45 | |||||||
|
|
|
|||||||||
| Outstanding as of December 31, 2014 |
3,561,304 | 4.62 | ||||||||
| Granted (unaudited) |
619,539 | 9.77 | ||||||||
| Exercised (unaudited) |
(136,707 | ) | 2.99 | |||||||
| Forfeited/Cancelled (unaudited) |
(37,174 | ) | 7.88 | |||||||
|
|
|
|
||||||||
| Outstanding as of March 31, 2015 (unaudited) |
4,006,962 | 5.44 | ||||||||
|
|
|
|||||||||
| Vested and exercisable as of December 31, 2014 |
2,029,147 | 3.63 | ||||||||
| Vested and expected to vest as of December 31, 2014 |
3,441,608 | 4.56 | ||||||||
| Vested and exercisable as of March 31, 2015 (unaudited) |
2,098,813 | 3.89 | ||||||||
| Vested and expected to vest as of March 31, 2015 (unaudited) |
3,833,109 | 5.33 | ||||||||
As of December 31, 2014, the unrecognized compensation cost related to 1,412,461 unvested stock options expected to vest was $3.9 million. This unrecognized compensation will be recognized over an estimated weighted-average amortization period of 2.4 years.
As of March 31, 2015, the unrecognized compensation cost related to 1,734,296 unvested stock options expected to vest was $5.5 million (unaudited). This unrecognized compensation will be recognized over an estimated weighted-average amortization period of 2.9 years (unaudited).
The total aggregate intrinsic value of options exercised in 2012, 2013 and 2014 was $0.5 million, $1.0 million and $1.1 million, respectively. The total aggregate intrinsic value of options exercised in the three months ended March 31, 2014 and 2015 was $0.2 million (unaudited) and $0.9 million (unaudited), respectively. The aggregate intrinsic value of options outstanding as of December 31, 2014 and options exercisable as of December 31, 2014 was $14.8 million and $10.5 million, respectively. The aggregate intrinsic value of options outstanding as of March 31, 2015 and options exercisable as of March 31, 2015 was $21.8 million (unaudited) and $14.7 million (unaudited), respectively. The total fair value of stock options vested in 2012, 2013 and 2014 was $1.2 million, $1.6 million and $2.4 million, respectively. The total fair value of stock options vested in the three months ended March 31, 2014 and 2015 was $0.7 million (unaudited) and $0.6 million (unaudited),
F-22
Table of Contents
RAPID7, INC.
Notes to the Consolidated Financial Statements
respectively. The weighted-average grant date fair value of stock options granted in 2012, 2013 and 2014 was $2.17, $2.46 and $4.09 per share, respectively. The weighted-average grant date fair value of stock options granted in the three months ended March 31, 2014 and 2015 was $3.74 (unaudited) and $4.39 (unaudited), respectively.
The weighted-average remaining contractual life of options outstanding as of December 31, 2014 and options exercisable as of December 31, 2014 was 7.9 years and 7.4 years, respectively. The weighted-average remaining contractual life of options outstanding as of March 31, 2015 and options exercisable as of March 31, 2015 was 8.0 years (unaudited) and 7.3 years (unaudited), respectively.
Options granted under the 2011 Plan generally vest as to 25% of the underlying shares of common stock one year after grant and then vest ratably on a monthly basis over the next 36 months provided that the participant maintains a service relationship with us, and expire ten years from the date of grant.
| (d) | Determining the Fair Value of Options |
The fair value of options is estimated using the Black-Scholes option pricing model, which takes into account inputs such as the exercise price, the value of the underlying common stock at the grant date, expected term, expected volatility, risk-free interest rate and dividend yield. The fair value of each grant of options during 2012, 2013, 2014 and the three months ended March 31, 2014 and 2015 was determined using the methods and assumptions discussed below.
Expected Term
The expected term represents the period that our stock options are expected to be outstanding. We calculated the expected term using the simplified method as the average of each option’s vesting term and the contractual period during which the option can be exercised, which is typically 10 years following the date of grant.
Expected Volatility
The expected volatility was based on the historical stock volatility of several of our comparable publicly traded companies over a period of time equal to the expected term of the options, as we do not have any trading history to use the volatility of our own common stock.
Risk-Free Interest Rate
The risk-free interest rate was based on an average of the five and seven-year U.S. Treasury zero-coupon issues for each option grant date with maturities approximately equal to the option’s expected term.
Expected Dividend Yield
We have not paid dividends on our common stock nor do we expect to pay dividends in the foreseeable future.
Forfeiture Rate
We estimated our forfeiture rate based on an analysis of our actual forfeitures and will continue to evaluate our forfeiture rate based on actual forfeiture experience.
F-23
Table of Contents
RAPID7, INC.
Notes to the Consolidated Financial Statements
The following table reflects the range of assumptions for options granted during 2012, 2013, 2014 and the three months ended March 31, 2014 and 2015:
| Year Ended December 31, | Three Months Ended March 31, | |||||||||||||||||||
| 2012 | 2013 | 2014 | 2014 | 2015 | ||||||||||||||||
| (unaudited) | ||||||||||||||||||||
| Expected term (in years) |
6.3 | 6.3 | 6.3 | 6.3 | 6.3 | |||||||||||||||
| Expected volatility |
52 - 54% | 50 - 52% | 47 - 49% | 49% | 45% | |||||||||||||||
| Risk-free interest rate |
0.9 -1.4% | 0.9 - 1.7% | 1.5 - 1.7% | 1.5% | 1.5% | |||||||||||||||
| Expected dividend yield |
— | — | — | — | — | |||||||||||||||
| Grant date fair value per share |
$ | 1.77 - 3.82 | $ | 2.14 - 4.65 | $ | 3.74 - 4.88 | $ | 3.74 | $ | 4.39 | ||||||||||
| (10) | Income Taxes |
Loss before income taxes included in the consolidated statements of operations was as follows for 2012, 2013 and 2014:
| Year Ended December 31, | ||||||||||||||||||
| 2012 | 2013 | 2014 | ||||||||||||||||
| (in thousands) | ||||||||||||||||||
| United States |
$ | (12,979 | ) | $ | (18,892 | ) | $ | (32,937 | ) | |||||||||
| Foreign |
167 | 189 | 689 | |||||||||||||||
|
|
|
|
|
|
|
|||||||||||||
| Loss before income taxes |
$ | (12,812 | ) | $ | (18,703 | ) | $ | (32,248 | ) | |||||||||
|
|
|
|
|
|
|
|||||||||||||
Income tax provision (benefit) included in the consolidated statements of operations was as follows for 2012, 2013 and 2014:
| Year Ended December 31, | ||||||||||||||||||
| 2012 |
|
2013 |
|
2014 | ||||||||||||||
| (in thousands) | ||||||||||||||||||
| Current: |
||||||||||||||||||
| Federal |
$ | — | $ | — | $ | — | ||||||||||||
| State and local |
12 | 24 | 22 | |||||||||||||||
| Foreign |
3 | 35 | 161 | |||||||||||||||
|
|
|
|
|
|
|
|||||||||||||
| Total current provision |
15 | 59 | 183 | |||||||||||||||
|
|
|
|
|
|
|
|||||||||||||
| Deferred: |
||||||||||||||||||
| Federal |
(288 | ) | 47 | 180 | ||||||||||||||
| State and local |
(145 | ) | 14 | 14 | ||||||||||||||
| Foreign |
— | 50 | 2 | |||||||||||||||
|
|
|
|
|
|
|
|||||||||||||
| Total deferred (benefit) expense |
(433 | ) | 111 | 196 | ||||||||||||||
|
|
|
|
|
|
|
|||||||||||||
| Total income tax provision (benefit) |
$ | (418 | ) | $ | 170 | $ | 379 | |||||||||||
|
|
|
|
|
|
|
|||||||||||||
F-24
Table of Contents
RAPID7, INC.
Notes to the Consolidated Financial Statements
The table below reconciles the differences between income taxes computed at the federal statutory rate of 34% and our provision for (benefit from) income taxes:
| Year Ended December 31, | ||||||||||||
| 2012 | 2013 | 2014 | ||||||||||
| Expected income tax (benefit) |
34.0 | % | 34.0 | % | 34.0 | % | ||||||
| State taxes net of federal benefit |
1.9 | (0.1 | ) | (0.1 | ) | |||||||
| Permanent differences |
(1.1 | ) | (1.2 | ) | (0.5 | ) | ||||||
| Federal research and development credit |
— | 1.5 | 0.8 | |||||||||
| Foreign rate differential |
— | 0.1 | 0.2 | |||||||||
| Change in valuation allowance |
(31.6 | ) | (35.0 | ) | (35.6 | ) | ||||||
| Other |
— | (0.2 | ) | 0.0 | ||||||||
|
|
|
|
|
|
|
|||||||
| Total income tax provision |
3.2 | % | (0.9 | )% | (1.2 | )% | ||||||
|
|
|
|
|
|
|
|||||||
Net deferred tax assets and liabilities, as set forth in the table below, reflect the impact of temporary differences between the amounts of assets and liabilities recorded for financial statement purposes and such amounts measured in accordance with tax laws:
| Year Ended December 31, | ||||||||||||
| 2013 | 2014 | |||||||||||
| (in thousands) | ||||||||||||
| Deferred tax assets: |
||||||||||||
| Current deferred tax assets: |
||||||||||||
| Accruals and reserves |
$ | 1,466 | $ | 734 | ||||||||
| Other |
575 | 1,426 | ||||||||||
|
|
|
|
|
|||||||||
| Gross current deferred tax asset |
2,041 | 2,160 | ||||||||||
| Less valuation allowance |
(2,041 | ) | (2,160 | ) | ||||||||
|
|
|
|
|
|||||||||
| Net current deferred tax assets |
— | — | ||||||||||
| Non-current deferred tax assets: |
||||||||||||
| Net operating loss carryforwards |
17,357 | 26,640 | ||||||||||
| Deferred revenue |
4,968 | 7,512 | ||||||||||
| Amortization |
5,771 | 5,570 | ||||||||||
| Research and development |
524 | 829 | ||||||||||
| Stock options |
898 | 1,905 | ||||||||||
| Other |
137 | 703 | ||||||||||
|
|
|
|
|
|||||||||
| Gross non-current deferred tax asset |
29,655 | 43,159 | ||||||||||
| Less valuation allowance |
(29,652 | ) | (43,154 | ) | ||||||||
|
|
|
|
|
|||||||||
| Net non-current deferred tax assets |
3 | 5 | ||||||||||
|
|
|
|
|
|||||||||
| Total net deferred tax assets |
3 | 5 | ||||||||||
|
|
|
|
|
|||||||||
| Deferred tax liabilities: |
||||||||||||
| Intangible assets |
(205 | ) | (317 | ) | ||||||||
| Depreciation |
(12 | ) | (15 | ) | ||||||||
|
|
|
|
|
|||||||||
| Total net deferred tax liability |
(217 | ) | (332 | ) | ||||||||
|
|
|
|
|
|||||||||
| Net deferred tax liability |
$ | (214 | ) | $ | (327 | ) | ||||||
|
|
|
|
|
|||||||||
F-25
Table of Contents
RAPID7, INC.
Notes to the Consolidated Financial Statements
We recorded a deferred tax provision of $0.1 million for each of 2012, 2013 and 2014 relating to tax amortization of goodwill with a corresponding increase to the deferred tax liability. Accordingly, as of December 31, 2013 and 2014, we have recorded a net deferred tax liability and provided a full valuation allowance for our remaining United States deferred tax assets since it is more likely than not that these future benefits will not be realized. If we achieve future profitability, a significant portion of these deferred tax assets could be available to offset future income taxes.
As a result of our acquisition of Mobilisafe in 2012, we recognized a portion of our valuation allowance as we recorded intangible assets for which there is no tax basis. Accordingly, we recorded a net deferred tax liability in connection with the acquisition. The net deferred tax liability was offset with deferred tax assets previously recorded, which resulted in a reduction in the valuation allowance. The decrease in the valuation allowance resulted in a $0.5 million deferred income tax benefit for the year ended December 31, 2012. This income tax benefit was offset by $0.1 million of deferred tax provision associated with tax deductible goodwill discussed above.
As of December 31, 2014, we had available net operating loss carryforwards for federal and state tax purposes of approximately $71.7 million and $59.1 million, respectively. Of these amounts, $1.9 million relate to stock-based compensation tax deductions in excess of book compensation expense (APIC NOLs) that will be credited to additional paid-in capital when such deductions reduce taxes payable as determined based on a “with-and-without” approach. APIC NOLs will reduce federal and state taxes payable if realized in future periods, but the net operating loss carryforwards relating to such benefits are not included in the table above. The federal and state loss carryforwards expire at various dates beginning in 2029.
Pursuant to Section 382 of the Internal Revenue Code of 1986, as amended (IRC), an ownership change occurs when the stock ownership percentage of identified 5% stockholders increases by more than 50% over a three year testing period. Ownership changes, as defined by IRC Section 382, act to limit the amount of net operating losses that a company may utilize to offset future taxable income and taxes payable. During the periods presented, we determined that a small limitation on our historical net operating losses exists, however we nevertheless project that none of our net operating losses will expire unutilized as a result of this limitation. As a result, none of our net operating loss deferred tax assets have been written off as of December 31, 2014. If it is determined that a change occurs in a year subsequent to December 31, 2014, additional net operating loss limitations may occur in the future.
We also had federal and state research and development credit carryforwards of $0.7 million and $0.1 million as of December 31, 2014, respectively. These credit carryforwards expire at various dates beginning in 2029.
The valuation allowance increased by $13.6 million for the year ended December 31, 2014, due primarily to additional operating losses generated during the year.
F-26
Table of Contents
RAPID7, INC.
Notes to the Consolidated Financial Statements
We account for uncertain tax positions in accordance with the provisions of FASB Accounting Standards Codification (ASC) 740, Accounting for Income Taxes. ASC 740 prescribes a recognition threshold and measurement process for financial statement recognition and measurement of a tax position taken or expected to be taken in a tax return. ASC 740 also provides guidance on de-recognition, classification, interest and penalties, accounting in interim periods and disclosure. Any interest expense and penalties on any income tax liability would be reported as income tax expense. The changes to uncertain tax positions during 2013 and 2014 were as follows:
| Year Ended December 31, | ||||||||||||
| 2013 | 2014 | |||||||||||
| (in thousands) | ||||||||||||
| Beginning balance |
$ | 21 | $ | 35 | ||||||||
| Additions based on current year tax positions |
14 | — | ||||||||||
|
|
|
|
|
|||||||||
| Ending balance |
$ | 35 | $ | 35 | ||||||||
|
|
|
|
|
|||||||||
We file federal, state and foreign income tax returns. In the normal course of business, we are subject to examination by federal, state, and foreign jurisdictions, where applicable. The statute of limitations for these jurisdictions is generally three to six years. However, to the extent we utilize net operating losses or other similar carryforward attributes such as credits, the statute remains open to the extent of the net operating losses or credits that are utilized. We have no tax returns under examination as of December 31, 2014. There were no penalties recorded as of December 31, 2013 or 2014. During the next twelve months, we do not expect any changes to our uncertain tax positions other than the accrual of interest in the normal course of business.
| (11) | Net Loss Per Share |
The following table summarizes the computation of basic and diluted net loss per share of our common stock for 2012, 2013, 2014 and the three months ended March 31, 2014 and 2015:
| Year Ended December 31, | Three Months Ended | |||||||||||||||||||||||||||||
| 2012 | 2013 | 2014 | 2014 | 2015 | ||||||||||||||||||||||||||
| (in thousands, except share and per share data) | ||||||||||||||||||||||||||||||
| (unaudited) | ||||||||||||||||||||||||||||||
| Numerator |
||||||||||||||||||||||||||||||
| Net loss |
$ | (12,394 | ) | $ | (18,873 | ) | $ | (32,627 | ) | $ | (8,478 | ) | $ | (7,682 | ) | |||||||||||||||
| Accretion of preferred stock to redemption value |
(25,606 | ) | (33,553 | ) | (52,336 | ) | (12,178 | ) | (11,273 | ) | ||||||||||||||||||||
|
|
|
|
|
|
|
|
|
|
|
|||||||||||||||||||||
| Net loss attributable to common stockholders, basic and diluted |
$ | (38,000 | ) | $ | (52,426 | ) | $ | (84,963 | ) | $ | (20,656 | ) | $ | (18,955 | ) | |||||||||||||||
|
|
|
|
|
|
|
|
|
|
|
|||||||||||||||||||||
| Denominator |
||||||||||||||||||||||||||||||
| Weighted-average common shares outstanding, basic and diluted |
12,308,428 | 12,549,266 | 12,770,916 | 12,716,675 | 12,642,188 | |||||||||||||||||||||||||
|
|
|
|
|
|
|
|
|
|
|
|||||||||||||||||||||
| Net loss per share attributable to common stockholders, basic and diluted |
$ | (3.09 | ) | $ | (4.18 | ) | $ | (6.65 | ) | $ | (1.62 | ) | $ | (1.50 | ) | |||||||||||||||
|
|
|
|
|
|
|
|
|
|
|
|||||||||||||||||||||
F-27
Table of Contents
RAPID7, INC.
Notes to the Consolidated Financial Statements
The following potentially dilutive securities outstanding, prior to the use of the treasury stock method or if-converted method, have been excluded from the computation of diluted weighted-average shares outstanding for the respective periods below because they would have been anti-dilutive:
| Year Ended December 31, | Three Months Ended March 31, |
|||||||||||||||||||||||||||
| 2012 | 2013 | 2014 | 2014 | 2015 | ||||||||||||||||||||||||
| (unaudited) | ||||||||||||||||||||||||||||
| Options to purchase common stock |
2,296,017 | 3,202,335 | 3,561,304 | 3,583,887 | 4,006,962 | |||||||||||||||||||||||
| Restricted stock |
184,150 | 68,781 | 4,185 | 46,767 | — | |||||||||||||||||||||||
| Warrants to purchase common stock |
— | 200,000 | 200,000 | 200,000 | 200,000 | |||||||||||||||||||||||
| Convertible preferred stock |
13,696,099 | 13,696,099 | 16,382,615 | 13,696,099 | 16,382,615 | |||||||||||||||||||||||
|
|
|
|
|
|
|
|
|
|
|
|||||||||||||||||||
| Total |
16,176,266 | 17,167,215 | 20,148,104 | 17,526,753 | 20,589,577 | |||||||||||||||||||||||
|
|
|
|
|
|
|
|
|
|
|
|||||||||||||||||||
We have excluded shares of common stock issuable in connection with the IPO Participation Payment from the table above and the calculation of diluted net loss per share. The number of shares of common stock to be issued in connection with the IPO Participation Payment is dependent on the offering price per share of common stock in the Qualified Public Offering and therefore is not determinable until the occurrence of a Qualified Public Offering. See note 8(b) to the consolidated financial statements.
Pro Forma Net Loss Per Share (Unaudited)
Pro forma basic and diluted net loss per share have been computed to give effect to the conversion of our Preferred Stock into common stock as of the beginning of the period presented or the original issuance date, if later. The following table shows the calculation of the unaudited pro forma basic and diluted net loss per share (in thousands, except share and per share data):
| Year Ended December 31, 2014 |
Three Months Ended March 31, 2015 |
|||||||||
| Numerator: |
||||||||||
| Net loss attributable to common stockholders |
$ | (84,963 | ) | $ | (18,955 | ) | ||||
| Accretion of preferred stock to redemption value |
||||||||||
| Beneficial conversion feature relating to IPO Participation Payment |
||||||||||
|
|
|
|
|
|||||||
| Pro forma net loss attributable to common stockholders |
||||||||||
|
|
|
|
|
|||||||
| Denominator: |
||||||||||
| Weighted-average common shares outstanding, basic and diluted |
12,770,916 | 12,642,188 | ||||||||
| Pro forma adjustment to reflect assumed conversion of convertible preferred stock |
||||||||||
| Pro forma adjustment to reflect common stock issuable in connection with IPO Participation Payment |
||||||||||
|
|
|
|
|
|||||||
| Pro forma weighted-average common shares outstanding, basic and diluted |
||||||||||
|
|
|
|
|
|||||||
| Pro forma net loss per share attributable to common stockholders, basic and diluted |
$ | $ | ||||||||
|
|
|
|
|
|||||||
F-28
Table of Contents
RAPID7, INC.
Notes to the Consolidated Financial Statements
| (12) | Commitments and Contingencies |
| (a) | Leases |
We have operating lease commitments for our facilities that expire at various dates through 2019. For operating leases that contain rent escalation or rent concession provisions, we record the total rent expense on a straight-line basis over the term of the lease. We record the difference between the rent paid and the straight-line rent as a deferred rent liability on the accompanying consolidated balance sheets.
Rent expense was $2.7 million, $2.9 million and $3.5 million for 2012, 2013 and 2014, respectively, and $0.9 million (unaudited) for each of the three months ended March 31, 2014 and 2015.
We also lease certain equipment and furniture under non-cancelable capital lease agreements, which are included in other current and long-term liabilities in the accompanying consolidated balance sheets. As of December 31, 2014, we had one capital lease for equipment. Capital leases are capitalized using interest rates considered appropriate at the inception of each lease. Capital lease obligations amounted to $0.5 million, $0.3 million and $0.3 million (unaudited) as of December 31, 2013, December 31, 2014 and March 31, 2015, respectively.
The approximate future minimum payments under non-cancelable operating leases and future minimum capital lease payments as of December 31, 2014 are as follows:
| Capital leases |
|
Operating leases |
||||||||
| Year ending December 31: |
(in thousands) | |||||||||
| 2015 |
$ | 278 | $ | 3,578 | ||||||
| 2016 |
70 | 3,758 | ||||||||
| 2017 |
— | 3,432 | ||||||||
| 2018 |
— | 2,114 | ||||||||
| 2019 |
— | 1,410 | ||||||||
|
|
|
|
|
|||||||
| Total minimum lease payments |
$ | 348 | $ | 14,292 | ||||||
| Less amount representing interest at 12% |
27 | |||||||||
|
|
|
|||||||||
| Present value of net minimum capital lease payments |
321 | |||||||||
| Less current installments of obligations under capital leases |
253 | |||||||||
|
|
|
|||||||||
| Obligations under capital leases, excluding current installments |
$ | 68 | ||||||||
|
|
|
|||||||||
| (b) | Warranty |
We provide limited product warranties. Historically, any payments made under these provisions have been immaterial.
| (c) | Litigation and Claims |
From time to time, in the normal course of business, various claims are made by customers or other third parties against us, or such claims may be pending or threatened. When we believe that an adverse outcome from such a claim is both probable and estimable, a reserve for the estimated liability is recorded.
We do not expect any liabilities from claims to have a material adverse effect on our financial position or results of operations.
F-29
Table of Contents
RAPID7, INC.
Notes to the Consolidated Financial Statements
| (d) | Indemnification Obligations |
We agree to standard indemnification provisions in the ordinary course of business. Pursuant to these provisions, we agree to indemnify, hold harmless and reimburse the indemnified party for losses suffered or incurred by the indemnified party, generally our customers, in connection with any United States patent, copyright or other intellectual property infringement claim by any third party arising from the use of our products or services in accordance with the agreement or arising from our gross negligence, willful misconduct or violation of the law (provided that there is not gross or willful misconduct on the part of the other party) with respect to our products or services. The term of these indemnification provisions is generally perpetual from the time of execution of the agreement. We carry insurance that covers certain third-party claims relating to our services and limits our exposure. We have never incurred costs to defend lawsuits or settle claims related to these indemnification provisions.
| (13) | Employee Benefit Plan |
On December 31, 2008, we established a discretionary 401(k) plan in which all full-time employees above age 18 are eligible to participate 90 days following the applicable date of hire. We did not make any contributions to the plan in 2012, 2013, 2014 or the three months ended March 31, 2015 (unaudited).
| (14) | Segment Information and Information about Geographic Areas |
We operate in one segment. Our chief operating decision maker is our Chief Executive Officer, who makes operating decisions, assesses performance and allocates resources on a consolidated basis. All of our principal operations and decision-making functions are located in the United States.
Net revenues by geographic area presented based upon the location of the customer are as follows:
| Year Ended December 31, | Three Months Ended March 31, | |||||||||||||||||||||||||||
| 2012 | 2013 | 2014 | 2014 | 2015 | ||||||||||||||||||||||||
| (in thousands) | ||||||||||||||||||||||||||||
| (unaudited) | ||||||||||||||||||||||||||||
| North America |
$ | 41,844 | $ | 53,809 | $ | 67,390 | $ | 15,013 | $ | 20,344 | ||||||||||||||||||
| Other |
4,200 | 6,221 | 9,490 | 1,723 | 3,227 | |||||||||||||||||||||||
|
|
|
|
|
|
|
|
|
|
|
|||||||||||||||||||
| Total |
$ | 46,044 | $ | 60,030 | $ | 76,880 | $ | 16,736 | $ | 23,571 | ||||||||||||||||||
|
|
|
|
|
|
|
|
|
|
|
|||||||||||||||||||
Of the net revenues generated in North America, 88%, 86%, 84%, 87% (unaudited) and 83% (unaudited) were generated in the United States in 2012, 2013, 2014 and the three months ended March 31, 2014 and 2015, respectively.
As of December 31, 2013 and 2014 and March 31, 2015 (unaudited), substantially all of our property and equipment was located within the United States.
| (15) | Related Party Transactions |
In December 2014, we entered into a Series D Convertible Preferred Stock Purchase Agreement pursuant to which we issued and sold to investors, including certain executive officers and funds affiliated with certain of our directors and 5% stockholders, an aggregate of 2,686,516 shares of our Series D stock at a purchase price of $11.554 per share, for aggregate consideration of $31.0 million.
F-30
Table of Contents
RAPID7, INC.
Notes to the Consolidated Financial Statements
| (16) | Subsequent Events (Unaudited) |
In preparing the financial statements as of and for the year ended December 31, 2014, we evaluated subsequent events for recognition and measurement purposes through April 29, 2015, the date that the independent auditors’ report was originally issued and the audited annual consolidated financial statements were available for issuance. After the original issuance of the consolidated financial statements and through June 26, 2015, we have evaluated subsequent events or transactions that have occurred that may require disclosure in the accompanying financial statements. Except as described below, we have concluded that no events or transactions have occurred that require disclosure in the accompanying financial statements.
On April 30, 2015, we acquired 100% of the outstanding equity of NT OBJECTives, Inc. (NTO). We acquired NTO to expand our web application security offerings. This transaction will be accounted for as a business combination using the acquisition method. We acquired NTO for total consideration of $6.5 million. We made an initial payment of $3.4 million in cash and issued $0.1 million (9,091 shares) of our common stock upon the closing of the acquisition and are obligated to make additional payments of $1.5 million, less the amount of any indemnity claims, on the first and second anniversary dates of the closing. In addition, certain retained employees of NTO received 416,117 restricted shares of our common stock, which will vest subject to continued service, and are eligible to receive up to $3.0 million in additional cash payments over a period of four years, subject to attaining certain performance metrics and service conditions.
On May 5, 2015, we granted stock options to certain of our employees and directors to purchase up to an aggregate of 321,364 shares of our common stock at an exercise price equal to $10.88 per share.
F-31
Table of Contents

Table of Contents
Table of Contents
PART II
INFORMATION NOT REQUIRED IN PROSPECTUS
| Item 13. | Other Expenses of Issuance and Distribution. |
The following table sets forth all costs and expenses, other than underwriting discounts and commissions, payable by us in connection with the sale of the common stock being registered. All amounts shown are estimates except for the SEC registration fee and the FINRA filing fee.
| Amount to be Paid |
||||
| SEC registration fee |
$ | * | ||
| FINRA filing fee |
* | |||
| NASDAQ Global Market initial listing fee |
125,000 | |||
| Blue sky fees and expenses |
* | |||
| Printing and engraving |
* | |||
| Legal fees and expenses |
* | |||
| Accounting fees and expenses |
* | |||
| Transfer agent and registrar fees |
* | |||
| Miscellaneous fees and expenses |
* | |||
|
|
|
|||
| Total |
$ | * | ||
|
|
|
|||
| * | To be filed by amendment. |
| Item 14. | Indemnification of Directors and Officers. |
We are incorporated under the laws of the State of Delaware. Section 102 of the Delaware General Corporation Law permits a corporation to eliminate the personal liability of directors of a corporation to the corporation or its stockholders for monetary damages for a breach of fiduciary duty as a director, except where the director breached his or her duty of loyalty, failed to act in good faith, engaged in intentional misconduct or knowingly violated a law, authorized the payment of a dividend or approved a stock repurchase in violation of Delaware corporate law or obtained an improper personal benefit.
Section 145 of the Delaware General Corporation Law provides that a corporation has the power to indemnify a director, officer, employee or agent of the corporation and certain other persons serving at the request of the corporation in related capacities against expenses (including attorneys’ fees), judgments, fines and amounts paid in settlements actually and reasonably incurred by the person in connection with an action, suit or proceeding to which he is or is threatened to be made a party by reason of such position, if such person acted in good faith and in a manner he reasonably believed to be in or not opposed to the best interests of the corporation, and, in any criminal action or proceeding, had no reasonable cause to believe his or her conduct was unlawful, except that, in the case of actions brought by or in the right of the corporation, no indemnification shall be made with respect to any claim, issue or matter as to which such person shall have been adjudged to be liable to the corporation unless and only to the extent that the Court of Chancery or other adjudicating court determines that, despite the adjudication of liability but in view of all of the circumstances of the case, such person is fairly and reasonably entitled to indemnity for such expenses which the Court of Chancery or such other court shall deem proper.
As permitted by the Delaware General Corporation Law, our amended and restated certificate of incorporation and amended and restated bylaws will provide that: (1) we are required to indemnify our directors to the fullest extent permitted by the Delaware General Corporation Law; (2) we may, in our discretion, indemnify our officers, employees and agents as set forth in the Delaware General Corporation Law; (3) we are required, upon satisfaction of certain conditions, to advance all expenses incurred by our directors in connection with certain legal proceedings; (4) the rights conferred in the bylaws are not exclusive; and (5) we are authorized to enter into indemnification agreements with our directors, officers, employees and agents.
II-1
Table of Contents
Our policy is to enter into agreements with our directors that require us to indemnify them against expenses, judgments, fines, settlements and other amounts that any such person becomes legally obligated to pay (including with respect to a derivative action) in connection with any proceeding, whether actual or threatened, to which such person may be made a party by reason of the fact that such person is or was a director or officer of us or any of our affiliates, provided such person acted in good faith and in a manner such person reasonably believed to be in, or not opposed to, our best interests. These indemnification agreements also set forth certain procedures that will apply in the event of a claim for indemnification thereunder. At present, no litigation or proceeding is pending that involves any of our directors or officers regarding which indemnification is sought, nor are we aware of any threatened litigation that may result in claims for indemnification.
We maintain a directors’ and officers’ liability insurance policy. The policy insures directors and officers against unindemnified losses arising from certain wrongful acts in their capacities as directors and officers and reimburses us for those losses for which we have lawfully indemnified the directors and officers. The policy contains various exclusions.
In addition, the underwriting agreement filed as Exhibit 1.1 to this registration statement provides for indemnification by the underwriters of us and our officers and directors for certain liabilities arising under the Securities Act, or otherwise. Our amended and restated investors’ rights agreement with certain stockholders also provides for cross-indemnification in connection with the registration of our common stock on behalf of such investors.
| Item 15. | Recent Sales of Unregistered Securities. |
The following list sets forth information regarding all unregistered securities issued by us since January 1, 2012 through the date of this registration statement:
Issuances of Common Stock and Options to Purchase Common Stock
From January 1, 2012 through the date of this registration statement, we have granted under our 2011 Plan options to purchase an aggregate of 5,053,396 shares of our common stock to employees, consultants and directors, having exercise prices ranging from $0.75 to $10.88 per share. Of these, options to purchase an aggregate of 664,577 shares have been cancelled without being exercised. From January 1, 2012 through the date of this registration statement, an aggregate of 846,212 shares of our common stock have been issued upon the exercise of stock options under our 2011 Plan, at exercise prices between $0.30 and $7.73 per share, for aggregate proceeds of approximately $1.5 million. From January 1, 2012 through the date of this registration statement, we have issued under our 2011 Plan 416,117 shares of restricted common stock to employees, consultants and directors, at a purchase price of $10.88 per share.
On October 8, 2012, we issued an aggregate of 411,379 shares of our common stock to certain stockholders of Mobilisafe, Inc. in connection with our acquisition of Mobilisafe, Inc.
On April 30, 2015, we issued 9,091 shares of common stock to one accredited investor who was a security holder of NT OBJECTives, Inc. as partial consideration for the acquisition of NT OBJECTives, Inc.
The offers, sales and issuances of the securities described in the preceding paragraphs were deemed to be exempt from registration under Rule 701 promulgated under the Securities Act, or Rule 701, in that the transactions were by an issuer not involving any public offering or under Section 4(a)(2) of the Securities Act or under compensatory benefit plans and contracts relating to compensation as provided under Rule 701. The recipients of such securities were our employees, directors or consultants and received the securities under our equity incentive plans. Appropriate legends were affixed to the securities issued in these transactions.
Issuances of Preferred Stock
In December 2014, we issued an aggregate of 2,686,516 shares of our Series D preferred stock at a purchase price of $11.554 per share for aggregate consideration of $31.0 million to 17 accredited investors.
II-2
Table of Contents
The offers, sales and issuances of the securities described in the preceding paragraph were deemed to be exempt from registration under the Securities Act in reliance on Section 4(a)(2) of the Securities Act or Rule 506 of Regulation D promulgated thereunder as a transaction by an issuer not involving a public offering. The recipients of securities in each of these transactions acquired the securities for investment only and not with a view to or for sale in connection with any distribution thereof, and appropriate legends were affixed to the securities issued in these transactions. Each of the recipients of securities in these transactions was either an accredited investor within the meaning of Rule 501 of Regulation D under the Securities Act or had adequate access, through employment, business or other relationships, to information about us.
| Item 16. | Exhibits and Financial Statement Schedules. |
(a) Exhibits
| Exhibit Number |
Description of Document | |
| 1.1† | Form of Underwriting Agreement. | |
| 3.1* | Amended and Restated Certificate of Incorporation of Rapid7, Inc., as amended and as currently in effect. | |
| 3.2 | Form of Amended and Restated Certificate of Incorporation of Rapid7, Inc. to be effective upon completion of this offering. | |
| 3.3* | Bylaws of Rapid7, Inc., as currently in effect. | |
| 3.4* | Form of Amended and Restated Bylaws of Rapid7, Inc. to be effective upon completion of this offering. | |
| 4.1† | Form of common stock certificate of Rapid7, Inc. | |
| 4.2* | Amended and Restated Investors’ Rights Agreement by and among Rapid7, Inc. and certain of its stockholders, dated December 9, 2014. | |
| 5.1† | Opinion of Cooley LLP. | |
| 10.1* | Office Lease Agreement, dated as of November 11, 2013, by and between Rapid7, Inc. and MA-100 Summer Street Owner, L.L.C., as amended to date. | |
| 10.2+* | 2011 Stock Option and Grant Plan and Forms of Stock Option Agreement, Stock Option Exercise Notice and Restricted Stock Agreement thereunder. | |
| 10.3+† | Form of 2015 Equity Incentive Plan and Forms of Stock Option Agreement, Notice of Exercise, Stock Option Grant Notice and Restricted Stock Unit Agreement thereunder. | |
| 10.4+† | 2015 Employee Stock Purchase Plan. | |
| 10.5 | Intentionally omitted. | |
| 10.6+ | 2014 Bonus Plan of Rapid7, Inc. | |
| 10.7+ | 2015 Bonus Plan of Rapid7, Inc. | |
| 10.8+* | Form of Indemnification Agreement by and between Rapid7, Inc. and each of its directors and executive officers. | |
| 10.9+* | Employment Agreement, dated as of January 3, 2013, by and between Rapid7, Inc. and Corey Thomas. | |
| 10.10+* | Offer Letter Agreement, dated as of December 4, 2012, by and between Rapid7, Inc. and Steven Gatoff. | |
| 10.11+* | Offer Letter Agreement, dated as of June 13, 2013, by and between Rapid7 UK Limited and Richard Moseley. | |
| 10.12* | Subordinated Loan and Security Agreement, dated as of December 27, 2013, by and between Rapid7, Inc. and Silicon Valley Bank. | |
| 10.13 | Common Stock Purchase Agreement by and among Rapid7, Inc., TCV VII, LP., TCV VII (A), L.P. and TCV Members Fund, L.P., dated June 25, 2015. | |
| 16.1* | Letter from PricewaterhouseCoopers LLP to the Securities and Exchange Commission dated April 29, 2015. | |
| 21.1* | Subsidiaries of Rapid7, Inc. | |
| 23.1 | Consent of KPMG LLP, independent registered public accounting firm. | |
| 23.2† | Consent of Cooley LLP (included in Exhibit 5.1). | |
| 24.1* | Power of Attorney. Reference is made to the signature page hereto. |
II-3
Table of Contents
| * | Previously filed. |
| † | To be filed by amendment. |
| + | Indicates management contract or compensatory plan. |
| Item 17. | Undertakings. |
The undersigned registrant hereby undertakes to provide to the underwriters at the closing specified in the underwriting agreement, certificates in such denominations and registered in such names as required by the underwriters to permit prompt delivery to each purchaser.
Insofar as indemnification for liabilities arising under the Securities Act may be permitted to directors, officers and controlling persons of the registrant pursuant to the foregoing provisions, or otherwise, the registrant has been advised that in the opinion of the Securities and Exchange Commission such indemnification is against public policy as expressed in the Securities Act and is, therefore, unenforceable. In the event that a claim for indemnification against such liabilities (other than the payment by the registrant of expenses incurred or paid by a director, officer or controlling person of the registrant in the successful defense of any action, suit or proceeding) is asserted by such director, officer or controlling person in connection with the securities being registered, the registrant will, unless in the opinion of its counsel the matter has been settled by controlling precedent, submit to a court of appropriate jurisdiction the question whether such indemnification by it is against public policy as expressed in the Securities Act and will be governed by the final adjudication of such issue.
The undersigned registrant hereby undertakes that:
(1) For purposes of determining any liability under the Securities Act, the information omitted from the form of prospectus filed as part of this registration statement in reliance upon Rule 430A and contained in a form of prospectus filed by the registrant pursuant to Rule 424(b)(1) or (4) or 497(h) under the Securities Act shall be deemed to be part of this registration statement as of the time it was declared effective.
(2) For the purpose of determining any liability under the Securities Act, each post-effective amendment that contains a form of prospectus shall be deemed to be a new registration statement relating to the securities offered therein, and the offering of such securities at that time shall be deemed to be the initial bona fide offering thereof.
II-4
Table of Contents
SIGNATURES
Pursuant to the requirements of the Securities Act of 1933, as amended, the Registrant has duly caused this Registration Statement to be signed on its behalf by the undersigned, thereunto duly authorized, in Boston, Massachusetts, on the 26th day of June, 2015.
| RAPID7, INC. |
| /s/ Steven Gatoff |
| Steven Gatoff |
| Chief Financial Officer |
Pursuant to the requirements of the Securities Act of 1933, as amended, this Registration Statement has been signed by the following persons in the capacities and on the dates indicated.
| Signature |
Title |
Date | ||
| * Corey Thomas |
President, Chief Executive Officer and Director (Principal Executive Officer) |
June 26, 2015 | ||
| /s/ Steven Gatoff Steven Gatoff |
Chief Financial Officer (Principal Financial Officer and Principal Accounting Officer) |
June 26, 2015 | ||
| * Alan Matthews |
Chairman of the Board of Directors | June 26, 2015 | ||
| * Michael Berry |
Director | June 26, 2015 | ||
| * Benjamin Holzman |
Director | June 26, 2015 | ||
| * Timothy McAdam |
Director | June 26, 2015 | ||
| * J. Benjamin Nye |
Director | June 26, 2015 | ||
| * John Sweeney |
Director | June 26, 2015 | ||
| * Christopher Young |
Director | June 26, 2015 | ||
| By: | /s/ Steven Gatoff | |
| Steven Gatoff, Attorney-in-Fact |
Table of Contents
EXHIBIT INDEX
| Exhibit Number |
Description of Document | |
| 1.1† | Form of Underwriting Agreement. | |
| 3.1* | Amended and Restated Certificate of Incorporation of Rapid7, Inc., as amended and as currently in effect. | |
| 3.2 | Form of Amended and Restated Certificate of Incorporation of Rapid7, Inc. to be effective upon completion of this offering. | |
| 3.3* | Bylaws of Rapid7, Inc., as currently in effect. | |
| 3.4* | Form of Amended and Restated Bylaws of Rapid7, Inc. to be effective upon completion of this offering. | |
| 4.1† | Form of common stock certificate of Rapid7, Inc. | |
| 4.2* | Amended and Restated Investors’ Rights Agreement by and among Rapid7, Inc. and certain of its stockholders, dated December 9, 2014. | |
| 5.1† | Opinion of Cooley LLP. | |
| 10.1* | Office Lease Agreement, dated as of November 11, 2013, by and between Rapid7, Inc. and MA-100 Summer Street Owner, L.L.C., as amended to date. | |
| 10.2+* | 2011 Stock Option and Grant Plan and Forms of Stock Option Agreement, Stock Option Exercise Notice and Restricted Stock Agreement thereunder. | |
| 10.3+† | Form of 2015 Equity Incentive Plan and Forms of Stock Option Agreement, Notice of Exercise, Stock Option Grant Notice and Restricted Stock Unit Agreement thereunder. | |
| 10.4+† | 2015 Employee Stock Purchase Plan. | |
| 10.5 | Intentionally omitted. | |
| 10.6+ | 2014 Bonus Plan of Rapid7, Inc. | |
| 10.7+ | 2015 Bonus Plan of Rapid7, Inc. | |
| 10.8+* | Form of Indemnification Agreement by and between Rapid7, Inc. and each of its directors and executive officers. | |
| 10.9+* | Employment Agreement, dated as of January 3, 2013, by and between Rapid7, Inc. and Corey Thomas. | |
| 10.10+* | Offer Letter Agreement, dated as of December 4, 2012, by and between Rapid7, Inc. and Steven Gatoff. | |
| 10.11+* | Offer Letter Agreement, dated as of June 13, 2013, by and between Rapid7 UK Limited and Richard Moseley. | |
| 10.12* | Subordinated Loan and Security Agreement, dated as of December 27, 2013, by and between Rapid7, Inc. and Silicon Valley Bank. | |
| 10.13 | Common Stock Purchase Agreement by and among Rapid7, Inc., TCV VII, L.P., TCV VII (A), L.P. and TCV Member Fund, L.P., dated June 25, 2015. | |
| 16.1* | Letter from PricewaterhouseCoopers LLP to the Securities and Exchange Commission dated April 29, 2015. | |
| 21.1* | Subsidiaries of Rapid7, Inc. | |
| 23.1 | Consent of KPMG LLP, independent registered public accounting firm. | |
| 23.2† | Consent of Cooley LLP (included in Exhibit 5.1). | |
| 24.1* | Power of Attorney. Reference is made to the signature page hereto. |
| * | Previously filed. |
| † | To be filed by amendment. |
| + | Indicates management contract or compensatory plan. |