Attached files
| file | filename |
|---|---|
| 8-K - FORM 8-K - Summit Materials, Inc. | d944886d8k.htm |
 Transaction Overview
Summit Materials, LLC ("Summit", the "Company“ or the
"Borrower") is a leading, vertically-integrated, geographically diverse construction materials company supplying aggregates, cement, ready-mixed concrete, asphalt and related paving
and construction services for a variety of end-uses in the U.S.
construction industry and western Canada Summit plans to complete,
through its subsidiary Continental Cement Company, L.L.C. ("Continental Cement" or "CCC"), the acquisition of Lafarge North America Inc.’s Davenport, Iowa cement plant and seven cement distribution terminals
("Davenport Assets") for $450 million plus CCC’s Bettendorf, Iowa
cement distribution terminal (the "Transaction") LTM
March 2015, the Davenport Assets’ Pro Forma Revenue and Pro Forma Adjusted EBITDA was $146 and $56 1 million, respectively Transaction is expected to close in July 2015 and is contingent on final regulatory approval and the Lafarge-Holcim merger
closing
$370 million paid at closing; $80 million to be paid no later than
12/31/15 Summit intends to finance the initial $370 million,
refinance its existing Term Loan B due 2019 and refinance a portion
of its existing Senior Unsecured Notes due 2020 with a new $650 million Term
Loan B ("TLB") due 2022 and new $275 million Senior
Unsecured Notes (“New Notes”) Summit intends to satisfy
$80 million via an equity raise In LTM Q1 2015, Summit’s Pro
Forma Net Revenue and Pro Forma Adjusted EBITDA was $1,315 and $268 million, respectively 2 Pro Forma for the completion of the Davenport Assets transaction, Secured Net Leverage of 2.5x
and Net Leverage of 4.6x
(1) Includes approximately $2 million of run-rate synergies (low end of $2-$4 million of estimated synergies range). See
“Davenport Assets EBITDA Bridge” on slide 39 for more information. (2) Pro forma for all Summit completed acquisitions as of 3/28/15 and for the purchase of the Davenport Assets. See “Davenport Assets
EBITDA Bridge” and “Summit EBITDA Bridge” on slides 39 and 38, respectively, for more information. Summit LTM Q1 2015 Pro Forma Net Revenue calculated by subtracting Summit’s net revenue for Q1 2014 from
Summit’s net revenue for fiscal 2014 and adding Summit’s net revenue for the Q1 2015 and estimated net revenue for the Davenport Assets for LTM Q1 2015.
Exhibit 99.1 |
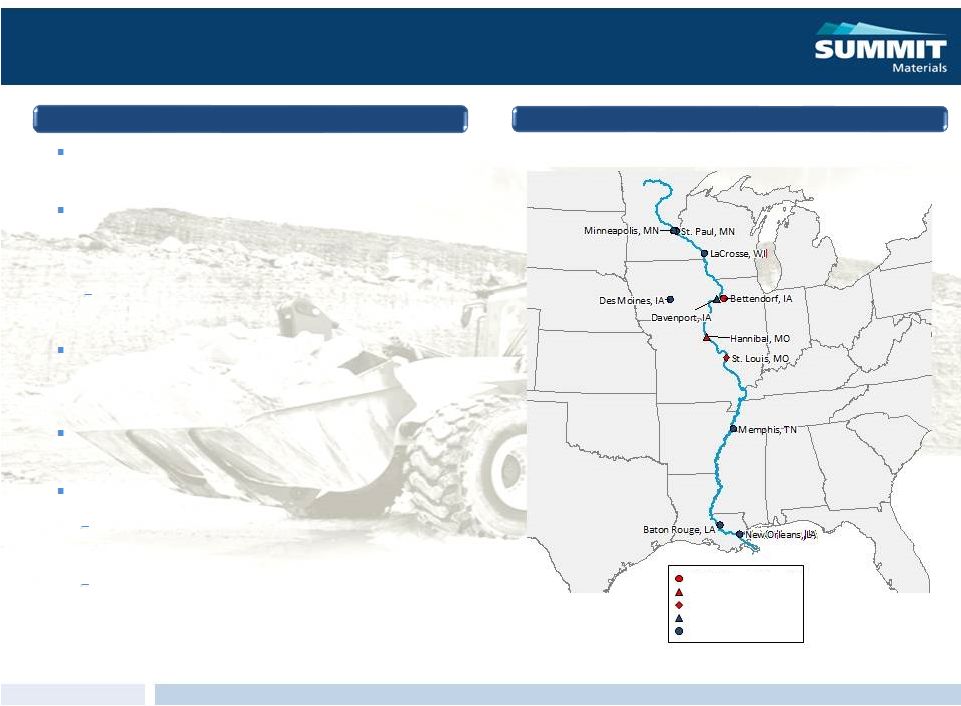 Davenport Assets Overview
One cement plant and seven cement distribution terminals
along the Mississippi River
Cement plant located in Davenport, IA along the Mississippi
River and produces one clinker type and two cement types
(both low alkali)
Effective capacity of approximately 1.2 million short
tons (“mt”) of cement
Combination with Summit’s Continental Cement business
creates a strategically compelling and complementary
multi-plant cement business
Located in attractive growth markets in the midwestern
United States LTM March 2015, the Davenport Assets: Produced $146 million of Pro Forma Revenue and $56 million 1 of Pro Forma Adjusted EBITDA Sold 1.5mt of cement through the seven distribution terminals; 1.2mt supplied by the Davenport plant and 0.3mt from other sources Business Overview Geographic Footprint CCC Bettendorf Terminal CCC Hannibal Plant CCC Terminal Davenport Plant Davenport Terminal (1) Includes approximately $2 million of run-rate synergies (low end of $2-$4 million of estimated synergies range).
|
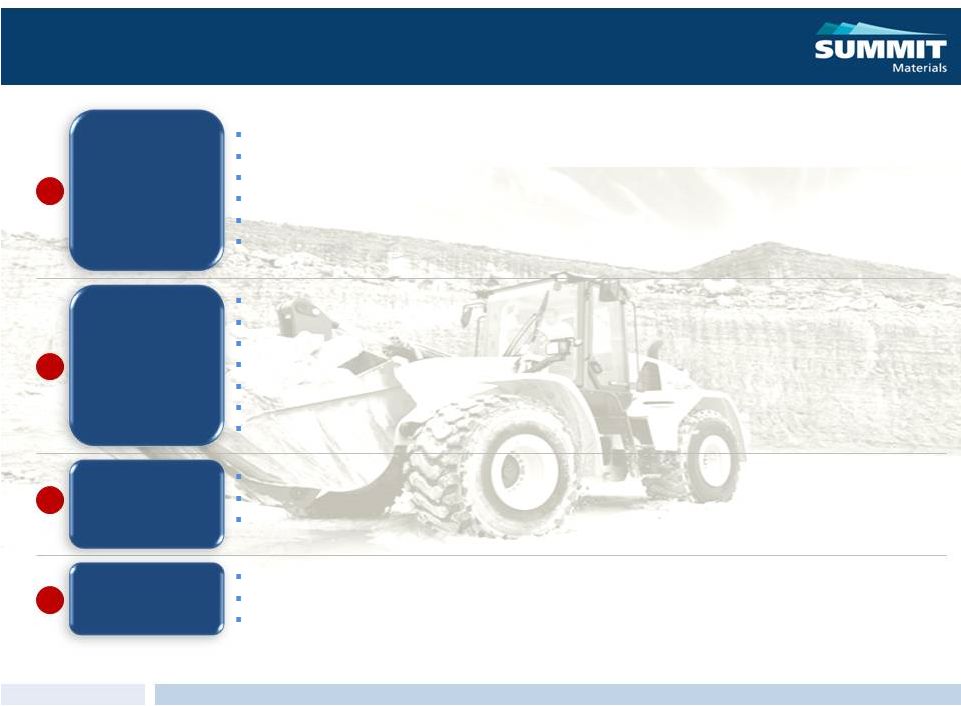 Transaction Rationale
U.S. cement industry is moving back towards its historical domestic cement
supply-demand imbalance Demand is expected to exceed U.S.
domestic capacity by 2017 Positive pricing trends
Most northern cement plant on the Mississippi River (1.2mt cement capacity)
Distributed ~1.5mt of cement in ’14; volume in excess of the
Davenport plant capacity will be serviced with CCC capacity
Well-run, low-cost plant with strong management
Efficient barge, rail and truck distribution modes
1 of 4 terminal operators in New Orleans that can supply imported cement into
the southern Mississippi River system On-site limestone
reserves of ~50 years 100% materials business in attractive cement
sector; doubles Summit’s cement operations Makes Summit the
#3 player (PF 2.45mt cement capacity) on the U.S. mid-continent river system Synergy opportunities include distribution efficiencies, alternative fuels optimization and best practices transfers
Enables CCC to utilize its excess capacity and bring additional supply to the
Davenport terminal network Expands Summit’s geographical
diversity, providing new platforms for downstream growth
Complementary, experienced management teams across Davenport and
CCC Provides distribution infrastructure to support cement
capacity expansion at CCC’s Hannibal plant Increases
Summit’s overall EBITDA margin percentage ~200 bps Increases
Summit’s materials-related earnings exposure by ~900 bps
Further margin expansion expected from improving industry fundamentals
4
1 2 3 Attractive Time to Invest in the Cement Sector Premier Assets Strong Strategic and Operational Fit Improves Summit’s Margin and Earnings Mix Exposure |
 Davenport Assets Pro Forma Financial Overview
(1) Pro forma for combination of the Davenport cement plant and seven cement distribution terminals under Summit ownership based on internal
Lafarge data and Summit estimates. (2)
Costs include manufacturing costs, supply agreement costs, freight, terminal
operating costs and general and administrative expenses. These amounts were derived by management based on data provided by Lafarge and adjusted to reflect only the acquired assets. These adjustments required management estimates and
assumptions. (3)
Excludes approximately $2 million of run-rate synergies (low end of $2-$4
million of estimated synergies range). See “Davenport Assets EBITDA Bridge” on slide 39 for more information. Ongoing market recovery in volume and pricing continues to drive top line growth Plant uptime & reliability were exceedingly strong in 2014 Sustainable, low-cost operations through continuous improvement and best-in-class preventive maintenance have provided significant operating leverage Mature plant with low ongoing maintenance CapEx requirements (millions, ex. Per unit metrics) LTM 2012 1 2013 1 2014 1 3/31/15 1 Volume (mt) 1.214 1.320 1.467 1.474 % growth -- 8.7% 11.2% 0.5% Revenue $108.1 $122.1 $143.9 $146.1 per ton $89.04 $92.50 $98.09 $99.12 % growth -- 13.0% 17.9% 1.5% Costs 2 $80.5 $84.1 $92.5 $90.4 % of revenue 74.5% 68.9% 64.3% 61.9% Adjusted EBITDA 3 -- -- $49.1 $53.4 per ton -- -- $33.47 $36.23 % margin -- -- 34.1% 36.6% % growth -- -- 29.6% 8.8% Net CapEx $2.9 $1.4 $3.3 $4.5 per ton $2.39 $1.06 $2.25 $3.05 % of revenue 2.7% 1.1% 2.3% 3.1% |
 (1) Pro Forma effects of acquisitions completed prior to March 28, 2015 (does not include June 2015 acquisition of Lewis & Lewis or
Davenport). Summit EBITDA Bridge
($ in millions)
2013A 2014A LTM 3/28/15A Net Loss ($104) ($6) ($33) Interest Expense 56 87 92 Income Tax Benefit (3) (7) (11) Depreciation, Depletion, Amortization and Accretion Expense 72 88 95 Discontinued Operations 1 (1) -- Goodwill Impairment 68 -- -- Initial Public Offering Costs -- -- 28 Loss on Debt Financings -- -- 1 Adjusted EBITDA $92 $161 $172 Adjustments Acquisition Transaction Expenses $4 $9 $7 Management Fees and Expenses 3 5 5 Strategic Fees and Initiatives 4 0 -- Non-cash Compensation 2 2 2 Loss on Disposal and Impairment of Fixed Assets 12 9 9 Severance and Relocation Costs 3 1 1 Other 10 2 4 EBITDA for certain completed acquisitions (2) 23 13 Pro Forma Adjusted EBITDA $128 $212 $213 Revenue $916 $1,204 $1,247 Delivery and Subcontract Revenue (95) (133) (137) Net Revenue $821 $1,071 $1,110 Pro Forma Revenue Adjustment 1 9 102 59 Pro Forma Net Revenue $830 $1,173 $1,169 Pro Forma Adjusted EBITDA Margin 15% 18% 18% |
 Davenport Assets EBITDA Bridge
(1) Low end of $2-$4 million of estimated synergies range. (2) Revenue associated with non-Davenport cement through certain of the Davenport Asset terminals. Allocated Expenses: Represents corporate overhead allocated to the Davenport Assets from Lafarge and Lafarge's parent company, Lafarge S.A. These costs are derived from multiple levels of the organization including geographic business unit expenses, product line expenses, shared corporate expenses, and fees from a holding company. These allocated costs are primarily related to corporate administrative expenses and reorganization costs, employee related costs including pensions and other benefits for corporate and shared employees, and rental and usage fees for shared assets for the following functional groups: information technology, accounting and finance services, marketing and contract support, customer support, treasury, facility and other corporate and infrastructural services. Incremental G&A: Represents incremental overhead costs expected to be incurred in conjunction with the Davenport Acquisition, such as accounting, sales, pension costs, insurance and information technology costs. Supply Agreements: Represents the EBITDA related to a supply agreement to sell third-party cement through the Davenport Terminals. This agreement will be assigned to Summit Materials as part of the Davenport Acquisition, but was not included in the audit of
the Lafarge Target Business' financial statements.
Other: Represents the estimated effect from the application of Summit Materials' accounting policies, adoption of Summit Materials' insurance policies and an adjustment to overhead allocated to the Davenport terminals. Synergies: Synergy opportunities include distributions efficiencies, alternative fuels optimization and sharing of operational best practices. 1 5 1 2 2 3 4 3 4 5 LTM ($ in millions) 2014A 3/31/15A Net Income $15.3 $18.1 Income Tax Expense 7.8 9.1 Depreciation and Depletion 7.2 7.2 EBITDA $30.3 $34.4 Allocated Corporate Overhead Expenses $20.0 $20.6 Incremental G&A (5.9) (6.7) Supply Agreements 4.7 5.2 Other (0.0) (0.2) Adjusted EBITDA $49.1 $53.4 Synergies (1) 2.1 2.1 Pro Forma Adjusted EBITDA $51.2 $55.5 Revenue 113.7 115.7 Supply agreement (2) 30.2 30.4 Pro Forma Revenue $143.9 $146.1 |