Attached files
| file | filename |
|---|---|
| EX-99.1 - EX-99.1 - Summit Materials, Inc. | sum-20170701ex9911476c2.htm |
| EX-95.1 - EX-95.1 - Summit Materials, Inc. | sum-20170701ex9518081f0.htm |
| EX-32.4 - EX-32.4 - Summit Materials, Inc. | sum-20170701ex3248ec99c.htm |
| EX-32.3 - EX-32.3 - Summit Materials, Inc. | sum-20170701ex323099975.htm |
| EX-32.2 - EX-32.2 - Summit Materials, Inc. | sum-20170701ex322e4cc51.htm |
| EX-32.1 - EX-32.1 - Summit Materials, Inc. | sum-20170701ex3217dd56f.htm |
| EX-31.4 - EX-31.4 - Summit Materials, Inc. | sum-20170701ex314ce449f.htm |
| EX-31.3 - EX-31.3 - Summit Materials, Inc. | sum-20170701ex3136b9078.htm |
| EX-31.2 - EX-31.2 - Summit Materials, Inc. | sum-20170701ex3125c516c.htm |
| EX-31.1 - EX-31.1 - Summit Materials, Inc. | sum-20170701ex311c5cf4f.htm |
| EX-4.5 - EX-4.5 - Summit Materials, Inc. | sum-20170701ex45b9daeda.htm |
| EX-4.4 - EX-4.4 - Summit Materials, Inc. | sum-20170701ex44330ed35.htm |
| EX-4.2 - EX-4.2 - Summit Materials, Inc. | sum-20170701ex429042659.htm |
UNITED STATES
SECURITIES AND EXCHANGE COMMISSION
Washington, D.C. 20549
FORM 10-Q
(Mark One)
|
☒ |
|
QUARTERLY REPORT PURSUANT TO SECTION 13 OR 15(d) OF THE SECURITIES EXCHANGE ACT OF 1934 |
For the quarterly period ended July 1, 2017
OR
|
◻ |
|
TRANSITION REPORT PURSUANT TO SECTION 13 OR 15(d) OF THE SECURITIES EXCHANGE ACT OF 1934 |
For the transition period from to
Commission file numbers:
001-36873 (Summit Materials, Inc.)
333-187556 (Summit Materials, LLC)
SUMMIT MATERIALS, INC.
SUMMIT MATERIALS, LLC
(Exact name of registrants as specified in their charters)
|
Delaware (Summit Materials, Inc.) |
47-1984212 |
|
Delaware (Summit Materials, LLC) |
26-4138486 |
|
(State or other jurisdiction of incorporation or organization) |
(I.R.S. Employer Identification No.) |
|
|
|
|
1550 Wynkoop Street, 3rd Floor Denver, Colorado |
80202 |
|
(Address of principal executive offices) |
(Zip Code) |
Registrants’ telephone number, including area code: (303) 893-0012
Not Applicable
(Former name, former address and former fiscal year, if changed since last report)
Indicate by check mark whether the registrant (1) has filed all reports required to be filed by Section 13 or 15(d) of the Securities Exchange Act of 1934 during the preceding 12 months (or for such shorter period that the registrant was required to file such reports), and (2) has been subject to such filing requirements for the past 90 days.
|
|
|
|
|
|
|
|
Summit Materials, Inc. |
|
|
|
Yes ☒ |
No ◻ |
|
Summit Materials, LLC |
|
|
|
Yes ☒ |
No ◻ |
|
|
|
|
|
|
|
|
Indicate by check mark whether the registrant has submitted electronically and posted on its corporate Web site, if any, every Interactive Data File required to be submitted and posted pursuant to Rule 405 of Regulation S‑T (§232.405 of this chapter) during the preceding 12 months (or for such shorter period that the registrant was required to submit and post such files). |
|||||
|
|
|
|
|
|
|
|
Summit Materials, Inc. |
|
|
|
Yes ☒ |
No ◻ |
|
Summit Materials, LLC |
|
|
|
Yes ☒ |
No ◻ |
|
|
|
|
|
|
|
|
Indicate by check mark whether the registrant is a large accelerated filer, an accelerated filer, a non-accelerated filer, a smaller reporting company, or an emerging growth company. See the definitions of “large accelerated filer,” “accelerated filer,” “smaller reporting company” and “emerging growth company” in Rule 12b-2 of the Exchange Act. |
|||||
|
|
|
|
|
|
|
|
Summit Materials, Inc. |
|
|
|
|
|
|
|
|
|
|
|
|
|
Large accelerated filer |
☒ |
|
Accelerated filer |
☐ |
|
|
Non-accelerated filer |
◻ |
(Do not check if a smaller reporting company) |
Smaller reporting company |
☐ |
|
|
If an emerging growth company, indicate by check mark if the registrant has elected not to use the extended transition period for complying with any new or revised financial accounting standards provided pursuant to Section 13(a) of the |
Emerging growth company |
☐ |
|||
|
Exchange Act. |
◻ |
|
|
|
|
|
|
|
|
|
|
|
|
Summit Materials, LLC |
|
|
|
|
|
|
|
|
|
|
|
|
|
Large accelerated filer |
◻ |
|
Accelerated filer |
☐ |
|
|
Non-accelerated filer |
☒ |
(Do not check if a smaller reporting company) |
Smaller reporting company |
☐ |
|
|
If an emerging growth company, indicate by check mark if the registrant has elected not to use the extended transition period for complying with any new or revised financial accounting standards provided pursuant to Section 13(a) of the |
Emerging growth company |
☐ |
|||
|
Exchange Act. |
◻ |
|
|
|
|
|
|
|
|
|
|
|
|
Indicate by check mark whether the registrant is a shell company (as defined in Rule 12b-2 of the Exchange Act). |
|||||
|
|
|
|
|
|
|
|
Summit Materials, Inc. |
|
|
|
Yes ◻ |
No ☒ |
|
Summit Materials, LLC |
|
|
|
Yes ◻ |
No ☒ |
As of July 26, 2017, the number of shares of Summit Materials, Inc.’s outstanding Class A and Class B common stock, par value $0.01 per share for each class, was 107,504,679 and 100, respectively.
As of July 26, 2017, 100% of Summit Materials, LLC’s outstanding limited liability company interests were held by Summit Materials Intermediate Holdings, LLC, its sole member and an indirect subsidiary of Summit Materials, Inc.
EXPLANATORY NOTE
This quarterly report on Form 10-Q (this “report”) is a combined quarterly report being filed separately by two registrants: Summit Materials, Inc. and Summit Materials, LLC. Each registrant hereto is filing on its own behalf all of the information contained in this report that relates to such registrant. Each registrant hereto is not filing any information that does not relate to such registrant, and therefore makes no representation as to any such information. We believe that combining the quarterly reports on Form 10-Q of Summit Materials, Inc. and Summit Materials, LLC into this single report eliminates duplicative and potentially confusing disclosure and provides a more streamlined presentation since a substantial amount of the disclosure applies to both registrants.
Unless stated otherwise or the context requires otherwise, references to “Summit Inc.” mean Summit Materials, Inc., a Delaware corporation, and references to “Summit LLC” mean Summit Materials, LLC, a Delaware limited liability company. The references to Summit Inc. and Summit LLC are used in cases where it is important to distinguish between them. We use the terms “we,” “our,” “us” or “the Company” to refer to Summit Inc. and Summit LLC together with their respective subsidiaries, unless otherwise noted or the context otherwise requires.
Summit Inc. was formed on September 23, 2014 to be a holding company. As of July 1, 2017, its sole material asset was a 96.3% economic interest in Summit Materials Holdings L.P. (“Summit Holdings”). Summit Inc. has 100% of the voting rights of Summit Holdings, which is the indirect parent of Summit LLC. Summit LLC is a co-issuer of our outstanding 8 1/2% senior notes due 2022 (“2022 Notes”), our 6 1/8% senior notes due 2023 (“2023 Notes”) and our 5 1/8% senior notes due 2025 (“2025 Notes” and collectively with the 2022 Notes and 2023 Notes, the "Senior Notes"). Summit Inc.’s only revenue for the three and six months ended July 1, 2017 was that generated by Summit LLC and its consolidated subsidiaries. Summit Inc. controls all of the business and affairs of Summit Holdings and, in turn, Summit LLC.
CAUTIONARY NOTE REGARDING FORWARD-LOOKING STATEMENTS
This report includes “forward-looking statements” within the meaning of the federal securities laws, which involve risks and uncertainties. Forward-looking statements include all statements that do not relate solely to historical or current facts, and you can identify forward-looking statements because they contain words such as “believes,” “expects,” “may,” “will,” “should,” “seeks,” “intends,” “trends,” “plans,” “estimates,” “projects” or “anticipates” or similar expressions that concern our strategy, plans, expectations or intentions. All statements made relating to our estimated and projected earnings, margins, costs, expenditures, cash flows, growth rates and financial results are forward-looking statements. These forward-looking statements are subject to risks, uncertainties and other factors that may cause our actual results, performance or achievements to be materially different from future results, performance or achievements expressed or implied by such forward-looking statements. We derive many of our forward-looking statements from our operating budgets and forecasts, which are based upon many detailed assumptions. While we believe that our assumptions are reasonable, it is very difficult to predict the effect of known factors, and, of course, it is impossible to anticipate all factors that could affect our actual results. In light of the significant uncertainties inherent in the forward-looking statements included herein, the inclusion of such information should not be regarded as a representation by us or any other person that the results or conditions described in such statements or our objectives and plans will be realized. Important factors could affect our results and could cause results to differ materially from those expressed in our forward-looking statements, including but not limited to the factors discussed in the section entitled “Risk Factors” in Summit Inc.’s Annual Report on Form 10-K for the fiscal year ended December 31, 2016 (the “Annual Report”), as filed with the Securities and Exchange Commission (the “SEC”), any factors discussed in the section entitled “Risk Factors” of this report and the following:
|
· |
our dependence on the construction industry and the strength of the local economies in which we operate; |
|
· |
the cyclical nature of our business; |
|
· |
risks related to weather and seasonality; |
|
· |
risks associated with our capital-intensive business; |
|
· |
competition within our local markets; |
|
· |
our ability to execute on our acquisition strategy, successfully integrate acquisitions with our existing operations and retain key employees of acquired businesses; |
|
· |
our dependence on securing and permitting aggregate reserves in strategically located areas; |
|
· |
declines in public infrastructure construction and delays or reductions in governmental funding, including the funding by transportation authorities and other state agencies; |
|
· |
environmental, health, safety and climate change laws or governmental requirements or policies concerning zoning and land use; |
|
· |
conditions in the credit markets; |
|
· |
our ability to accurately estimate the overall risks, requirements or costs when we bid on or negotiate contracts that are ultimately awarded to us; |
|
· |
material costs and losses as a result of claims that our products do not meet regulatory requirements or contractual specifications; |
|
· |
cancellation of a significant number of contracts or our disqualification from bidding for new contracts; |
|
· |
special hazards related to our operations that may cause personal injury or property damage not covered by insurance; |
|
· |
our substantial current level of indebtedness; |
|
· |
our dependence on senior management and other key personnel; and |
|
· |
interruptions in our information technology systems and infrastructure. |
All subsequent written and oral forward-looking statements attributable to us, or persons acting on our behalf, are expressly qualified in their entirety by these cautionary statements.
Any forward-looking statement that we make herein speaks only as of the date of this report. We undertake no obligation to publicly update or revise any forward-looking statement as a result of new information, future events or otherwise, except as required by law.
CERTAIN DEFINITIONS
As used in this report, unless otherwise noted or the context otherwise requires:
|
· |
"Finance Corp." refers to Summit Materials Finance Corp., an indirect wholly-owned subsidiary of Summit LLC and the co-issuer of the Senior Notes; |
|
· |
the “Issuers” refers to Summit LLC and Finance Corp. as co-issuers of the Senior Notes but not to any of their subsidiaries; |
|
· |
“Harper Contracting” refers collectively to substantially all the assets of Harper Contracting, Inc., Harper Sand and Gravel, Inc., Harper Excavating, Inc., Harper Ready Mix Company, Inc. and Harper Investments, Inc.; |
|
· |
“Mainland” refers to Mainland Sand & Gravel ULC, which is the surviving entity from the acquisition of Rock Head Holdings Ltd., B.I.M Holdings Ltd., Carlson Ventures Ltd., Mainland Sand and Gravel Ltd. and Jamieson Quarries Ltd.; |
|
· |
“AMC" refers to American Materials Company; |
|
· |
“Boxley” refers to Boxley Materials Company; |
|
· |
“Sierra” refers to Sierra Ready Mix, LLC; |
|
· |
"Oldcastle Assets" refers to the seven aggregates quarries located in central and northwest Missouri acquired from APAC-Kansas, Inc. and APAC-Missouri, Inc., subsidiaries of Oldcastle, Inc.; |
|
· |
“Weldon’’ refers to Weldon Real Estate, LLC; |
|
· |
“Rustin” refers to H.C. Rustin Corporation; |
|
· |
“RD Johnson” refers to R.D. Johnson Excavating Company, LLC and Asphalt Sales of Lawrence, LLC; |
|
· |
“Angelle Assets” refers to two cement terminal operations located in Port Allen and LaPlace, LA.; |
|
· |
“Midland Concrete” refers to Midland Concrete Ltd.; |
|
· |
“Everist Materials” refers to Everist Materials, LLC; |
|
· |
“Razorback” refers to Razorback Concrete Company; |
|
· |
“Sandidge Concrete” refers to Sandidge Manufacturing, Inc.; |
|
· |
“Carolina Sand” refers to Carolina Sand, LLC; |
|
· |
“Hanna’s Bend” refers to Hanna’s Bend Aggregate, Ltd.; |
|
· |
“Winvan Paving” refers to Winvan Paving Ltd.; |
|
· |
“Glasscock” refers to Glasscock Company, Inc. and Glasscock Logistics Company, LLC; |
|
· |
“Somerset” refers to Ready Mix Concrete of Somerset, Inc. and RMCS Holdings, Inc.; |
|
· |
“Great Southern” refers to Great Southern Ready Mix, LLC, Great Southern Stabilized, LLC and Southern Cement Slurry, LLC; |
|
· |
“Northwest” refers to Northwest Ready Mix, Inc. and Northwest Aggregates, Inc.; |
|
· |
“LP Units” refers to the Summit Holdings’ outstanding Class A Units; |
|
· |
“IPO” refers to initial public offering; and |
|
· |
“EBITDA” refers to net income (loss) before interest expense, income tax expense (benefit), depreciation, depletion and amortization expense. |
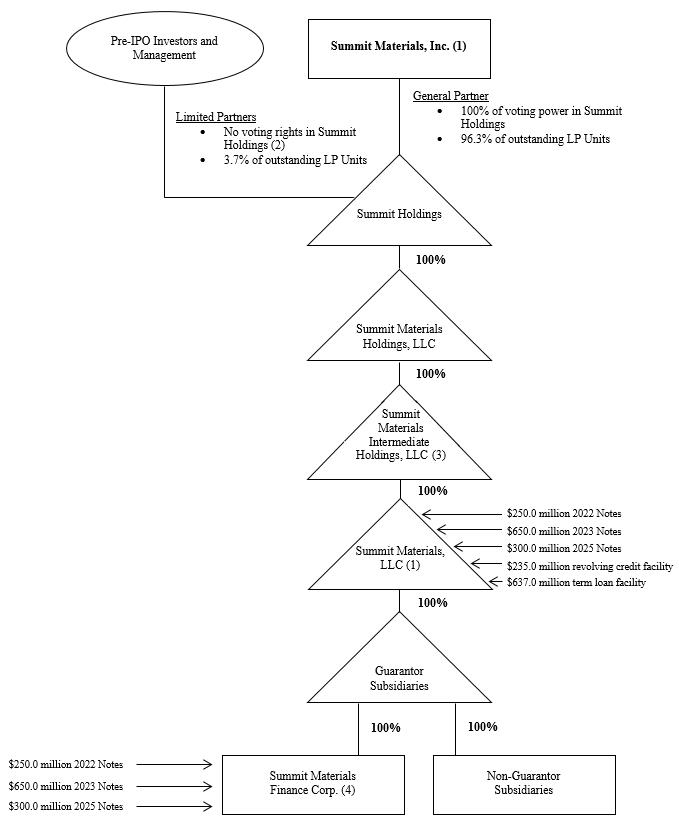
Corporate Structure
The following chart summarizes our organizational structure, equity ownership and our principal indebtedness as of July 1, 2017. This chart is provided for illustrative purposes only and does not show all of our legal entities or all obligations of such entities.
|
(1) |
SEC registrant. |
|
(2) |
The shares of Class B Common Stock are currently held by pre-initial public offering investors, including certain members of management or their family trusts that directly hold LP Units. A holder of Class B Common Stock is entitled, without regard to the number of shares of Class B Common Stock held by such holder, to a number of votes that is equal to the aggregate number of LP Units held by such holder. |
|
(3) |
Guarantor under the senior secured credit facilities, but not the Senior Notes. |
|
(4) |
Summit LLC and Finance Corp are the issuers of the Senior Notes and Summit LLC is the borrower under our senior secured credit facilities. Finance Corp. was formed solely for the purpose of serving as co-issuer or guarantor of certain indebtedness, including the Senior Notes. Finance Corp. does not and will not have operations of any kind and does not and will not have revenue or assets other than as may be incidental to its activities as a co-issuer or guarantor of certain indebtedness. |
SUMMIT MATERIALS, INC.
SUMMIT MATERIALS, LLC
FORM 10-Q
|
Page No. |
||
| 1 | ||
|
|
Consolidated Balance Sheets as of July 1, 2017 (unaudited) and December 31, 2016 |
1 |
|
|
2 | |
|
|
3 | |
|
|
4 | |
|
|
5 | |
|
|
6 | |
|
|
22 | |
|
Management’s Discussion and Analysis of Financial Condition and Results of Operations |
23 | |
| 47 | ||
| 47 | ||
|
|
|
|
| 48 | ||
| 48 | ||
| 48 | ||
| 48 | ||
| 48 | ||
| 48 | ||
| 49 | ||
| 51 | ||
SUMMIT MATERIALS, INC. AND SUBSIDIARIES
(In thousands, except share and per share amounts)
|
|
|
July 1, |
|
December 31, |
||
|
|
|
2017 |
|
2016 |
||
|
|
|
(unaudited) |
|
(audited) |
||
|
Assets |
|
|
|
|
|
|
|
Current assets: |
|
|
|
|
|
|
|
Cash and cash equivalents |
|
$ |
353,063 |
|
$ |
143,392 |
|
Accounts receivable, net |
|
|
247,546 |
|
|
162,377 |
|
Costs and estimated earnings in excess of billings |
|
|
29,212 |
|
|
7,450 |
|
Inventories |
|
|
182,886 |
|
|
157,679 |
|
Other current assets |
|
|
12,352 |
|
|
12,800 |
|
Total current assets |
|
|
825,059 |
|
|
483,698 |
|
Property, plant and equipment, less accumulated depreciation, depletion and amortization (July 1, 2017 - $554,433 and December 31, 2016 - $484,554) |
|
|
1,555,816 |
|
|
1,446,452 |
|
Goodwill |
|
|
918,511 |
|
|
782,212 |
|
Intangible assets, less accumulated amortization (July 1, 2017 - $6,041 and December 31, 2016 - $7,854) |
|
|
17,344 |
|
|
17,989 |
|
Other assets |
|
|
48,438 |
|
|
51,115 |
|
Total assets |
|
$ |
3,365,168 |
|
$ |
2,781,466 |
|
Liabilities and Stockholders’ Equity |
|
|
|
|
|
|
|
Current liabilities: |
|
|
|
|
|
|
|
Current portion of debt |
|
$ |
6,500 |
|
$ |
6,500 |
|
Current portion of acquisition-related liabilities |
|
|
17,721 |
|
|
24,162 |
|
Accounts payable |
|
|
116,817 |
|
|
81,565 |
|
Accrued expenses |
|
|
119,260 |
|
|
111,605 |
|
Billings in excess of costs and estimated earnings |
|
|
16,873 |
|
|
15,456 |
|
Total current liabilities |
|
|
277,171 |
|
|
239,288 |
|
Long-term debt |
|
|
1,807,713 |
|
|
1,514,456 |
|
Acquisition-related liabilities |
|
|
38,039 |
|
|
32,664 |
|
Other noncurrent liabilities |
|
|
129,296 |
|
|
135,019 |
|
Total liabilities |
|
|
2,252,219 |
|
|
1,921,427 |
|
Commitments and contingencies (see note 11) |
|
|
|
|
|
|
|
Stockholders’ equity: |
|
|
|
|
|
|
|
Class A common stock, par value $0.01 per share; 1,000,000,000 shares authorized, 107,491,979 and 96,033,222 shares issued and outstanding as of July 1, 2017 and December 31, 2016, respectively |
|
|
1,076 |
|
|
961 |
|
Class B common stock, par value $0.01 per share; 250,000,000 shares authorized, 100 shares issued and outstanding as of July 1, 2017 and December 31, 2016 |
|
|
— |
|
|
— |
|
Additional paid-in capital |
|
|
1,079,595 |
|
|
824,304 |
|
Accumulated earnings |
|
|
16,584 |
|
|
19,028 |
|
Accumulated other comprehensive income (loss) |
|
|
2,273 |
|
|
(2,249) |
|
Stockholders’ equity |
|
|
1,099,528 |
|
|
842,044 |
|
Noncontrolling interest in consolidated subsidiaries |
|
|
1,292 |
|
|
1,378 |
|
Noncontrolling interest in Summit Holdings |
|
|
12,129 |
|
|
16,617 |
|
Total stockholders’ equity |
|
|
1,112,949 |
|
|
860,039 |
|
Total liabilities and stockholders’ equity |
|
$ |
3,365,168 |
|
$ |
2,781,466 |
See notes to unaudited consolidated financial statements.
1
SUMMIT MATERIALS, INC. AND SUBSIDIARIES
Unaudited Consolidated Statements of Operations
(In thousands, except share and per share amounts)
|
|
|
Three months ended |
|
Six months ended |
||||||||
|
|
|
July 1, |
|
July 2, |
|
July 1, |
|
July 2, |
||||
|
|
|
2017 |
|
2016 |
|
2017 |
|
2016 |
||||
|
Revenue: |
|
|
|
|
|
|
|
|
|
|
|
|
|
Product |
|
$ |
397,726 |
|
$ |
341,341 |
|
$ |
622,743 |
|
$ |
521,443 |
|
Service |
|
|
80,642 |
|
|
71,295 |
|
|
114,669 |
|
|
99,232 |
|
Net revenue |
|
|
478,368 |
|
|
412,636 |
|
|
737,412 |
|
|
620,675 |
|
Delivery and subcontract revenue |
|
|
45,725 |
|
|
32,638 |
|
|
70,958 |
|
|
52,978 |
|
Total revenue |
|
|
524,093 |
|
|
445,274 |
|
|
808,370 |
|
|
673,653 |
|
Cost of revenue (excluding items shown separately below): |
|
|
|
|
|
|
|
|
|
|
|
|
|
Product |
|
|
233,592 |
|
|
202,029 |
|
|
400,560 |
|
|
334,425 |
|
Service |
|
|
56,587 |
|
|
50,471 |
|
|
81,958 |
|
|
74,525 |
|
Net cost of revenue |
|
|
290,179 |
|
|
252,500 |
|
|
482,518 |
|
|
408,950 |
|
Delivery and subcontract cost |
|
|
45,725 |
|
|
32,638 |
|
|
70,958 |
|
|
52,978 |
|
Total cost of revenue |
|
|
335,904 |
|
|
285,138 |
|
|
553,476 |
|
|
461,928 |
|
General and administrative expenses |
|
|
58,086 |
|
|
75,490 |
|
|
116,554 |
|
|
120,860 |
|
Depreciation, depletion, amortization and accretion |
|
|
45,039 |
|
|
37,408 |
|
|
84,787 |
|
|
69,768 |
|
Transaction costs |
|
|
2,620 |
|
|
290 |
|
|
3,893 |
|
|
3,606 |
|
Operating income |
|
|
82,444 |
|
|
46,948 |
|
|
49,660 |
|
|
17,491 |
|
Interest expense |
|
|
25,986 |
|
|
25,617 |
|
|
50,955 |
|
|
47,194 |
|
Loss on debt financings |
|
|
— |
|
|
— |
|
|
190 |
|
|
— |
|
Tax receivable agreement expense |
|
|
1,525 |
|
|
— |
|
|
1,525 |
|
|
— |
|
Other (income) expense, net |
|
|
(590) |
|
|
882 |
|
|
(1,247) |
|
|
548 |
|
Income (loss) from operations before taxes |
|
|
55,523 |
|
|
20,449 |
|
|
(1,763) |
|
|
(30,251) |
|
Income tax expense (benefit) |
|
|
3,435 |
|
|
(1,056) |
|
|
1,257 |
|
|
(9,222) |
|
Net income (loss) |
|
|
52,088 |
|
|
21,505 |
|
|
(3,020) |
|
|
(21,029) |
|
Net income (loss) attributable to noncontrolling interest in subsidiaries |
|
|
12 |
|
|
44 |
|
|
(86) |
|
|
(35) |
|
Net income (loss) attributable to Summit Holdings |
|
|
2,076 |
|
|
8,090 |
|
|
(490) |
|
|
(13,247) |
|
Net income (loss) attributable to Summit Inc. |
|
$ |
50,000 |
|
$ |
13,371 |
|
$ |
(2,444) |
|
$ |
(7,747) |
|
Income (loss) per share of Class A common stock: |
|
|
|
|
|
|
|
|
|
|
|
|
|
Basic |
|
$ |
0.47 |
|
$ |
0.21 |
|
$ |
(0.02) |
|
$ |
(0.14) |
|
Diluted |
|
$ |
0.46 |
|
$ |
0.21 |
|
$ |
(0.02) |
|
$ |
(0.20) |
|
Weighted average shares of Class A common stock: |
|
|
|
|
|
|
|
|
|
|
|
|
|
Basic |
|
|
106,898,512 |
|
|
62,743,149 |
|
|
106,035,087 |
|
|
56,812,906 |
|
Diluted |
|
|
107,908,888 |
|
|
63,893,909 |
|
|
106,035,087 |
|
|
100,954,233 |
See notes to unaudited consolidated financial statements.
2
SUMMIT MATERIALS, INC. AND SUBSIDIARIES
Unaudited Consolidated Statements of Comprehensive Operations
(In thousands)
|
|
|
Three months ended |
|
Six months ended |
||||||||
|
|
|
July 1, |
|
July 2, |
|
July 1, |
|
July 2, |
||||
|
|
|
2017 |
|
2016 |
|
2017 |
|
2016 |
||||
|
Net income (loss) |
|
$ |
52,088 |
|
$ |
21,505 |
|
$ |
(3,020) |
|
$ |
(21,029) |
|
Other comprehensive income (loss): |
|
|
|
|
|
|
|
|
|
|
|
|
|
Postretirement liability adjustment |
|
|
413 |
|
|
— |
|
|
413 |
|
|
— |
|
Foreign currency translation adjustment |
|
|
3,418 |
|
|
635 |
|
|
4,124 |
|
|
5,277 |
|
(Loss) income on cash flow hedges |
|
|
(240) |
|
|
(1,058) |
|
|
172 |
|
|
(3,292) |
|
Other comprehensive income (loss): |
|
|
3,591 |
|
|
(423) |
|
|
4,709 |
|
|
1,985 |
|
Comprehensive income (loss) |
|
|
55,679 |
|
|
21,082 |
|
|
1,689 |
|
|
(19,044) |
|
Less comprehensive income (loss) attributable to the noncontrolling interest in consolidated subsidiaries |
|
|
12 |
|
|
44 |
|
|
(86) |
|
|
(35) |
|
Less comprehensive income (loss) attributable to Summit Holdings |
|
|
1,145 |
|
|
8,051 |
|
|
(303) |
|
|
(12,076) |
|
Comprehensive income (loss) attributable to Summit Inc. |
|
$ |
54,522 |
|
$ |
12,987 |
|
$ |
2,078 |
|
$ |
(6,933) |
See notes to unaudited consolidated financial statements.
3
SUMMIT MATERIALS, INC. AND SUBSIDIARIES
Unaudited Consolidated Statements of Cash Flows
(In thousands)
|
|
|
Six months ended |
||||
|
|
|
July 1, |
|
July 2, |
||
|
|
|
2017 |
|
2016 |
||
|
Cash flow from operating activities: |
|
|
|
|
|
|
|
Net loss |
|
$ |
(3,020) |
|
$ |
(21,029) |
|
Adjustments to reconcile net loss to net cash provided by (used in) operating activities: |
|
|
|
|
|
|
|
Depreciation, depletion, amortization and accretion |
|
|
90,781 |
|
|
76,252 |
|
Share-based compensation expense |
|
|
9,424 |
|
|
29,817 |
|
Deferred income tax benefit |
|
|
374 |
|
|
(10,040) |
|
Net gain on asset disposals |
|
|
(4,052) |
|
|
(3,717) |
|
Non-cash loss on debt financings |
|
|
85 |
|
|
— |
|
Other |
|
|
710 |
|
|
129 |
|
Decrease (increase) in operating assets, net of acquisitions: |
|
|
|
|
|
|
|
Accounts receivable, net |
|
|
(68,539) |
|
|
(55,489) |
|
Inventories |
|
|
(19,272) |
|
|
(27,948) |
|
Costs and estimated earnings in excess of billings |
|
|
(21,571) |
|
|
(24,542) |
|
Other current assets |
|
|
3,552 |
|
|
(2,646) |
|
Other assets |
|
|
(1,565) |
|
|
(367) |
|
Increase (decrease) in operating liabilities, net of acquisitions: |
|
|
|
|
|
|
|
Accounts payable |
|
|
28,550 |
|
|
9,682 |
|
Accrued expenses |
|
|
(6,789) |
|
|
10,343 |
|
Billings in excess of costs and estimated earnings |
|
|
1,252 |
|
|
(3,523) |
|
Other liabilities |
|
|
1,229 |
|
|
(3,422) |
|
Net cash provided by (used in) operating activities |
|
|
11,149 |
|
|
(26,500) |
|
Cash flow from investing activities: |
|
|
|
|
|
|
|
Acquisitions, net of cash acquired |
|
|
(213,124) |
|
|
(296,664) |
|
Purchases of property, plant and equipment |
|
|
(109,088) |
|
|
(91,669) |
|
Proceeds from the sale of property, plant and equipment |
|
|
8,411 |
|
|
9,442 |
|
Other |
|
|
137 |
|
|
1,500 |
|
Net cash used for investing activities |
|
|
(313,664) |
|
|
(377,391) |
|
Cash flow from financing activities: |
|
|
|
|
|
|
|
Proceeds from equity offerings |
|
|
237,600 |
|
|
— |
|
Capital issuance costs |
|
|
(627) |
|
|
(136) |
|
Proceeds from debt issuances |
|
|
302,000 |
|
|
321,000 |
|
Debt issuance costs |
|
|
(5,308) |
|
|
(5,110) |
|
Payments on debt |
|
|
(9,288) |
|
|
(63,676) |
|
Payments on acquisition-related liabilities |
|
|
(17,204) |
|
|
(25,662) |
|
Distributions from partnership |
|
|
(79) |
|
|
(373) |
|
Other |
|
|
4,904 |
|
|
113 |
|
Net cash provided by financing activities |
|
|
511,998 |
|
|
226,156 |
|
Impact of foreign currency on cash |
|
|
188 |
|
|
498 |
|
Net increase (decrease) in cash |
|
|
209,671 |
|
|
(177,237) |
|
Cash and cash equivalents—beginning of period |
|
|
143,392 |
|
|
186,405 |
|
Cash and cash equivalents—end of period |
|
$ |
353,063 |
|
$ |
9,168 |
See notes to unaudited consolidated financial statements.
4
SUMMIT MATERIALS, INC. AND SUBSIDIARIES
Unaudited Consolidated Statements of Changes in Stockholders’ Equity
(In thousands, except share amounts)
|
|
|
|
|
|
Summit Materials, Inc. |
|
|
|
||||||||||||||||||||||
|
|
|
|
|
|
|
|
|
|
|
|
|
|
|
|
|
|
|
|
|
|
|
|
|
|
|
|
|
|
|
|
|
|
|
|
|
|
|
|
|
Accumulated |
|
|
|
|
|
|
|
|
|
|
|
|
|
|
|
|
|
|
|
|
|
|
|
|
|
Noncontrolling |
|
Accumulated |
|
Other |
|
Class A |
|
Class B |
|
Additional |
|
Noncontrolling |
|
Total |
||||||||||||||
|
|
|
Interest in |
|
Earnings |
|
Comprehensive |
|
Common Stock |
|
Common Stock |
|
Paid-in |
|
Interest in |
|
Stockholders’ |
||||||||||||||
|
|
|
Subsidiaries |
|
(Deficit) |
|
Loss |
|
Shares |
|
Dollars |
|
Shares |
|
Dollars |
|
Capital |
|
Summit Holdings |
|
Equity |
||||||||||
|
Balance — December 31, 2016 |
|
$ |
1,378 |
|
$ |
19,028 |
|
$ |
(2,249) |
|
|
96,033,222 |
|
$ |
961 |
|
|
100 |
|
$ |
— |
|
$ |
824,304 |
|
$ |
16,617 |
|
$ |
860,039 |
|
|
|
|
|
|
|
|
|
|
|
|
|
|
|
|
|
|
|
|
|
|
|
|
|
|
|
|
|
|
|
|
|
Net loss |
|
|
(86) |
|
|
(2,444) |
|
|
— |
|
|
— |
|
|
— |
|
|
— |
|
|
— |
|
|
— |
|
|
(490) |
|
|
(3,020) |
|
Issuance of Class A Shares |
|
|
— |
|
|
— |
|
|
— |
|
|
10,000,000 |
|
|
100 |
|
|
— |
|
|
— |
|
|
238,367 |
|
|
(1,496) |
|
|
236,971 |
|
LP Unit exchanges |
|
|
— |
|
|
— |
|
|
— |
|
|
1,014,159 |
|
|
10 |
|
|
— |
|
|
— |
|
|
2,600 |
|
|
(2,610) |
|
|
— |
|
Other comprehensive income |
|
|
— |
|
|
— |
|
|
4,522 |
|
|
— |
|
|
— |
|
|
— |
|
|
— |
|
|
— |
|
|
187 |
|
|
4,709 |
|
Share-based compensation |
|
|
— |
|
|
— |
|
|
— |
|
|
— |
|
|
— |
|
|
— |
|
|
— |
|
|
9,424 |
|
|
— |
|
|
9,424 |
|
Distributions from partnership |
|
|
— |
|
|
— |
|
|
— |
|
|
— |
|
|
— |
|
|
— |
|
|
— |
|
|
— |
|
|
(79) |
|
|
(79) |
|
Other |
|
|
— |
|
|
— |
|
|
— |
|
|
444,598 |
|
|
5 |
|
|
— |
|
|
— |
|
|
4,900 |
|
|
— |
|
|
4,905 |
|
Balance — July 1, 2017 |
|
$ |
1,292 |
|
$ |
16,584 |
|
$ |
2,273 |
|
|
107,491,979 |
|
$ |
1,076 |
|
|
100 |
|
$ |
— |
|
$ |
1,079,595 |
|
$ |
12,129 |
|
$ |
1,112,949 |
|
|
|
|
|
|
|
|
|
|
|
|
|
|
|
|
|
|
|
|
|
|
|
|
|
|
|
|
|
|
|
|
See notes to unaudited consolidated financial statements.
5
SUMMIT MATERIALS, INC.
NOTES TO UNAUDITED CONSOLIDATED FINANCIAL STATEMENTS
(Tables in thousands, except share amounts)
1.SUMMARY OF ORGANIZATION AND SIGNIFICANT ACCOUNTING POLICIES
Summit Materials, Inc. (“Summit Inc.” and, together with its subsidiaries, the “Company”) is a vertically-integrated construction materials company. The Company is engaged in the production and sale of aggregates, cement, ready-mix concrete, asphalt paving mix and concrete products and owns and operates quarries, sand and gravel pits, two cement plants, cement distribution terminals, ready-mix concrete plants, asphalt plants and landfill sites. It is also engaged in paving and related services. The Company’s three operating and reporting segments are the West, East and Cement segments.
Substantially all of the Company’s products and services are produced, consumed and performed outdoors, primarily in the spring, summer and fall. Seasonal changes and other weather-related conditions can affect the production and sales volumes of its products and delivery of services. Therefore, the financial results for any interim period are typically not indicative of the results expected for the full year. Furthermore, the Company’s sales and earnings are sensitive to national, regional and local economic conditions and to cyclical changes in construction spending, among other factors.
On September 23, 2014, Summit Inc. was formed as a Delaware corporation to be a holding company. Its sole material asset is a controlling equity interest in Summit Materials Holdings L.P. (“Summit Holdings”). Pursuant to a reorganization into a holding company structure (the “Reorganization”) consummated in connection with Summit Inc.’s March 2015 initial public offering, Summit Inc. became a holding corporation operating and controlling all of the business and affairs of Summit Holdings and its subsidiaries and, through Summit Holdings, conducts its business.
Equity Offering—On January 10, 2017, Summit Inc. raised $237.6 million, net of underwriting discounts, through the issuance of 10,000,000 shares of Class A common stock at a public offering price of $24.05 per share. Summit Inc. used these proceeds to purchase an equal number of limited partnership interests in Summit Holdings (“LP Units”) and caused Summit Holdings to use a portion of the proceeds from the offering to acquire two materials-based companies for a combined purchase price of approximately $110 million in cash, with remaining net proceeds to be used for general corporate purposes, which may include, but is not limited to, funding acquisitions, repaying indebtedness, capital expenditures and funding working capital.
Basis of Presentation—These unaudited consolidated financial statements were prepared in accordance with U.S. generally accepted accounting principles (“U.S. GAAP”) for interim financial information, without audit, pursuant to the rules and regulations of the Securities and Exchange Commission (“SEC”). Certain information and footnote disclosures typically included in financial statements prepared in accordance with U.S. GAAP have been condensed or omitted pursuant to such rules and regulations. These unaudited consolidated financial statements should be read in conjunction with the Company's audited consolidated financial statements and the notes thereto as of and for the year ended December 31, 2016. The Company continues to follow the accounting policies set forth in those consolidated financial statements.
Management believes that these consolidated interim financial statements include all adjustments, normal and recurring in nature, that are necessary to present fairly the financial position of the Company as of July 1, 2017, the results of operations for the three and six months ended July 1, 2017 and July 2, 2016 and cash flows for the six months ended July 1, 2017 and July 2, 2016.
Principles of Consolidation—The consolidated financial statements include the accounts of Summit Inc. and its majority owned subsidiaries. All intercompany balances and transactions have been eliminated. As a result of the Reorganization, Summit Holdings became a variable interest entity over which Summit Inc. has 100% voting power and control and for which Summit Inc. has the obligation to absorb losses and the right to receive benefits.
6
During 2016 and 2017, certain limited partners of Summit Holdings exchanged their LP Units for shares of Class A common stock of Summit Inc. The following table summarizes the changes in our ownership of Summit Holdings:
|
|
|
Summit Inc. Shares (Class A) |
|
LP Units |
|
Total |
|
Summit Inc. Ownership Percentage |
|
|
Balance — December 31, 2016 |
|
96,033,222 |
|
5,151,297 |
|
101,184,519 |
|
94.9 |
% |
|
January 2017 public offering |
|
10,000,000 |
|
- |
|
10,000,000 |
|
|
|
|
Exchanges during period |
|
236,095 |
|
(236,095) |
|
- |
|
|
|
|
Other equity transactions |
|
134,423 |
|
- |
|
134,423 |
|
|
|
|
Balance — April 1, 2017 |
|
106,403,740 |
|
4,915,202 |
|
111,318,942 |
|
95.6 |
% |
|
Exchanges during period |
|
778,064 |
|
(778,064) |
|
- |
|
|
|
|
Other equity transactions |
|
310,175 |
|
- |
|
310,175 |
|
|
|
|
Balance — July 1, 2017 |
|
107,491,979 |
|
4,137,138 |
|
111,629,117 |
|
96.3 |
% |
|
|
|
|
|
|
|
|
|
|
|
|
|
|
|
|
|
|
|
|
|
|
|
Balance — January 2, 2016 |
|
49,745,944 |
|
50,275,825 |
|
100,021,769 |
|
49.7 |
% |
|
Issuance of Class A shares |
|
1,038 |
|
- |
|
1,038 |
|
|
|
|
Stock Dividend - December 28, 2016 |
|
1,135,692 |
|
- |
|
1,135,692 |
|
|
|
|
Balance — April 2, 2016 |
|
50,882,674 |
|
50,275,825 |
|
101,158,499 |
|
50.3 |
% |
|
Exchanges during period |
|
13,177,754 |
|
(13,177,754) |
|
- |
|
|
|
|
Other equity transactions |
|
6,250 |
|
- |
|
6,250 |
|
|
|
|
Balance — July 2, 2016 |
|
64,066,678 |
|
37,098,071 |
|
101,164,749 |
|
63.3 |
% |
As a result, Summit Inc. is Summit Holdings’ primary beneficiary and thus consolidates Summit Holdings in its consolidated financial statements with a corresponding noncontrolling interest elimination, which was 3.7% and 5.1% as of July 1, 2017 and December 31, 2016, respectively.
Noncontrolling interests in consolidated subsidiaries represent a 20% ownership in Ohio Valley Asphalt, LLC. The Company attributes consolidated stockholders’ equity and net income separately to the controlling and noncontrolling interests. The Company accounts for investments in entities for which it has an ownership of 20% to 50% using the equity method of accounting.
Use of Estimates—Preparation of these consolidated financial statements in conformity with U.S. GAAP requires management to make estimates and assumptions. These estimates and the underlying assumptions affect the amounts of assets and liabilities reported, disclosures about contingent assets and liabilities and reported amounts of revenue and expenses. Such estimates include the valuation of accounts receivable, inventories, valuation of deferred tax assets, goodwill, intangibles and other long-lived assets, pension and other postretirement obligations and asset retirement obligations. Estimates also include revenue earned on contracts and costs to complete contracts. Most of the Company’s paving and related services are performed under fixed unit-price contracts with state and local governmental entities. Management regularly evaluates its estimates and assumptions based on historical experience and other factors, including the current economic environment. As future events and their effects cannot be determined with precision, actual results can differ significantly from estimates made. Changes in estimates, including those resulting from continuing changes in the economic environment, are reflected in the Company’s consolidated financial statements when the change in estimate occurs.
Business and Credit Concentrations—The Company’s operations are conducted primarily across 21 U.S. states and in British Columbia, Canada, with the most significant revenue generated in Texas, Kansas, Utah and Missouri. The Company’s accounts receivable consist primarily of amounts due from customers within these areas. Therefore, collection of these accounts is dependent on the economic conditions in the aforementioned states, as well as specific situations affecting individual customers. Credit granted within the Company’s trade areas has been granted to many customers, and management does not believe that a significant concentration of credit exists with respect to any individual customer or group of customers. No single customer accounted for more than 10% of the Company’s total revenue in the three and six months ended July 1, 2017 and July 2, 2016.
7
Earnings per Share—The Company computes basic earnings per share attributable to stockholders by dividing income attributable to Summit Inc. by the weighted-average shares of Class A common stock outstanding. Diluted earnings per share reflects the potential dilution beyond shares for basic earnings per share that could occur if securities or other contracts to issue common stock were exercised, converted into common stock, or resulted in the issuance of common stock that would have shared in the Company’s earnings. Since the Class B common stock has no economic value, those shares are not included in the weighted-average common share amount for basic or diluted earnings per share. In addition, as the shares of Class A common stock are issued by Summit Inc., the earnings and equity interests of noncontrolling interests are not included in basic earnings per share.
Tax Receivable Agreement—When the Company purchases LP Units for cash or LP Units are exchanged for shares of Class A common stock, this results in increases in the Company’s share of the tax basis of the tangible and intangible assets, which increases the tax depreciation and amortization deductions that otherwise would not have been available to us. These increases in tax basis and tax depreciation and amortization deductions are expected to reduce the amount of cash taxes that we would otherwise be required to pay in the future. On March 11, 2015, we entered into a tax receivable agreement (“TRA”) with the pre-IPO owners that requires us to pay them 85% of the amount of cash savings, if any, in U.S. federal, state, and local income tax that we actually realize (or, under certain circumstances such as an early termination of the TRA, we are deemed to realize) as a result of the increases in tax basis in connection with exchanges by the pre-IPO owners described above and certain other tax benefits attributable to payments under the TRA.
On a quarterly basis, we evaluate the realizability of the deferred tax assets resulting from the exchange of LP Units for Class A common stock occurring during the period. Our evaluation considers all sources of taxable income; all evidence, both positive and negative, is considered to determine whether, based on the weight of that evidence, a valuation allowance is needed for some portion or all of the deferred tax assets. If deferred tax assets are determined to be realizable, we record a TRA liability of 85% of such deferred tax assets. In subsequent periods, we assess the realizability of all of our deferred tax assets, including the deferred tax assets subject to the TRA. Should we determine a deferred tax asset with a valuation allowance is realizable in a subsequent period, the related valuation allowance will be released and a corresponding TRA liability will be recorded. The realizability of deferred tax assets, including those subject to the TRA, is dependent upon the generation of future taxable income during the periods in which those deferred tax assets become deductible and consideration of prudent and feasible tax-planning strategies.
The measurement of the TRA is accounted for as a contingent liability. Therefore, once we determine that a payment to the pre-IPO owners has become probable and can be estimated, the estimate of payment will be accrued.
New Accounting Standards — In March 2017, the Financial Accounting Standards Board (“FASB”) issued Accounting Standards Update (“ASU”) 2017-07, Improving the Presentation of Net Periodic Pension Cost and Net Periodic Postretirement Benefit Cost, which requires that the service cost component be reported in the same line item as employer compensation costs and that the other components of periodic pension costs be reported outside of operating income. The ASU also restricts capitalization of costs to the service cost component. The ASU is effective for public companies for annual periods beginning after December 15, 2017. The Company early adopted this ASU as of the beginning of fiscal year 2017, on a retrospective basis; accordingly, the Company reclassified $62,000 and $160,000 from product cost of revenue to other income in the three and six months ended July 2, 2016, respectively, and $154,000 from general and administrative expenses to other income in the three and six months ended July 2, 2016, to conform to the current year presentation.
In January 2017, the FASB issued ASU 2017-04, Simplifying the Test for Goodwill Impairment, which eliminates the two step goodwill impairment test and replaces it with a single step test. The single step test compares the carrying amount of a reporting unit to its fair value; if the carrying amount is greater than the fair value the difference is the amount of the goodwill impairment. Step zero is left unchanged. Therefore, entities that wish to do a qualitative assessment are still permitted to do so. The ASU is effective for SEC filers for fiscal years beginning after December 15, 2020. However, the Company early adopted this ASU as of the beginning of fiscal year 2017. The adoption of this ASU did not have a material impact on the consolidated financial statements.
In March 2016, the FASB issued ASU 2016-09, Improvements to Employee Share-Based Payment Accounting, which requires that the income tax effect of share-based awards be recognized in the income statement and allows
8
entities to elect an accounting method to recognize forfeitures as they occur or to estimate forfeitures. The Company early adopted this ASU as of the beginning of fiscal year 2016 and made an election to recognize forfeitures as they occur. The ASU adoption was applied using a modified retrospective method by means of a $1.7 million cumulative-effect adjustment to accumulated earnings (deficit) as of the beginning of the fiscal year.
2.ACQUISITIONS
The Company has completed numerous acquisitions since its formation, which have been financed through a combination of debt and equity funding. The operations of each acquisition have been included in the Company’s consolidated results of operations since the respective closing dates of the acquisitions. The Company measures all assets acquired and liabilities assumed at their acquisition-date fair value. The following acquisitions completed in the six months ended July 1, 2017 and in fiscal 2016 were not material individually, or when combined:
West segment:
|
· |
On May 1, 2017, we acquired Winvan Paving, Ltd. (“Winvan Paving”), a paving and construction services company based in Vancouver, British Columbia. |
|
· |
On April 3, 2017, we acquired Hanna’s Bend Aggregate, Ltd. (“Hanna’s Bend”), an aggregates-based business with one sand and gravel pit servicing the Houston, Texas market. |
|
· |
On January 30, 2017, the Company acquired Everist Materials, LLC (“Everist Materials”), a vertically integrated aggregates, ready-mix concrete, and paving business based in Silverthorne, Colorado, with two aggregates plants, five ready-mix plants and two asphalt plants. |
|
· |
On October 3, 2016, the Company acquired Midland Concrete Ltd. (“Midland Concrete”), a ready-mix company with one plant servicing the Midland, Texas market. |
|
· |
On August 19, 2016, the Company acquired H.C. Rustin Corporation (“Rustin”), a ready-mix company with 12 ready-mix plants servicing the Southern Oklahoma market. |
|
· |
On April 29, 2016, the Company acquired Sierra Ready Mix, LLC (“Sierra”), a vertically integrated aggregates and ready-mix concrete business with one sand and gravel pit and two ready-mix concrete plants located in Las Vegas, Nevada. |
East segment:
|
· |
On May 12, 2017, we acquired Glasscock Company, Inc. and Glasscock Logistics Company, LLC (“Glasscock”), a vertically integrated sand, ready-mix, recycle and trucking business based in Sumter, South Carolina. |
|
· |
On April 3, 2017, we acquired Carolina Sand, LLC (“Carolina Sand”), a sand and trucking business with four sand pits in northeastern South Carolina. |
|
· |
On March 17, 2017, the Company acquired Sandidge Concrete (“Sandidge”), a ready-mix concrete company with three plants servicing the Columbia, Missouri market. |
|
· |
On February 24, 2017, the Company acquired Razorback Concrete Company (“Razorback”), an aggregates-based business with ready-mix concrete operations in central and northeastern Arkansas. |
|
· |
On August 26, 2016, the Company acquired R.D. Johnson Excavating Company, LLC and Asphalt Sales of Lawrence, LLC (“RD Johnson”), an asphalt producer and construction services company based in Lawrence, Kansas. |
|
· |
On August 8, 2016, the Company acquired the assets of Weldon Real Estate, LLC (“Weldon”) and the membership interests of Honey Creek Disposal Service, LLC. (‘‘Honey Creek’’). Honey Creek is a trash |
9
collection business, which was sold immediately after acquisition. The Company retained the building assets of Weldon, where its recycling business in Kansas is operated. |
|
· |
On May 20, 2016, the Company acquired seven aggregates quarries in central and northwest Missouri from APAC-Kansas, Inc. and APAC-Missouri, Inc., subsidiaries of Oldcastle Materials, Inc. (“Oldcastle Assets”). |
|
· |
On March 18, 2016, the Company acquired Boxley Materials Company (“Boxley”), a vertically integrated company based in Roanoke, Virginia with six quarries, four ready-mix concrete plants and four asphalt plants. |
|
· |
On February 5, 2016, the Company acquired American Materials Company (“AMC”), an aggregates company with five sand and gravel pits servicing coastal North and South Carolina. |
Cement segment
|
· |
On August 30, 2016, the Company acquired two river-supplied cement and fly-ash distribution terminals in Southern Louisiana. |
The purchase price allocation, primarily the valuation of property, plant and equipment for the 2017 acquisitions, as well as certain of the 2016 acquisitions has not yet been finalized due to the timing of the acquisitions. The following table summarizes aggregated information regarding the fair values of the assets acquired and liabilities assumed as of the respective acquisition dates:
|
|
|
Six months ended |
|
Year Ended |
||
|
|
|
July 1, |
|
December 31, |
||
|
|
|
2017 |
|
2016 |
||
|
|
|
|
|
|
|
|
|
Financial assets (1) |
|
$ |
18,042 |
|
$ |
22,204 |
|
Inventories |
|
|
6,099 |
|
|
17,215 |
|
Property, plant and equipment |
|
|
84,402 |
|
|
180,321 |
|
Intangible assets |
|
|
13 |
|
|
5,531 |
|
Other assets |
|
|
3,477 |
|
|
6,757 |
|
Financial liabilities (1) |
|
|
(10,751) |
|
|
(20,248) |
|
Other long-term liabilities |
|
|
(4,157) |
|
|
(36,074) |
|
Net assets acquired |
|
|
97,125 |
|
|
175,706 |
|
Goodwill |
|
|
130,582 |
|
|
176,319 |
|
Purchase price |
|
|
227,707 |
|
|
352,025 |
|
Acquisition related liabilities |
|
|
(13,390) |
|
|
(17,034) |
|
Other |
|
|
(1,193) |
|
|
1,967 |
|
Net cash paid for acquisitions |
|
$ |
213,124 |
|
$ |
336,958 |
|
(1) |
In the first quarter of 2017, we reclassified $1.2 million of accounts payable overdrafts from financial assets to financial liabilities for the year ended December 31, 2016. |
Changes in the carrying amount of goodwill, by reportable segment, from December 31, 2016 to July 1, 2017 are summarized as follows:
|
|
|
West |
|
East |
|
Cement |
|
Total |
||||
|
Balance, December 31, 2016 |
|
$ |
334,257 |
|
$ |
243,417 |
|
$ |
204,538 |
|
$ |
782,212 |
|
Acquisitions (1) |
|
|
95,000 |
|
|
39,009 |
|
|
118 |
|
|
134,127 |
|
Foreign currency translation adjustments |
|
|
2,172 |
|
|
— |
|
|
— |
|
|
2,172 |
|
Balance, July 1, 2017 |
|
$ |
431,429 |
|
$ |
282,426 |
|
$ |
204,656 |
|
$ |
918,511 |
|
|
|
|
|
|
|
|
|
|
|
|
|
|
|
Accumulated impairment losses as of July 1, 2017 and December 31, 2016 |
|
$ |
(53,264) |
|
$ |
(14,938) |
|
$ |
— |
|
$ |
(68,202) |
|
(1) |
Reflects goodwill from 2017 acquisitions and working capital adjustments from prior year acquisitions. |
10
The Company’s intangible assets are primarily composed of goodwill, lease agreements and reserve rights. The assets related to lease agreements reflect the submarket royalty rates paid under agreements, primarily for extracting aggregates. The values were determined as of the respective acquisition dates by a comparison of market-royalty rates. The reserve rights relate to aggregate reserves to which the Company has the rights of ownership, but does not own the reserves. The intangible assets are amortized on a straight-line basis over the lives of the leases. The following table shows intangible assets by type and in total:
|
|
|
July 1, 2017 |
|
December 31, 2016 |
||||||||||||||
|
|
|
Gross |
|
|
|
|
Net |
|
Gross |
|
|
|
|
Net |
||||
|
|
|
Carrying |
|
Accumulated |
|
Carrying |
|
Carrying |
|
Accumulated |
|
Carrying |
||||||
|
|
|
Amount |
|
Amortization |
|
Amount |
|
Amount |
|
Amortization |
|
Amount |
||||||
|
Leases |
|
$ |
15,902 |
|
$ |
(3,752) |
|
$ |
12,150 |
|
$ |
15,888 |
|
$ |
(3,382) |
|
$ |
12,506 |
|
Reserve rights |
|
|
6,234 |
|
|
(1,459) |
|
|
4,775 |
|
|
8,706 |
|
|
(3,710) |
|
|
4,996 |
|
Trade names |
|
|
1,000 |
|
|
(708) |
|
|
292 |
|
|
1,000 |
|
|
(658) |
|
|
342 |
|
Other |
|
|
249 |
|
|
(122) |
|
|
127 |
|
|
249 |
|
|
(104) |
|
|
145 |
|
Total intangible assets |
|
$ |
23,385 |
|
$ |
(6,041) |
|
$ |
17,344 |
|
$ |
25,843 |
|
$ |
(7,854) |
|
$ |
17,989 |
Amortization expense totaled $0.4 million and $0.7 million for the three and six months ended July 1, 2017, respectively, and $0.6 million and $1.0 million for the three and six months ended July 2, 2016, respectively. The estimated amortization expense for the intangible assets for each of the five years subsequent to July 1, 2017 is as follows:
|
2017 (six months) |
|
$ |
627 |
|
2018 |
|
|
1,279 |
|
2019 |
|
|
1,260 |
|
2020 |
|
|
1,177 |
|
2021 |
|
|
1,135 |
|
2022 |
|
|
1,122 |
|
Thereafter |
|
|
10,744 |
|
Total |
|
$ |
17,344 |
3.ACCOUNTS RECEIVABLE, NET
Accounts receivable, net consisted of the following as of July 1, 2017 and December 31, 2016:
|
|
|
July 1, |
|
December 31, |
||
|
|
|
2017 |
|
2016 |
||
|
Trade accounts receivable |
|
$ |
239,136 |
|
$ |
152,845 |
|
Retention receivables |
|
|
11,617 |
|
|
12,117 |
|
Receivables from related parties |
|
|
373 |
|
|
721 |
|
Accounts receivable |
|
|
251,126 |
|
|
165,683 |
|
Less: Allowance for doubtful accounts |
|
|
(3,580) |
|
|
(3,306) |
|
Accounts receivable, net |
|
$ |
247,546 |
|
$ |
162,377 |
Retention receivables are amounts earned by the Company but held by customers until paving and related service contracts and projects are near completion or fully completed. Amounts are generally billed and collected within one year.
4.INVENTORIES
Inventories consisted of the following as of July 1, 2017 and December 31, 2016:
11
|
|
|
July 1, |
|
December 31, |
||
|
|
|
2017 |
|
2016 |
||
|
Aggregate stockpiles |
|
$ |
115,365 |
|
$ |
103,073 |
|
Finished goods |
|
|
42,621 |
|
|
35,071 |
|
Work in process |
|
|
5,815 |
|
|
6,440 |
|
Raw materials |
|
|
19,085 |
|
|
13,095 |
|
Total |
|
$ |
182,886 |
|
$ |
157,679 |
5.ACCRUED EXPENSES
Accrued expenses consisted of the following as of July 1, 2017 and December 31, 2016:
|
|
|
July 1, |
|
December 31, |
||
|
|
|
2017 |
|
2016 |
||
|
Interest |
|
$ |
24,311 |
|
$ |
22,991 |
|
Payroll and benefits |
|
|
25,197 |
|
|
30,546 |
|
Capital lease obligations |
|
|
19,838 |
|
|
11,766 |
|
Insurance |
|
|
13,249 |
|
|
11,966 |
|
Non-income taxes |
|
|
10,226 |
|
|
5,491 |
|
Professional fees |
|
|
2,420 |
|
|
2,459 |
|
Other (1) |
|
|
24,019 |
|
|
26,386 |
|
Total |
|
$ |
119,260 |
|
$ |
111,605 |
|
(1) |
Consists primarily of subcontractor and working capital settlement accruals. |
6.DEBT
Debt consisted of the following as of July 1, 2017 and December 31, 2016:
|
|
|
July 1, |
|
December 31, |
||
|
|
|
2017 |
|
2016 |
||
|
Term Loan, due 2022: |
|
|
|
|
|
|
|
$637.0 million and $640.3 million, net of $2.3 million and $2.6 million discount at July 1, 2017 and December 31, 2016, respectively |
|
$ |
634,676 |
|
$ |
637,658 |
|
81⁄2% Senior Notes, due 2022 |
|
|
250,000 |
|
|
250,000 |
|
61⁄8% Senior Notes, due 2023: |
|
|
|
|
|
|
|
$650.0 million, net of $1.5 million and $1.6 million discount at July 1, 2017 and December 31, 2016, respectively |
|
|
648,528 |
|
|
648,407 |
|
51⁄8% Senior Notes, due 2025 |
|
|
300,000 |
|
|
— |
|
Total |
|
|
1,833,204 |
|
|
1,536,065 |
|
Current portion of long-term debt |
|
|
6,500 |
|
|
6,500 |
|
Long-term debt |
|
$ |
1,826,704 |
|
$ |
1,529,565 |
12
The contractual payments of long-term debt, including current maturities, for the five years subsequent to July 1, 2017, are as follows:
|
2017 (six months) |
|
$ |
3,250 |
|
2018 |
|
|
4,875 |
|
2019 |
|
|
6,500 |
|
2020 |
|
|
8,125 |
|
2021 |
|
|
6,500 |
|
2022 |
|
|
857,750 |
|
Thereafter |
|
|
950,000 |
|
Total |
|
|
1,837,000 |
|
Less: Original issue net discount |
|
|
(3,796) |
|
Less: Capitalized loan costs |
|
|
(18,991) |
|
Total debt |
|
$ |
1,814,213 |
Senior Notes—On June 1, 2017, Summit LLC and Summit Materials Finance Corp., an indirect wholly-owned subsidiary of Summit LLC ("Finance Corp." and with Summit LLC, the “Issuers”) issued $300.0 million of 5.125% senior notes due June 1, 2025 (the “2025 Notes”). The 2025 Notes were issued at 100.0% of their par value with proceeds of $295.4 million, net of related fees and expenses. Proceeds from the sale of the 2025 Notes are intended to be used for acquisitions and to pay fees and expenses incurred in connection with any such acquisitions and the offering, with any remaining net proceeds to be used for general corporate purposes, which may include repaying indebtedness, capital expenditures and funding working capital. The 2025 Notes were issued under an indenture dated June 1, 2017 (as amended and supplemented, the “2017 Indenture”). The 2017 Indenture contains covenants limiting, among other things, Summit LLC and its restricted subsidiaries’ ability to incur additional indebtedness or issue certain preferred shares, pay dividends, redeem stock or make other distributions, make certain investments, sell or transfer certain assets, create liens, consolidate, merge, sell or otherwise dispose of all or substantially all of its assets, enter inter certain transactions with affiliates, and designate subsidiaries as unrestricted subsidiaries. The 2017 Indenture also contains customary events of default. Interest on the 2025 Notes is payable semi-annually on June 1 and December 1 of each year commencing on December 1, 2017.
On March 8, 2016, the Issuers issued $250.0 million of 8.500% senior notes due April 15, 2022 (the “2022 Notes”). The 2022 Notes were issued at 100.0% of their par value with proceeds of $246.3 million, net of related fees and expenses. The proceeds from the sale of the 2022 Notes were used to fund the acquisition of Boxley, replenish cash used for the acquisition of AMC and pay expenses incurred in connection with these acquisitions. The 2022 Notes were issued under an indenture dated March 8, 2016, the terms of which are generally consistent with the 2017 Indenture. Interest on the 2022 Notes is payable semi-annually in arrears on April 15 and October 15 of each year.
In 2015, the Issuers issued $650.0 million of 6.125% senior notes due July 2023 (the "2023 Notes” and collectively with the 2022 Notes and the 2025 Notes, the “Senior Notes”). Of the aggregate $650.0 million of 2023 Notes, $350.0 million were issued at par and $300.0 million were issued at 99.375% of par. The 2023 Notes were issued under an indenture dated July 8, 2015, the terms of which are generally consistent with the 2017 Indenture. Interest on the 2023 Notes is payable semi-annually in arrears on January 15 and July 15 of each year.
As of July 1, 2017 and December 31, 2016, the Company was in compliance with all financial covenants under the applicable indentures.
Senior Secured Credit Facilities— Summit LLC has credit facilities that provide for term loans in an aggregate amount of $650.0 million and revolving credit commitments in an aggregate amount of $235.0 million (the “Senior Secured Credit Facilities”). Under the Senior Secured Credit Facilities, required principal repayments of 0.25% of the original aggregate amount of term debt are due on the last business day of each March, June, September and December. The unpaid principal balance is due in full on the maturity date, which is July 17, 2022.
On January 19, 2017, Summit LLC entered into Amendment No. 1 (“Amendment No. 1”) to the credit agreement governing the Senior Secured Credit Facilities (the “Credit Agreement”), which, among other things, reduced the applicable margin in respect of the $640.3 million outstanding principal amount of term loans thereunder and included a 1.00% prepayment premium in connection with certain further repricing events that occur on or prior to
13
the six-month anniversary of the effective date of Amendment No. 1. All other material terms and provisions remain substantially identical to the terms and provisions in place immediately prior to the effectiveness of Amendment No. 1.
The revolving credit facility bears interest per annum equal to, at Summit LLC’s option, either (i) a base rate determined by reference to the highest of (a) the federal funds rate plus 0.50%, (b) the prime rate of Bank of America, N.A. and (c) LIBOR plus 1.00%, plus an applicable margin of 2.25% for base rate loans or (ii) a LIBOR rate determined by reference to Reuters prior to the interest period relevant to such borrowing adjusted for certain additional costs plus an applicable margin of 3.25% for LIBOR rate loans.
There were no outstanding borrowings under the revolving credit facility as of July 1, 2017 and December 31, 2016, leaving remaining borrowing capacity of $218.9 million as of July 1, 2017, which is net of $16.1 million of outstanding letters of credit. The outstanding letters of credit are renewed annually and support required bonding on construction projects and the Company’s insurance liabilities.
Summit LLC’s Consolidated First Lien Net Leverage Ratio, as such term is defined in the Credit Agreement, should be no greater than 4.75:1.0 as of each quarter-end. As of July 1, 2017 and December 31, 2016, Summit LLC was in compliance with all financial covenants.
Summit LLC’s wholly-owned domestic subsidiary companies, subject to certain exclusions and exceptions, are named as subsidiary guarantors of the Senior Notes and the Senior Secured Credit Facilities. In addition, Summit LLC has pledged substantially all of its assets as collateral, subject to certain exclusions and exceptions, for the Senior Secured Credit Facilities.
The following table presents the activity for the deferred financing fees for the six months ended July 1, 2017 and July 2, 2016:
|
|
|
Deferred financing fees |
|
|
Balance—December 31, 2016 |
|
$ |
18,290 |
|
Loan origination fees |
|
|
5,308 |
|
Amortization |
|
|
(1,883) |
|
Write off of deferred financing fees |
|
|
(45) |
|
Balance—July 1, 2017 |
|
$ |
21,670 |
|
|
|
|
|
|
|
|
|
|
|
Balance—January 2, 2016 |
|
$ |
15,892 |
|
Loan origination fees |
|
|
5,109 |
|
Amortization |
|
|
(1,590) |
|
Balance—July 2, 2016 |
|
$ |
19,411 |
Other—On January 15, 2015, the Company’s wholly-owned subsidiary in British Columbia, Canada entered into an agreement with HSBC for a (i) $6.0 million Canadian dollar (“CAD”) revolving credit commitment to be used for operating activities that bears interest per annum equal to the bank’s prime rate plus 0.20%, (ii) $0.5 million CAD revolving credit commitment to be used for capital equipment that bears interest per annum at the bank’s prime rate plus 0.90% and (iii) $0.4 million CAD revolving credit commitment to provide guarantees on behalf of that subsidiary. There were no amounts outstanding under this agreement as of July 1, 2017 or December 31, 2016.
7.FAIR VALUE
Fair Value Measurements—Certain acquisitions made by the Company require the payment of contingent amounts of purchase consideration. These payments are contingent on specified operating results being achieved in periods subsequent to the acquisition and will only be made if earn-out thresholds are achieved. Contingent consideration obligations are measured at fair value each reporting period. Any adjustments to fair value are recognized in earnings in the period identified.
14
The Company has entered into interest rate derivatives on $200.0 million of its term loan borrowings to add stability to interest expense and to manage its exposure to interest rate movements. The effective portion of changes in the fair value of derivatives designated and that qualify as cash flow hedges is recorded in accumulated other comprehensive income (loss) and will be subsequently reclassified into earnings in the period that the hedged forecasted transaction affects earnings. The fair value of contingent consideration and derivatives as of July 1, 2017 and December 31, 2016 was:
|
|
|
July 1, |
|
December 31, |
||
|
|
|
2017 |
|
2016 |
||
|
Current portion of acquisition-related liabilities and Accrued expenses: |
|
|
|
|
|
|
|
Contingent consideration |
|
$ |
3,250 |
|
$ |
9,288 |
|
Cash flow hedges |
|
|
844 |
|
|
942 |
|
Acquisition-related liabilities and Other noncurrent liabilities |
|
|
|
|
|
|
|
Contingent consideration |
|
$ |
13,979 |
|
$ |
2,377 |
|
Cash flow hedges |
|
|
1,368 |
|
|
1,438 |
The fair value of contingent consideration was based on unobservable, or Level 3, inputs, including projected probability-weighted cash payments and an 11.0% discount rate, which reflects a market discount rate. Changes in fair value may occur as a result of a change in actual or projected cash payments, the probability weightings applied by the Company to projected payments or a change in the discount rate. Significant increases or decreases in any of these inputs in isolation could result in a lower, or higher, fair value measurement. The fair value of the cash flow hedges are based on observable, or Level 2, inputs such as interest rates, bond yields and prices in inactive markets. There were no material valuation adjustments to contingent consideration or derivatives as of July 1, 2017 and July 2, 2016.
Financial Instruments—The Company’s financial instruments include debt and certain acquisition-related liabilities (deferred consideration and noncompete obligations). The carrying value and fair value of these financial instruments as of July 1, 2017 and December 31, 2016 was:
|
|
|
July 1, 2017 |
|
December 31, 2016 |
||||||||
|
|
|
Fair Value |
|
Carrying Value |
|
Fair Value |
|
Carrying Value |
||||
|
Level 2 |
|
|
|
|
|
|
|
|
|
|
|
|
|
Long-term debt(1) |
|
$ |
1,906,905 |
|
$ |
1,833,204 |
|
$ |
1,586,102 |
|
$ |
1,536,065 |
|
|
|
|
|
|
|
|
|
|
|
|
|
|
|
Level 3 |
|
|
|
|
|
|
|
|
|
|
|
|
|
Current portion of deferred consideration and noncompete obligations(2) |
|
|
14,471 |
|
|
14,471 |
|
|
14,874 |
|
|
14,874 |
|
Long term portion of deferred consideration and noncompete obligations(3) |
|
|
24,060 |
|
|
24,060 |
|
|
30,287 |
|
|
30,287 |
|
(1) |
$6.5 million included in current portion of debt as of July 1, 2017 and December 31, 2016. |
|
(2) |
Included in current portion of acquisition-related liabilities on the consolidated balance sheets. |
|
(3) |
Included in acquisition-related liabilities on the consolidated balance sheets. |
The fair value of debt was determined based on observable, or Level 2, inputs, such as interest rates, bond yields and quoted prices in inactive markets. The fair values of the deferred consideration and noncompete obligations were determined based on unobservable, or Level 3, inputs, including the cash payment terms in the purchase agreements and a discount rate reflecting the Company’s credit risk. The discount rate used is generally consistent with that used when the obligations were initially recorded.
Securities with a maturity of three months or less are considered cash equivalents and the fair value of these assets approximates their carrying value.
15
8.ACCUMULATED OTHER COMPREHENSIVE INCOME (LOSS)
The changes in each component of accumulated other comprehensive income (loss) consisted of the following:
|
|
|
|
|
|
|
|
|
|
|
|
Accumulated |
|
|
|
|
|
|
|
Foreign currency |
|
|
|
|
other |
||
|
|
|
Change in |
|
translation |
|
Cash flow hedge |
|
comprehensive |
||||
|
|
|
retirement plans |
|
adjustments |
|
adjustments |
|
income (loss) |
||||
|
Balance — December 31, 2016 |
|
$ |
1,450 |
|
$ |
(3,106) |
|
$ |
(593) |
|
$ |
(2,249) |
|
Postretirement liability adjustment |
|
|
397 |
|
|
— |
|
|
— |
|
|
397 |
|
Foreign currency translation adjustment |
|
|
— |
|
|
3,962 |
|
|
— |
|
|
3,962 |
|
Income on cash flow hedges |
|
|
— |
|
|
— |
|
|
163 |
|
|
163 |
|
Balance — July 1, 2017 |
|
$ |
1,847 |
|
$ |
856 |
|
$ |
(430) |
|
$ |
2,273 |
|
|
|
|
|
|
|
|
|
|
|
|
|
|
|
|
|
|
|
|
|
|
|
|
|
|
|
|
|
Balance — January 2, 2016 |
|
$ |
1,049 |
|
$ |
(3,379) |
|
$ |
(465) |
|
$ |
(2,795) |
|
Foreign currency translation adjustment |
|
|
— |
|
|
2,592 |
|
|
— |
|
|
2,592 |
|
Loss on cash flow hedges |
|
|
— |
|
|
— |
|
|
(1,778) |
|
|
(1,778) |
|
Balance — July 2, 2016 |
|
$ |
1,049 |
|
$ |
(787) |
|
$ |
(2,243) |
|
$ |
(1,981) |
9.INCOME TAXES
Summit Inc.’s tax provision includes its proportional share of Summit Holdings’ tax attributes. Summit Holdings’ subsidiaries are primarily limited liability companies, but do include certain entities organized as C corporations and a Canadian subsidiary. The tax attributes related to the limited liability companies are passed on to Summit Holdings and then to its partners, including Summit Inc. The tax attributes associated with the C corporation and Canadian subsidiaries are fully reflected in the Company’s accounts.
Our income tax expense was $3.4 million and $1.3 million in the three and six months ended July 1, 2017, respectively. Our effective income tax rate was lower in the second quarter of 2017 primarily due to the benefit associated with the depletion in excess of U.S. GAAP depletion recognized in our C corporations in the three and six months ended July 1, 2017. During the three and six months periods ended July 2, 2016, our income tax benefit was $1.1 million and $9.2 million, respectively. The effective tax rate for Summit Inc. differs from the federal rate primarily due to (1) the change in valuation allowance, (2) tax depletion expense in excess of the expense recorded under U.S. GAAP, (3) the minority interest in the Summit Holdings partnership that is allocated outside of the Company and (4) various other items such as limitations on meals and entertainment, certain stock compensation and other costs for the three and six months ended July 1, 2017.
As of July 1, 2017 and December 31, 2016, Summit Inc. had a valuation allowance of $514.5 million and $502.8 million, respectively, on substantially all of its net deferred tax assets, including its net operating loss carryforwards.
In assessing the realizability of deferred tax assets, including the deferred tax assets subject to the TRA described below, management determined that it was more likely than not that a portion of the deferred tax assets would not be realized. The ultimate realization of deferred tax assets is dependent upon the generation of future taxable income during the periods in which those temporary differences become deductible, as well as consideration of tax-planning strategies we may seek to utilize of any net operating loss carryforwards scheduled to expire in the near future. Each of these items was considered in our evaluation of the realizability of deferred tax assets as of December 31, 2016 and each subsequent period through July 1, 2017. As of July 1, 2017, the positive and negative evidence that was considered in the evaluation of the valuation allowance that existed as of December 31, 2016 remained relatively consistent. Further, we have not yet moved into a position where there is consistent cumulative income in conjunction with other sources of taxable income that would allow the Company to release the valuation allowance.
As our estimates for income within Summit Inc. increase and become positive on a cumulative basis, we will consider that as significant positive evidence which may lead to a reduction in the valuation allowance against our deferred tax assets. We prepare our estimates of income quarterly, and would consider income in 2017 to be
16
significant positive evidence in connection with our analysis of other sources of taxable income which may lead to releasing some or all of our valuation allowance.
Tax Receivable Agreement—The Company is party to a TRA with the holders of LP Units and certain other pre-initial public offering owners (“Investor Entities”) that provides for the payment by Summit Inc. to exchanging holders of LP Units of 85% of the benefits, if any, that Summit Inc. actually realizes (or, under certain circumstances such as an early termination of the TRA, is deemed to realize) as a result of (i) increases in the tax basis of tangible and intangible assets of Summit Holdings and (ii) the utilization of certain net operating losses of the Investor Entities and certain other tax benefits related to entering into the TRA, including tax benefits attributable to payments under the TRA. As of December 31, 2016, we had a partial valuation allowance against all of our net deferred tax assets, including our net operating loss carryforwards.
In the six months ended July 1, 2017, 1,014,159 LP Units were acquired by Summit Inc. in exchange for an equal number of newly-issued shares of Summit Inc.’s Class A common stock. These exchanges resulted in new deferred tax assets of approximately $13.5 million, and an increase in our valuation allowance for those new deferred tax assets. As of July 1, 2017, we performed an analysis of the realizability of all of our deferred tax assets, including those subject to the TRA. We determined that $1.7 million of the valuation allowance could be reduced based on actual income during the six months ended July 1, 2017 and our estimates of income within Summit Inc. for the remainder of the year. Further, as we now believe $1.7 million more of our TRA net operating loss carryforward deferred tax asset is now more likely than not to be realizable, we concluded that 85% of that amount, or $1.5 million, had also become probable of being payable under our TRA, and as such, recorded additional TRA expense and TRA liability.
As discussed above, we will consider positive income on a cumulative basis as significant positive evidence of the future realizability of our deferred tax assets. Our net operating loss carryforward deferred tax assets begin to expire in 2030, and as such, we have not given consideration to any potential tax planning strategies as a source of future taxable income to monetize those net operating loss carryforwards. The Company will continue to monitor facts and circumstances, including our analysis of other sources of taxable income, in the reassessment of the likelihood that the tax benefit will be realized.
Tax Distributions – The holders of Summit Holdings’ LP Units, including Summit Inc., incur U.S. federal, state and local income taxes on their share of any taxable income of Summit Holdings. The limited partnership agreement of Summit Holdings provides for pro rata cash distributions (“tax distributions”) to the holders of the LP Units in an amount generally calculated to provide each holder of LP Units with sufficient cash to cover its tax liability in respect of the LP Units. In general, these tax distributions are computed based on Summit Holdings’ estimated taxable income allocated to each holder of LP Units multiplied by an assumed tax rate equal to the highest effective marginal combined U.S. federal, state and local income tax rate applicable to an individual or corporate resident in New York, New York (or a corporate resident in certain circumstances). In the six months ended July 1, 2017 and July 2, 2016, $0.1 million and $0.7 million, respectively, of tax distribution payments were made.
C Corporation Subsidiaries — The effective income tax rate for the C corporations differ from the statutory federal rate primarily due to (1) tax depletion expense in excess of the expense recorded under U.S. GAAP, (2) state income taxes and the effect of graduated tax rates and (3) various other items such as limitations on meals and entertainment and other costs. The effective income tax rate for the Company’s Canadian subsidiary is not significantly different from its historical effective tax rate.
As of July 1, 2017 and December 31, 2016, Summit Inc. and its subsidiaries had not recognized any liabilities for uncertain tax positions. The Company records interest and penalties as a component of the income tax provision. No material interest or penalties were recognized in income tax expense during the three and six months ended July 1, 2017 and July 2, 2016.
10. NET EARNINGS (LOSS) PER SHARE
Basic earnings (loss) per share is computed by dividing net earnings (loss) by the weighted average common shares outstanding and diluted net earnings (loss) is computed by dividing net earnings (loss), adjusted for changes
17
in the earnings allocated to Summit Inc. as a result of the assumed conversion of LP Units, by the weighted-average common shares outstanding assuming dilution.
The following table shows the calculation of basic earnings (loss) per share:
|
|
|
Three months ended |
|
Six months ended |
||||||||
|
|
|
July 1, |
|
July 2, |
|
July 1, |
|
July 2, |
||||
|
|
|
2017 |
|
2016 |
|
2017 |
|
2016 |
||||
|
Net income (loss) attributable to Summit Inc. |
|
$ |
50,000 |
|
$ |
13,371 |
|
$ |
(2,444) |
|
$ |
(7,747) |
|
Weighted average shares of Class A stock outstanding |
|
|
106,898,512 |
|
|
62,743,149 |
|
|
106,035,087 |
|
|
56,812,906 |
|
Basic income (loss) per share |
|
$ |
0.47 |
|
$ |
0.21 |
|
$ |
(0.02) |
|
$ |
(0.14) |
|
|
|
|
|
|
|
|
|
|
|
|
|
|
|
Net income (loss) attributable to Summit Inc. |
|
$ |
50,000 |
|
$ |
13,371 |
|
$ |
(2,444) |
|
$ |
(7,747) |
|
Add: Noncontrolling interest impact of LP Unit conversion |
|
|
— |
|
|
— |
|
|
— |
|
|
(12,702) |
|
Diluted net income (loss) attributable to Summit Inc. |
|
|
50,000 |
|
|
13,371 |
|
|
(2,444) |
|
|
(20,449) |
|
|
|
|
|
|
|
|
|
|
|
|
|
|
|
Weighted average shares of Class A stock outstanding |
|
|
106,898,512 |
|
|
62,743,149 |
|
|
106,035,087 |
|
|
56,812,906 |
|
Add: weighted average of LP Units |
|
|
— |
|
|
— |
|
|
— |
|
|
44,141,327 |
|
Add: stock options |
|
|
759,649 |
|
|
1,012,467 |
|
|
— |
|
|
— |
|
Add: warrants |
|
|
33,877 |
|
|
21,975 |
|
|
— |
|
|
— |
|
Add: restricted stock units |
|
|
150,420 |
|
|
94,713 |
|
|
— |
|
|
— |
|
Add: performance stock units |
|
|
66,430 |
|
|
21,605 |
|
|
— |
|
|
— |
|
Weighted average dilutive shares outstanding |
|
|
107,908,888 |
|
|
63,893,909 |
|
|
106,035,087 |
|
|
100,954,233 |
|
Diluted earnings (loss) per share |
|
$ |
0.46 |
|
$ |
0.21 |
|
$ |
(0.02) |
|
$ |
(0.20) |
Excluded from the above calculations were the shares noted below as they were antidilutive:
|
|
|
Three months ended |
|
Six months ended |
||||||||
|
|
|
July 1, |
|
July 2, |
|
July 1, |
|
July 2, |
||||
|
|
|
2017 |
|
2016 |
|
2017 |
|
2016 |
||||
|
Antidilutive shares: |
|
|
|
|
|
|
|
|
|
|
|
|
|
LP Units |
|
|
4,574,104 |
|
|
38,418,311 |
|
|
4,821,955 |
|
|
— |
|
Time-vesting stock options |
|
|
— |
|
|
— |
|
|
5,040,170 |
|
|
4,496,672 |
|
Time-vesting restricted stock units |
|
|
— |
|
|
— |
|
|
513,998 |
|
|
360,812 |
|
Market-based restricted stock units |
|
|
— |
|
|
— |
|
|
211,455 |
|
|
130,691 |
|
Warrants |
|
|
— |
|
|
— |
|
|
102,778 |
|
|
160,333 |
11. COMMITMENTS AND CONTINGENCIES
The Company is party to certain legal actions arising from the ordinary course of business activities. Accruals are recorded when the outcome is probable and can be reasonably estimated. While the ultimate results of claims and litigation cannot be predicted with certainty, management expects that the ultimate resolution of all pending or threatened claims and litigation will not have a material effect on the Company’s consolidated results of operations, financial position or liquidity. The Company records legal fees as incurred.
Litigation and Claims—The Company is obligated under an indemnification agreement entered into with the sellers of Harper Contracting, Inc., Harper Sand and Gravel, Inc., Harper Excavating, Inc., Harper Ready Mix Company, Inc. and Harper Investments, Inc. for the sellers’ ownership interests in a joint venture agreement. The Company has the rights to any benefits under the joint venture as well as the assumption of any obligations, but does not own equity interests in the joint venture. The joint venture has incurred significant losses on a highway project in Utah, which have resulted in requests for funding from the joint venture partners and ultimately from the Company. Through July 1, 2017, the Company has funded $8.8 million, $4.0 million in 2012 and $4.8 million in 2011. In 2012 and 2011, the Company recognized losses on the indemnification agreement of $8.0 million and $1.9 million, respectively. As of July 1, 2017 and December 31, 2016, an accrual of $4.3 million was recorded in other noncurrent liabilities as management’s best estimate of future funding obligations.
Environmental Remediation and Site Restoration —The Company’s operations are subject to and affected by federal, state, provincial and local laws and regulations relating to the environment, health and safety and other
18
regulatory matters. These operations require environmental operating permits, which are subject to modification, renewal and revocation. The Company regularly monitors and reviews its operations, procedures and policies for compliance with these laws and regulations. Despite these compliance efforts, risk of environmental liability is inherent in the operation of the Company’s business, as it is with other companies engaged in similar businesses and there can be no assurance that environmental liabilities or noncompliance will not have a material adverse effect on the Company’s consolidated financial condition, results of operations or liquidity.
The Company has asset retirement obligations arising from regulatory and contractual requirements to perform reclamation activities at the time certain quarries and landfills are closed. As of July 1, 2017 and December 31, 2016, $20.5 million and $18.8 million, respectively, were included in other noncurrent liabilities on the consolidated balance sheets and $5.8 million and $5.1 million, respectively, were included in accrued expenses for future reclamation costs. The total undiscounted anticipated costs for site reclamation as of July 1, 2017 and December 31, 2016 were $69.4 million and $63.6 million, respectively.
Other—The Company is obligated under various firm purchase commitments for certain raw materials and services that are in the ordinary course of business. Management does not expect any significant changes in the market value of these goods and services during the commitment period that would have a material adverse effect on the financial condition, results of operations, and cash flows of the Company. The terms of the purchase commitments generally approximate one year.
12. SUPPLEMENTAL CASH FLOW INFORMATION
Supplemental cash flow information is as follows:
|
|
|
Six months ended |
||||
|
|
|
July 1, |
|
July 2, |
||
|
|
|
2017 |
|
2016 |
||
|
Cash payments: |
|
|
|
|
|
|
|
Interest |
|
$ |
44,201 |
|
$ |
35,321 |
|
Income taxes |
|
|
954 |
|
|
1,017 |
|
Non cash financing activities: |
|
|
|
|
|
|
|
Exchange of LP units to shares of Class A common stock |
|
|
27,600 |
|
|
263,649 |
13. SEGMENT INFORMATION
The Company has three operating segments: West; East; and Cement, which are its reporting segments. These segments are consistent with the Company’s management reporting structure.
The operating results of each segment are regularly reviewed and evaluated by the Chief Executive Officer, the Company’s Chief Operating Decision Maker (“CODM”). The CODM primarily evaluates the performance of its segments and allocates resources to them based on a segment profit metric that we call Adjusted EBITDA, which is computed as earnings from continuing operations before interest, taxes, depreciation, depletion, amortization, accretion, share-based compensation, and transaction costs, as well as various other non-recurring, non-cash amounts.
The West and East segments are engaged in various activities including quarry mining, aggregate production and contracting. The Cement segment is engaged in the production of Portland cement. Assets employed by each segment include assets directly identified with those operations. Corporate assets consist primarily of cash, property, plant and equipment for corporate operations and other assets not directly identifiable with a reportable business segment. The accounting policies applicable to each segment are consistent with those used in the consolidated financial statements.
19
The following tables display selected financial data for the Company’s reportable business segments as of July 1, 2017 and December 31, 2016 and for the three and six months ended July 1, 2017 and July 2, 2016:
|
|
|
Three months ended |
|
Six months ended |
||||||||
|
|
|
July 1, |
|
July 2, |
|
July 1, |
|
July 2, |
||||
|
|
|
2017 |
|
2016 |
|
2017 |
|
2016 |
||||
|
Revenue*: |
|
|
|
|
|
|
|
|
|
|
|
|
|
West |
|
$ |
275,855 |
|
$ |
226,277 |
|
$ |
419,074 |
|
$ |
349,994 |
|
East |
|
|
164,009 |
|
|
139,380 |
|
|
261,232 |
|
|
210,054 |
|
Cement |
|
|
84,229 |
|
|
79,617 |
|
|
128,064 |
|
|
113,605 |
|
Total revenue |
|
$ |
524,093 |
|
$ |
445,274 |
|
$ |
808,370 |
|
$ |
673,653 |
*Intercompany sales are immaterial and the presentation above only reflects sales to external customers.
|
|
|
Three months ended |
|
Six months ended |
||||||||
|
|
|
July 1, |
|
July 2, |
|
July 1, |
|
July 2, |
||||
|
|
|
2017 |
|
2016 |
|
2017 |
|
2016 |
||||
|
Revenue by product*: |
|
|
|
|
|
|
|
|
|
|
|
|
|
Aggregates |
|
$ |
84,221 |
|
$ |
73,035 |
|
$ |
145,843 |
|
$ |
122,943 |
|
Cement |
|
|
78,893 |
|
|
69,968 |
|
|
118,328 |
|
|
98,504 |
|
Ready-mix concrete |
|
|
128,713 |
|
|
97,300 |
|
|
221,890 |
|
|
177,466 |
|
Asphalt |
|
|
83,480 |
|
|
75,978 |
|
|
103,017 |
|
|
88,634 |
|
Paving and related services |
|
|
97,708 |
|
|
78,486 |
|
|
134,004 |
|
|
105,634 |
|
Other |
|
|
51,078 |
|
|
50,507 |
|
|
85,288 |
|
|
80,472 |
|
Total revenue |
|
$ |
524,093 |
|
$ |
445,274 |
|
$ |
808,370 |
|
$ |
673,653 |
*Revenue from the liquid asphalt terminals is included in asphalt revenue.
|
|
|
Three months ended |
|
Six months ended |
||||||||
|
|
|
July 1, |
|
July 2, |
|
July 1, |
|
July 2, |
||||
|
|
|
2017 |
|
2016 |
|
2017 |
|
2016 |
||||
|
Adjusted EBITDA: |
|
|
|
|
|
|
|
|
|
|
|
|
|
West |
|
$ |
60,520 |
|
$ |
50,585 |
|
$ |
76,219 |
|
$ |
63,864 |
|
East |
|
|
38,766 |
|
|
35,674 |
|
|
43,114 |
|
|
38,847 |
|
Cement |
|
|
43,783 |
|
|
37,593 |
|
|
46,468 |
|
|
38,564 |
|
Corporate and other |
|
|
(7,834) |
|
|
(9,120) |
|
|
(16,936) |
|
|
(18,134) |
|
Total Adjusted EBITDA |
|
|
135,235 |
|
|
114,732 |
|
|
148,865 |
|
|
123,141 |
|
Interest expense |
|
|
25,986 |
|
|
25,617 |
|
|
50,955 |
|
|
47,194 |
|
Depreciation, depletion and amortization |
|
|
44,587 |
|
|
37,038 |
|
|
83,891 |
|
|
68,938 |
|
Accretion |
|
|
452 |
|
|
370 |
|
|
896 |
|
|
830 |
|
IPO/ Legacy equity modification costs |
|
|
— |
|
|
24,751 |
|
|
— |
|
|
24,751 |
|
Loss on debt financings |
|
|
— |
|
|
— |
|
|
190 |
|
|
— |
|
Tax receivable agreement expense |
|
|
1,525 |
|
|
— |
|
|
1,525 |
|
|
— |
|
Transaction costs |
|
|
2,620 |
|
|
290 |
|
|
3,893 |
|
|
3,606 |
|
Non-cash compensation |
|
|
4,676 |
|
|
3,029 |
|
|
9,424 |
|
|
5,065 |
|
Other |
|
|
(134) |
|
|
3,188 |
|
|
(146) |
|
|
3,008 |
|
Income (loss) from continuing operations before taxes |
|
$ |
55,523 |
|
$ |
20,449 |
|
$ |
(1,763) |
|
$ |
(30,251) |
20
|
|
|
Six months ended |
||||
|
|
|
July 1, |
|
July 2, |
||
|
|
|
2017 |
|
2016 |
||
|
Purchases of property, plant and equipment |
|
|
|
|
|
|
|
West |
|
$ |
51,378 |
|
$ |
49,645 |
|
East |
|
|
37,566 |
|
|
26,874 |
|
Cement |
|
|
17,606 |
|
|
12,828 |
|
Total reportable segments |
|
|
106,550 |
|
|
89,347 |
|
Corporate and other |
|
|
2,538 |
|
|
2,322 |
|
Total purchases of property, plant and equipment |
|
$ |
109,088 |
|
$ |
91,669 |
|
|
|
Three months ended |
|
Six months ended |
||||||||
|
|
|
July 1, |
|
July 2, |
|
July 1, |
|
July 2, |
||||
|
|
|
2017 |
|
2016 |
|
2017 |
|
2016 |
||||
|
Depreciation, depletion, amortization and accretion: |
|
|
|
|
|
|
|
|
|
|
|
|
|
West |
|
$ |
17,419 |
|
$ |
16,186 |
|
$ |
33,082 |
|
$ |
32,222 |
|
East |
|
|
16,933 |
|
|
12,310 |
|
|
32,311 |
|
|
22,741 |
|
Cement |
|
|
10,025 |
|
|
8,269 |
|
|
18,073 |
|
|
13,528 |
|
Total reportable segments |
|
|
44,377 |
|
|
36,765 |
|
|
83,466 |
|
|
68,491 |
|
Corporate and other |
|
|
662 |
|
|
643 |
|
|
1,321 |
|
|
1,277 |
|
Total depreciation, depletion, amortization and accretion |
|
$ |
45,039 |
|
$ |
37,408 |
|
$ |
84,787 |
|
$ |
69,768 |
|
|
|
July 1, |
|
December 31, |
||
|
|
|
2017 |
|
2016 |
||
|
Total assets: |
|
|
|
|
|
|
|
West |
|
$ |
1,132,152 |
|
$ |
902,763 |
|
East |
|
|
998,002 |
|
|
870,613 |
|
Cement |
|
|
889,365 |
|
|
868,440 |
|
Total reportable segments |
|
|
3,019,519 |
|
|
2,641,816 |
|
Corporate and other |
|
|
345,649 |
|
|
139,650 |
|
Total |
|
$ |
3,365,168 |
|
$ |
2,781,466 |
14. RELATED PARTY TRANSACTIONS
Blackstone Advisory Partners L.P., an affiliate of Blackstone Management Partners L.L.C., served as an initial purchaser of $18.8 million of the 2022 Notes issued in March 2016, and received compensation in connection therewith.
21
SUMMIT MATERIALS, LLC
UNAUDITED CONSOLIDATED FINANCIAL STATEMENTS
The unaudited consolidated financial statements and notes thereto for Summit Materials, LLC and subsidiaries are included as Exhibit 99.1 to this Quarterly Report on Form 10-Q and are incorporated by reference herein.
22
ITEM 2. MANAGEMENT’S DISCUSSION AND ANALYSIS OF FINANCIAL CONDITION AND RESULTS OF OPERATIONS
This Management’s Discussion and Analysis of Financial Condition and Results of Operations is intended to assist in understanding and assessing the trends and significant changes in our results of operations and financial condition. Historical results may not be indicative of future performance. Forward-looking statements reflect our current views about future events, are based on assumptions and are subject to known and unknown risks and uncertainties that could cause actual results to differ materially from those contemplated by these statements. Factors that may cause differences between actual results and those contemplated by forward-looking statements include, but are not limited to, those discussed in the section entitled “Risk Factors” in the Annual Report and any factors discussed in the sections entitled “Cautionary Note Regarding Forward-Looking Statements” and “Risk Factors” of this report. This Management’s Discussion and Analysis of Financial Condition and Results of Operations should be read in conjunction with our consolidated interim financial statements and the related notes and other information included in this report.
Overview
We are one of the fastest growing construction materials companies in the United States. Our materials include aggregates, which we supply across the United States, and in British Columbia, Canada, and cement, which we supply along the Mississippi River from Minneapolis to New Orleans. Within our markets, we offer customers a single-source provider for construction materials and related downstream products through our vertical integration. In addition to supplying aggregates to customers, we use a portion of our materials internally to produce ready-mix concrete and asphalt paving mix, which may be sold externally or used in our paving and related services businesses. Our vertically-integrated business model creates opportunities to increase aggregates sales, optimize margin at each stage of production and provide customers with efficiency gains, convenience and reliability, which we believe provides us a competitive advantage in the markets we serve.
We have completed 57 acquisitions, which are organized into 12 operating companies that make up our three distinct operating segments—West, East and Cement—spanning 20 U.S. states and British Columbia, Canada and 42 metropolitan statistical areas. Our highly experienced management team, led by our President and Chief Executive Officer, Thomas Hill, a 35-year industry veteran, has successfully enhanced the operations of acquired companies by focusing on scale advantages, cost efficiencies and price optimization to improve profitability and cash flow.
As of July 1, 2017, we had 3.0 billion tons of proven and probable aggregates reserves serving our aggregates and cement businesses and operated over 300 sites and plants, to which we believe we have adequate road, barge and/or railroad access.
23
We operate in 21 U.S. states and British Columbia, Canada and currently have assets in 20 U.S. states and in British Columbia, Canada. We have three operating segments: West, East and Cement, which are also our reporting segments. The map below illustrates our geographic footprint:
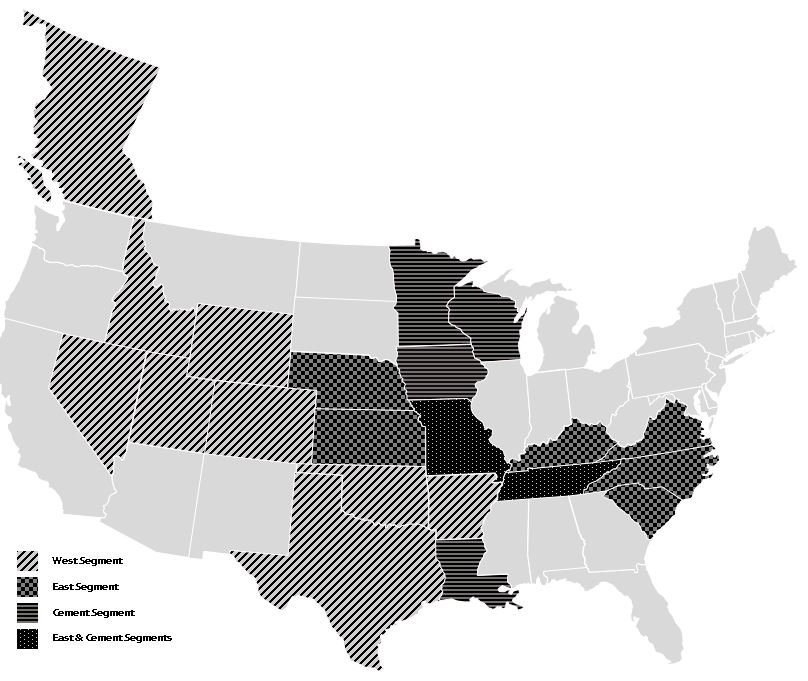
Business Trends and Conditions
The U.S. construction materials industry is composed of four primary sectors: aggregates; cement; ready-mix concrete; and asphalt paving mix. Each of these materials is widely used in most forms of construction activity. Participants in these sectors typically range from small, privately-held companies focused on a single material, product or market to multinational corporations that offer a wide array of construction materials and services. Competition is constrained in part by the distance materials can be transported efficiently, resulting in predominantly local or regional operations. Due to the lack of product differentiation, competition for all of our products is predominantly based on price and, to a lesser extent, quality of products and service. As a result, the prices we charge our customers are not likely to be materially different from the prices charged by other producers in the same markets. Accordingly, our profitability is generally dependent on the level of demand for our products in the local and regional markets and our ability to control operating costs.
Our revenue is derived from multiple end-use markets including public infrastructure construction and private residential and nonresidential construction. Public infrastructure includes spending by federal, state, provincial and local governments for roads, highways, bridges, airports and other infrastructure projects. Public infrastructure projects have historically been a relatively stable portion of state and federal budgets. Residential and nonresidential construction
24
consists of new construction and repair and remodel markets. Any economic stagnation or decline, which could vary by local region and market, could affect our results of operations. Our sales and earnings are sensitive to national, regional and local economic conditions and particularly to cyclical changes in construction spending, especially in the private sector. From a macroeconomic view, we see positive indicators for the construction sector, including upward trends in highway obligations, housing starts and construction employment. All of these factors should result in increased construction activity in the private sector. However, construction activity is not consistent across the United States. Certain of our markets are showing greater, more rapid signs of recovery.
Transportation infrastructure projects, driven by both federal and state funding programs, represent a significant share of the U.S. construction materials market. Federal funds are allocated to the states, which are required to match a portion of the federal funds they receive. Federal highway spending uses funds predominantly from the Federal Highway Trust Fund, which derives its revenue from taxes on diesel fuel, gasoline and other user fees. The dependability of federal funding allows the state departments of transportation to plan for their long term highway construction and maintenance needs. Funding for the existing federal transportation program extends through 2020. With the nation’s infrastructure aging, there is increased demand by states and municipalities for long-term federal funding to support both the construction of new roads, highways and bridges in addition to the maintaining the existing infrastructure. The U.S. President and his administration have called for, among other things, an infrastructure stimulus plan. However, there is currently a lack of clarity around both the timing and details of any such infrastructure plan and the impact, if any, it or other proposed changes in law and regulations may have on our business.
In addition to federal funding, state, county and local agencies provide highway construction and maintenance funding. Each of our four largest states by revenue (Texas, Kansas, Utah and Missouri, which represented approximately 25%, 14%, 12% and 12%, respectively, of our total revenue in 2016) have funds whose revenue sources have certain constitutional protections that limit spending to transportation projects:
|
· |
Texas’ Unified Transportation Program plans for $70 billon to fund transportation projects from 2017 – 2026. |
|
o |
In November 2014, Texas voters approved a ballot measure known as Proposition 1, which authorized a portion of the severance taxes on oil and natural gas to be redirected to the State Highway Fund each year. |
|
o |
In November 2015, voters approved the ballot measure known as Proposition 7, authorizing a constitutional amendment for transportation funding. The amendment dedicates a portion of the state’s general sales and use taxes and motor vehicle sales and rental taxes to the State Highway Fund for use on non-tolled projects. Beginning in September 2017 (fiscal year 2018), if general state sales and use tax revenue exceeds $28 billion in a fiscal year, the next $2.5 billion will be directed to the State Highway Fund. Additionally, beginning in September 2019 (fiscal year 2020), if state motor vehicle sales and rental tax revenue exceeds $5 billion in a fiscal year, 35% of the amount above $5 billion will be directed to the State Highway Fund. |
|
· |
Kansas has a 10‑year $8.2 billion highway bill that was passed in May 2010. In June 2017, a bi-partisan coalition of Kansas legislators voted to raise $1.2 billion in revenue by raising personal income taxes and other exemptions, reversing austerity measures put into place five years ago by the Kansas governor. We anticipate additional funding will be made available to the Kansas Department of Transportation over the next 12-24 months as a result of this legislative action. |
|
· |
Utah’s transportation investment fund has $2.3 billion programmed for 2017 – 2022. In early 2017, Utah’s governor signed into law a measure to allow the state to issue up to $1 billion in highway general obligation bonds to accelerate funding for a number of projects that the Utah Transportation Commission has already approved. |
|
· |
Missouri’s Statewide Transportation Improved Program for 2017 – 2021 states that $4.0 billion is available for awards for highway and bridge construction. |
Use and consumption of our products fluctuate due to seasonality. Nearly all of the products used by us, and by our customers, in the private construction and public infrastructure industries are used outdoors. Our highway operations and production and distribution facilities are also located outdoors. Therefore, seasonal changes and other weather-
25
related conditions, in particular extended rainy and cold weather in the spring and fall and major weather events, such as hurricanes, tornadoes, tropical storms and heavy snows, can adversely affect our business and operations through a decline in both the use of our products and demand for our services. In addition, construction materials production and shipment levels follow activity in the construction industry, which typically occurs in the spring, summer and fall. Warmer and drier weather during the second and third quarters of our fiscal year typically result in higher activity and revenue levels during those quarters.
We are subject to commodity price risk with respect to price changes in liquid asphalt and energy, including fossil fuels and electricity for aggregates, cement, ready-mix concrete and asphalt paving mix production, natural gas for hot mix asphalt production and diesel fuel for distribution vehicles and production related mobile equipment. Liquid asphalt escalator provisions in most of our private and commercial contracts limit our exposure to price fluctuations in this commodity. We often obtain similar escalators on public infrastructure contracts. In addition, we enter into various firm purchase commitments, with terms generally less than one year, for certain raw materials.
Backlog
Our products are generally delivered upon receipt of orders or requests from customers, or shortly thereafter. Accordingly, the backlog associated with product sales is converted into revenue within a relatively short period of time. Inventory for products is generally maintained in sufficient quantities to meet rapid delivery requirements of customers. Therefore, a period over period increase or decrease of backlog does not necessarily result in an improvement or a deterioration of our business. Our backlog includes only those products and projects for which we have obtained a purchase order or a signed contract with the customer and does not include products purchased and sold or services awarded and provided within the period. Subject to applicable contract terms, substantially all contracts in our backlog may be cancelled or modified by our customers. Historically, we have not been materially adversely affected by contract cancellations or modifications.
As a vertically-integrated business, approximately 23% of aggregates sold were used internally in our ready-mix concrete and asphalt paving mixes and approximately 67% of the asphalt paving mix were laid by our paving crews during the six months ended July 1, 2017. Our backlog as of July 1, 2017, was 15.9 million tons of aggregates, 1.2 million cubic yards of ready-mix concrete, 3.2 million tons of asphalt and $473.6 million of construction services, which includes the value of the aggregate and asphalt tons and ready-mix concrete cubic yards that are expected to be sourced internally.
Financial Highlights
The principal factors in evaluating our financial condition and operating results for the three and six months ended July 1, 2017 as compared to July 2, 2016, are:
|
· |
Net revenue increased $65.7 million and $116.7 million in the three and six months ended July 1, 2017, respectively, as a result of pricing and volume increases across our product lines, which includes volume contributions from our acquisitions. |
|
· |
Our operating income increased $35.5 and $32.2 million in the three and six months ended July 1, 2017, respectively, primarily due to increases in net revenue from acquisitions, and to a lesser extent organic growth, partially offset by increases in the related costs of revenue. Our general and administrative expenses also decreased in the second quarter of 2017 as compared to the same period in 2016, as the second quarter of 2016 includes $24.8 million of pre-IPO/legacy equity modification expenses. Our general and administrative expenses for the six month period ended July 1, 2017 are slightly lower than the comparable period a year ago. Excluding the $24.8 million of pre-IPO/legacy equity modification expenses in the six month period July 2, 2016, our general and administrative expenses are essentially flat as a percentage of net revenue. |
|
· |
In June 2017, we issued $300.0 million of 5.125% senior notes due June 1, 2025 (the “2025 Notes”), resulting in proceeds of $295.4 million, net of related fees and expenses. |
|
· |
In January 2017, we raised $237.6 million, net of underwriting discounts, through the issuance of 10,000,000 shares of Class A common stock at a public offering price of $24.05 per share. |
26
Acquisitions
In addition to our organic growth, we continued to grow our business through acquisitions, completing the following transactions in 2017 and 2016:
|
· |
On August 1, 2017, we acquired Northwest, a ready-mix and aggregates-based business with three ready-mix plants and one sand and gravel pit, servicing the northwest region of Colorado. |
|
· |
On July 31, 2017, we acquired Great Southern, a ready-mix company with two plants servicing Houston, Texas. |
|
· |
On July 28, 2017, we acquired Somerset, a ready-mix company with ten plants in southeast Kentucky. |
|
· |
On May 12, 2017, we acquired Glasscock, a vertically integrated sand, ready-mix, recycle and trucking business based in Sumter, South Carolina. |
|
· |
On May 1, 2017, we acquired Winvan Paving, a paving and construction services company based in Vancouver, British Columbia. |
|
· |
On April 3, 2017, we acquired Carolina Sand, a sand and trucking business with four sand pits in northeastern South Carolina. |
|
· |
On April 3, 2017, we acquired Hanna’s Bend, an aggregates-based business with one sand and gravel pit servicing the Houston, Texas market. |
|
· |
On March 17, 2017, we acquired Sandidge Concrete, a ready-mix company with three plants servicing the Columbia, Missouri market. |
|
· |
On February 24, 2017, we acquired Razorback, an aggregates-based business with one of the larger ready-mix concrete operations in central and northeastern Arkansas. |
|
· |
On January 30, 2017, we acquired Everist Materials, a vertically integrated aggregates, ready-mix concrete, and paving business based in Silverthorne, Colorado, with two aggregates plants, five ready-mix plants and two asphalt plants. |
|
· |
On October 3, 2016, we acquired Midland Concrete, a ready-mix company with one plant servicing the Midland, Texas market. |
|
· |
On August 30, 2016, we acquired the Angelle Assets, including two Mississippi River cement distribution terminals in Southern Louisiana. |
|
· |
On August 26, 2016, we acquired RD Johnson, a large excavating business and asphalt operation based in Lawrence, Kansas. |
|
· |
On August 19, 2016, we acquired Rustin, a ready-mix company with 12 ready-mix plants servicing the southeast Oklahoma market. |
|
· |
On August 8, 2016, we acquired the assets of Weldon and the membership interests of Honey Creek Disposal Service, LLC. (‘‘Honey Creek’’). Honey Creek is a trash collection business, which we sold immediately after acquisition. We retained the building from Weldon, where our recycling business in Kansas is operated. |
|
· |
On May 20, 2016, we acquired the Oldcastle Assets, seven aggregates quarries in central and northwest Missouri. |
27
|
· |
On April 29, 2016, we acquired Sierra, a vertically integrated aggregates and ready-mix concrete business with one sand and gravel pit and two ready-mix concrete plants located in Las Vegas, Nevada. |
|
· |
On March 18, 2016, we acquired Boxley, a vertically integrated company based in Roanoke, Virginia with six quarries, four ready-mix concrete plants and four asphalt plants. |
|
· |
On February 5, 2016, we acquired AMC, an aggregates company with five sand and gravel pits servicing coastal North and South Carolina. |
Results of Operations
The following discussion of our results of operations is focused on the key financial measures we use to evaluate the performance of our business from both a consolidated and operating segment perspective. Operating income and margins are discussed in terms of changes in volume, pricing and mix of revenue source (i.e., type of product sales or service revenue). We focus on operating margin, which we define as operating income as a percentage of net revenue, as a key metric when assessing the performance of the business, as we believe that analyzing changes in costs in relation to changes in revenue provides more meaningful insight into the results of operations than examining costs in isolation.
Operating income (loss) reflects our profit from continuing operations after taking into consideration cost of revenue, general and administrative expenses, depreciation, depletion, amortization and accretion and transaction costs. Cost of revenue generally increases ratably with revenue, as labor, transportation costs and subcontractor costs are recorded in cost of revenue. General and administrative expenses as a percentage of revenue vary throughout the year due to the seasonality of our business. As a result of our revenue growth occurring primarily through acquisitions, general and administrative expenses and depreciation, depletion, amortization and accretion have historically grown ratably with revenue. However, as volumes increase, we expect these costs, as a percentage of revenue, to decrease. Our transaction costs fluctuate with the number and size of acquisitions completed each year.
The table below includes revenue and operating income (loss) by segment for the three and six months ended July 1, 2017 and July 2, 2016.
|
|
|
Three months ended |
|
Six months ended |
||||||||||||||||||||
|
|
|
July 1, 2017 |
|
July 2, 2016 |
|
July 1, 2017 |
|
July 2, 2016 |
||||||||||||||||
|
|
|
|
|
Operating |
|
|
|
Operating |
|
|
|
Operating |
|
|
|
Operating |
||||||||
|
($ in thousands) |
|
Revenue |
|
income (loss) |
|
Revenue |
|
income (loss) |
|
Revenue |
|
income (loss) |
|
Revenue |
|
income (loss) |
||||||||
|
West |
|
$ |
275,855 |
|
$ |
42,907 |
|
$ |
226,277 |
|
$ |
34,181 |
|
$ |
419,074 |
|
$ |
42,620 |
|
$ |
349,994 |
|
$ |
31,348 |
|
East |
|
|
164,009 |
|
|
21,130 |
|
|
139,380 |
|
|
22,401 |
|
|
261,232 |
|
|
9,612 |
|
|
210,054 |
|
|
14,832 |
|
Cement |
|
|
84,229 |
|
|
33,725 |
|
|
79,617 |
|
|
28,553 |
|
|
128,064 |
|
|
28,455 |
|
|
113,605 |
|
|
24,314 |
|
Corporate (1) |
|
|
— |
|
|
(15,318) |
|
|
— |
|
|
(38,187) |
|
|
— |
|
|
(31,027) |
|
|
— |
|
|
(53,003) |
|
Total |
|
$ |
524,093 |
|
$ |
82,444 |
|
$ |
445,274 |
|
$ |
46,948 |
|
$ |
808,370 |
|
$ |
49,660 |
|
$ |
673,653 |
|
$ |
17,491 |
|
(1) |
Corporate results primarily consist of compensation and office expenses for employees included in the Company's headquarters. |
28
Consolidated Results of Operations
The table below sets forth our consolidated results of operations for the three and six months ended July 1, 2017 and July 2, 2016.
|
|
|
Three months ended |
|
Six months ended |
||||||||
|
|
|
July 1, |
|
July 2, |
|
July 1, |
|
July 2, |
||||
|
|
|
2017 |
|
2016 |
|
2017 |
|
2016 |
||||
|
(in thousands) |
|
|
|
|
|
|
|
|
|
|
|
|
|
Net revenue |
|
$ |
478,368 |
|
$ |
412,636 |
|
$ |
737,412 |
|
$ |
620,675 |
|
Delivery and subcontract revenue |
|
|
45,725 |
|
|
32,638 |
|
|
70,958 |
|
|
52,978 |
|
Total revenue |
|
|
524,093 |
|
|
445,274 |
|
|
808,370 |
|
|
673,653 |
|
Cost of revenue (excluding items shown separately below) |
|
|
335,904 |
|
|
285,138 |
|
|
553,476 |
|
|
461,928 |
|
General and administrative expenses |
|
|
58,086 |
|
|
75,490 |
|
|
116,554 |
|
|
120,860 |
|
Depreciation, depletion, amortization and accretion |
|
|
45,039 |
|
|
37,408 |
|
|
84,787 |
|
|
69,768 |
|
Transaction costs |
|
|
2,620 |
|
|
290 |
|
|
3,893 |
|
|
3,606 |
|
Operating income |
|
|
82,444 |
|
|
46,948 |
|
|
49,660 |
|
|
17,491 |
|
Interest expense (1) |
|
|
25,986 |
|
|
25,617 |
|
|
50,955 |
|
|
47,194 |
|
Loss on debt financings |
|
|
— |
|
|
— |
|
|
190 |
|
|
— |
|
Tax receivable agreement expense (1) |
|
|
1,525 |
|
|
— |
|
|
1,525 |
|
|
— |
|
Other (income) expense, net |
|
|
(590) |
|
|
882 |
|
|
(1,247) |
|
|
548 |
|
Income (loss) from operations before taxes (1) |
|
|
55,523 |
|
|
20,449 |
|
|
(1,763) |
|
|
(30,251) |
|
Income tax expense (benefit) |
|
|
3,435 |
|
|
(1,056) |
|
|
1,257 |
|
|
(9,222) |
|
Net income (loss) (1) |
|
$ |
52,088 |
|
$ |
21,505 |
|
$ |
(3,020) |
|
$ |
(21,029) |
|
(1) |
The statement of operations above is based on the financial results of Summit Inc. and its subsidiaries. The statement of operations of Summit LLC and its subsidiaries differs from Summit Inc. in that Summit LLC has $0.2 million and $0.5 million less interest expense than Summit Inc., in the three and six months ended July 1, 2017, respectively. The additional interest expense for Summit Inc. is associated with a deferred consideration obligation of Summit Holdings, which is excluded from Summit LLC’s consolidated interest expense. |
Three and six months ended July 1, 2017 compared to the three and six months ended July 2, 2016
|
|
|
|
|
|
|
|
|
|
|
|
|
|
|
|
|
|
|
|
|
|
|
|
|
|
|
|
|
Three months ended |
|
|
|
|
|
|
|
Six months ended |
|
|
|
|
|
|
||||||||
|
|
|
July 1, |
|
July 2, |
|
|
|
|
|
|
|
July 1, |
|
July 2, |
|
|
|
|
|
|
||||
|
($ in thousands) |
|
2017 |
|
2016 |
|
Variance |
|
|
2017 |
|
2016 |
|
Variance |
|
||||||||||
|
Net revenue |
|
$ |
478,368 |
|
$ |
412,636 |
|
$ |
65,732 |
|
15.9 |
% |
|
$ |
737,412 |
|
$ |
620,675 |
|
$ |
116,737 |
|
18.8 |
% |
|
Operating income |
|
|
82,444 |
|
|
46,948 |
|
|
35,496 |
|
75.6 |
% |
|
|
49,660 |
|
|
17,491 |
|
|
32,169 |
|
183.9 |
% |
|
Operating margin percentage |
|
|
17.2 |
% |
|
11.4 |
% |
|
|
|
|
|
|
|
6.7 |
% |
|
2.8 |
% |
|
|
|
|
|
|
Adjusted EBITDA (1) |
|
$ |
135,235 |
|
$ |
114,732 |
|
$ |
20,503 |
|
17.9 |
% |
|
$ |
148,865 |
|
$ |
123,141 |
|
$ |
25,724 |
|
20.9 |
% |
|
(1) |
Adjusted EBITDA is a non-GAAP measure that we find helpful in monitoring the performance of our business. See the reconciliation of Adjusted EBITDA to net income below. |
Net revenue increased $65.7 million in the three months ended July 1, 2017, primarily resulting from our acquisition program. Of the increase in net revenue, $20.1 million was from increased sales of materials, $36.3 million was from increased sales of products and $9.3 million was from increased service revenue. We generated organic volume growth across all lines of business during the second quarter of 2017 over the prior year period. We also had organic price growth in our cement and ready-mix concrete lines of business during the second quarter of 2017. Additional discussion about the impact of acquisitions on each segment is presented in more detail below.
Net revenue increased $116.7 million in the six months ended July 1, 2017, primarily resulting from our acquisition program. Of the increase in net revenue, $42.7 million was from increased sales of materials, $58.6 million was from increased sales of products and $15.4 million was from increased service revenue. We generated organic volume growth in our aggregates, cement and asphalt lines of business during the first half of 2017 over the prior year
29
period. We also had organic price growth in our cement line of business during the first half of 2017. Additional discussion about the impact of acquisitions on each segment is presented in more detail below.
In the three months ended July 1, 2017, our net revenue growth was $49.9 million and $15.8 million from acquisitions and organic revenue, respectively. Operating income increased by $35.5 million in the second quarter of 2017 as compared to the second quarter of 2016 as a result of a decrease in our general administrative expenses, partially offset by an increase in our depreciation, depletion, amortization and accretion. Our general and administrative expenses decreased in the second quarter of 2017 as compared to the same period a year ago, as the second quarter of 2016 included $24.8 million of pre-IPO/legacy equity modification expenses, partially offset by increases in headcount and stock compensation expenses in 2017. Our depreciation, depletion, amortization and accretion increased $5.1 million due to acquisitions completed in 2016 and 2017.
In the six months ended July 1, 2017, our net revenue growth was $91.2 million and $25.5 million from acquisitions and organic revenue, respectively. Operating income increased by $32.2 million in the first half of 2017 as compared to the first half of 2016 as a result of a decrease in our general administrative expenses items referred to above, as well as an increase in our depreciation, depletion, amortization and accretion. Our depreciation, depletion, amortization and accretion increased $11.4 million due to acquisitions completed in 2016 and 2017.
Our operating margin percentage improved 580 basis points from 11.4% to 17.2% and 390 basis points from 2.8% to 6.7% in the three and six months ended July 1, 2017, respectively, due to pricing on materials and cement volume growth. Adjusted EBITDA, as defined below, increased by $20.5 million and $25.7 million in the three and six months ended July 1, 2017, respectively.
During 2016 and 2017, certain limited partners of Summit Holdings exchanged their LP Units for shares of Class A common stock of Summit Inc. The following table summarizes the changes in our ownership of Summit Holdings:
|
|
|
Summit Inc. Shares (Class A) |
|
LP Units |
|
Total |
|
Summit Inc. Ownership Percentage |
|
|
Balance — December 31, 2016 |
|
96,033,222 |
|
5,151,297 |
|
101,184,519 |
|
94.9 |
% |
|
January 2017 public offering |
|
10,000,000 |
|
- |
|
10,000,000 |
|
|
|
|
Exchanges during period |
|
236,095 |
|
(236,095) |
|
- |
|
|
|
|
Other equity transactions |
|
134,423 |
|
- |
|
134,423 |
|
|
|
|
Balance — April 1, 2017 |
|
106,403,740 |
|
4,915,202 |
|
111,318,942 |
|
95.6 |
% |
|
Exchanges during period |
|
778,064 |
|
(778,064) |
|
- |
|
|
|
|
Other equity transactions |
|
310,175 |
|
- |
|
310,175 |
|
|
|
|
Balance — July 1, 2017 |
|
107,491,979 |
|
4,137,138 |
|
111,629,117 |
|
96.3 |
% |
|
|
|
|
|
|
|
|
|
|
|
|
|
|
|
|
|
|
|
|
|
|
|
Balance — January 2, 2016 |
|
49,745,944 |
|
50,275,825 |
|
100,021,769 |
|
49.7 |
% |
|
Issuance of Class A shares |
|
1,038 |
|
- |
|
1,038 |
|
|
|
|
Stock Dividend - December 28, 2016 |
|
1,135,692 |
|
- |
|
1,135,692 |
|
|
|
|
Balance — April 2, 2016 |
|
50,882,674 |
|
50,275,825 |
|
101,158,499 |
|
50.3 |
% |
|
Exchanges during period |
|
13,177,754 |
|
(13,177,754) |
|
- |
|
|
|
|
Other equity transactions |
|
6,250 |
|
- |
|
6,250 |
|
|
|
|
Balance — July 2, 2016 |
|
64,066,678 |
|
37,098,071 |
|
101,164,749 |
|
63.3 |
% |
As a result, the ownership percentage of the noncontrolling interest decreased from 36.7% as of July 2, 2016 to 3.7% as of July 1, 2017. Accordingly, although the amount of net income increased by $30.6 million and net loss decreased by $18.0 million in the three and six months ended July 1, 2017, respectively, the amount of net income (loss) attributable to Summit Holdings decreased from $8.1 million and $(13.2) million in the three and six months July 2, 2016, respectively, to $2.1 million and $(0.5) million in the three and six months ended July 1, 2017.
30
As a vertically-integrated company, we include intercompany sales from materials to products and from products to services when assessing the operating results of our business. We refer to revenue inclusive of intercompany sales as gross revenue. These intercompany transactions are eliminated in the consolidated financial statements. Gross revenue by line of business was as follows:
|
|
|
Three months ended |
|
|
|
|
|
|
|
Six months ended |
|
|
|
|
|
|
||||||||
|
|
|
July 1, |
|
July 2, |
|
Variance |
|
July 1, |
|
July 2, |
|
Variance |
||||||||||||
|
($ in thousands) |
|
2017 |
|
2016 |
|
|
Dollar |
|
Percentage |
|
|
2017 |
|
2016 |
|
|
Dollar |
|
Percentage |
|
||||
|
Revenue by product*: |
|
|
|
|
|
|
|
|
|
|
|
|
|
|
|
|
|
|
|
|
|
|
|
|
|
Aggregates |
|
$ |
112,520 |
|
$ |
97,006 |
|
$ |
15,514 |
|
16.0 |
% |
|
$ |
190,890 |
|
$ |
162,063 |
|
$ |
28,827 |
|
17.8 |
% |
|
Cement |
|
|
79,985 |
|
|
71,711 |
|
|
8,274 |
|
11.5 |
% |
|
|
120,289 |
|
|
101,222 |
|
|
19,067 |
|
18.8 |
% |
|
Ready-mix concrete |
|
|
128,942 |
|
|
97,371 |
|
|
31,571 |
|
32.4 |
% |
|
|
222,300 |
|
|
177,608 |
|
|
44,692 |
|
25.2 |
% |
|
Asphalt |
|
|
91,191 |
|
|
82,120 |
|
|
9,071 |
|
11.0 |
% |
|
|
112,470 |
|
|
96,477 |
|
|
15,993 |
|
16.6 |
% |
|
Paving and related services |
|
|
160,092 |
|
|
143,397 |
|
|
16,695 |
|
11.6 |
% |
|
|
210,368 |
|
|
179,065 |
|
|
31,303 |
|
17.5 |
% |
|
Other |
|
|
(48,637) |
|
|
(46,331) |
|
|
(2,306) |
|
5.0 |
% |
|
|
(47,947) |
|
|
(42,782) |
|
|
(5,165) |
|
12.1 |
% |
|
Total revenue |
|
$ |
524,093 |
|
$ |
445,274 |
|
$ |
78,819 |
|
17.7 |
% |
|
$ |
808,370 |
|
$ |
673,653 |
|
$ |
134,717 |
|
20.0 |
% |
*Revenue by product includes intercompany and intracompany sales transferred at market value. The elimination of intracompany transactions is included in Other. Revenue from the liquid asphalt terminals is included in asphalt revenue.
Detail of our volumes and average selling prices by product in the three and six months ended July 1, 2017 and July 2, 2016 were as follows:
|
|
|
Three months ended |
|
|
|
|
|
||||||||
|
|
|
July 1, 2017 |
|
July 2, 2016 |
|
|
|
|
|
||||||
|
|
|
Volume(1) |
|
|
|
Volume(1) |
|
|
|
Percentage Change in |
|
||||
|
|
|
(in thousands) |
|
Pricing(2) |
|
(in thousands) |
|
Pricing(2) |
|
Volume |
|
Pricing |
|
||
|
Aggregates |
|
11,286 |
|
$ |
9.97 |
|
9,683 |
|
$ |
10.02 |
|
16.6 |
% |
(0.5) |
% |
|
Cement |
|
714 |
|
|
112.09 |
|
659 |
|
|
108.89 |
|
8.3 |
% |
2.9 |
% |
|
Ready-mix concrete |
|
1,237 |
|
|
104.23 |
|
953 |
|
|
102.15 |
|
29.8 |
% |
2.0 |
% |
|
Asphalt |
|
1,517 |
|
|
54.94 |
|
1,316 |
|
|
57.45 |
|
15.3 |
% |
(4.4) |
% |
|
|
|
|
|
|
|
|
|
|
|
|
|
|
|
|
|
|
|
|
Six months ended |
|
|
|
|
|
||||||||
|
|
|
July 1, 2017 |
|
July 2, 2016 |
|
|
|
|
|
||||||
|
|
|
Volume(1) |
|
|
|
Volume(1) |
|
|
|
Percentage Change in |
|
||||
|
|
|
(in thousands) |
|
Pricing(2) |
|
(in thousands) |
|
Pricing(2) |
|
Volume |
|
Pricing |
|
||
|
Aggregates |
|
19,249 |
|
$ |
9.92 |
|
16,645 |
|
$ |
9.74 |
|
15.6 |
% |
1.8 |
% |
|
Cement |
|
1,075 |
|
|
111.89 |
|
943 |
|
|
107.38 |
|
14.0 |
% |
4.2 |
% |
|
Ready-mix concrete |
|
2,143 |
|
|
103.73 |
|
1,715 |
|
|
103.56 |
|
25.0 |
% |
0.2 |
% |
|
Asphalt |
|
1,880 |
|
|
54.76 |
|
1,533 |
|
|
57.57 |
|
22.6 |
% |
(4.9) |
% |
|
(1) |
Volumes are shown in tons for aggregates, cement and asphalt and in cubic yards for ready-mix concrete. |
|
(2) |
Pricing is shown on a per ton basis for aggregates, cement and asphalt and on a per cubic yard basis for ready-mix concrete. |
Revenue from aggregates increased $15.5 million and $28.8 million in the three and six months ended July 1, 2017, respectively, primarily due to increased volumes. Aggregate volumes were positively affected by the acquisitions completed in 2016 and early 2017, together with broad based growth in most of our markets, partially offset by declines in our Missouri and Houston markets. Organic aggregate volumes increased 3.8% in the first half of 2017 as compared to the same period a year ago primarily from Austin, northeast Texas and Utah, offset by a decline in Houston, Texas. In Houston, Texas, volumes were affected by softness in the residential construction market. Aggregate pricing of $9.92 per ton slightly increased compared to the first half of 2016.
31
Revenue from cement increased $8.3 million and $19.1 million in the three and six months ended July 1, 2017, respectively, due primarily to improved organic volume and improved average selling price. Our organic cement volumes increased 10.2% due to improved weather along the Mississippi river corridor and new customer acquisitions. During the first half of 2017, pricing for cement improved by 4.2% to $111.89 per ton, primarily resulting from the price increases implemented in 2016.
Revenue from ready-mix concrete increased $31.6 million and $44.7 million in the three and six months ended July 1, 2017, respectively, primarily from the acquisitions referred to above. Ready-mix concrete pricing of $103.73 per cubic yard ton in 2017 remained consistent to the first half of 2016.
Revenue from asphalt increased $9.1 million and $16.0 million in the three and six months ended July 1, 2017, respectively. Our organic asphalt volumes increased 12.3% with the balance of the increased volumes coming from acquisitions. Our revenue in Austin, Texas, was higher in the first half of 2017 as an aggressive competitor contributed to the decrease in our paving and related services revenue in 2016. In the first half of 2017, our marketing efforts were able to improve our market share over 2016 levels in the Austin market. Pricing for asphalt declined 4.9% as liquid asphalt prices have decreased.
Other Financial Information
Tax Receivable Agreement Expense
As discussed above, in the second quarter 2017, we recorded $1.5 million of tax receivable agreement (“TRA”) expense. This estimate was recorded based on our current estimate of the change in the valuation allowance against our deferred tax assets subject to the TRA.
Income Tax Benefit
The income tax expense of $3.4 million and $1.3 million in the three and six months ended July 1, 2017, respectively, was primarily due to the benefit associated with the depletion in excess of U.S. GAAP depletion recognized in the C corporations in the three and six months ended July 1, 2017. During the three and six months periods ended July 2, 2016, our income tax benefit was $1.1 million and $9.2 million, respectively. The effective tax rate for Summit Inc. differs from the federal rate primarily due to (1) the change in valuation allowance, (2) tax depletion expense in excess of the expense recorded under U.S. GAAP, (3) the minority interest in the Summit Holdings partnership that is allocated outside of the Company and (4) various other items such as limitations on meals and entertainment, certain stock compensation and other costs.
In assessing the realizability of deferred tax assets, including the deferred tax assets generated under the TRA described below, management determined that it was more likely than not that a portion of the deferred tax assets will not be realized. The ultimate realization of deferred tax assets is dependent upon the generation of future taxable income during the periods in which those temporary differences become deductible and consideration of tax-planning strategies. As positive evidence of the realizability of our deferred tax assets accumulates, we will begin to release the valuation allowance, which will be recorded as a benefit to income tax expense. To the extent the release of the valuation allowance relates to TRA deferred tax assets, and we determine payment of those benefits has become probable under our TRA agreement, a TRA liability and related TRA expense will be recorded equal to 85% of the valuation allowance release.
32
Segment results of operations
West Segment
|
|
|
Three months ended |
|
|
|
|
|
|
|
Six months ended |
|
|
|
|
|
|
||||||||
|
|
|
July 1, |
|
July 2, |
|
|
|
|
|
|
|
July 1, |
|
July 2, |
|
|
|
|
|
|
||||
|
($ in thousands) |
|
2017 |
|
2016 |
|
Variance |
|
|
2017 |
|
2016 |
|
Variance |
|
||||||||||
|
Net revenue |
|
$ |
249,849 |
|
$ |
208,974 |
|
$ |
40,875 |
|
19.6 |
% |
|
$ |
381,823 |
|
$ |
322,821 |
|
$ |
59,002 |
|
18.3 |
% |
|
Operating income |
|
|
42,907 |
|
|
34,181 |
|
|
8,726 |
|
25.5 |
% |
|
|
42,620 |
|
|
31,348 |
|
|
11,272 |
|
36.0 |
% |
|
Operating margin percentage |
|
|
17.2 |
% |
|
16.4 |
% |
|
|
|
|
|
|
|
11.2 |
% |
|
9.7 |
% |
|
|
|
|
|
|
Adjusted EBITDA (1) |
|
$ |
60,520 |
|
$ |
50,585 |
|
$ |
9,935 |
|
19.6 |
% |
|
$ |
76,219 |
|
$ |
63,864 |
|
$ |
12,355 |
|
19.3 |
% |
|
(1) |
Adjusted EBITDA is a non-GAAP measure that we find helpful in monitoring the performance of our business. See the reconciliation of Adjusted EBITDA to net income below. |
Net revenue in the West segment increased $40.9 million and $59.0 million in the three and six months ended July 1, 2017, respectively, primarily due to incremental revenue from the acquisition of Everist Materials, Winvan Paving and Hanna’s Bend in early 2017 and 2016 acquisitions of Midland Concrete and Rustin in 2016. Net revenue growth from acquisitions in the three and six months ended July 1, 2017 increased $30.4 million and $51.4 million, respectively, with the balance attributable to organic operations.
The West segment’s operating income improved $8.7 million and $11.3 million in the three and six months ended July 1, 2017, respectively. Adjusted EBITDA improved $9.9 million and $12.4 million in the three and six months ended July 1, 2017, respectively. The improvement in West operating income and adjusted EBITDA was primarily due to improved organic volume growth in aggregates and asphalt, as well as contributions from the acquisitions mentioned above. As a result, the operating margin percentage in the West segment improved in the three months ended July 1, 2017 to 17.2% as compared to the three months ended July 2, 2016 at 16.4%. Those same factors contributed to similar improvements in net revenue, operating income, operating margin percentage and adjusted EBITDA in the respective six month periods.
Gross revenue by product/ service was as follows:
|
|
|
Three months ended |
|
|
|
|
|
|
|
Six months ended |
|
|
|
|
|
|
||||||||
|
|
|
July 1, |
|
July 2, |
|
Variance |
|
July 1, |
|
July 2, |
|
Variance |
||||||||||||
|
($ in thousands) |
|
2017 |
|
2016 |
|
|
Dollar |
|
Percentage |
|
|
2017 |
|
2016 |
|
|
Dollar |
|
Percentage |
|
||||
|
Revenue by product*: |
|
|
|
|
|
|
|
|
|
|
|
|
|
|
|
|
|
|
|
|
|
|
|
|
|
Aggregates |
|
$ |
52,419 |
|
$ |
41,583 |
|
$ |
10,836 |
|
26.1 |
% |
|
$ |
88,093 |
|
$ |
75,177 |
|
$ |
12,916 |
|
17.2 |
% |
|
Ready-mix concrete |
|
|
97,541 |
|
|
73,587 |
|
|
23,954 |
|
32.6 |
% |
|
|
169,570 |
|
|
135,951 |
|
|
33,619 |
|
24.7 |
% |
|
Asphalt |
|
|
64,804 |
|
|
61,503 |
|
|
3,301 |
|
5.4 |
% |
|
|
83,564 |
|
|
73,974 |
|
|
9,590 |
|
13.0 |
% |
|
Paving and related services |
|
|
101,170 |
|
|
96,714 |
|
|
4,456 |
|
4.6 |
% |
|
|
130,303 |
|
|
120,564 |
|
|
9,739 |
|
8.1 |
% |
|
Other |
|
|
(40,079) |
|
|
(47,110) |
|
|
7,031 |
|
(14.9) |
% |
|
|
(52,456) |
|
|
(55,672) |
|
|
3,216 |
|
(5.8) |
% |
|
Total revenue |
|
$ |
275,855 |
|
$ |
226,277 |
|
$ |
49,578 |
|
21.9 |
% |
|
$ |
419,074 |
|
$ |
349,994 |
|
$ |
69,080 |
|
19.7 |
% |
*Revenue by product includes intercompany and intracompany sales transferred at market value. The elimination of intracompany transactions is included in “Other”. Revenue from the liquid asphalt terminals is included in asphalt revenue.
33
The West segment’s percent changes in sales volumes and pricing in the six months ended July 1, 2017 from the six months ended July 2, 2016 were as follows:
|
|
|
Three months ended |
|
Six months ended |
|
||||
|
|
|
Percentage Change in |
|
Percentage Change in |
|
||||
|
|
|
Volume |
|
Pricing |
|
Volume |
|
Pricing |
|
|
Aggregates |
|
28.7 |
% |
(2.0) |
% |
17.0 |
% |
0.2 |
% |
|
Ready-mix concrete |
|
29.5 |
% |
2.4 |
% |
24.9 |
% |
(0.2) |
% |
|
Asphalt |
|
8.2 |
% |
(2.6) |
% |
18.2 |
% |
(3.7) |
% |
Revenue from aggregates in the West segment increased $10.8 million and $12.9 million in the three and six months ended July 1, 2017, respectively, primarily due an increase in volumes in the first half of 2017. The increase in aggregates volumes was primarily in the Austin, northeast Texas and Vancouver, British Columbia markets. Aggregates volume increased mainly due to organic growth in these markets with minimal contribution from the 2017 and 2016 acquisitions, partially offset by a decrease in organic volumes in Houston. Aggregates pricing in the second quarter of 2017 decreased slightly due to a shift in product mix. However, aggregates pricing for the first six months of 2017 remained consistent with the first half of 2016.
Revenue from ready-mix concrete in the West segment increased $24.0 million and $33.6 million in the three and six months ended July 1, 2017, respectively, due to higher organic and acquisition volumes in the first half of 2017. The increase in ready-mix concrete volumes was primarily a result of the 2017 and 2016 acquisitions.
Revenue from asphalt in the West segment increased $3.3 million and $9.6 million in the three and six months ended July 1, 2017, respectively, primarily due to higher volumes partially offset by slightly lower pricing. Organic asphalt volumes increased 6.8% due to improvement in our Austin, Texas market in the first half of 2017. Asphalt pricing decreased consistent with lower input prices. Revenue for paving and related services in the West segment increased by $4.5 million and $9.7 million in the three and six months ended July 1, 2017, respectively, primarily due to organic growth.
Prior to eliminations of intercompany transactions, the net effect of volume and pricing changes on gross revenue in the six months ended July 1, 2017 was approximately $58.8 million and $(2.7) million, respectively.
Our reporting unit based in Austin, Texas, where the economy has been expanding, has seen new market entrants, one of which aggressively sought market share, which negatively impacted Adjusted EBITDA in the West segment in 2016. Our efforts to improve our profitability in that area are showing positive results in 2017, as organic volume growth has occurred in the first six months of 2017 as compared to the same period a year ago. We will continue to monitor the effect of this activity to assess whether an event occurs that indicates the carrying amount of the Austin-based reporting unit may be impaired requiring a goodwill impairment analysis.
34
East Segment
|
|
|
Three months ended |
|
|
|
|
|
|
|
Six months ended |
|
|
|
|
|
|
||||||||
|
|
|
July 1, |
|
July 2, |
|
|
|
|
|
|
|
July 1, |
|
July 2, |
|
|
|
|
|
|
||||
|
($ in thousands) |
|
2017 |
|
2016 |
|
Variance |
|
|
2017 |
|
2016 |
|
Variance |
|
||||||||||
|
Net revenue |
|
$ |
144,290 |
|
$ |
124,045 |
|
$ |
20,245 |
|
16.3 |
% |
|
$ |
227,525 |
|
$ |
184,249 |
|
$ |
43,276 |
|
23.5 |
% |
|
Operating income |
|
|
21,130 |
|
|
22,401 |
|
|
(1,271) |
|
(5.7) |
% |
|
|
9,612 |
|
|
14,832 |
|
|
(5,220) |
|
(35.2) |
% |
|
Operating margin percentage |
|
|
14.6 |
% |
|
18.1 |
% |
|
|
|
|
|
|
|
4.2 |
% |
|
8.0 |
% |
|
|
|
|
|
|
Adjusted EBITDA (1) |
|
$ |
38,766 |
|
$ |
35,674 |
|
$ |
3,092 |
|
8.7 |
% |
|
$ |
43,114 |
|
$ |
38,847 |
|
$ |
4,267 |
|
11.0 |
% |
|
(1) |
Adjusted EBITDA is a non-GAAP measure that we find helpful in monitoring the performance of our business. See the reconciliation of Adjusted EBITDA to net income below. |
Net revenue in the East segment increased $20.2 million and $43.3 million in the three and six month periods ended July 1, 2017, respectively, primarily due to acquisitions contributing $18.6 million and $35.6 million in the three and six months ended July 1, 2017, respectively, and organic growth of $1.6 million and $7.7 million, respectively.
Although our net revenue increased in the East segment primarily due to acquisitions, operating income declined $1.3 million and $5.2 million in the three and six months ended July 1, 2017, respectively, as increases in depreciation, and to a lesser extent general and administrative expenses, exceeded those revenue gains due to the seasonality of the business. Adjusted EBITDA improved $3.1 million and $4.3 million in the three and six months ended July 1, 2017, respectively, as the increases in net revenue were offset by additional general and administrative expenses.
Operating margin percentage for the three months ended July 1, 2017 decreased to 14.6% from 18.1% in the comparable period a year ago, as revenue from paving and related services, which generally have lower operating margins than materials and products, increased slightly, as well as the other factors mentioned above.
Operating margin percentage for the six months ended July 1, 2017 decreased to 4.2% from 8.0% in the comparable period a year ago, as revenue from paving and related services, which generally have lower operating margins than materials and products, increased slightly, as well as the other factors mentioned above.
Gross revenue by product/ service was as follows:
|
|
|
Three months ended |
|
|
|
|
|
|
|
Six months ended |
|
|
|
|
|
|
||||||||
|
|
|
July 1, |
|
July 2, |
|
Variance |
|
July 1, |
|
July 2, |
|
Variance |
||||||||||||
|
($ in thousands) |
|
2017 |
|
2016 |
|
|
Dollar |
|
Percentage |
|
|
2017 |
|
2016 |
|
|
Dollar |
|
Percentage |
|
||||
|
Revenue by product*: |
|
|
|
|
|
|
|
|
|
|
|
|
|
|
|
|
|
|
|
|
|
|
|
|
|
Aggregates |
|
$ |
60,101 |
|
$ |
55,423 |
|
$ |
4,678 |
|
8.4 |
% |
|
$ |
102,797 |
|
$ |
86,886 |
|
$ |
15,911 |
|
18.3 |
% |
|
Ready-mix concrete |
|
|
31,401 |
|
|
23,784 |
|
|
7,617 |
|
32.0 |
% |
|
|
52,730 |
|
|
41,657 |
|
|
11,073 |
|
26.6 |
% |
|
Asphalt |
|
|
26,387 |
|
|
20,617 |
|
|
5,770 |
|
28.0 |
% |
|
|
28,906 |
|
|
22,503 |
|
|
6,403 |
|
28.5 |
% |
|
Paving and related services |
|
|
58,922 |
|
|
46,683 |
|
|
12,239 |
|
26.2 |
% |
|
|
80,065 |
|
|
58,501 |
|
|
21,564 |
|
36.9 |
% |
|
Other |
|
|
(12,802) |
|
|
(7,127) |
|
|
(5,675) |
|
79.6 |
% |
|
|
(3,266) |
|
|
507 |
|
|
(3,773) |
|
(744.2) |
% |
|
Total revenue |
|
$ |
164,009 |
|
$ |
139,380 |
|
$ |
24,629 |
|
17.7 |
% |
|
$ |
261,232 |
|
$ |
210,054 |
|
$ |
51,178 |
|
24.4 |
% |
*Revenue by product includes intercompany and intracompany sales transferred at market value. The elimination of intracompany transactions is included in Other. Revenue from the liquid asphalt terminals is included in asphalt revenue.
35
The East segment’s percent changes in sales volumes and pricing in the three and six months ended July 1, 2017 from the three and six months ended July 2, 2016 were as follows:
|
|
|
Three months ended |
|
Six months ended |
|
||||
|
|
|
Percentage Change in |
|
Percentage Change in |
|
||||
|
|
|
Volume |
|
Pricing |
|
Volume |
|
Pricing |
|
|
Aggregates |
|
6.1 |
% |
2.3 |
% |
14.3 |
% |
3.5 |
% |
|
Ready-mix concrete |
|
30.9 |
% |
0.8 |
% |
25.0 |
% |
1.3 |
% |
|
Asphalt |
|
35.5 |
% |
(6.8) |
% |
36.3 |
% |
(6.9) |
% |
Revenue from aggregates in the East segment increased $4.7 million and $15.9 million in the three and six months ended July 1, 2017, respectively, due primarily to the acquisition of Razorback in 2017, as well as the Oldcastle Assets and RD Johnson acquisitions in 2016. Aggregate volumes in the first half of 2017 increased 14.3%, primarily as a result of those acquisitions. Aggregates pricing increased as a result of an improved market and shift in product mix.
Revenue from ready-mix concrete in the East segment increased $7.6 million and $11.1 million in the three and six months ended July 1, 2017, respectively, primarily as a result of the acquisitions mentioned above. Ready-mix volumes increased due to acquisitions, offset by an organic volumes decline of 3.0%.
Revenue from asphalt increased $5.8 million and $6.4 million in the three and six months ended July 1, 2017, respectively, due to an increase in asphalt volumes, offset by pricing decline, primarily in the Kentucky and Kansas markets. The $12.2 million and $21.6 million increase in paving and related service revenue in the three and six months ended July 1, 2017, respectively, was primarily a result of acquisitions in Kansas and Virginia.
Prior to eliminations of intercompany transactions, the net effect of volume and pricing changes on gross revenue in the six months ended July 1, 2017 was approximately $31.0 million and $2.3 million, respectively.
Cement Segment
|
|
|
Three months ended |
|
|
|
|
|
|
|
Six months ended |
|
|
|
|
|
|
||||||||
|
|
|
July 1, |
|
July 2, |
|
|
|
|
|
|
|
July 1, |
|
July 2, |
|
|
|
|
|
|
||||
|
($ in thousands) |
|
2017 |
|
2016 |
|
Variance |
|
|
2017 |
|
2016 |
|
Variance |
|
||||||||||
|
Net revenue |
|
$ |
84,229 |
|
$ |
79,617 |
|
$ |
4,612 |
|
5.8 |
% |
|
$ |
128,064 |
|
$ |
113,605 |
|
$ |
14,459 |
|
12.7 |
% |
|
Operating income |
|
|
33,725 |
|
|
28,553 |
|
|
5,172 |
|
18.1 |
% |
|
|
28,455 |
|
|
24,314 |
|
|
4,141 |
|
17.0 |
% |
|
Operating margin percentage |
|
|
40.0 |
% |
|
35.9 |
% |
|
|
|
|
|
|
|
22.2 |
% |
|
21.4 |
% |
|
|
|
|
|
|
Adjusted EBITDA (1) |
|
$ |
43,783 |
|
$ |
37,593 |
|
$ |
6,190 |
|
16.5 |
% |
|
$ |
46,468 |
|
$ |
38,564 |
|
$ |
7,904 |
|
20.5 |
% |
|
(1) |
Adjusted EBITDA is a non-GAAP measure that we find helpful in monitoring the performance of our business. See the reconciliation of Adjusted EBITDA to net income below. |
Net revenue in the Cement segment increased $4.6 million and $14.5 million in the three and six month periods ended July 1, 2017, respectively, primarily due to organic growth within existing operations and the acquisition of the Angelle Assets, which contributed incremental net revenue of $0.8 million and $4.2 million in the three and six months ended July 1, 2017, respectively.
The Cement segment’s operating income improved $5.2 million and $4.1 million in the three and six months ended July 1, 2017, respectively. Adjusted EBITDA improved $6.2 million and $7.9 million in the three and six months ended July 1, 2017, respectively. The increase in operating income was primarily due to increased organic cement volumes and pricing. Operating margin percentage for the three months ended July 1, 2017 improved to 40.0% from 35.9% in the second quarter, primarily attributable to pricing improvements and operational efficiencies. The operational efficiencies have been driven by a reduction in unscheduled downtime and improved cost management and production processes. Operating margin for the six months ended July 1, 2017 remains consistent with the first half of 2016.
36
Gross revenue by product was as follows:
|
|
|
Three months ended |
|
|
|
|
|
|
|
Six months ended |
|
|
|
|
|
|
||||||||
|
|
|
July 1, |
|
July 2, |
|
Variance |
|
July 1, |
|
July 2, |
|
Variance |
||||||||||||
|
($ in thousands) |
|
2017 |
|
2016 |
|
|
Dollar |
|
Percentage |
|
|
2017 |
|
2016 |
|
|
Dollar |
|
Percentage |
|
||||
|
Revenue by product*: |
|
|
|
|
|
|
|
|
|
|
|
|
|
|
|
|
|
|
|
|
|
|
|
|
|
Cement |
|
$ |
79,985 |
|
$ |
71,711 |
|
$ |
8,274 |
|
11.5 |
% |
|
$ |
120,289 |
|
$ |
101,222 |
|
$ |
19,067 |
|
18.8 |
% |
|
Other |
|
|
4,244 |
|
|
7,906 |
|
|
(3,662) |
|
(46.3) |
% |
|
|
7,775 |
|
|
12,383 |
|
|
(4,608) |
|
(37.2) |
% |
|
Total revenue |
|
$ |
84,229 |
|
$ |
79,617 |
|
$ |
4,612 |
|
5.8 |
% |
|
$ |
128,064 |
|
$ |
113,605 |
|
$ |
14,459 |
|
12.7 |
% |
*Revenue by product includes intercompany and intracompany sales transferred at market value. Revenue from waste processing and the elimination of intracompany transactions is included in Other.
The Cement segment’s percent changes in sales volumes and pricing in the six months ended July 1, 2017 from the three and six months ended July 2, 2016 were as follows:
|
|
|
Three months ended |
|
Six months ended |
|
||||
|
|
|
Percentage Change in |
|
Percentage Change in |
|
||||
|
|
|
Volume |
|
Pricing |
|
Volume |
|
Pricing |
|
|
Cement |
|
8.3 |
% |
2.9 |
% |
14.0 |
% |
4.2 |
% |
Revenue from cement increased $8.3 million and $19.1 million in the three and six months ended July 1, 2017, respectively, due primarily to increased organic cement volumes and pricing. For the six months ended July 1, 2017, cement volumes and pricing increased 14.0% and 4.2%, respectively. The acquisition of the Angelle Assets contributed 3.8% and 11.6% in cement volumes and pricing increases, respectively. Organic cement volumes increased 10.2% year over year, with the balance attributable to the acquisition referred to above.
Liquidity and Capital Resources
Our primary sources of liquidity include cash on-hand, cash provided by operations, amounts available for borrowing under our senior secured credit facilities and capital-raising activities in the debt and capital markets. As of July 1, 2017, we had $353.1 million in cash and cash equivalents and $547.9 million of working capital compared to $143.4 million and $244.4 million, respectively, at December 31, 2016. Working capital is calculated as current assets less current liabilities. There were no restricted cash balances as of July 1, 2017 or December 31, 2016. Our remaining borrowing capacity on our senior secured revolving credit facility was $218.9 million as of July 1, 2017, which is net of $16.1 million of outstanding letters of credit, and is fully available to us within the terms and covenant requirements of our credit agreement governing the senior secured credit facilities (the “Credit Agreement”).
Given the seasonality of our business, we typically experience significant fluctuations in working capital needs and balances throughout the year. Our working capital requirements generally increase during the first half of the year as we build up inventory and focus on repair and maintenance and other set-up costs for the upcoming season. Working capital levels then decrease as the construction season winds down and we enter the winter months, which is when we see significant inflows of cash from the collection of receivables.
Our acquisition strategy has historically required us to raise capital through equity issuances or debt financings. As of July 1, 2017 and December 31, 2016, our long-term borrowings, including the current portion without giving effect to original issue discount, totaled $1.8 billion and $1.5 billion, respectively, for which we incurred $22.9 million and $44.5 million of interest expense for the three and six months ended July 1, 2017, respectively, and $22.0 million and $40.2 million for the three and six months ended July 2, 2016, respectively. We remain in compliance with our debt covenants and, when we have made additional issuances of senior notes to fund acquisitions, we have complied with the incurrence tests in the indentures governing our senior notes. In addition, our cash flows provided by operating activities were $244.9 million in the year ended December 31, 2016, which is net of interest payments. Our senior secured revolving credit facility has been adequate to fund our seasonal working capital needs and certain acquisitions. We had no outstanding borrowings on the revolving credit facility as of July 1, 2017.
We believe we have access to sufficient financial resources from our liquidity sources to fund our business and operations, including contractual obligations, capital expenditures and debt service obligations, for at least the next
37
twelve months. Our growth strategy contemplates future acquisitions for which we believe we have sufficient access to capital.
We and our affiliates may from time to time purchase our outstanding debt through open market purchases, privately negotiated transactions or otherwise. Purchases or retirement of debt, if any, will depend on prevailing market conditions, liquidity requirements, contractual restrictions and other factors. The amounts involved may be material.
Indebtedness
Please refer to the notes to the consolidated interim financial statements for detailed information about our long-term debt, scheduled maturities of long-term debt and affirmative and negative covenants, including the maximum allowable consolidated first lien net leverage ratio. As of July 1, 2017, we were in compliance with all debt covenants.
At July 1, 2017 and December 31, 2016, $1.8 billion and $1.5 billion of total debt, respectively, without giving effect to original issuance discount, were outstanding under our respective debt agreements. Summit LLC has senior secured credit facilities that provide for term loans in an aggregate amount of $650.0 million and revolving credit commitments in an aggregate amount of $235.0 million (the “Senior Secured Credit Facilities”). Summit LLC’s domestic wholly-owned subsidiary companies are named as guarantors of the Senior Notes and the Senior Secured Credit Facilities. Certain other partially-owned subsidiaries, and the wholly-owned Canadian subsidiary, Mainland, do not guarantee the Senior Notes or Senior Secured Credit Facilities. Summit LLC has pledged substantially all of its assets as collateral for the Senior Secured Credit Facilities.
On January 19, 2017, Summit LLC entered into Amendment No. 1 (“Amendment No. 1”) to the Credit Agreement, which, among other things, reduced the applicable margin in respect of the $640.3 million outstanding principal amount of term loans thereunder and included a 1.00% prepayment premium in connection with certain further repricing events that occur on or prior to the six-month anniversary of the effective date of Amendment No. 1. All other material terms and provisions remain substantially identical to the terms and provisions in place immediately prior to the effectiveness of Amendment No. 1.
On June 1, 2017, the Issuers issued $300.0 million in aggregate principal amount of 5.125% senior notes due June 1, 2025. The 2025 Notes were issued at par value, resulting in proceeds of $295.4 million, net of related fees and expenses. Interest on the 2025 Notes is payable semi-annually on June 1 and December 1 of each year commencing on December 1, 2017. Proceeds from the sale of the 2025 Notes are intended to be used for acquisitions and to pay fees and expenses incurred in connection with any such acquisitions and the offering, with any remaining net proceeds to be used for general corporate purposes, which may include repaying indebtedness, capital expenditures and funding working capital.
On March 8, 2016, the Issuers issued $250.0 million in aggregate principal amount of 8.500% senior notes due April 15, 2022 (the “2022 Notes”). The 2022 Notes were issued at par and interest on the 2022 Notes is payable semi-annually in arrears on April 15 and October 15 of each year commencing on October 15, 2016. The net proceeds of the 2022 Notes were used to fund the Boxley acquisition, replenish cash used for the AMC acquisition and pay expenses incurred therewith.
Cash Flows
The following table summarizes our net cash used for or provided by operating, investing and financing activities and our capital expenditures in the six months ended July 1, 2017 and July 2, 2016:
|
|
|
Summit Inc. |
||||
|
|
|
July 1, |
|
July 2, |
||
|
(in thousands) |
|
2017 |
|
2016 |
||
|
Net cash provided by (used for): |
|
|
|
|
|
|
|
Operating activities |
|
$ |
11,149 |
|
$ |
(26,500) |
|
Investing activities |
|
|
(313,664) |
|
|
(377,391) |
|
Financing activities |
|
|
511,998 |
|
|
226,156 |
|
Cash paid for capital expenditures |
|
$ |
(109,088) |
|
$ |
(91,669) |
38
Operating activities
During the six months ended July 1, 2017, cash provided by operating activities was $11.1 million primarily as a result of:
|
· |
Net loss of $3.0 million, adjusted for $97.3 million of non-cash expenses, including $90.8 million of depreciation, depletion, amortization and accretion and $9.4 million of share-based compensation. |
|
· |
Additional investment in inventory of $19.3 million consistent with the seasonality of our business for which our inventory levels typically increase in the first half of the year in preparation for the upcoming season. |
|
· |
Billed and unbilled accounts receivable increased by $90.1 million in the first six months of 2017 as a result of the seasonality of our business. The majority of our sales occur in the spring, summer and fall and we typically incur an increase in accounts receivable (net billed and unbilled) during the second and third quarters of each year. This amount is typically converted to cash in the fourth and first quarters. |
|
· |
The timing of payments associated with accounts payable and accrued expenses of cash, which is consistent with the seasonality of our business whereby we build-up inventory levels and incur repairs and maintenance costs to ready the business for increased sales volumes in the summer and fall. These costs are typically incurred in the first half of the year and paid by year-end. In addition, we made $44.2 million of interest payments in the six months ended July 1, 2017. |
During the six months ended July 2, 2016, cash used in operating activities was $26.5 million primarily as a result of:
|
· |
Net loss of $21.0 million, adjusted for $92.4 million of non-cash expenses, including $76.3 million of depreciation, depletion, amortization and accretion and $29.8 million of share-based compensation. |
|
· |
Additional investment in inventory of $27.9 million consistent with the seasonality of our business for which our inventory levels typically increase in the first half of the year in preparation for the upcoming season. |
|
· |
Our accounts receivable (billed and unbilled) increased by $80.0 million of as a result of the seasonality of our business. The majority of our sales occur in the spring, summer and fall and we typically incur an increase in accounts receivable (net billed and unbilled) during the second and third quarters of each year. This amount is typically converted to cash in the fourth and first quarters. |
|
· |
The timing of payments associated with accounts payable and accrued expenses added $20.0 million of cash, which is consistent with the seasonality of our business whereby we build-up inventory levels and incur repairs and maintenance costs to ready the business for increased sales volumes in the summer and fall. These costs are typically incurred in the second quarter and paid in the third. In addition, we made $34.1 million of interest payments in the six months ended July 2, 2016. |
Investing activities
During the six months ended July 1, 2017, cash used for investing activities was $313.7 million, of which $213.1 million related to the seven acquisitions completed in the period and $109.1 million was invested in capital expenditures, which was partially offset by $8.4 million of proceeds from asset sales.
During the six months ended July 2, 2016, cash used for investing activities was $377.4 million, of which $296.7 million related to the acquisitions of AMC, Boxley, Sierra and the Oldcastle Assets and $91.7 million was invested in capital expenditures, which was partially offset by $9.4 million of proceeds from asset sales.
39
Financing activities
During the six months ended July 1, 2017, cash provided by financing activities was $512.0 million, which was primarily composed of $237.6 million of net proceeds from the January 2017 issuance of 10,000,000 shares of Class A common stock and $295.4 million of proceeds from the 2025 Notes, net of related fees and expenses. We made $17.2 million of payments on acquisition related liabilities, and $5.9 million in payments for debt and capital issuance costs.
During the six months ended July 2, 2016, cash provided by financing activities was $226.2 million, which was primarily composed of $246.3 million of proceeds from the 2022 Notes, net of fees and $14.0 million of borrowings from our revolving credit facility. Summit made $25.7 million of payments on acquisition related liabilities and $5.1 million in debt issuance costs.
Cash paid for capital expenditures
We expended approximately $109.1 million in capital expenditures in the six months ended July 1, 2017 compared to $91.7 million in the six months ended July 2, 2016. The second quarter 2017 capital expenditures were primarily composed of rolling stock and plant upgrades.
We estimate that we will invest between $140.0 million and $160.0 million in capital expenditures in 2017, which we have funded or expect to fund through cash on hand, cash from operations, outside financing arrangements and available borrowings under our revolving credit facility. In 2017, we expect to invest in our cement operations, including approximately $13.0 million in plant and terminal projects. We also plan to invest $5.0 million for an aggregate plant upgrade in northeast Texas and $5.0 million for a new ready-mix concrete plant near Houston.
Tax Receivable Agreement
When the Company purchases LP Units for cash or LP Units are exchanged for shares of Class A common stock, this results in increases in the Company’s share of the tax basis of the tangible and intangible assets of Summit Holdings. These increases in tax basis may increase, for tax purposes, depreciation and amortization deductions and therefore reduce the amount of tax that Summit Inc. would otherwise be required to pay in the future. In connection with our IPO, we entered into a TRA with the holders of the LP Units and the pre-IPO owners that provides for the payment by Summit Inc. to exchanging holders of LP Units of 85% of the benefits, if any, that Summit Inc. actually realizes (or, under certain circumstances such as an early termination of the TRA is deemed to realize) as a result of (i) these increases in tax basis and (ii) our utilization of certain net operating losses of the pre-IPO owners and certain other tax benefits related to entering into the TRA, including tax benefits attributable to payments under the TRA. The increases in tax basis as a result of an exchange of LP Units for shares of Class A common stock, as well as the amount and timing of any payments under the TRA, are difficult to accurately estimate, as they will vary depending on a number of factors, including the timing of the exchanges, the price of our Class A common stock at the time of the exchange, the extent to which the exchanges are taxable, the amount of net operating losses, and the amount and timing of our income.
We anticipate funding payments under the TRA agreement from cash flows from operations, available cash and available borrowings under our Senior Secured Revolving Credit Facilities.
Based upon a $28.10 per share price of our Class A common stock, the closing price of our stock on June 30, 2017, and a contractually defined discount rate of 2.82%, we estimate that if Summit Inc. were to exercise its right to terminate the TRA, the aggregate amount required to settle the TRA would be approximately $488 million. Estimating the amount and the timing of payments that may be made under the TRA is by its nature difficult and imprecise, insofar as the amounts payable depends on a variety of factors, including, but not limited to, the timing of future exchanges, our stock price at the date of the exchange and the timing of the generation of future taxable income. The increases in tax basis as a result of an exchange, as well as the amount and timing of any payments under the TRA, will vary depending on a variety of factors.
As of July 1, 2017, we had accrued $59.7 million as a TRA liability, all of which is included in other noncurrent liabilities, as we do not expect payment of that amount to occur within twelve months.
Contractual Obligations
40
The following table presents, as of July 1, 2017, our obligations and commitments to make future payments under our contracts and contingent commitments (in thousands):
|
|
|
Payments Due by Period |
||||||||||||||||||||||
|
|
|
Total |
|
2017 (six months) |
|
2018 |
|
2019 |
|
2020 |
|
2021 |
|
2022 |
|
Thereafter |
||||||||
|
(in thousands) |
|
|
|
|
|
|
|
|
|
|
|
|
|
|
|
|
|
|
|
|
|
|
|
|
|
Short term borrowings and long-term debt, including current portion |
|
$ |
1,837,000 |
|
$ |
3,250 |
|
$ |
4,875 |
|
$ |
6,500 |
|
$ |
8,125 |
|
$ |
6,500 |
|
$ |
857,750 |
|
$ |
950,000 |
|
Capital lease obligations |
|
|
42,739 |
|
|
7,102 |
|
|
18,962 |
|
|
6,846 |
|
|
5,159 |
|
|
745 |
|
|
596 |
|
|
3,329 |
|
Operating lease obligations |
|
|
31,701 |
|
|
4,315 |
|
|
7,084 |
|
|
5,536 |
|
|
4,682 |
|
|
3,790 |
|
|
2,277 |
|
|
4,017 |
|
Interest payments(1) |
|
|
614,588 |
|
|
51,007 |
|
|
99,873 |
|
|
97,454 |
|
|
107,756 |
|
|
101,101 |
|
|
79,147 |
|
|
78,250 |
|
Acquisition-related liabilities |
|
|
68,355 |
|
|
7,201 |
|
|
15,169 |
|
|
24,188 |
|
|
7,679 |
|
|
7,229 |
|
|
1,126 |
|
|
5,763 |
|
Royalty payments |
|
|
92,477 |
|
|
2,878 |
|
|
5,910 |
|
|
5,461 |
|
|
5,257 |
|
|
5,000 |
|
|
4,867 |
|
|
63,104 |
|
Defined benefit plans(2) |
|
|
11,076 |
|
|
587 |
|
|
1,352 |
|
|
1,155 |
|
|
1,187 |
|
|
1,697 |
|
|
1,323 |
|
|
3,775 |
|
Asset retirement obligation payments |
|
|
69,363 |
|
|
4,870 |
|
|
4,098 |
|
|
1,659 |
|
|
1,273 |
|
|
866 |
|
|
931 |
|
|
55,666 |
|
Purchase commitments(3) |
|
|
36,058 |
|
|
25,498 |
|
|
10,560 |
|
|
— |
|
|
— |
|
|
— |
|
|
— |
|
|
— |
|
Payments pursuant to tax receivable agreement (4) |
|
|
488,000 |
|
|
— |
|
|
— |
|
|
— |
|
|
28,400 |
|
|
54,500 |
|
|
55,300 |
|
|
349,800 |
|
Other |
|
|
9,821 |
|
|
1,869 |
|
|
4,047 |
|
|
2,252 |
|
|
1,653 |
|
|
— |
|
|
— |
|
|
— |
|
Total contractual obligations |
|
$ |
3,301,178 |
|
$ |
108,577 |
|
$ |
171,930 |
|
$ |
151,051 |
|
$ |
171,171 |
|
$ |
181,428 |
|
$ |
1,003,317 |
|
$ |
1,513,704 |
|
(1) |
Future interest payments were calculated using the applicable fixed and floating rates charged by our lenders in effect as of July 1, 2017 and may differ from actual results. |
|
(2) |
Future payments to fund our defined benefit plans are estimated based on multiple assumptions which are enumerated in Note 11 to the audited consolidated financial statements included in the Annual Report. |
|
(3) |
Amounts represent purchase commitments entered into the in the normal course of business, primarily for fuel purchases, the terms of which are generally one year. |
|
(4) |
The total amount payable under our TRA is estimated at $488 million as of July 1, 2017, if we exercised our right of early termination of the TRA as of that date. Under the terms of the TRA, payment of amounts benefitting us is due to the pre-IPO owners within four months of the tax returns being submitted to the respective regulatory agencies when the benefits are realized. We currently estimate the first benefits being realized upon filing of the 2018 tax returns in the fourth quarter of 2019. The estimated timing of TRA payments is subject to a number of factors, primarily around the timing of the generation of future taxable income in future years, which will be impacted by business activity in those years. |
Commitments and contingencies
We are party to certain legal actions arising from the ordinary course of business activities. Accruals are recorded when the outcome is probable and can be reasonably estimated. While the ultimate results of claims and litigation cannot be predicted with certainty, management expects that the ultimate resolution of all pending or threatened claims and litigation will not have a material effect on our consolidated results of operations, financial position or liquidity. We record legal fees as incurred.
Litigation and Claims—We are obligated under an indemnification agreement entered into with the sellers of Harper Contracting for the sellers’ ownership interests in a joint venture agreement. We have the rights to any benefits under the joint venture as well as the assumption of any obligations, but do not own equity interests in the joint venture. The joint venture has incurred significant losses on a highway project in Utah, which have resulted in requests for funding from the joint venture partners and ultimately from us. Through July 1, 2017, we have funded $8.8 million, $4.0 million in 2012 and $4.8 million in 2011. In 2012 and 2011, we recognized losses on the indemnification agreement of $8.0 million and $1.9 million, respectively. As of July 1, 2017 and December 31, 2016, an accrual of $4.3 million was recorded in other noncurrent liabilities as management’s best estimate of future funding obligations.
Environmental Remediation—Our operations are subject to and affected by federal, state, provincial and local laws and regulations relating to the environment, health and safety and other regulatory matters. These operations require environmental operating permits, which are subject to modification, renewal and revocation. We regularly monitor and review its operations, procedures and policies for compliance with these laws and regulations. Despite these compliance efforts, risk of environmental liability is inherent in the operation of our business, as it is with other companies engaged in similar businesses and there can be no assurance that environmental liabilities and noncompliance will not have a material adverse effect on our consolidated financial condition, results of operations or liquidity.
41
Other—We are obligated under various firm purchase commitments for certain raw materials and services that are in the ordinary course of business. Management does not expect any significant changes in the market value of these goods and services during the commitment period that would have a material adverse effect on the financial condition, results of operations, and cash flows of the Company. The terms of the purchase commitments generally approximate one year.
Off-Balance sheet arrangements
As of July 1, 2017, we had no material off-balance sheet arrangements.
New Accounting Pronouncements Not Yet Adopted
In January 2017, the Financial Accounting Standards Board (“FASB”) issued Accounting Standards Update (“ASU”) 2017-01, Clarifying the Definition of a Business, which narrows the definition of a business. This ASU provides a screen to determine whether a group of assets constitute a business. The screen requires that when substantially all of the fair value of the gross assets acquired (or disposed of) is concentrated in a single identifiable asset or a group of similar identifiable assets, the set is not a business. This screen reduces the number of transactions that need to be further evaluated as acquisitions. If the screen is not met, this ASU (1) requires that to be considered a business, a set must include, at a minimum, an input and a substantive process that together significantly contribute to the ability to create an output and (2) removes the evaluation of whether a market participant could replace missing elements. Although outputs are not required for a set to be a business, outputs generally are a key element of a business; therefore, the FASB has developed more stringent criteria for sets without outputs. The ASU is effective for public companies for annual periods beginning after December 15, 2017. The adoption of this ASU is not expected to have a material impact on the consolidated financial statements.
In February 2016, the FASB issued ASU No. 2016-02, Leases, which will result in lessees recognizing most leases on the balance sheet. Lessees are required to disclose more quantitative and qualitative information about their leases than current U.S. GAAP requires. The ASU is effective for public entities for fiscal years, and interim periods within those fiscal years, beginning after December 15, 2018. We are beginning to compile all operating and capital leases to assess the impact of adopting this standard.
In May 2014, the FASB issued ASU No. 2014-09, Revenue from Contracts with Customers, which prescribes a five-step model for revenue recognition that will replace most existing revenue recognition guidance in U.S. GAAP. The ASU will supersede nearly all existing revenue recognition guidance under U.S. GAAP and provides that an entity recognize revenue when it transfers promised goods or services to customers in an amount that reflects the consideration to which the entity expects to be entitled in exchange for those goods or services. This update also requires additional disclosure about the nature, amount, timing and uncertainty of revenue and cash flows arising from customer contracts, including significant judgments and changes in judgments, and assets recognized from costs incurred to obtain or fulfill a contract. In July 2015, the FASB postponed the effective date of the new revenue standard by one year to the first quarter of 2018. In applying these ASUs, an entity is permitted to use either the full retrospective or cumulative effect transition approach. We plan to adopt these ASU’s using the cumulative effect transition approach. While we are currently evaluating the impact of adoption of these standards on our consolidated financial statements, we expect to identify similar performance obligations compared with the deliverables and separate units of account we have identified under existing accounting standards. As a result, we do not expect the adoption of these ASU’s to have a material impact on our consolidated statements of operations.
Non-GAAP Performance Measures
We evaluate our operating performance using metrics that we refer to as “Adjusted EBITDA,” "Adjusted Cash Gross Profit" and “Adjusted Cash Gross Margin” which are not defined by U.S. GAAP and should not be considered as an alternative to earnings measures defined by U.S. GAAP. We define Adjusted EBITDA as EBITDA, adjusted to exclude accretion, loss on debt financings, loss from discontinued operations and certain non-cash and non-operating items. We define Adjusted Cash Gross Profit as operating income before general and administrative expenses, depreciation, depletion, amortization and accretion and transaction costs and Adjusted Cash Gross Margin as Adjusted Cash Gross Profit as a percentage of net revenue.
42
We present Adjusted EBITDA, Adjusted Cash Gross Profit and Adjusted Cash Gross Margin for the convenience of investment professionals who use such metrics in their analyses. The investment community often uses these metrics to assess the operating performance of a company’s business and to provide a consistent comparison of performance from period to period. We use these metrics, among others, to assess the operating performance of our individual segments and the consolidated company.
Non-GAAP financial measures are not standardized; therefore, it may not be possible to compare such financial measures with other companies’ non-GAAP financial measures having the same or similar names. We strongly encourage investors to review our consolidated financial statements in their entirety and not rely on any single financial measure.
43
The tables below reconcile our net income (loss) to EBITDA and Adjusted EBITDA and present Adjusted EBITDA by segment and reconcile operating income to Adjusted Cash Gross Profit for the periods indicated:
|
Reconciliation of Net Income (Loss) to Adjusted EBITDA |
|
Three months ended July 1, 2017 |
|||||||||||||
|
by Segment |
|
West |
|
East |
|
Cement |
|
Corporate |
|
Consolidated |
|||||
|
(in thousands) |
|
|
|
|
|
|
|
|
|
|
|
|
|
|
|
|
Net income (loss) (1) |
|
$ |
40,529 |
|
$ |
20,600 |
|
$ |
34,442 |
|
$ |
(43,483) |
|
$ |
52,088 |
|
Interest expense (income) (1) |
|
|
1,843 |
|
|
929 |
|
|
(684) |
|
|
23,898 |
|
|
25,986 |
|
Income tax expense (benefit) |
|
|
533 |
|
|
(21) |
|
|
— |
|
|
2,923 |
|
|
3,435 |
|
Depreciation, depletion and amortization |
|
|
17,224 |
|
|
16,740 |
|
|
9,961 |
|
|
662 |
|
|
44,587 |
|
EBITDA |
|
$ |
60,129 |
|
$ |
38,248 |
|
$ |
43,719 |
|
$ |
(16,000) |
|
$ |
126,096 |
|
Accretion |
|
|
195 |
|
|
193 |
|
|
64 |
|
|
— |
|
|
452 |
|
Loss on debt financings |
|
|
— |
|
|
— |
|
|
— |
|
|
— |
|
|
— |
|
Tax receivable agreement expense (1) |
|
|
— |
|
|
— |
|
|
— |
|
|
1,525 |
|
|
1,525 |
|
Transaction costs |
|
|
(28) |
|
|
— |
|
|
— |
|
|
2,648 |
|
|
2,620 |
|
Non-cash compensation |
|
|
— |
|
|
— |
|
|
— |
|
|
4,676 |
|
|
4,676 |
|
Other |
|
|
224 |
|
|
325 |
|
|
— |
|
|
(683) |
|
|
(134) |
|
Adjusted EBITDA (1) |
|
$ |
60,520 |
|
$ |
38,766 |
|
$ |
43,783 |
|
$ |
(7,834) |
|
$ |
135,235 |
|
Reconciliation of Net Income (Loss) to Adjusted EBITDA |
|
Three months ended July 2, 2016 |
|||||||||||||
|
by Segment |
|
West |
|
East |
|
Cement |
|
Corporate |
|
Consolidated |
|||||
|
(in thousands) |
|
|
|
|
|
|
|
|
|
|
|
|
|
|
|
|
Net income (loss) (1) |
|
$ |
30,018 |
|
$ |
21,150 |
|
$ |
28,034 |
|
$ |
(57,697) |
|
$ |
21,505 |
|
Interest expense (1) |
|
|
2,545 |
|
|
2,008 |
|
|
326 |
|
|
20,738 |
|
|
25,617 |
|
Income tax expense (benefit) |
|
|
139 |
|
|
— |
|
|
— |
|
|
(1,195) |
|
|
(1,056) |
|
Depreciation, depletion and amortization |
|
|
15,994 |
|
|
12,140 |
|
|
8,261 |
|
|
643 |
|
|
37,038 |
|
EBITDA |
|
$ |
48,696 |
|
$ |
35,298 |
|
$ |
36,621 |
|
$ |
(37,511) |
|
$ |
83,104 |
|
Accretion |
|
|
192 |
|
|
170 |
|
|
8 |
|
|
— |
|
|
370 |
|
IPO/ Legacy equity modification costs |
|
|
— |
|
|
— |
|
|
— |
|
|
24,751 |
|
|
24,751 |
|
Transaction costs |
|
|
216 |
|
|
5 |
|
|
— |
|
|
69 |
|
|
290 |
|
Non-cash compensation |
|
|
— |
|
|
— |
|
|
— |
|
|
3,029 |
|
|
3,029 |
|
Other |
|
|
1,481 |
|
|
201 |
|
|
964 |
|
|
542 |
|
|
3,188 |
|
Adjusted EBITDA (1) |
|
$ |
50,585 |
|
$ |
35,674 |
|
$ |
37,593 |
|
$ |
(9,120) |
|
$ |
114,732 |
44
|
Reconciliation of Net Income (Loss) to Adjusted EBITDA |
|
Six months ended July 1, 2017 |
|||||||||||||
|
by Segment |
|
West |
|
East |
|
Cement |
|
Corporate |
|
Consolidated |
|||||
|
(in thousands) |
|
|
|
|
|
|
|
|
|
|
|
|
|
|
|
|
Net income (loss) (1) |
|
$ |
38,503 |
|
$ |
8,507 |
|
$ |
29,729 |
|
$ |
(79,759) |
|
$ |
(3,020) |
|
Interest expense (income) (1) |
|
|
3,747 |
|
|
1,614 |
|
|
(1,334) |
|
|
46,928 |
|
|
50,955 |
|
Income tax expense (benefit) |
|
|
535 |
|
|
(21) |
|
|
— |
|
|
743 |
|
|
1,257 |
|
Depreciation, depletion and amortization |
|
|
32,692 |
|
|
31,927 |
|
|
17,951 |
|
|
1,321 |
|
|
83,891 |
|
EBITDA |
|
$ |
75,477 |
|
$ |
42,027 |
|
$ |
46,346 |
|
$ |
(30,767) |
|
$ |
133,083 |
|
Accretion |
|
|
390 |
|
|
384 |
|
|
122 |
|
|
— |
|
|
896 |
|
Loss on debt financings |
|
|
— |
|
|
— |
|
|
— |
|
|
190 |
|
|
190 |
|
Tax receivable agreement expense (1) |
|
|
— |
|
|
— |
|
|
— |
|
|
1,525 |
|
|
1,525 |
|
Transaction costs |
|
|
9 |
|
|
— |
|
|
— |
|
|
3,884 |
|
|
3,893 |
|
Non-cash compensation |
|
|
— |
|
|
— |
|
|
— |
|
|
9,424 |
|
|
9,424 |
|
Other |
|
|
343 |
|
|
703 |
|
|
— |
|
|
(1,192) |
|
|
(146) |
|
Adjusted EBITDA (1) |
|
$ |
76,219 |
|
$ |
43,114 |
|
$ |
46,468 |
|
$ |
(16,936) |
|
$ |
148,865 |
|
Reconciliation of Net Income (Loss) to Adjusted EBITDA |
|
Six months ended July 2, 2016 |
|||||||||||||
|
by Segment |
|
West |
|
East |
|
Cement |
|
Corporate |
|
Consolidated |
|||||
|
(in thousands) |
|
|
|
|
|
|
|
|
|
|
|
|
|
|
|
|
Net income (loss) (1) |
|
$ |
25,456 |
|
$ |
11,712 |
|
$ |
20,572 |
|
$ |
(78,769) |
|
$ |
(21,029) |
|
Interest expense (1) |
|
|
4,531 |
|
|
3,898 |
|
|
3,500 |
|
|
35,265 |
|
|
47,194 |
|
Income tax expense (benefit) |
|
|
78 |
|
|
— |
|
|
— |
|
|
(9,300) |
|
|
(9,222) |
|
Depreciation, depletion and amortization |
|
|
31,743 |
|
|
22,412 |
|
|
13,506 |
|
|
1,277 |
|
|
68,938 |
|
EBITDA |
|
$ |
61,808 |
|
$ |
38,022 |
|
$ |
37,578 |
|
$ |
(51,527) |
|
$ |
85,881 |
|
Accretion |
|
|
479 |
|
|
329 |
|
|
22 |
|
|
— |
|
|
830 |
|
IPO/ Legacy equity modification costs |
|
|
— |
|
|
— |
|
|
— |
|
|
24,751 |
|
|
24,751 |
|
Transaction costs |
|
|
365 |
|
|
5 |
|
|
— |
|
|
3,236 |
|
|
3,606 |
|
Non-cash compensation |
|
|
— |
|
|
— |
|
|
— |
|
|
5,065 |
|
|
5,065 |
|
Other |
|
|
1,212 |
|
|
491 |
|
|
964 |
|
|
341 |
|
|
3,008 |
|
Adjusted EBITDA (1) |
|
$ |
63,864 |
|
$ |
38,847 |
|
$ |
38,564 |
|
$ |
(18,134) |
|
$ |
123,141 |
|
(1) |
The reconciliation of net income (loss) to Adjusted EBITDA is based on the financial results of Summit Inc. and its subsidiaries, which was $0.3 million and $0.5 million less than Summit LLC and its subsidiaries in the three and six months ended July 2, 2016, respectively, and $0.2 million and $0.5 million less in the three and six months ended July 1, 2017, respectively, due to interest expense associated with a deferred consideration obligation, which is an obligation of Summit Holdings and is thus excluded from Summit LLC’s consolidated interest expense. |
45
|
|
|
July 1, |
|
December 31, |
|
||
|
Reconciliation of Working Capital |
|
2017 |
|
2016 |
|
||
|
(in thousands) |
|
|
|
|
|
|
|
|
Total current assets |
|
$ |
825,059 |
|
$ |
483,698 |
|
|
Less total current liabilities |
|
|
(277,171) |
|
|
(239,288) |
|
|
Working capital |
|
$ |
547,888 |
|
$ |
244,410 |
|
|
|
|
Three months ended |
|
|
Six months ended |
|
||||||||
|
|
|
July 1, |
|
July 2, |
|
|
July 1, |
|
July 2, |
|
||||
|
Reconciliation of Operating Income to Adjusted Cash Gross Profit |
|
2017 |
|
2016 |
|
|
2017 |
|
2016 |
|
||||
|
($ in thousands) |
|
|
|
|
|
|
|
|
|
|
|
|
|
|
|
Operating Income |
|
$ |
82,444 |
|
$ |
46,948 |
|
|
$ |
49,660 |
|
$ |
17,491 |
|
|
General and administrative expenses |
|
|
58,086 |
|
|
75,490 |
|
|
|
116,554 |
|
|
120,860 |
|
|
Depreciation, depletion, amortization and accretion |
|
|
45,039 |
|
|
37,408 |
|
|
|
84,787 |
|
|
69,768 |
|
|
Transaction costs |
|
|
2,620 |
|
|
290 |
|
|
|
3,893 |
|
|
3,606 |
|
|
Adjusted Cash Gross Profit (exclusive of items shown separately) |
|
$ |
188,189 |
|
$ |
160,136 |
|
|
$ |
254,894 |
|
$ |
211,725 |
|
|
Adjusted Cash Gross Profit Margin (exclusive of items shown separately) (1) |
|
|
39.3 |
% |
|
38.8 |
% |
|
|
34.6 |
% |
|
34.1 |
% |
|
(1) |
Adjusted Cash Gross Margin, which we define as Adjusted Cash Gross Profit as a percentage of net revenue. |
46
ITEM 3.QUANTITATIVE AND QUALITATIVE DISCLOSURES ABOUT MARKET RISK
We are exposed to certain market risks arising from transactions that are entered into in the normal course of business. Our operations are highly dependent upon the interest rate-sensitive construction industry as well as the general economic environment. These marketplaces could experience lower levels of economic activity in an environment of rising interest rates or escalating costs. For a discussion of quantitative and qualitative disclosures about market risk, please refer to the Annual Report from which our exposure to market risk has not materially changed.
ITEM 4.CONTROLS AND PROCEDURES
Disclosure Controls and Procedures
Summit Inc.
Summit Inc. maintains disclosure controls and procedures (as such term is defined in Rules 13a-15(e) and 15d-15(e) under the Securities Exchange Act of 1934, as amended (the “Exchange Act”)), that are designed to ensure that information required to be disclosed in Summit Inc.’s reports under the Exchange Act, is recorded, processed, summarized and reported within the time periods specified in the SEC’s rules and forms, and that such information is accumulated and communicated to Summit Inc.’s management, including its Chief Executive Officer and Chief Financial Officer, as appropriate, to allow timely decisions regarding required disclosure. Any controls and procedures, no matter how well designed and operated, can provide only reasonable, not absolute, assurance of achieving the desired control objectives. Summit Inc.’s management, with the participation of its Chief Executive Officer and Chief Financial Officer, has evaluated the effectiveness of Summit Inc.’s disclosure controls and procedures as of July 1, 2017. Based upon that evaluation, Summit Inc.’s Chief Executive Officer and Chief Financial Officer concluded that, as of July 1, 2017, Summit Inc.’s disclosure controls and procedures were effective to accomplish their objectives at the reasonable assurance level.
Summit LLC
Summit LLC maintains disclosure controls and procedures (as such term is defined in Rules 13a-15(e) and 15d-15(e) under the Exchange Act) that are designed to ensure that information required to be disclosed in Summit LLC’s reports under the Exchange Act, is recorded, processed, summarized and reported within the time periods specified in the SEC’s rules and forms, and that such information is accumulated and communicated to Summit LLC’s management, including its Chief Executive Officer and Chief Financial Officer, as appropriate, to allow timely decisions regarding required disclosure. Any controls and procedures, no matter how well designed and operated, can provide only reasonable, not absolute, assurance of achieving the desired control objectives. Summit LLC’s management, with the participation of its Chief Executive Officer and Chief Financial Officer, has evaluated the effectiveness of Summit LLC’s disclosure controls and procedures as of July 1, 2017. Based upon that evaluation, Summit LLC’s Chief Executive Officer and Chief Financial Officer concluded that, as of July 1, 2017, Summit LLC’s disclosure controls and procedures were effective to accomplish their objectives at the reasonable assurance level.
Changes in Internal Control over Financial Reporting
Summit Inc.
There was no change in Summit Inc.’s internal control over financial reporting (as such term is defined in Rules 13a-15(f) and 15d-15(f) under the Exchange Act) that occurred during its last fiscal quarter that has materially affected, or is reasonably likely to materially affect, Summit Inc.’s internal control over financial reporting.
Summit LLC
There was no change in Summit LLC’s internal control over financial reporting (as such term is defined in Rules 13a-15(f) and 15d-15(f) under the Exchange Act) that occurred during its last fiscal quarter that has materially affected, or is reasonably likely to materially affect, Summit LLC’s internal control over financial reporting.
47
We are party to certain legal actions arising from the ordinary course of business activities. Accruals are recorded when the outcome is probable and can be reasonably estimated. While the ultimate results of claims and litigation cannot be predicted with certainty, management expects that the ultimate resolution of all current pending or threatened claims and litigation will not have a material effect on our results of operations, financial position or liquidity.
In addition to the other information set forth in this report, you should carefully consider the factors discussed in the section entitled “Risk Factors” in the Annual Report, which could materially affect the Company’s business, financial condition, operating results or liquidity or future results. The risks described in the Annual Report are not the only risks facing the Company. Additional risks and uncertainties not currently known to the Company or that it currently deems to be immaterial also may materially adversely affect its results of operations, financial condition or liquidity. There have been no material changes to the risk factors disclosed in the Annual Report.
ITEM 2.UNREGISTERED SALES OF EQUITY SECURITIES AND USE OF PROCEEDS
None.
ITEM 3.DEFAULTS UPON SENIOR SECURITIES
None.
ITEM 4.MINE SAFETY DISCLOSURES
The information concerning mine safety violations and other regulatory matters required by Section 1503(a) of the Dodd-Frank Wall Street Reform and Consumer Protection Act and Item 104 of Regulation S-K (17 CFR 229.104) is included in Exhibit 95.1 to this report.
None.
48
|
|
|
|
3.1 |
Amended and Restated Certificate of Incorporation of Summit Materials, Inc. (incorporated by reference to Exhibit 3.1 to Summit Materials, Inc.’s Current Report on Form 8-K filed on March 17, 2015). |
|
3.2 |
Amended and Restated Bylaws of Summit Materials, Inc. (incorporated by reference to Exhibit 3.2 to Summit Materials, Inc.’s Current Report on Form 8-K filed on March 17, 2015). |
|
3.3 |
Certificate of Formation of Summit Materials, LLC, as amended (incorporated by reference to Exhibit 3.1 to Summit Materials, LLC’s Registration Statement on Form S-4, filed March 27, 2013 (File No. 333-187556)). |
|
3.4 |
Amended and Restated Limited Liability Company Agreement of Summit Materials, LLC (incorporated by reference to Exhibit 3.2 to Summit Materials, LLC’s Registration Statement on Form S-4, filed March 27, 2013 (File No. 333-187556)). |
|
4.1 |
Indenture, dated as of June 1, 2017, by and among Summit Materials, LLC, Summit Materials Finance Corp., the subsidiary guarantors named on the signature pages thereto and Wilmington Trust, National Association, as trustee (incorporated by reference to Exhibit 4.1 to Summit Materials, Inc.’s Current Report on Form 8-K filed on June 1, 2017). |
|
4.2* |
First Supplemental Indenture, dated as of June 21, 2017, among Glasscock Company, Inc. and Glasscock Logistics Company, LLC and Wilmington Trust, National Association, as trustee. |
|
4.3 |
Form of 5.125% Senior Note due 2025 (included in Exhibit 4.1). |
|
4.4* |
Fifth Supplemental Indenture, dated as of June 21, 2017, among Glasscock Company, Inc. and Glasscock Logistics Company, LLC and Wilmington Trust, National Association, as trustee. |
|
4.5* |
Ninth Supplemental Indenture, dated as of June 21, 2017, among Glasscock Company, Inc. and Glasscock Logistics Company, LLC and Wilmington Trust, National Association, as trustee. |
|
10.1 |
Amendment No. 1, dated as of January 19, 2017 to the Amended and Restated Credit Agreement, dated as of July 17, 2015, among Summit Materials, LLC, as the borrower, the guarantors party thereto, the several banks and other financial institutions or entities from time to time party thereto, Bank of America, N.A., as administrative agent, collateral agent, L/C issuer and swing line lender and the other parties thereto (incorporated by reference to Exhibit 10.1 to Summit Materials, Inc.’s Current Report on Form 8-K filed on January 19, 2017). |
|
31.1* |
Summit Materials, Inc.’s Certification of the Chief Executive Officer pursuant to Rule 13a-14(a) or Rule 15d-14(a) of the Securities Exchange Act of 1934, as adopted pursuant to Section 302 of the Sarbanes-Oxley Act of 2002 |
|
31.2* |
Summit Materials, Inc.’s Certification of the Chief Financial Officer pursuant to Rule 13a-14(a) or Rule 15d-14(a) of the Securities Exchange Act of 1934, as adopted pursuant to Section 302 of the Sarbanes-Oxley Act of 2002. |
|
31.3* |
Summit Materials, LLC’s Certification of the Chief Executive Officer pursuant to Rule 13a-14(a) or Rule 15d-14(a) of the Securities Exchange Act of 1934, as adopted pursuant to Section 302 of the Sarbanes-Oxley Act of 2002. |
|
31.4* |
Summit Materials, LLC’s Certification of the Chief Financial Officer pursuant to Rule 13a-14(a) or Rule 15d-14(a) of the Securities Exchange Act of 1934, as adopted pursuant to Section 302 of the Sarbanes-Oxley Act of 2002. |
|
32.1** |
Summit Materials, Inc.’s Certification of the Chief Executive Officer pursuant to 18 U.S.C. Section 1350, as adopted pursuant to Section 906 of the Sarbanes-Oxley Act of 2002. |
|
32.2** |
Summit Materials, Inc.’s Certification of the Chief Financial Officer pursuant to 18 U.S.C. Section 1350, as adopted pursuant to Section 906 of the Sarbanes-Oxley Act of 2002. |
|
32.3** |
Summit Materials, LLC’s Certification of the Chief Executive Officer pursuant to 18 U.S.C. Section 1350, as adopted pursuant to Section 906 of the Sarbanes-Oxley Act of 2002. |
|
32.4** |
Summit Materials, LLC’s Certification of the Chief Financial Officer pursuant to 18 U.S.C. Section 1350, as adopted pursuant to Section 906 of the Sarbanes-Oxley Act of 2002. |
|
95.1* |
Mine Safety Disclosures |
|
99.1* |
Summit Materials, LLC’s Unaudited Consolidated Financial Statements and Notes to Unaudited Consolidated Financial Statements. |
|
101.INS* |
XBRL Instance Document |
49
|
101.SCH* |
XBRL Taxonomy Extension Schema Document |
|
101.CAL* |
XBRL Taxonomy Extension Calculation Linkbase Document |
|
101.DEF* |
XBRL Taxonomy Extension Definition Linkbase Document |
|
101.LAB* |
XBRL Taxonomy Extension Label Linkbase Document |
|
101.PRE* |
XBRL Taxonomy Extension Presentation Linkbase Document |
* Filed herewith
** Furnished herewith
The agreements and other documents filed as exhibits to this report are not intended to provide factual information or other disclosure other than with respect to the terms of the agreements or other documents themselves, and you should not rely on them for that purpose. In particular, any representations and warranties made by us in these agreements or other documents were made solely within the specific context of the relevant agreement or document and may not describe the actual state of affairs as of the date they were made or at any other time.
50
Pursuant to the requirements of the Securities Exchange Act of 1934, the registrants have duly caused this report to be signed on their behalf by the undersigned, thereunto duly authorized.
|
|
|
SUMMIT MATERIALS, INC. |
|
|
|
|
SUMMIT MATERIALS, LLC |
|
|
|
|
|
|
|
Date: August 4, 2017 |
|
By: |
/s/ Thomas W. Hill |
|
|
|
|
Thomas W. Hill |
|
|
|
|
Chief Executive Officer |
|
|
|
|
(Principal Executive Officer) |
|
|
|
|
|
|
Date: August 4, 2017 |
|
By: |
/s/ Brian J. Harris |
|
|
|
|
Brian J. Harris |
|
|
|
|
Chief Financial Officer |
|
|
|
|
(Principal Financial and Accounting Officer) |
51