Attached files
| file | filename |
|---|---|
| EX-2.1 - EXHIBIT 2.1 - PBF Holding Co LLC | exhibit21-chalmettesaleand.htm |
| EX-99.1 - EXHIBIT 99.1 - PBF Holding Co LLC | exhibit991-chalmetteacquis.htm |
| 8-K - 8-K - PBF Holding Co LLC | a8-kxchalmetteacquisition.htm |

PBF Energy (NYSE: PBF) Acquisition of Chalmette Refining, LLC June 18, 2015

2 Safe Harbor Statements Statements in this presentation relating to future plans, results, performance, expectations, achievements and the like are considered “forward-looking statements” within the meaning of the Private Securities Litigation Reform Act of 1995. These forward-looking statements include, without limitation, the company’s expectations with respect to timing of the completion of the proposed acquisition; the acquisition highlights and financial overview, including the impact on the company’s earnings; the company’s post-acquisition plans, objectives, expectations and intentions with respect to future earnings and operations, including with respect to any MLP-qualifying assets; the company’s plans for financing the proposed acquisition; and the conditions to the closing of the proposed acquisition and the possibility that the proposed acquisition will not close. These forward-looking statements involve known and unknown risks, uncertainties and other factors, many of which may be beyond the company's control, that may cause actual results to differ materially from any future results, performance or achievements expressed or implied by the forward-looking statements. Factors and uncertainties that may cause actual results to differ include but are not limited to the risks described above, and the risks disclosed in the company’s 2014 Annual Report on Form 10-K and quarterly reports on Form 10-Q and other filings with the SEC. All forward-looking statements speak only as of the date hereof. The company undertakes no obligation to revise or update any forward-looking statements except as may be required by applicable law.

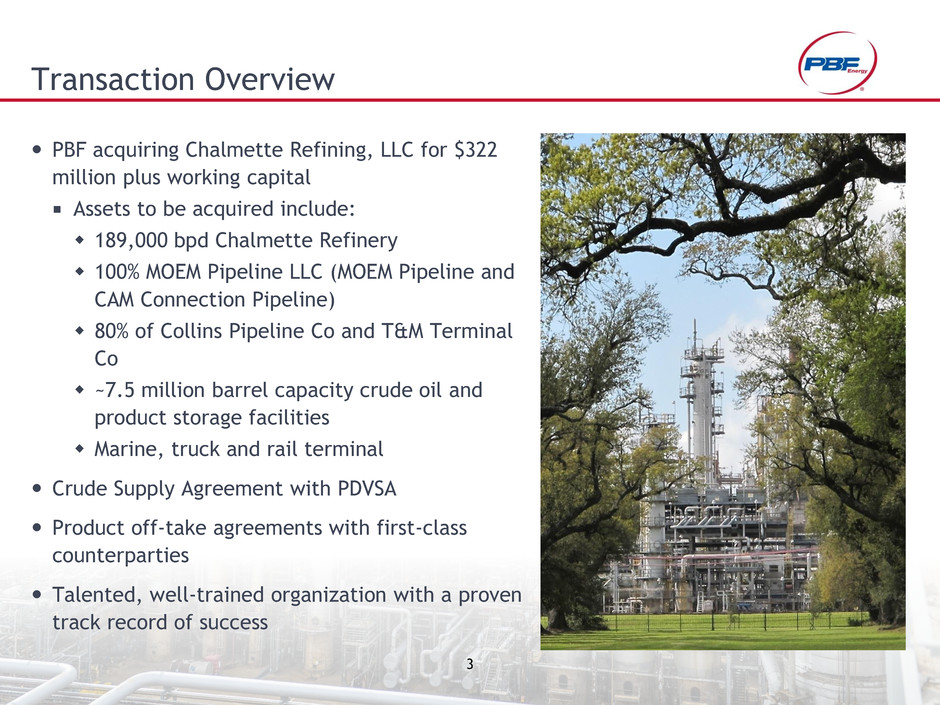
3 Transaction Overview PBF acquiring Chalmette Refining, LLC for $322 million plus working capital Assets to be acquired include: 189,000 bpd Chalmette Refinery 100% MOEM Pipeline LLC (MOEM Pipeline and CAM Connection Pipeline) 80% of Collins Pipeline Co and T&M Terminal Co ~7.5 million barrel capacity crude oil and product storage facilities Marine, truck and rail terminal Crude Supply Agreement with PDVSA Product off-take agreements with first-class counterparties Talented, well-trained organization with a proven track record of success

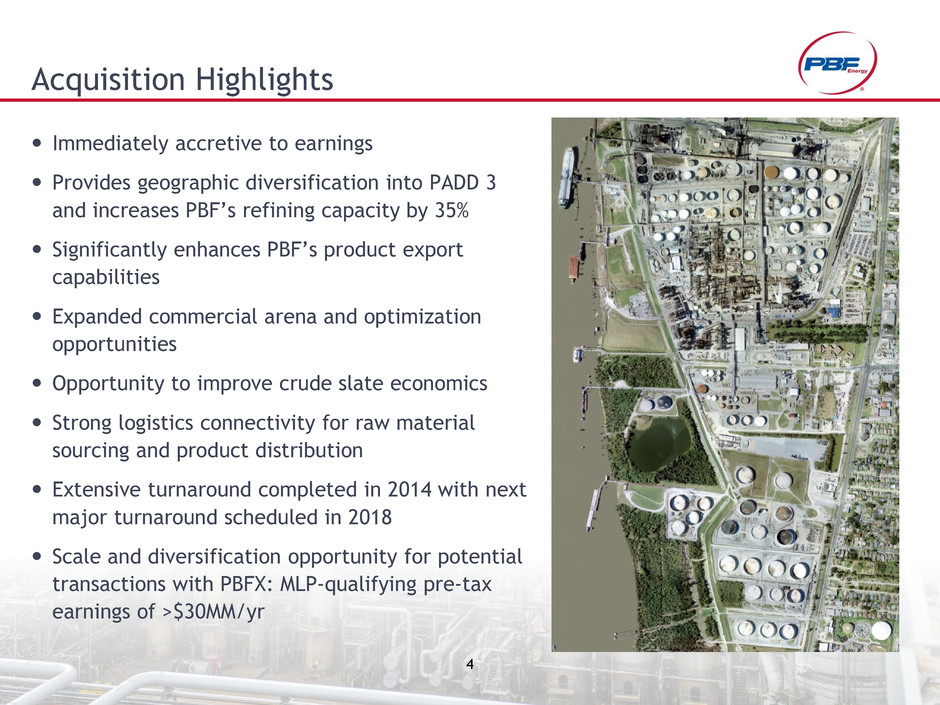
4 Acquisition Highlights Immediately accretive to earnings Provides geographic diversification into PADD 3 and increases PBF’s refining capacity by 35% Significantly enhances PBF’s product export capabilities Expanded commercial arena and optimization opportunities Opportunity to improve crude slate economics Strong logistics connectivity for raw material sourcing and product distribution Extensive turnaround completed in 2014 with next major turnaround scheduled in 2018 Scale and diversification opportunity for potential transactions with PBFX: MLP-qualifying pre-tax earnings of >$30MM/yr

5 Financial Overview $322 million purchase price for Chalmette Refining, LLC assets ~$30 million of MLP-able pre-tax earnings Purchase funded with a combination of cash and debt Inventory financing of $300 to $500 million Immediately accretive transaction(1) EBITDA Contribution: ~$160 million in year one Earnings per share Contribution: ~$0.70 per share ___________________________ 1. Based on historical data and company estimates and a fully-diluted share count of approximately 92 million shares

6 Precedent Transactions: $/Complexity-Barrel $0 $200 $400 $600 $800 $1,000 $1,200 $1,400 $1,600 $1,800 R e fi n e ry Co st , $ /Com p le x it y -B a rr e l

7 7 PBF’s Growing Industry Position 2,540 2,231 1,644 917 729 443 210 185 151 140 74 VLO PSX MPC TSO PBF HFC ALJ CVI WNR DK NTI Total Throughput Capacity (kbpd) Average Complexity: 12.4 11.0 11.7 10.2 11.7 12.1 11.5 9.5 9.5 8.5 11.5 Refinery Region Capacity (bpd) Delaware City PADD 1 190,000 Chalmette PADD 3 189,000 Paulsboro PADD 1 180,000 Toledo PADD 2 170,000 Combined 729,000 High-quality, diversified asset base with weighted-average Nelson Complexity of 11.7 Exposure to Gulf Coast, Mid-continent and East Coast Markets Increased opportunity to optimize three complex coastal refineries capable of running light and heavy crudes from domestic and international suppliers

8 Increasing Stakeholder Value Operate safely and efficiently Maintain capital discipline and conservative balance sheets Invest in revenue improvement projects Grow through strategic acquisitions Return cash to investors

9 Appendix

10 Non-GAAP Financial Measures Our management uses EBITDA (earnings before interest, income taxes, depreciation and amortization) as a measure of operating performance to assist in comparing performance from period to period on a consistent basis and to readily view operating trends, as a measure for planning and forecasting overall expectations and for evaluating actual results against such expectations, and in communications with our board of directors, creditors, analysts and investors concerning our financial performance. EBITDA is not a presentation made in accordance with GAAP and our computation of EBITDA may vary from others in our industry. EBITDA should not be considered as an alternative to operating income or net income as a measure of operating performance. In addition, EBITDA is not presented as, and should not be considered, an alternative to cash flows from operations as a measure of liquidity. EBITDA also has limitations as an analytical tool and should not be considered in isolation, or as a substitute for analysis of our results as reported under GAAP. millions (except where noted) Chalmette Refining, LLC Projected FY1 Net Income $66 Add: Depreciation and amortization expense 15 Add: Interest expense 35 Add: Income tax expense 44 EBITDA $160 Estimated fully-converted shares outstanding – diluted 92* Estimated adjusted, fully-converted net income per share – diluted $0.72 * Represents weighted-average diluted shares outstanding assuming the full exchange of common stock equivalents, including options and warrants for PBF LLC Series A Units and options for shares of PBF Energy Class A common stock as calculated under the treasury stock method.

11 Greater New Orleans Refineries Valero St. Charles Motiva Norco Motiva Convent Motiva Convent Marathon Garyville Motiva Convent Valero St. Charles Motiva Norco Chalmette Valero Meraux Phillips 66 Alliance

1 2
