Attached files
| file | filename |
|---|---|
| 8-K - 8-K - SM Energy Co | a15-14100_18k.htm |
| EX-99.1 - EX-99.1 - SM Energy Co | a15-14100_1ex99d1.htm |
Exhibit 99.2
|
|
June 2015 Presentation |
|
|
Forward Looking Statements - Cautionary Language Except for historical information contained herein, statements in this presentation, including information regarding the business of the Company, contain forward looking statements within the meaning of securities laws, including forecasts and projections. The words “anticipate,” “assume,” “believe,” “budget,” “estimate,” “expect,” “forecast,” “intend,” “plan,” “project,” “will,” and similar expressions are intended to identify forward looking statements. These statements involve known and unknown risks, which may cause SM Energy's actual results to differ materially from results expressed or implied by the forward looking statements. These risks include factors such as the availability, proximity, and capacity of gathering, processing and transportation facilities; the uncertainty of negotiations to result in an agreement or a completed transaction; the uncertain nature of announced acquisition, divestiture, joint venture, farm down, or similar efforts and the ability to complete any such transactions; the uncertain nature of expected benefits from the actual or expected acquisition, divestiture, joint venture, farm down, or similar efforts; the volatility and level of oil, natural gas, and natural gas liquids prices and realizations; uncertainties inherent in projecting future rates of production from drilling activities and acquisitions; the imprecise nature of estimating oil and gas reserves; the availability of additional economically attractive exploration, development, and acquisition opportunities for future growth and any necessary financings; unexpected drilling conditions and results; unsuccessful exploration and development drilling results; the availability of drilling, completion, and operating equipment and services; the risks associated with the Company's commodity price risk management strategy; uncertainty regarding the ultimate impact of potentially dilutive securities; and other such matters discussed in the “Risk Factors” section of SM Energy's 2014 Annual Report on Form 10-K, as such risk factors may be updated from time to time in the Company’s other periodic reports filed with the Securities and Exchange Commission. The forward looking statements contained herein speak as of the date of this announcement. Although SM Energy may from time to time voluntarily update its prior forward looking statements, it disclaims any commitment to do so except as required by securities laws. . 2 |
|
|
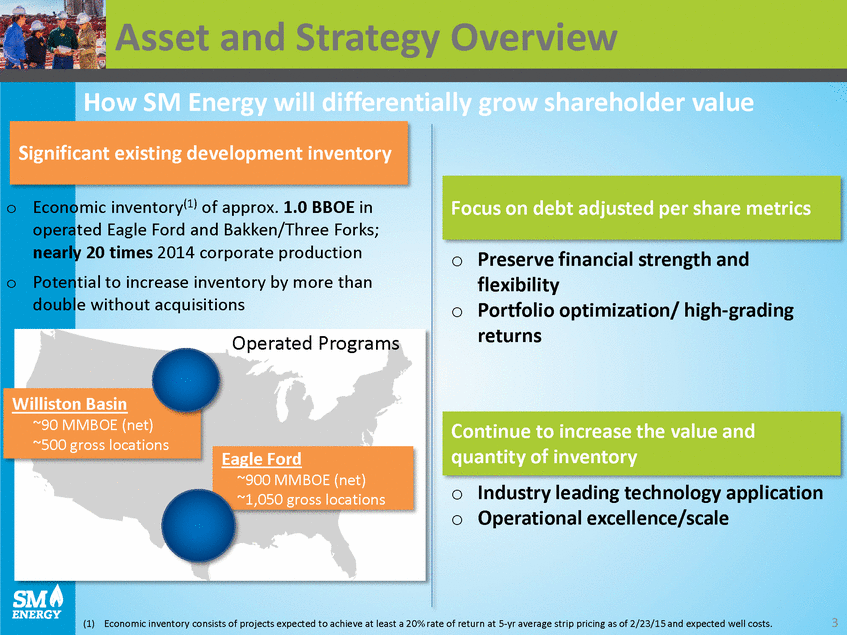
Asset and Strategy Overview How SM Energy will differentially grow shareholder value Economic inventory(1) of approx. 1.0 BBOE in operated Eagle Ford and Bakken/Three Forks; nearly 20 times 2014 corporate production Potential to increase inventory by more than double without acquisitions o o Preserve financial strength and flexibility Portfolio optimization/ high-grading returns o o Operated Programs Williston Basin ~90 MMBOE (net) ~500 gross locations o o Industry leading technology application Operational excellence/scale 3 (1) Economic inventory consists of projects expected to achieve at least a 20% rate of return at 5-yr average strip pricing as of 2/23/15 and expected well costs. Eagle Ford ~900 MMBOE (net) ~1,050 gross locations Continue to increase the value and quantity of inventory Focus on debt adjusted per share metrics Significant existing development inventory |
|
|
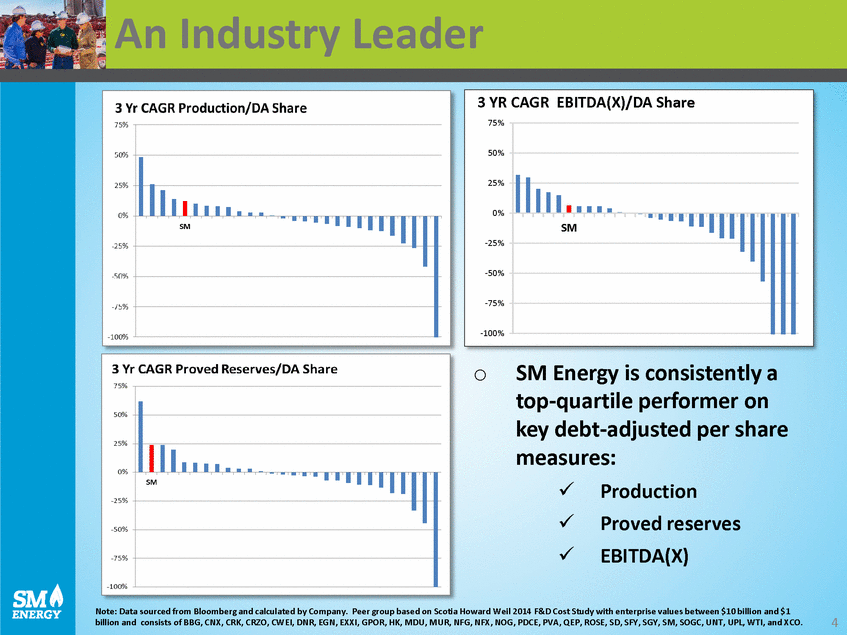
An Industry Leader o SM Energy is consistently a top-quartile performer on key debt-adjusted per share measures: Production Proved reserves EBITDA(X) Note: Data sourced from Bloomberg and calculated by Company. Peer group based on Scotia Howard Weil 2014 F&D Cost Study with enterprise values between $10 billion and $1 billion and consists of BBG, CNX, CRK, CRZO, CWEI, DNR, EGN, EXXI, GPOR, HK, MDU, MUR, NFG, NFX, NOG, PDCE, PVA, QEP, ROSE, SD, SFY, SGY, SM, SOGC, UNT, UPL, WTI, and XCO. 4 3 YR CAGR EBITDA(X)/DA Share 75% 50% 25% 0% -25% -50% -75% -100% SM |
|
|
Strong Balance Sheet o Total Debt – currently 1.7x TTM EBITDAX; expected to be ~2.3x at YE15 Liquidity – Borrowing base maintained at $2.4 billion Maturities – None until 2021 (ex-revolver) PRO-FORMA* DEBT MATURITIES AS OF MARCH 31, 2015 o o (in millions) $2,500 $2,000 $1,500 $1,000 $500 $0 2015 2016 2017 2018 2019 2020 2021 2022 2023 2024 2025 * Pro-Forma assumes $270 million in proceeds from Arkoma Basin divestiture, $500 million of senior notes issued in May 2015, and completed tender and redemption of all outstanding senior notes due in 2019. 5 Borrowing Base - $2.4 billion $21 million drawn |
|
|
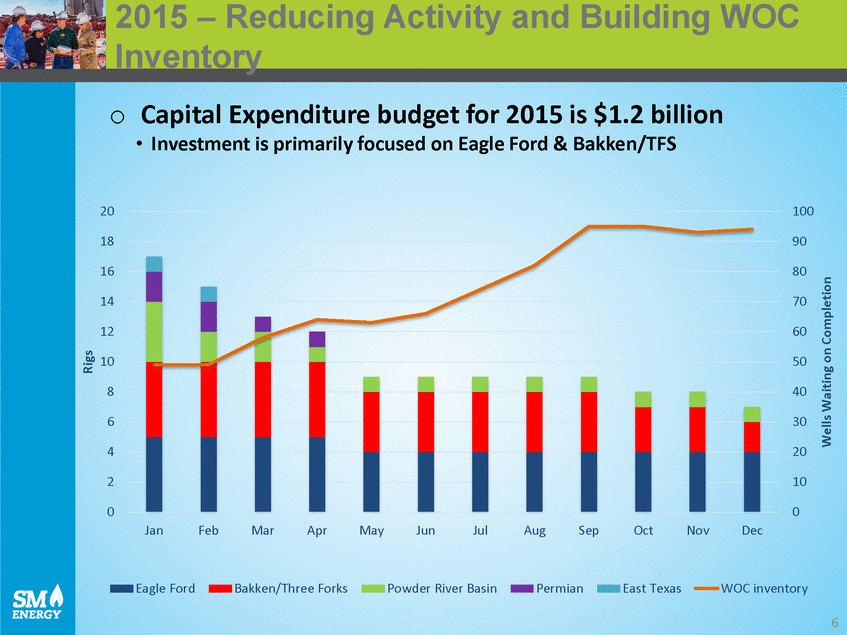
2015 – Reducing Activity and Building WOC Inventory o Capital Expenditure budget for 2015 is $1.2 billion • Investment is primarily focused on Eagle Ford & Bakken/TFS 20 100 18 90 16 80 14 70 12 60 10 50 8 40 6 30 4 20 2 10 0 0 Jan Feb Mar Apr May Jun Jul Aug Sep Oct Nov Dec Eagle Ford Bakken/Three Forks Powder River Basin Permian East Texas WOC inventory 6 Rigs Wells Waiting on Completion |
|
|
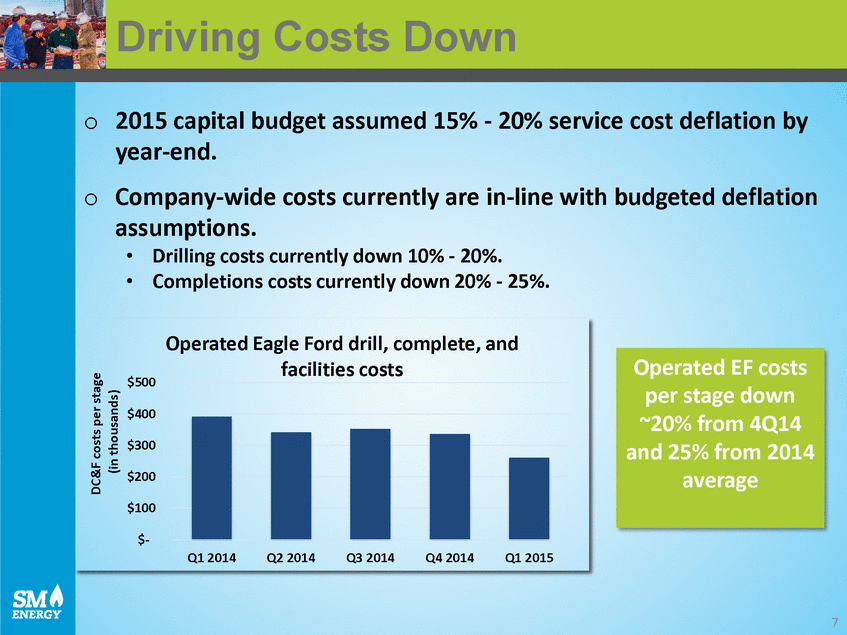
DrivingCosts Down o 2015 capital budget assumed 15% - 20% service cost deflation by year-end. o Company-wide costs currently are in-line with assumptions. budgeted deflation • • Drilling costs currently down 10% - 20%. Completions costs currently down 20% - 25%. Operated Eagle Ford drill, complete, and facilities costs $500 $400 $300 $200 $100 $-Q1 2014 Q2 2014 Q3 2014 Q4 2014 Q1 2015 7 DC&F costs per stage (in thousands) Operated EF costs per stage down ~20% from 4Q14 and 25% from 2014 average |
|
|
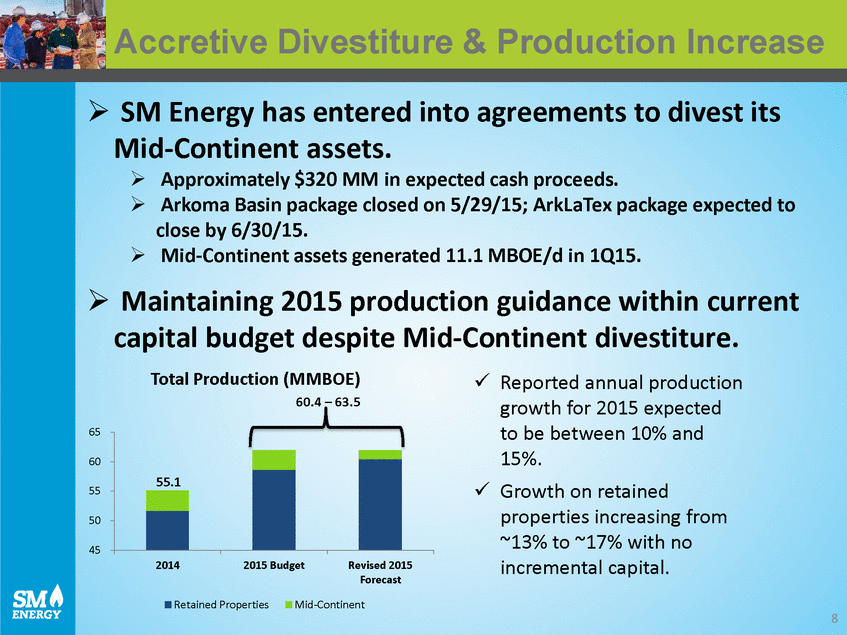
Accretive Divestiture & Production Increase SM Energy has entered into agreements to divest its Mid-Continent assets. Approximately $320 MM in expected cash proceeds. Arkoma Basin package closed on 5/29/15; ArkLaTex package expected to close by 6/30/15. Mid-Continent assets generated 11.1 MBOE/d in 1Q15. Maintaining 2015 production guidance within current capital budget despite Total Production (MMBOE) 60.4 – 63.5 Mid-Continent divestiture. Reported annual production growth for 2015 expected to be between 10% and 15%. Growth on retained properties increasing from ~13% to ~17% with no incremental capital. 65 60 55 50 45 2014 2015 Budget Revised 2015 Forecast Retained Properties Mid-Continent 8 55.1 |
|
|
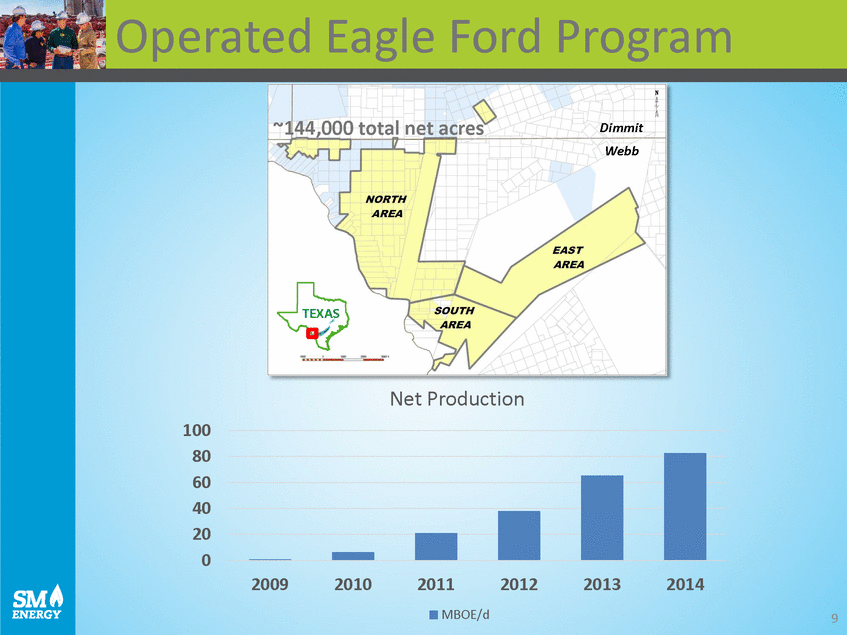
Operated EagleFord Program ~144,000 total net acres Dimmit Webb TEXAS Net Production 100 80 60 40 20 0 2009 2010 2011 2012 2013 2014 MBOE/d 9 |
|
|
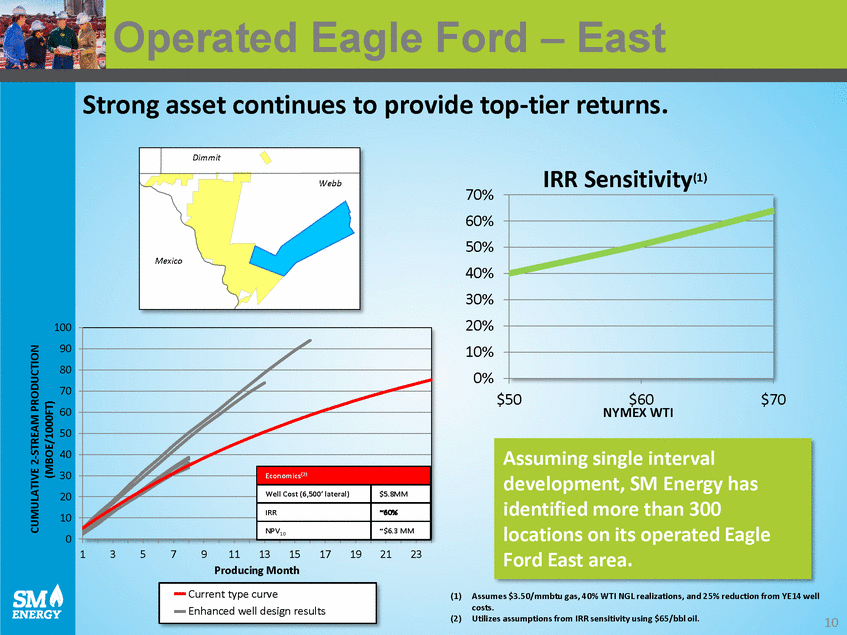
OperatedEagleFord– East Strong asset continues to provide top-tier returns. IRR Sensitivity(1) 70% 60% 50% 40% 30% 20% 10% 0% 100 90 80 70 60 50 40 30 20 10 0 $50 $60 NYMEX WTI $70 1 3 5 7 911 13 15 17 19 21 23 Producing Month (1) Assumes $3.50/mmbtu gas, 40% WTI NGL realizations, and 25% reduction from YE14 well costs. (2) Utilizes assumptions from IRR sensitivity using $65/bbl oil. 10 CUMULATIVE 2-STREAM PRODUCTION (MBOE/1000FT) Current type curve Enhanced well design results Assuming single interval development, SM Energy has identified more than 300 locations on its operated Eagle Ford East area. Economics(2) Well Cost (6,500’ lateral) $5.8MM IRR ~60% NPV10 ~$6.3 MM Dimmit Webb Mexico |
|
|
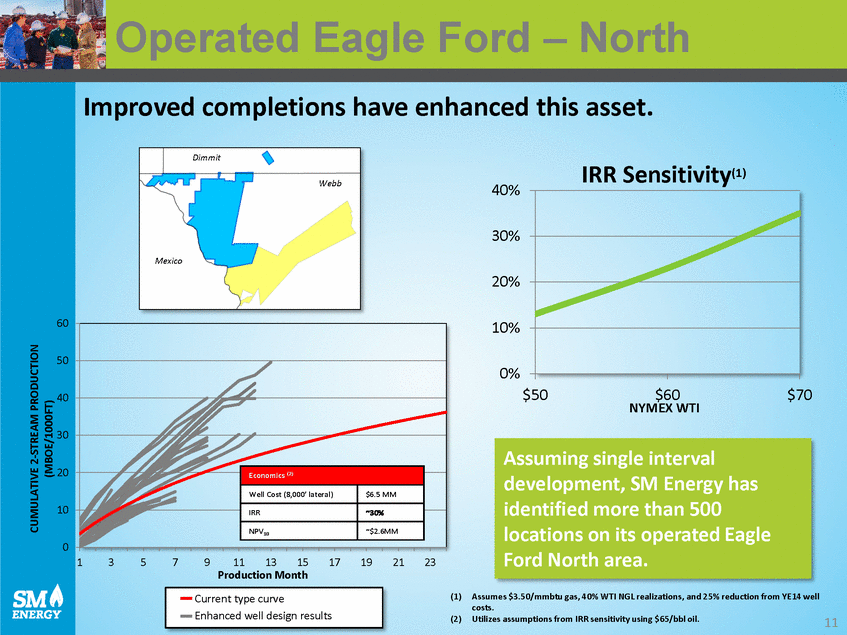
OperatedEagleFord– North Improved completions have enhanced this asset. IRR Sensitivity(1) 40% 30% 20% 60 10% 50 0% $50 $60 NYMEX WTI $70 40 30 20 10 0 1 3 5 7 911 13 15 17 19 21 23 Production Month (1) Assumes $3.50/mmbtu gas, 40% WTI NGL realizations, and 25% reduction from YE14 well costs. (2) Utilizes assumptions from IRR sensitivity using $65/bbl oil. 11 CUMULATIVE 2-STREAM PRODUCTION (MBOE/1000FT) Current type curve Enhanced well design results Assuming single interval development, SM Energy has identified more than 500 locations on its operated Eagle Ford North area. Economics (2) Well Cost (8,000’ lateral) $6.5 MM IRR ~30% NPV10 ~$2.6MM Dimmit Webb Mexico |
|
|
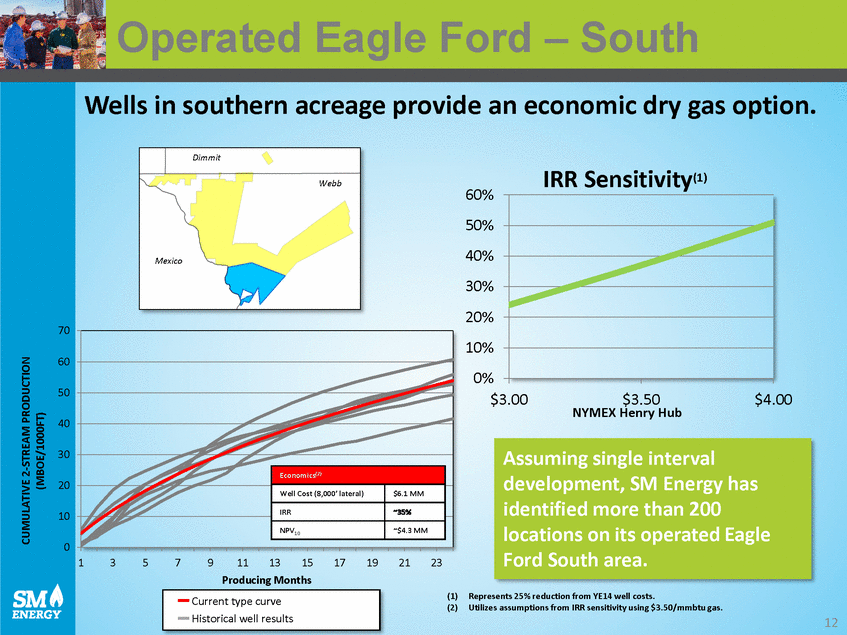
OperatedEagleFord– South Wells in southern acreage provide an economic dry gas option. IRR Sensitivity(1) 60% 50% 40% 30% 20% 10% 0% 70 60 50 $3.00 $3.50 NYMEX Henry Hub $4.00 40 30 20 10 0 1 3 5 7 911 13 15 17 19 21 23 Producing Months (1) Represents 25% reduction from YE14 well costs. (2) Utilizes assumptions from IRR sensitivity using $3.50/mmbtu gas. 12 CUMULATIVE 2-STREAM PRODUCTION (MBOE/1000FT) Current type curve Historical well results Assuming single interval development, SM Energy has identified more than 200 locations on its operated Eagle Ford South area. Economics(2) Well Cost (8,000’ lateral) $6.1 MM IRR ~35% NPV10 ~$4.3 MM Dimmit Webb Mexico |
|
|
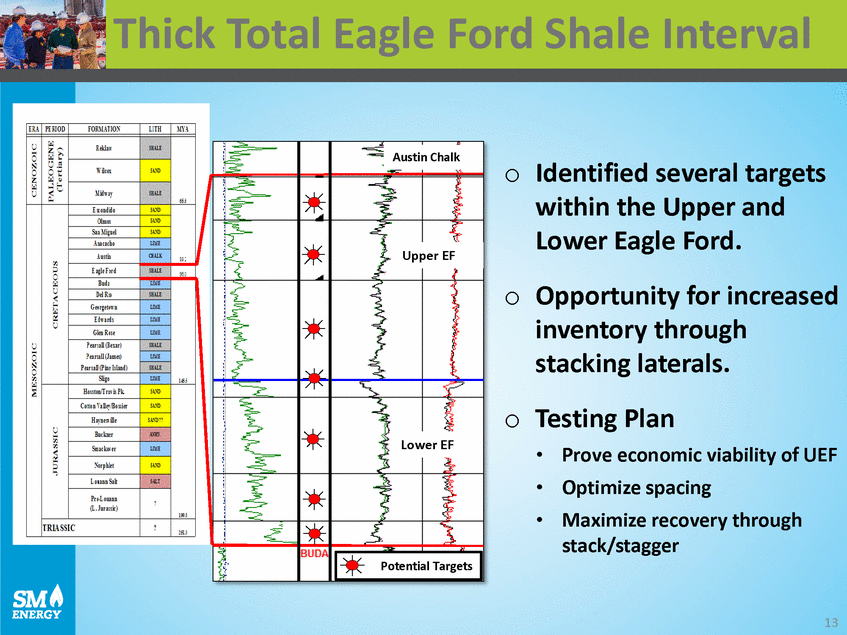
Thick Total Eagle Ford Shale Interval o Identified several targets within the Upper and Lower Eagle Ford. Opportunity for increased inventory through stacking laterals. Testing Plan o o • • • Prove economic viability of UEF Optimize spacing Maximize recovery through stack/stagger 13 Austin Chalk Upper EF Lower EF Potential Targets |
|
|
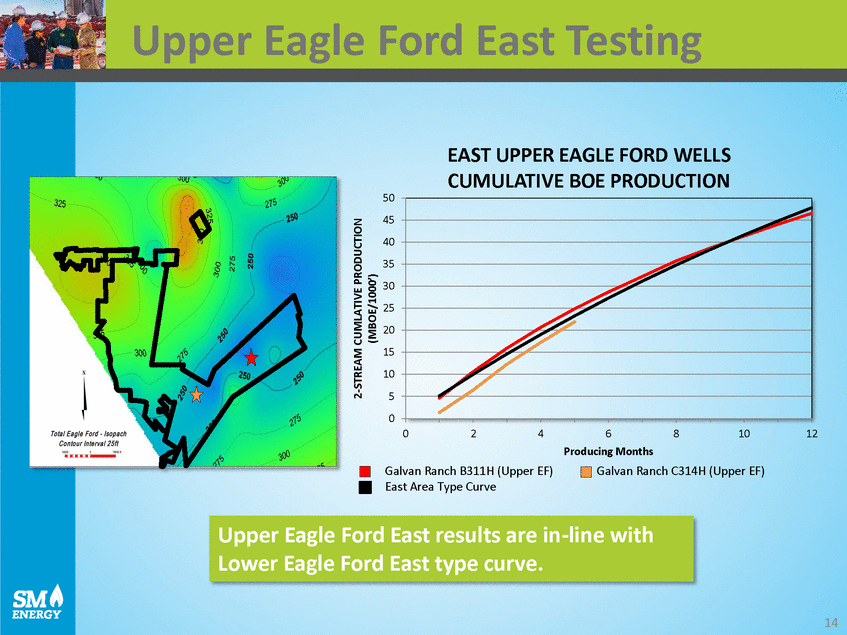
Upper Eagle Ford East Testing EAST UPPER EAGLE FORD WELLS CUMULATIVE BOE PRODUCTION 50 45 40 35 30 25 20 15 10 5 0 0 2 4 6 Producing Months 8 10 12 Galvan Ranch B311H (Upper EF) East Area Type Curve Galvan Ranch C314H (Upper EF) 14 2-STREAM CUMLATIVE PRODUCTION (MBOE/1000’) Upper Eagle Ford East results are in-line with Lower Eagle Ford East type curve. |
|
|
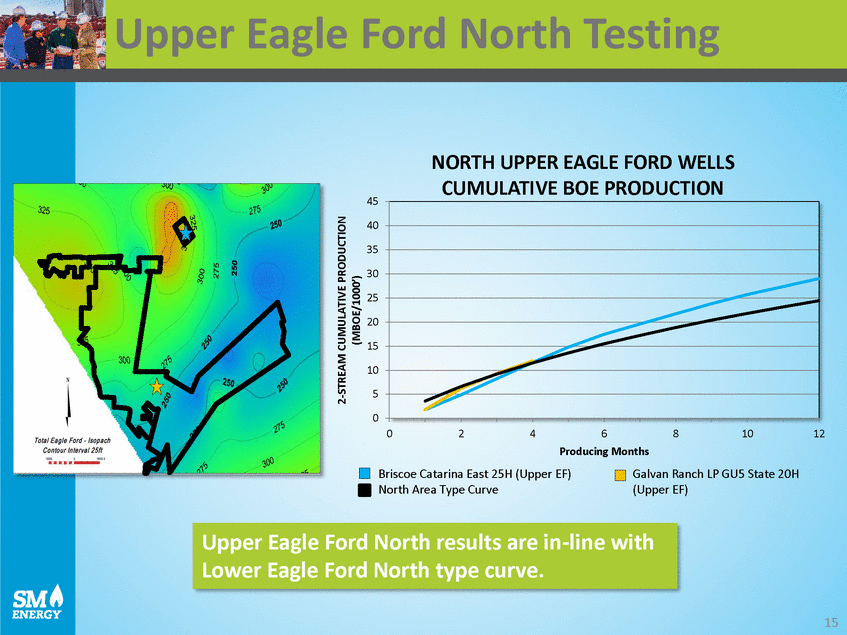
Upper Eagle Ford North Testing NORTH UPPER EAGLE FORD WELLS CUMULATIVE BOE PRODUCTION 45 40 35 30 25 20 15 10 5 0 0 2 4 6 Producing Months 8 10 12 Briscoe Catarina East 25H (Upper EF) North Area Type Curve Galvan Ranch LP GU5 State 20H (Upper EF) 15 2-STREAM CUMULATIVE PRODUCTION (MBOE/1000’) Upper Eagle Ford North results are in-line with Lower Eagle Ford North type curve. |
|
|
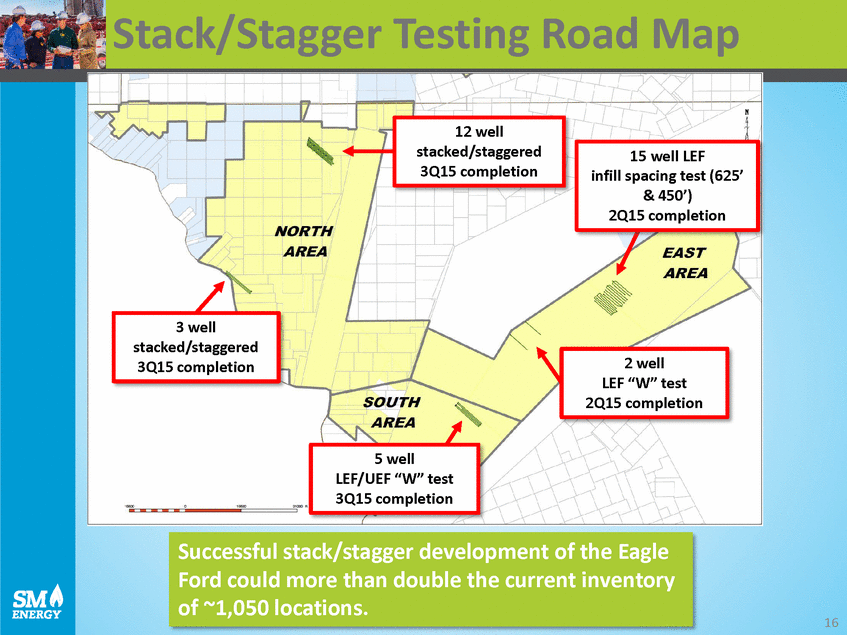
Stack/Stagger Testing Road Map infill spacing test (625’ LEF “W” test 16 Successful stack/stagger development of the Eagle Ford could more than double the current inventory of ~1,050 locations. 5 well LEF/UEF “W” test 3Q15 completion 2 well 2Q15 completion 3 well stacked/staggered 3Q15 completion 15 well LEF & 450’) 2Q15 completion 12 well stacked/staggered 3Q15 completion |
|
|
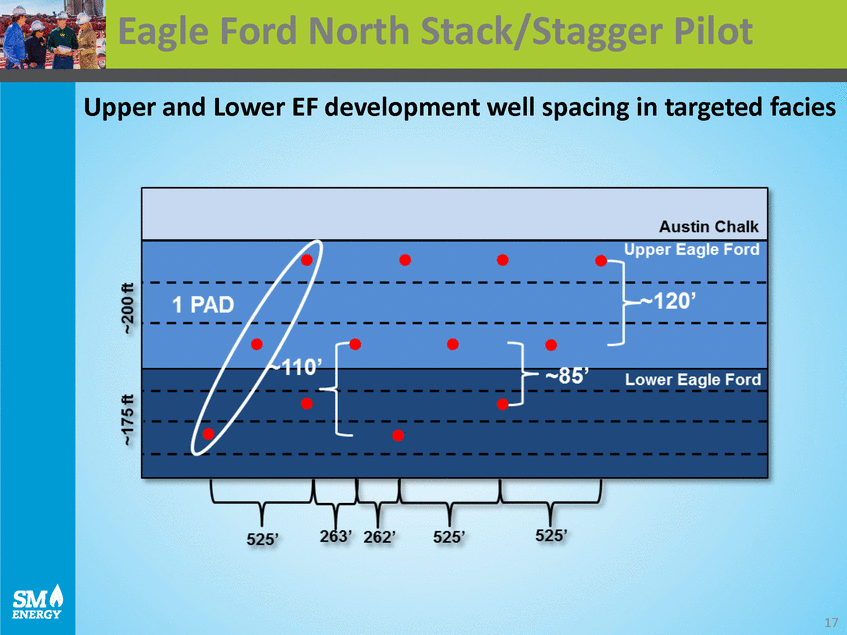
Eagle Ford North Stack/Stagger Pilot Upper and Lower EF development well spacing in targeted facies AD ~70’ 525’ 263’ 262’ 525’ 525’ 17 ~175 ft ~200 ft Austin Chalk Upper Eagle Ford 1 P 1 PAD~120’ ~120’ ~85’ ~85’Lower Eagle Ford |
|
|
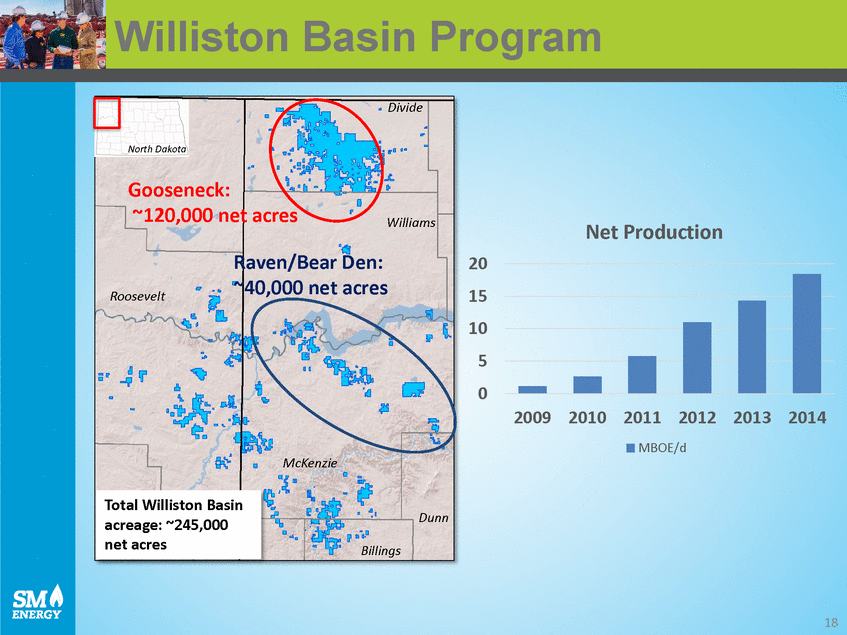
Williston Basin Program Net Production 20 15 10 5 0 2009 2010 2011 2012 2013 2014 MBOE/d Dunn acreage: ~245,000 18 Sh eridanDivide North Dakota Gooseneck: ~120,000 net acresWilliams Raven/Bear Den: Roosevelt~40,000 net acres McKenzie Total Williston Basin net acresBillings |
|
|
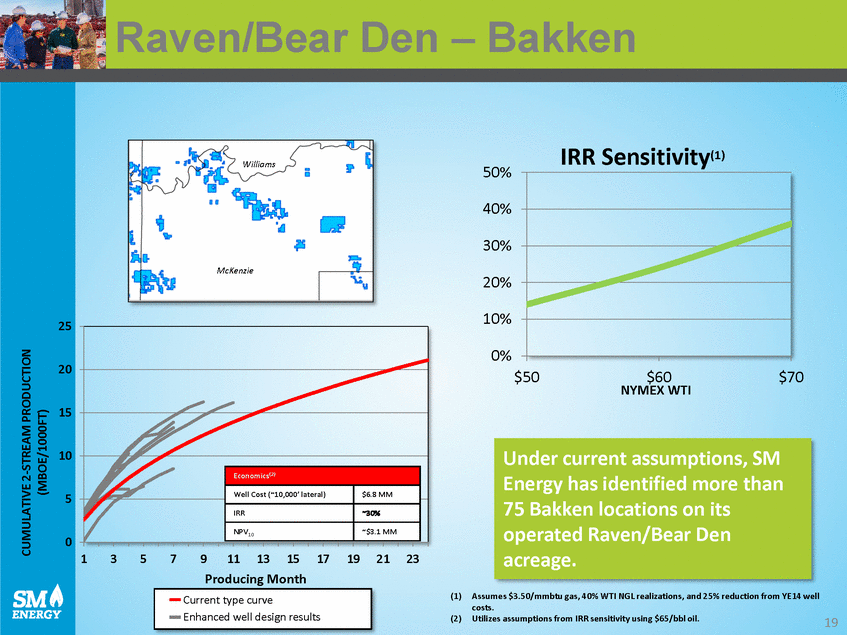
Raven/Bear Den – Bakken IRR Sensitivity(1) 50% 40% 30% 20% 10% 25 0% 20 $50 $60 NYMEX WTI $70 15 10 5 0 1 3 5 7 9 11 13 1517 19 21 23 Producing Month (1) Assumes $3.50/mmbtu gas, 40% WTI NGL realizations, and 25% reduction from YE14 well costs. (2) Utilizes assumptions from IRR sensitivity using $65/bbl oil. 19 CUMULATIVE 2-STREAM PRODUCTION (MBOE/1000FT) Current type curve Enhanced well design results Under current assumptions, SM Energy has identified more than 75 Bakken locations on its operated Raven/Bear Den acreage. Economics(2) Well Cost (~10,000’ lateral) $6.8 MM IRR ~30% NPV10 ~$3.1 MM Williams McKenzie |
|
|
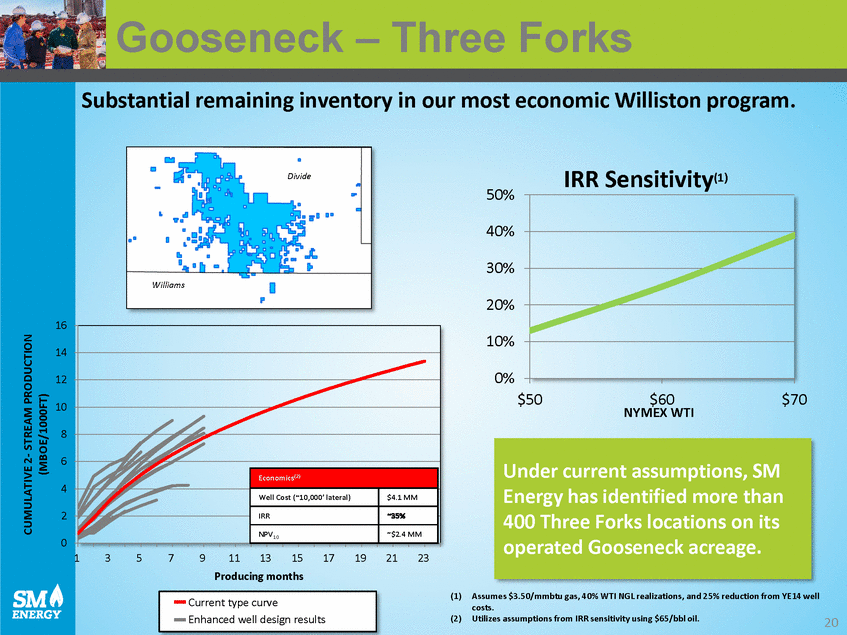
Gooseneck–ThreeForks Substantial remaining inventory in our most economic Williston program. IRR Sensitivity(1) 50% 40% 30% 20% 16 10% 14 0% 12 $50 $60 NYMEX WTI $70 10 8 6 4 2 0 1 3 5 7 911 13 15 17 19 21 23 Producing months (1) Assumes $3.50/mmbtu gas, 40% WTI NGL realizations, and 25% reduction from YE14 well costs. (2) Utilizes assumptions from IRR sensitivity using $65/bbl oil. 20 CUMULATIVE 2-STREAM PRODUCTION (MBOE/1000FT) Current type curve Enhanced well design results Under current assumptions, SM Energy has identified more than 400 Three Forks locations on its operated Gooseneck acreage. Economics(2) Well Cost (~10,000’ lateral) $4.1 MM IRR ~35% NPV10 ~$2.4 MM Divide Williams |
|
|
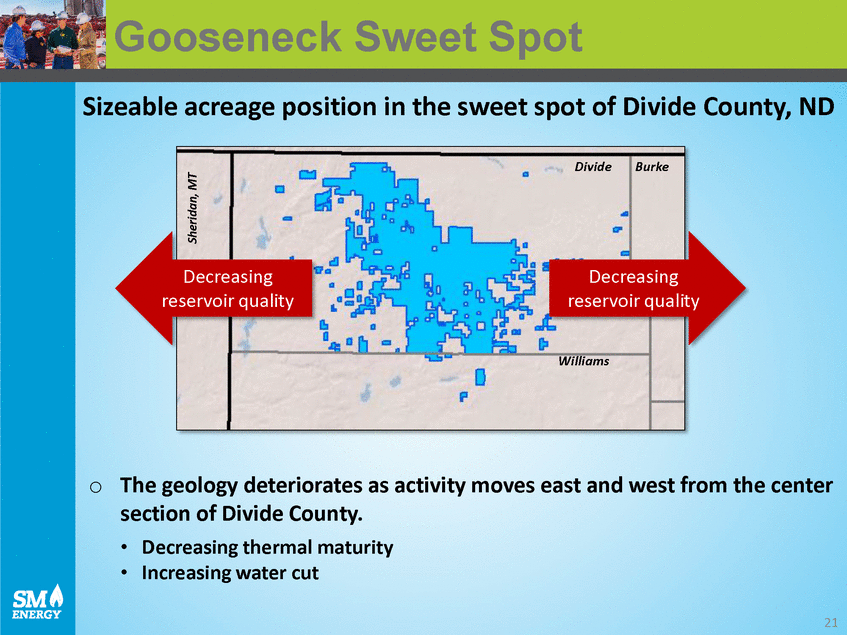
GooseneckSweetSpot Sizeable acreage position in the sweet spot of Divide County, ND reservoir quality reservoir quality o The geology deteriorates as activity moves east and west from the center section of Divide County. •Decreasing thermal maturity •Increasing water cut 21 Sheridan, MT DivideBurke DecreasingDecreasing Williams |
|
|
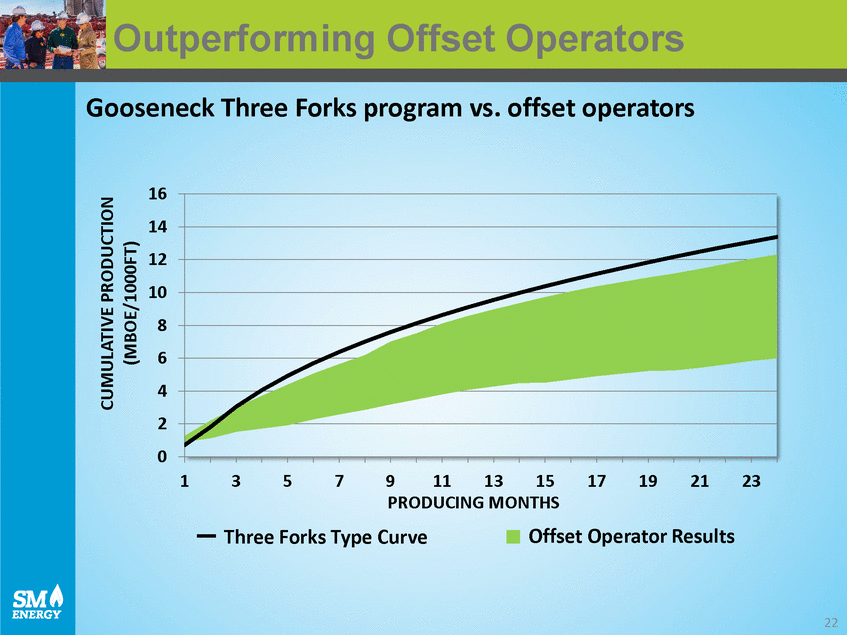
Outperforming Offset Operators Gooseneck Three Forks program vs. offset operators 16 14 12 10 8 6 4 2 0 1 3 5 7 9 11 13 15 17 19 21 23 PRODUCING MONTHS Offset Operator Results Three Forks Type Curve 22 CUMULATIVE PRODUCTION (MBOE/1000FT) |
|
|
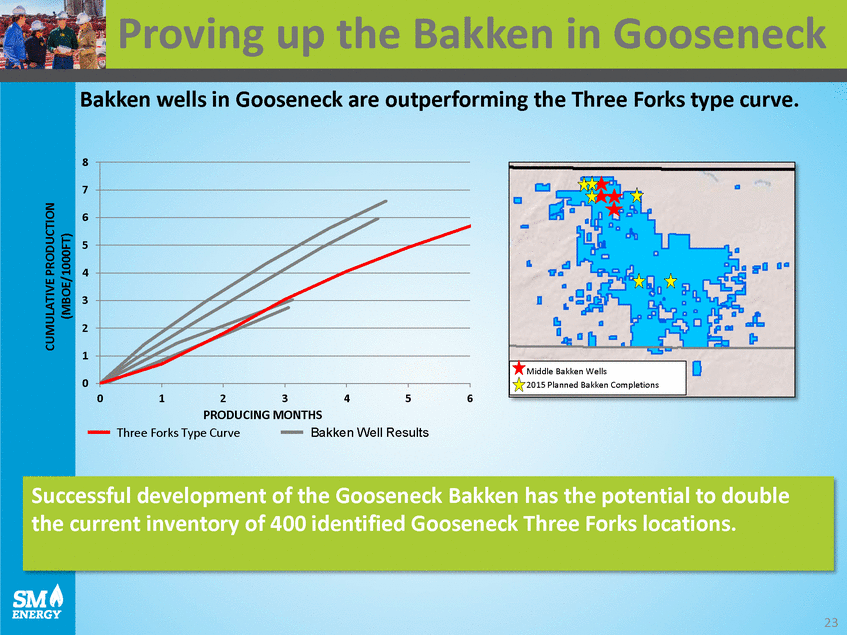
Proving up the Bakken in Gooseneck Bakken wells in Gooseneck are outperforming the Three Forks type curve. 8 7 6 5 4 3 2 1 0 0 1 2 3 4 5 6 PRODUCING MONTHS Three Forks Type Curve Bakken Well Results 23 CUMULATIVE PRODUCTION (MBOE/1000FT) Successful development of the Gooseneck Bakken has the potential to double the current inventory of 400 identified Gooseneck Three Forks locations. Middle Bakken Wells 2015 Planned Bakken Completions |
|
|
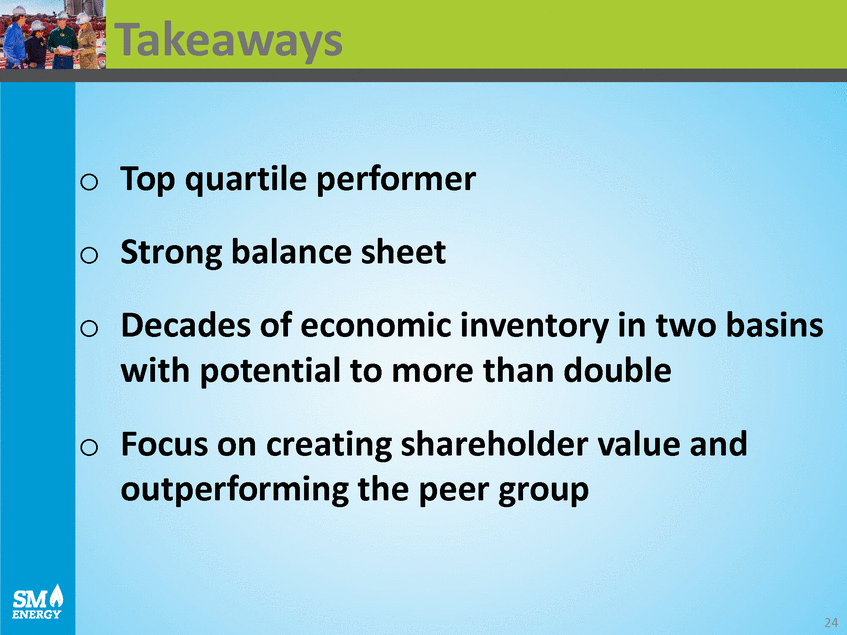
Takeaways o o o Top quartile performer Strong balance sheet Decades of economic inventory in two basins with potential to more than double Focus on creating shareholder value outperforming the peer group and o 24 |
|
|
Appendix 25 |
|
|
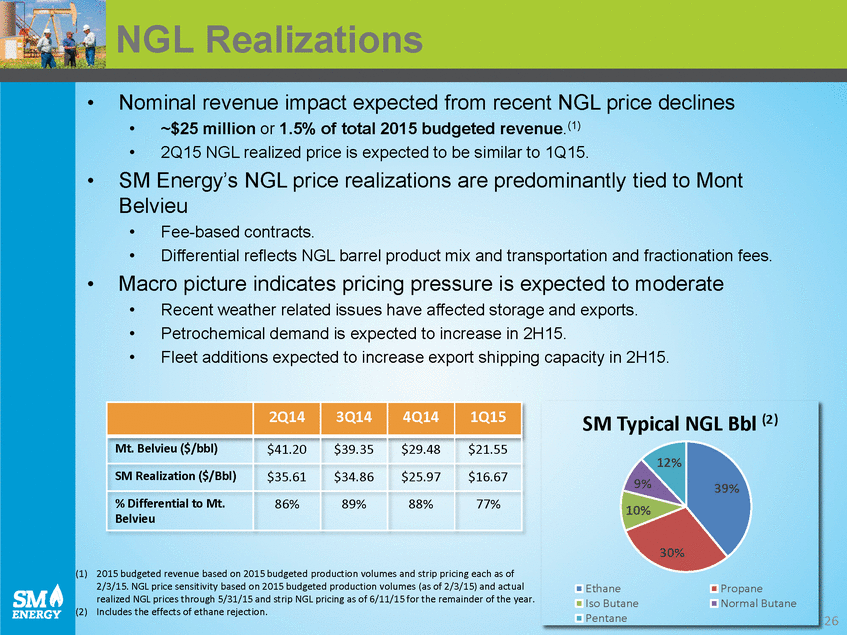
NGL Realizations • Nominal revenue impact expected from recent NGL price declines •~$25 million or 1.5% of total 2015 budgeted revenue.(1) •2Q15 NGL realized price is expected to be similar to 1Q15. SM Energy’s NGL price realizations are predominantly tied to Mont Belvieu • • • Fee-based contracts. Differential reflects NGL barrel product mix and transportation and fractionation fees. • Macro picture indicates pricing pressure is expected to moderate • • • Recent weather related issues have affected storage and exports. Petrochemical demand is expected to increase in 2H15. Fleet additions expected to increase export shipping capacity in 2H15. SM Typical NGL Bbl (2) 12% 9% 10% 39% 30% (1) 2015 budgeted revenue based on 2015 budgeted production volumes and strip pricing each as of 2/3/15. NGL price sensitivity based on 2015 budgeted production volumes (as of 2/3/15) and actual realized NGL prices through 5/31/15 and strip NGL pricing as of 6/11/15 for the remainder of the year. (2) Includes the effects of ethane rejection. Ethane Iso Butane Pentane Propane Normal Butane 26 2Q14 3Q14 4Q14 1Q15 Mt. Belvieu ($/bbl) $41.20 $39.35 $29.48 $21.55 SM Realization ($/Bbl) $35.61 $34.86 $25.97 $16.67 % Differential to Mt. Belvieu 86% 89% 88% 77% |
|
|
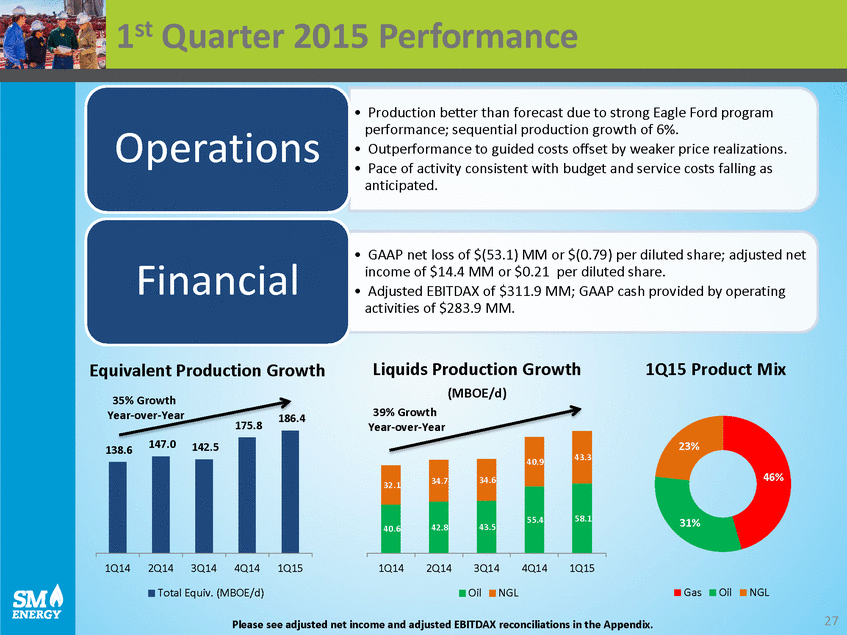
1st Quarter 2015 Performance • Production better than forecast due to strong Eagle Ford program performance; sequential production growth of 6%. • Outperformance to guided costs offset by weaker price realizations. • Pace of activity consistent with budget and service costs falling as anticipated. Operations • GAAP net loss of $(53.1) MM or $(0.79) per diluted share; adjusted net income of $14.4 MM or $0.21 per diluted share. • Adjusted EBITDAX of $311.9 MM; GAAP cash provided by operating activities of $283.9 MM. Financial Liquids Production Growth (MBOE/d) 39% Growth 1Q15 Product Mix Equivalent Production Growth 35% Growth Year-over-Year 186.4 175.8 Year-over-Year 23% 46% 31% 1Q14 2Q14 3Q14 4Q141Q15 1Q14 2Q14 3Q14 4Q14 1Q15 Gas Oil NGL Total Equiv. (MBOE/d) Oil NGL 27 Please see adjusted net income and adjusted EBITDAX reconciliations in the Appendix. 138.6147.0142.5 43.3 40.9 34.7 34.6 32.1 58.1 55.4 42.8 43.5 40.6 |
|
|
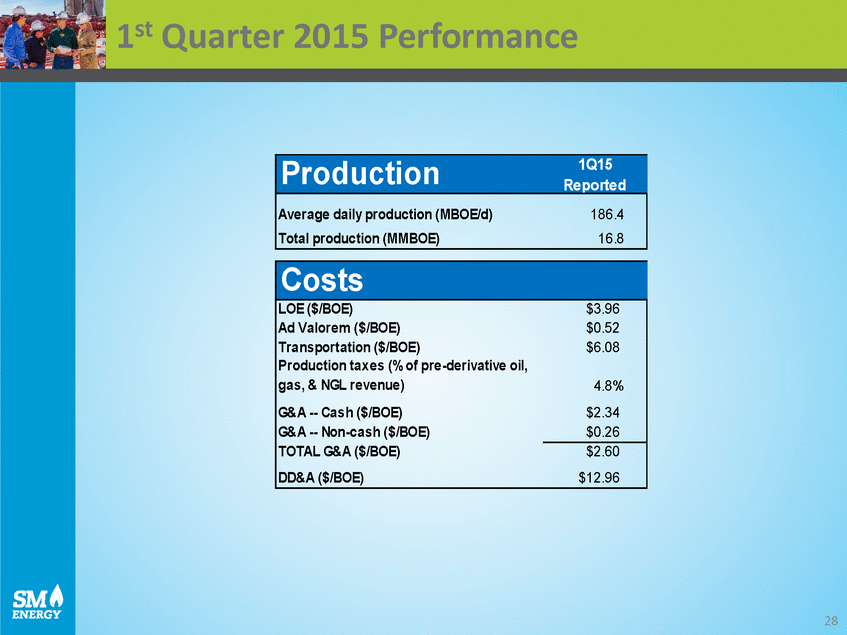
1st Quarter 2015 Performance Reported 28 Costs LOE ($/BOE) Ad Valorem ($/BOE) Transportation ($/BOE) Production taxes (% of pre-derivative oil, gas, & NGL revenue) G&A --Cash ($/BOE) G&A --Non-cash ($/BOE) TOTAL G&A ($/BOE) DD&A ($/BOE) $3.96 $0.52 $6.08 4.8% $2.34 $0.26 $2.60 $12.96 Production1Q15 Average daily production (MBOE/d)186.4 Total production (MMBOE)16.8 |
|
|
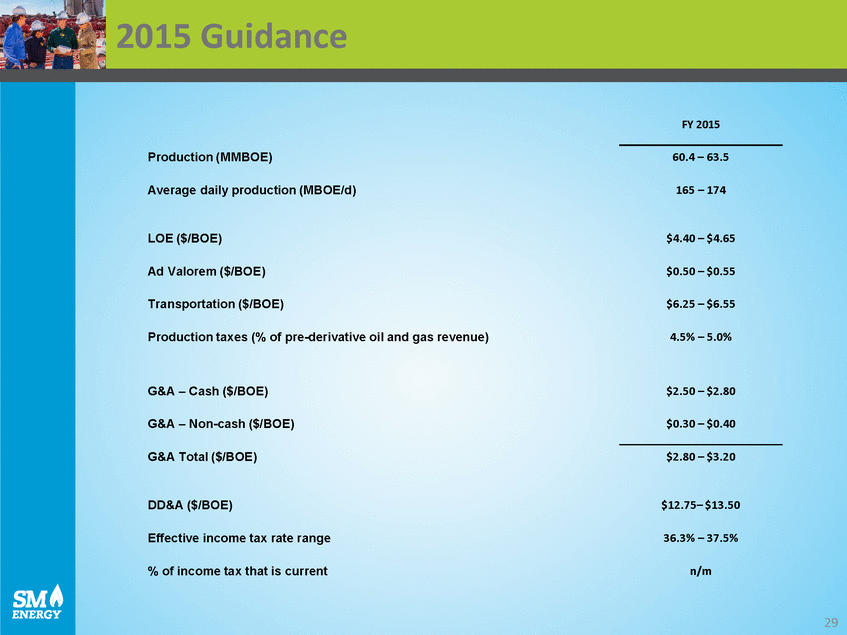
2015 Guidance FY 2015 Production (MMBOE) 60.4 – 63.5 Average daily production (MBOE/d) 165 – 174 LOE ($/BOE) $4.40 – $4.65 Ad Valorem ($/BOE) $0.50 – $0.55 Transportation ($/BOE) $6.25 – $6.55 Production taxes (% of pre-derivative oil and gas revenue) 4.5% – 5.0% G&A – Cash ($/BOE) $2.50 – $2.80 G&A – Non-cash ($/BOE) $0.30 – $0.40 G&A Total ($/BOE) $2.80 – $3.20 DD&A ($/BOE) $12.75– $13.50 Effective income tax rate range 36.3% – 37.5% % of income tax that is current n/m 29 |
|
|
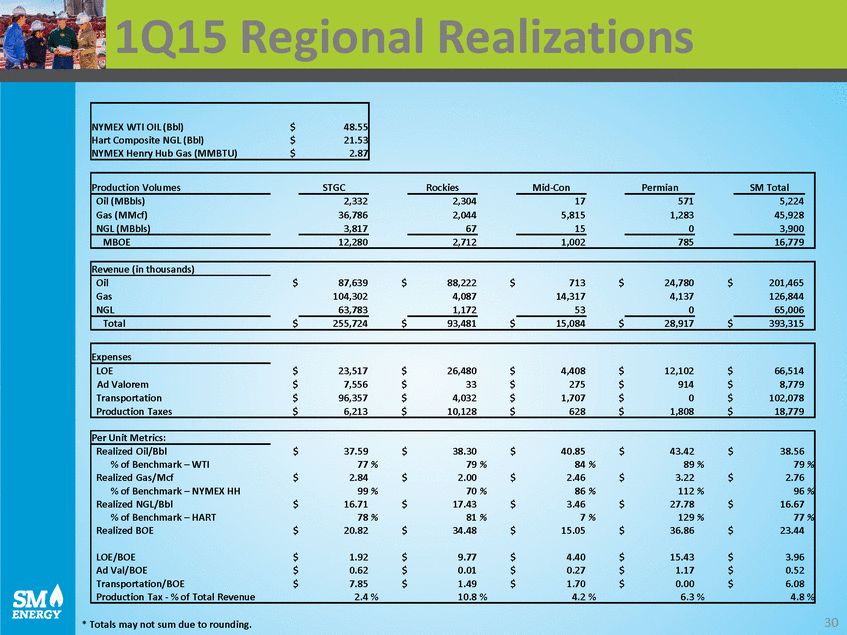
1Q15 Regional Realizations 30 * Totals may not sum due to rounding. Per Unit Metrics: $37.59$38.30$40.85$43.42$38.56 77 %79 %84 %89 %79 % $2.84$2.00$2.46$3.22$2.76 99 %70 %86 %112 %96 % $16.71$17.43$3.46$27.78$16.67 78 %81 %7 %129 %77 % $20.82$34.48$15.05$36.86$23.44 $1.92$9.77$4.40$15.43$3.96 $0.62$0.01$0.27$1.17$0.52 $7.85$1.49$1.70$0.00$6.08 2.4 %10.8 %4.2 %6.3 %4.8 % Realized Oil/Bbl % of Benchmark – WTI Realized Gas/Mcf % of Benchmark – NYMEX HH Realized NGL/Bbl % of Benchmark – HART Realized BOE LOE/BOE Ad Val/BOE Transportation/BOE Production Tax - % of Total Revenue Expenses $23,517$26,480$4,408$12,102$66,514 $7,556$33$275$914$8,779 $96,357$4,032$1,707$0$102,078 $6,213$10,128$628$1,808$18,779 LOE Ad Valorem Transportation Production Taxes Revenue (in thousands) $87,639$88,222$713$24,780$201,465 104,3024,08714,3174,137126,844 63,783 1,172 53 0 65,006 $255,724$93,481$15,084$28,917$393,315 Oil Gas NGL Total Production Volumes STGC Rockies Mid-Con Permian SM Total 2,3322,304175715,224 36,7862,0445,8151,28345,928 3,817 67 15 0 3,900 12,2802,7121,00278516,779 Oil (MBbls) Gas (MMcf) NGL (MBbls) MBOE NYMEX WTI OIL (Bbl)$48.55 Hart Composite NGL (Bbl)$21.53 NYMEX Henry Hub Gas (MMBTU)$2.87 |
|
|
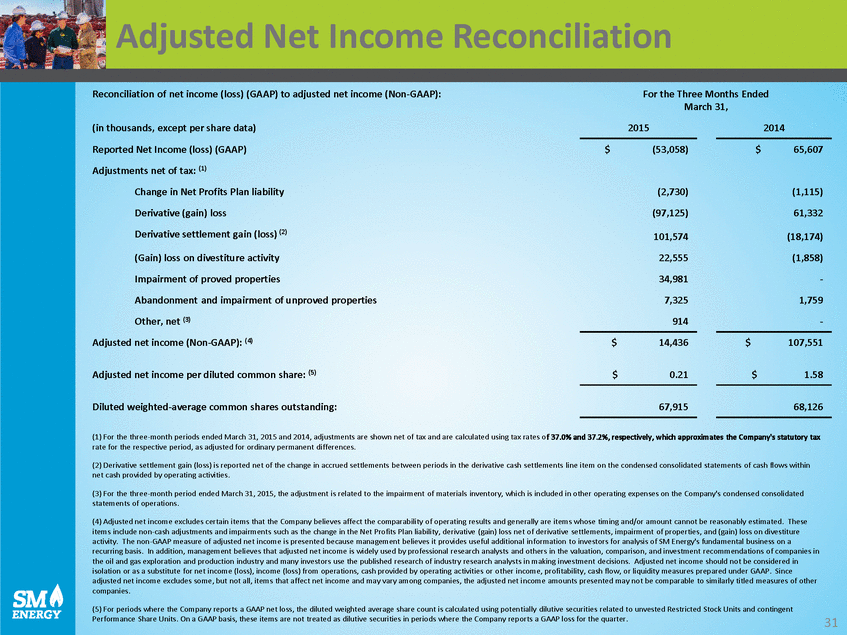
Adjusted Net Income Reconciliation Reconciliation of net income (loss) (GAAP) to adjusted net income (Non-GAAP): For the Three Months Ended March 31, (in thousands, except per share data) Reported Net Income (loss) (GAAP) Adjustments net of tax: (1) Change in Net Profits Plan liability Derivative (gain) loss Derivative settlement gain (loss) (2) 2015 2014 $ (53,058) $ 65,607 (2,730) (97,125) (1,115) 61,332 101,574 22,555 34,981 7,325 914 (18,174) (1,858) - 1,759 - (Gain) loss on divestiture activity Impairment of proved properties Abandonment and impairment of unproved properties Other, net (3) Adjusted net income (Non-GAAP): (4) $ 14,436 $ 107,551 Adjusted net income per diluted common share: (5) $ 0.21 $ 1.58 Diluted weighted-average common shares outstanding: 67,915 68,126 (1) For the three-month periods ended March 31, 2015 and 2014, adjustments are shown net of tax and are calculated using tax rates o f 37.0% and 37.2%, respectively, which approximates the Company's statutory tax rate for the respective period, as adjusted for ordinary permanent differences. (2) Derivative settlement gain (loss) is reported net of the change in accrued settlements between periods in the derivative cash settlements line item on the condensed consolidated statements of cash flows within net cash provided by operating activities. (3) For the three-month period ended March 31, 2015, the adjustment is related to the impairment of materials inventory, which is included in other operating expenses on the Company's condensed consolidated statements of operations. (4) Adjusted net income excludes certain items that the Company believes affect the comparability of operating results and ge nerally are items whose timing and/or amount cannot be reasonably estimated. These items include non-cash adjustments and impairments such as the change in the Net Profits Plan liability, derivative (gain) loss net of derivative settlements, impairment of properties, and (gain) loss on divestiture activity. The non-GAAP measure of adjusted net income is presented because management believes it provides useful additional information to investors for analysis of SM Energy's fundamental business on a recurring basis. In addition, management believes that adjusted net income is widely used by professional research analysts and others in the valuation, comparison, and investment recommendations of companies in the oil and gas exploration and production industry and many investors use the published research of industry research analys ts in making investment decisions. Adjusted net income should not be considered in isolation or as a substitute for net income (loss), income (loss) from operations, cash provided by operating activities or o ther income, profitability, cash flow, or liquidity measures prepared under GAAP. Since adjusted net income excludes some, but not all, items that affect net income and may vary among companies, the adjusted net income amounts presented may not be comparable to similarly titled measures of other companies. (5) For periods where the Company reports a GAAP net loss, the diluted weighted average share count is calculated using potentially dilutive securities related to unvested Restricted Stock Units and contingent Performance Share Units. On a GAAP basis, these items are not treated as dilutive securities in periods where the Company reports a GAAP loss for the quarter. 31 |
|
|
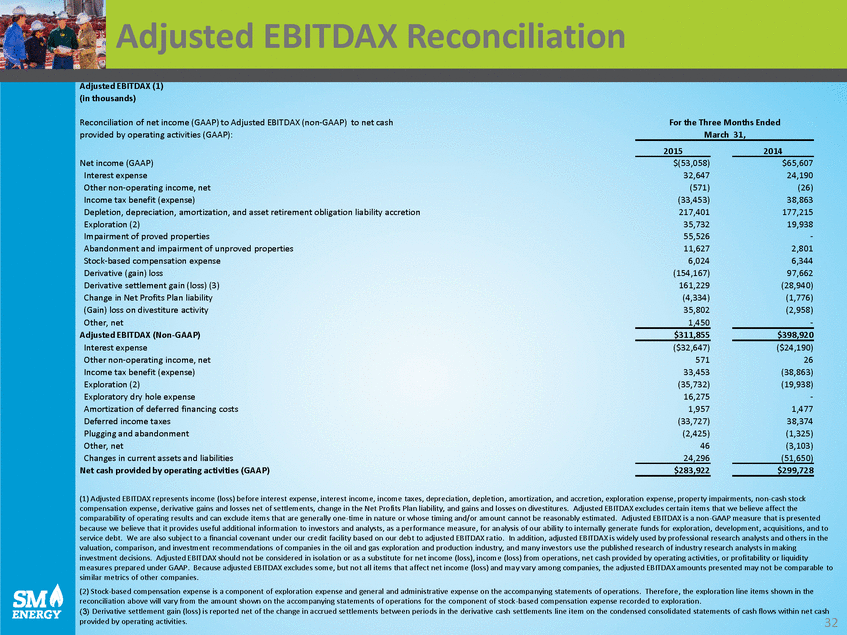
Adjusted EBITDAX Reconciliation Adjusted EBITDAX (1) (in thousands) Reconciliation of net income (GAAP) to Adjusted EBITDAX (non-GAAP) to net cash provided by operating activities (GAAP): For the Three Months Ended March 31, 2015 2014 Net income (GAAP) Interest expense Other non-operating income, net Income tax benefit (expense) Depletion, depreciation, amortization, and asset retirement obligation liability accretion Exploration (2) Impairment of proved properties Abandonment and impairment of unproved properties Stock-based compensation expense Derivative (gain) loss Derivative settlement gain (loss) (3) Change in Net Profits Plan liability (Gain) loss on divestiture activity Other, net Adjusted EBITDAX (Non-GAAP) Interest expense Other non-operating income, net Income tax benefit (expense) Exploration (2) Exploratory dry hole expense Amortization of deferred financing costs Deferred income taxes Plugging and abandonment Other, net Changes in current assets and liabilities Net cash provided by operating activities (GAAP) $(53,058) 32,647 (571) (33,453) 217,401 35,732 55,526 11,627 6,024 (154,167) 161,229 (4,334) 35,802 1,450 $65,607 24,190 (26) 38,863 177,215 19,938 - 2,801 6,344 97,662 (28,940) (1,776) (2,958) - $311,855 $398,920 ($32,647) 571 33,453 (35,732) 16,275 1,957 (33,727) (2,425) 46 24,296 ($24,190) 26 (38,863) (19,938) - 1,477 38,374 (1,325) (3,103) (51,650) $283,922 $299,728 (1) Adjusted EBITDAX represents income (loss) before interest expense, interest income, income taxes, depreciation, depletion, amortization, and accretion, exploration expense, property impairments, non-cash stock compensation expense, derivative gains and losses net of settlements, change in the Net Profits Plan liability, and gains and losses on divestitures. Adjusted EBITDAX excludes certain items that we believe affect the comparability of operating results and can exclude items that are generally one-time in nature or whose timing and/or amount cannot be reasonably estimated. Adjusted EBITDAX is a non-GAAP measure that is presented because we believe that it provides useful additional information to investors and analysts, as a performance measure, for analysis of our ability to internally generate funds for exploration, development, acquisitions, and to service debt. We are also subject to a financial covenant under our credit facility based on our debt to adjusted EBITDAX ra tio. In addition, adjusted EBITDAX is widely used by professional research analysts and others in the valuation, comparison, and investment recommendations of companies in the oil and gas exploration and production industry, an d many investors use the published research of industry research analysts in making investment decisions. Adjusted EBITDAX should not be considered in isolation or as a substitute for net income (loss), incom e (loss) from operations, net cash provided by operating activities, or profitability or liquidity measures prepared under GAAP. Because adjusted EBITDAX excludes some, but not all items that affect net income (loss) and ma y vary among companies, the adjusted EBITDAX amounts presented may not be comparable to similar metrics of other companies. (2) Stock-based compensation expense is a component of exploration expense and general and administrative expense on the accompa nying statements of operations. Therefore, the exploration line items shown in the reconciliation above will vary from the amount shown on the accompanying statements of operations for the component of stock -based compensation expense recorded to exploration. (3) Derivative settlement gain (loss) is reported net of the change in accrued settlements between periods in the derivative cash settlements line item on the condensed consolidated statements of cash flows within net cash 32 provided by operating activities. |


