Attached files
| file | filename |
|---|---|
| 8-K - FORM 8-K - Resource Real Estate Opportunity REIT, Inc. | d939475d8k.htm |
| EX-99.1 - EX-99.1 - Resource Real Estate Opportunity REIT, Inc. | d939475dex991.htm |
Exhibit 99.2

June 10, 2015
Dear {!Contact.FirstName},
On behalf of the Resource Real Estate Opportunity REIT (the “Opportunity REIT”), we are pleased to provide you with an update on the performance of the Opportunity REIT, as well as announce its recent valuation.
Since the Opportunity REIT’s formation, we have sought to create an investment in the United States apartment market that provides capital protection, current cash income and the potential for capital appreciation utilizing Resource Real Estate’s refined value-add apartment strategies developed over the past two decades. We are pleased to report that our value-add strategies have resulted in notable investment performance to date, and we believe that the Opportunity REIT continues to meet its financial goals and objectives.
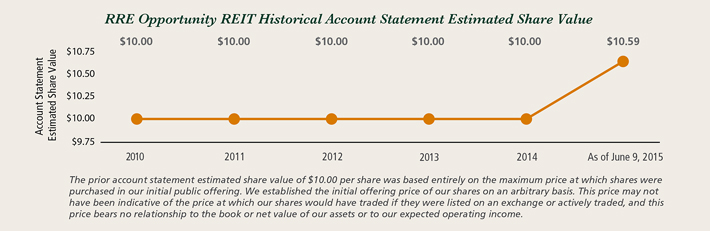
Net Asset Value of $10.59 per Share
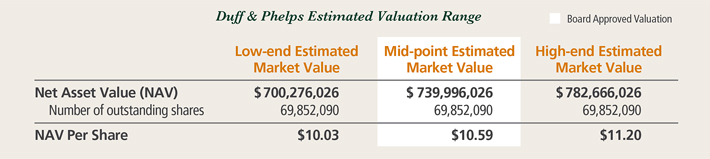
In accordance with Investment Program Association (“IPA”) Valuation Guidelines for non-traded REITs, the Opportunity REIT’s Board of Directors (the “Board”) engaged Duff & Phelps, LLC (“Duff and Phelps”), a renowned global independent valuation advisor, to appraise the Opportunity REIT’s portfolio as of March 31, 2015, and to provide the Board and the Conflicts Committee with a range of estimated values per share of the Opportunity REIT’s common stock based upon the estimated market value of the REIT’s assets. On June 4, 2015, Duff & Phelps provided the Board with an estimated valuation range from a low of $10.03 per share to a high of $11.20 per share, and the Board approved Duff and Phelps’ mid-point estimate of $10.59 per share as the estimated share value of the Opportunity REIT, which will replace the prior estimated share value of $10.00 on all customer account statements.
As of March 31, 2015, the Opportunity REIT owned and operated 36 apartment communities and four debt investments. Only 15 of these apartment communities, representing about 27 percent of the real estate portfolio value, were categorized by Duff & Phelps as “stabilized”, meaning all value-add capital has been deployed at the properties and their operational performance was stabilized at the time of valuation. Duff & Phelps categorized 19 assets as “non-stabilized”, meaning value-add capital continues to be deployed at the properties and operational performance had not yet been stabilized at the time of valuation. Two assets had been purchased immediately prior to the valuation and had not started their value-add program. As the Opportunity REIT continues to mature, we would anticipate that all of the “non-stabilized” properties would complete the value-add process and reach a stabilized categorization.
Details regarding the methodology of the Opportunity REIT’s valuation can be found in the attached Form 8-K, as filed with the SEC on June 9, 2015. Below you will find a chart illustrating the Duff & Phelps proposed range of valuation of which the Board unanimously approved the mid-point of $10.59 per share.
6 Percent Annual Distributions Today; 30 Consecutive Monthly Cash Distributions
Your current annualized cash distribution is 6 percent based on a share purchase price of $10.00, and approximately 5.7 percent of the $10.59 estimated value per share. As you are aware, the Opportunity REIT’s strategy is to acquire underperforming multifamily properties and to optimize them through new capital investment and the insertion of professional management to significantly improve their overall financial performance.
As a result of this strategy, the Opportunity REIT’s earlier investors received stock distributions while the Opportunity REIT’s initial acquisitions were optimized to allow them to produce higher levels of cash flow. Over time, as the Opportunity REIT grew and more properties became optimized producing higher cash flows, Opportunity REIT distributions were slowly converted from all stock, to a mix of stock and cash, and eventually to an all cash distribution as the properties became more cash flow positive. Below is a brief summary of the Opportunity REIT’s distributions to date:
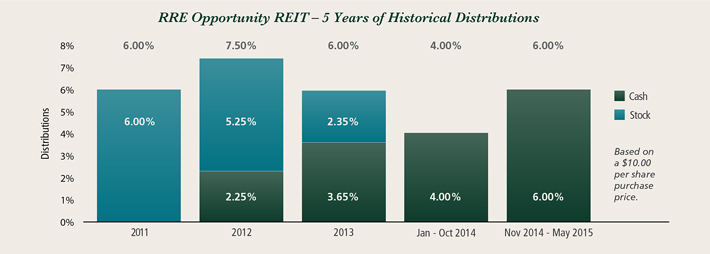
We are pleased that the Opportunity REIT continues to provide its investors with cash distributions, and we believe that our strategy to increase cash distributions along with growth in property performance has protected and enhanced the overall value of the Opportunity REIT.
12 Property Sales Result in $25 Million in Profits with an Average Return of 18%*
To date, the Opportunity REIT has selectively sold 12 assets resulting in an average annual return of approximately 18 percent and a total profit of approximately $25 million. We believe that the results of these early transactions are a positive indicator that not only our strategy, but also our execution of that strategy, has been successful in achieving the Opportunity REIT’s goals. Below is a brief summary of the six largest dispositions to date:
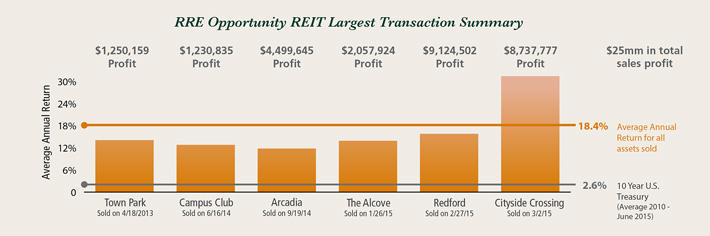
In many cases, the assets selected for sale have represented either those assets that we believe have reached their maximum value or, those assets we believe would not be strong long-term performers in the Opportunity REIT’s portfolio. Furthermore, these initial asset sales yielded such high returns in a historically low interest rate environment where the 10-year treasury rate averaged 2.6 percent. We are pleased with the transactional success that the Opportunity REIT has achieved to date.
| * | Average annual return is calculated by dividing total cash flow from a property by its total capitalization (purchase price of property plus capital expenditures) – and then further divided by number of years from purchase to sale to provide an annualized return on investment. Average annual return is used to calculate a specific investment’s return profile and is not equivalent to actual returns to individual shareholders. |
Distributions Have Been Tax Free To Date
It is important to point out that as of December 31, 2014, the Opportunity REIT has provided investors with a tax efficient investment. Primarily as a result of the accelerated property depreciation schedules for multifamily properties, investors have had no tax liability related to either property sales or their cash distributions since the Opportunity REIT’s inception. While we expect that this may not always be the case in the future, we are pleased to provide our investors with an investment that has to date shielded them from tax liabilities.
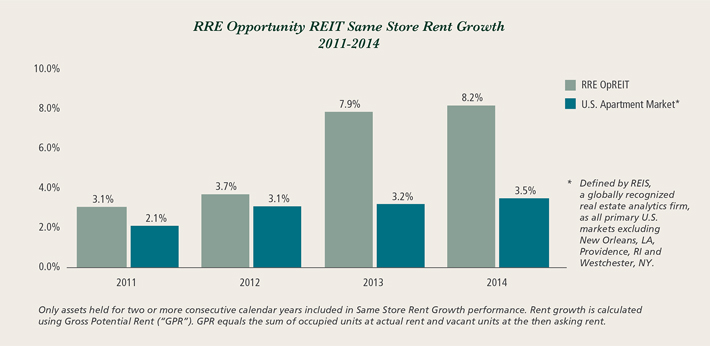
Properties Outperforming Overall Multifamily Market Through Value-add Process
As you are aware, the Opportunity REIT focuses on acquiring multifamily communities throughout the United States that are often both undermanaged and lack capital for much needed upgrades. The Opportunity REIT deploys a value-add strategy at these properties by bringing its management expertise and capital to work for each property’s benefit. Once a property’s performance is stabilized, its increase in value is often demonstrated through a sale to generate gains, or is held in the Opportunity REIT’s portfolio to provide stable and growing cash flows to our investors. The chart below illustrates that over the past two years, the Opportunity REIT has averaged 8.1 percent rent growth as compared to 3.6 percent across the broader United States apartment market:
Ongoing Supply/Demand Imbalance Driving Rental Rates
While much of the Opportunity REIT’s early success can be attributed to our value-add methodology and execution, it is important to note that the United States apartment market remains very strong. As a need-based product, apartments have historically been among the most stable real estate investments. The ongoing flood of Generation Y renters combined with the decreasing American homeownership rate has not just created more renters, but also a significant supply/demand imbalance. As the number of renters has increased over the past five years, the new supply of quality, renovated apartments that are affordable to the workforce has not maintained pace with demand. This ongoing supply/demand imbalance has created a strong operating environment for the Opportunity REIT that we believe will continue for the foreseeable future.
Summary
We are pleased that our first valuation reflects the positive performance of the Opportunity REIT. We have provided 30 consecutive months of cash distributions in addition to stock dividends for our early investors and we have sold 12 assets resulting in an 18 percent average annual return, all without creating any tax liabilities to date for our investors. We believe that the strong long-term apartment fundamentals will continue to provide an environment favorable to our value-add apartment strategy and execution abilities, and look forward to continuing to operate the Opportunity REIT to greater financial performance heights.
If you have any questions regarding this correspondence or the REIT, please feel free to contact Investor Relations at 866-469-0129 or via email at InvestorRelations@ResourceREIT.com.
We look forward to speaking with you soon.
| Sincerely, | ||||

|

| |||
| Alan Feldman | Kevin Finkel | |||
| Chief Executive Officer | President and Chief Operating Officer | |||
| Resource Real Estate Opportunity REIT, Inc. | Resource Real Estate Opportunity REIT, Inc. | |||
The information contained herein should be read in conjunction with, and is qualified by, the information in the Resource Real Estate Opportunity REIT, Inc. (the “Company”) Annual Report on Form 10-K for the year ended December 31, 2014 and the Company’s Quarterly Report on Form 10-Q for the period ended March 31, 2015, including the “Risk Factors” contained therein. For a full description of the limitations, methodologies and assumptions used to value the Company’s assets and liabilities in connection with the calculation of the Company’s estimated value per share, see the Company’s Current Report on Form 8-K filed with the Securities and Exchange Commission on June 9, 2015.
Forward-Looking Statements
The foregoing includes forward-looking statements within the meaning of the Federal Private Securities Litigation Reform Act of 1995. The Company intends that such forward-looking statements be subject to the safe harbors created by Section 27A of the Securities Act of 1933, as amended, and Section 21E of the Securities Exchange Act of 1934, as amended. These statements include statements regarding the intent, belief or current expectations of the Company and members of its management team, as well as the assumptions on which such statements are based, and generally are identified by the use of words such as “may,” “will,” “seeks,” “anticipates,” “believes,” “estimates,” “expects,” “plans,” “intends,” “should” or similar expressions. Further, forward-looking statements speak only as of the date they are made, and the Company undertakes no obligation to update or revise forward-looking statements to reflect changed assumptions, the occurrence of unanticipated events or changes to future operating results over time, unless required by law. Actual results may differ materially from those contemplated by such forward-looking statements. The appraisal methodology for the Company’s real estate properties assumes the properties realize the projected net operating income and that investors would be willing to invest in such properties at similar capitalization rates. Though the estimates of the fair market value of the real estate properties and the estimated value per share are Duff & Phelps’s best estimates, the Company can give no assurance in this regard. Even small changes to these assumptions could result in significant differences in the appraised values of the Company’s real estate properties and the estimated value per share. These statements also depend on factors such as: future economic, competitive and market conditions; the Company’s ability to maintain occupancy levels and rental rates at its real estate properties; and other risks identified in Part I, Item IA of the Company’s Annual Report on Form 10-K for the year ended December 31, 2014, as filed with the SEC. Actual events may cause the value and returns on the Company’s investments to be less than that used for purposes of the Company’s estimated value per share.