Attached files
| file | filename |
|---|---|
| EX-99.3 - EXHIBIT 99.3 - Resource Real Estate Opportunity REIT, Inc. | rreo-20171231ex992.htm |
| EX-99.2 - EXHIBIT 99.2 - Resource Real Estate Opportunity REIT, Inc. | rreo2ndar_srpmarch20.htm |
| EX-32.2 - EXHIBIT 32.2 - Resource Real Estate Opportunity REIT, Inc. | rreo-20171231xex322.htm |
| EX-32.1 - EXHIBIT 32.1 - Resource Real Estate Opportunity REIT, Inc. | rreo-20171231xex321.htm |
| EX-31.2 - EXHIBIT 31.2 - Resource Real Estate Opportunity REIT, Inc. | rreo-20171231xex312.htm |
| EX-31.1 - EXHIBIT 31.1 - Resource Real Estate Opportunity REIT, Inc. | rreo-20171231xex311.htm |
| EX-23.1 - EXHIBIT 23.1 - Resource Real Estate Opportunity REIT, Inc. | rreo-20171231xex231.htm |
| EX-21.1 - EXHIBIT 21.1 - Resource Real Estate Opportunity REIT, Inc. | rreo-20171231xex211.htm |
| EX-4.4 - EXHIBIT 4.4 - Resource Real Estate Opportunity REIT, Inc. | rreo3rdardrpmarch2018.htm |
UNITED STATES
SECURITIES AND EXCHANGE COMMISSION
Washington, D.C. 20549
FORM 10-K
(Mark One)
þ | ANNUAL REPORT PURSUANT TO SECTION 13 OR 15(d) OF THE SECURITIES EXCHANGE ACT OF 1934 |
For the fiscal year ended December 31, 2017
or
¨ | TRANSITION REPORT PURSUANT TO SECTION 13 OR 15(d) OF THE SECURITIES EXCHANGE ACT OF 1934 |
For the transition period from __________ to __________
Commission File Number 000-54369

Resource Real Estate Opportunity REIT, Inc.
(Exact name of registrant as specified in its charter)
Maryland | 27-0331816 | |
(State or other jurisdiction of | (I.R.S. Employer | |
incorporation or organization) | Identification No.) | |
1845 Walnut Street, 18th Floor, Philadelphia, PA 19103 | ||
(Address of principal executive offices) (Zip code) | ||
(215) 231-7050 | ||
(Registrant's telephone number, including area code) | ||
Securities registered pursuant to Section 12(b) of the Act: | ||
Title of each class | Name of exchange on which registered | |
None | None | |
Securities registered pursuant to Section 12(g) of the Act: | ||
Common Stock, par value $.01 per share | ||
Indicate by check mark if the registrant is not required to file reports pursuant to Section 13 or Section 15(a) of the Act. Yes o No þ
Indicate by check mark whether the registrant (1) has filed all reports required to be filed by Section 13 or 15(d) of the Securities Exchange Act of 1934 during the preceding 12 months (or for such shorter period that the registrant was required to file such reports), and (2) has been subject to such filing requirements for the past 90 days. Yes þ No o
Indicate by check mark whether the registrant has submitted electronically and posted on its corporate Web site, if any, every Interactive Data File required to be submitted and posted pursuant to Rule 405 of Regulation S-T during the preceding 12 months (or for such shorter period that the registrant was required to submit and post such files). Yes þ No o
Indicate by check mark if disclosure of delinquent filers pursuant to Item 405 of Regulation S-K is not contained herein, and will not be contained, to the best of registrant's knowledge, in definitive proxy or information statements incorporated by reference in Part III of this Form 10-K or any amendment to this Form 10-K. þ
Indicate by check mark whether the registrant is a large accelerated filer, an accelerated filer, a non-accelerated filer, or a smaller reporting company. See definition of “large accelerated filer,” “accelerated filer” and “smaller reporting company” in Rule 12b-2 of the Exchange Act.
Large accelerated filer | o | Accelerated filer | o | |
Non-accelerated filer | þ | (Do not check if a smaller reporting company) | Smaller reporting company | o |
Emerging growth company | o | |||
Indicate by check mark whether the registrant is a shell company (as defined in Rule 12b-2 of the Act). Yes o No þ
If an emerging growth company, indicate by check mark if the registrant has elected not to use the extended transition period for complying with any new or revised financial accounting standards provided pursuant to Section 13(a) of the Exchange Act. o
There is no established market for the Registrant's shares of common stock. On March 28, 2018, the board of directors of the Registrant approved an estimated value per share of the Registrant’s common stock of $10.80. For a full description of the methodologies used to calculate the Registrant’s estimated value per share as of December 31, 2016, see Part II, Item 5, “Market for Registrant’s Common Equity, Related Stockholder Matters and Issuer Purchases of Equity Securities - Market Information.” There were approximately 71,294,725 shares of common stock held by non-affiliates at June 30, 2017, the last business day of the registrant's most recently completed second fiscal quarter.
As of March 21, 2018, there were 71,704,077 outstanding shares of common stock of Resource Real Estate Opportunity REIT, Inc.
Registrant incorporates by reference portions of the Resource Real Estate Opportunity REIT, Inc. Definitive Proxy Statement for the 2018 Annual Meeting of Stockholders (Items 10, 11, 12, 13, and 14 of Part III).
RESOURCE REAL ESTATE OPPORTUNITY REIT, INC.
INDEX TO ANNUAL REPORT
ON FORM 10-K
PAGE | ||
PART 1 | ||
Item 1. | ||
Item 1A. | ||
Item 1B. | ||
Item 2. | ||
Item 3. | ||
Item 4. | ||
PART II | ||
Item 5. | ||
Item 6 | ||
Item 7. | ||
Item 7A. | ||
Item 8. | ||
Item 9. | ||
Item 9A. | ||
Item 9B. | ||
PART III | ||
Item 10. | ||
Item 11. | ||
Item 12. | ||
Item 13. | ||
Item 14. | ||
PART IV. | ||
Item 15. | ||
Forward-Looking Statements
Certain statements included in this Annual Report on Form 10-K are forward-looking statements. Forward-looking statements relate to expectations, beliefs, projections, future plans and strategies, anticipated events or trends and similar expressions concerning matters that are not historical facts. In some cases, you can identify forward-looking statements by terms such as “anticipate,” “believe,” “could,” “estimate,” “expects,” “intend,” “may,” “plan,” “potential,” “project,” “should,” “will” and “would” or the negative of these terms or other comparable terminology. Such statements are subject to the risks and uncertainties more particularly described in Item 1A of this Annual Report on Form 10-K. These risks and uncertainties could cause actual results to differ materially. Readers are cautioned not to place undue reliance on these forward-looking statements, which speak only as of the date hereof. We undertake no obligation to publicly revise or update these forward-looking statements to reflect events or circumstances after the date of this report, except as may be required under applicable law.
PART I
ITEM 1. | BUSINESS |
General
Resource Real Estate Opportunity REIT, Inc. is a Maryland corporation that was formed on June 3, 2009. As used herein, the terms “we,” “our” and “us” refer to Resource Real Estate Opportunity REIT, Inc., a Maryland corporation, and Resource Real Estate Opportunity OP, LP, a Delaware limited partnership, and its subsidiaries. We have elected to be taxed as a real estate investment trust, or REIT, and to operate as a REIT beginning with our taxable year ended December 31, 2010. Our objectives are to preserve stockholder capital, realize growth in the value of our investments, increase cash distributions through increased cash flow from operations or asset sales, and enable stockholders to realize a return on their investments. As of December 31, 2017, we owned 30 multifamily properties, as described further in “Item 2. Properties” below, and one performing loan. In the future, we may reinvest proceeds from property sales to purchase underperforming real estate that can benefit from renovations and better management.
We are externally managed by Resource Real Estate Opportunity Advisor, LLC, which we refer to as our Advisor, an indirect wholly owned subsidiary of Resource America, Inc. ("RAI"). RAI is a wholly-owned subsidiary of C-III Capital Partners LLC ("C-III"), a leading commercial real estate services company engaged in a broad range of activities. C-III controls both our Advisor and Resource Real Estate Opportunity Manager, LLC, our property manager. C-III also controls all of the shares of our common stock held by RAI. To provide its services, the Advisor draws upon RAI, its management team and their collective investment experience.
Our Offerings
On September 15, 2009, we commenced a private placement offering to accredited investors for the sale of up to 5,000,000 shares of common stock at a price of $10 per share, with discounts available to certain categories of purchasers. The offering, which closed on June 9, 2010, resulted in aggregate gross proceeds of $12.8 million, ($11.3 million, net of syndication costs) and resulted in the issuance of 1,283,727 common shares, including 20,000 shares purchased by our Advisor. Also, in conjunction with the private offering, we offered 5,000 shares of convertible stock at a price of $1 per share. Investors acquired 937 shares of the convertible stock; the Advisor purchased the remaining 4,063 shares.
On June 16, 2010, we commenced our initial primary public offering of up to 75,000,000 shares and a public offering of up to an additional 7,500,000 shares pursuant to our distribution reinvestment plan. An affiliate of our Advisor, Resource Securities LLC, or Resource Securities (formerly known as Resource Securities, Inc.), served as the dealer manager. We offered shares of our common stock in our primary offering for $10 per share, with discounts available to certain categories of investors.
The primary portion of our initial public offering closed on December 13, 2013, having raised aggregate gross proceeds of $633.1 million through the issuance of 63,647,084 shares of our common stock, including 276,056 shares purchased by our Advisor and 1,161,623 shares sold pursuant to our distribution reinvestment plan. On December 26, 2013, the unsold primary offering shares were deregistered and, on December 30, 2013, the registration of the shares issuable pursuant to the distribution reinvestment plan was continued pursuant to a Registration Statement on Form S-3. A new Registration Statement on Form S-3 was filed in May 2016 to continue the distribution reinvestment plan offering. We continue to offer shares pursuant to our distribution reinvestment plan at a purchase price equal to our current estimated value per share. During the years ended December 31, 2017, 2016, and 2015, we issued, in total, an additional 7,988,550 shares through our distribution reinvestment plan for gross proceeds of $84.6 million.
Our Business Strategy
Our business strategy has a particular focus on multifamily assets, although we may also purchase interests in other types of commercial property assets consistent with our investment objectives. Our targeted portfolio consists of commercial real estate assets, principally (i) multifamily rental properties purchased as non-performing or distressed loans or as real estate owned by financial institutions and (ii) multifamily rental properties to which we have added value with a capital infusion (referred to as “value add properties”). However, we are not limited in the types of real estate and real estate-related assets in which we may invest or whether we may invest in equity or debt secured by real estate and, accordingly, we may invest in other real estate assets or debt secured by real estate assets. At December 31, 2017, we currently hold approximately 27% of our total assets in category (i) and 73% of our total assets in category (ii). We may make adjustments to our portfolio based on real estate market conditions and investment opportunities. We will not forego a potential investment because it does not precisely fit our expected portfolio composition. We continually monitor the portfolio of optimized, renovated properties seeking sales opportunities that will maximize
our return. We generally expect to reinvest the return of capital from such sales and to distribute gains from such sales to our stockholders in the form of distributions.
We anticipate providing our stockholders with a liquidity event or events by some combination of the following: (i) liquidating all, or substantially all, of our assets and distributing the net proceeds to stockholders, or (ii) listing our shares for trading on a national securities exchange. Our Board of Directors anticipates evaluating a liquidity event no later than six years after the termination of our primary offering (which occurred in December 2013), subject to prevailing market conditions. In making the decision to liquidate or apply for listing of our shares, our directors will determine whether liquidating our assets or listing our shares will result in a greater value for our stockholders. If we do not begin the process of liquidating our assets or listing our shares by December 2019, or otherwise determined a future date for such action, upon the request of stockholders holding 10% or more of our outstanding shares of common stock, our charter requires that we hold a stockholders meeting to vote on a proposal for our orderly liquidation unless a majority of our Board of Directors and a majority of our independent directors vote to defer the meeting beyond December 2019.
Our Operating Policies and Strategies
Our Advisor has the primary responsibility for the selection of investments, the negotiation of the acquisition of these investments, and financing, asset-management and disposition decisions. A majority of our Board of Directors and a majority of the Conflicts Committee, which includes only our three independent directors, approve all proposed real estate property investments and certain significant real estate-related debt investments. Our Board of Directors meets regularly to monitor the execution of our investment strategies and our progress in achieving our investment objectives.
We may use leverage for our acquisitions in the form of both REIT level financing and individual investment financing. Such financing, both at the REIT level and at the individual investment level, may also be obtained from the seller of an investment. Although there is no limit on the amount we can borrow to acquire a single real estate investment, we may not leverage our assets with debt financing such that our total liabilities exceed 75% of the aggregate value of our assets unless a majority of our independent directors finds substantial justification for borrowing a greater amount.
Our Advisor and our Property Manager
Our Advisor manages our day-to-day operations and our portfolio of real estate investments, and provides asset management, marketing, investor relations, and other administrative services on our behalf, all subject to the supervision of our Board of Directors. Our Advisor has invested approximately $2.5 million in us and as of December 31, 2017, it owned 276,056 shares of our common stock and 30,886 shares of our convertible stock. Under certain circumstances, the convertible shares may be converted into shares of our common stock. As of December 31, 2017, our Advisor has granted 21,210 shares of its convertible stock to employees of RAI and its subsidiaries and affiliates. Of these shares, 2,421 have been forfeited and returned to the Advisor as of December 31, 2017. The outstanding shares vest ratably over three years, and 18,177 of these shares have vested as of December 31, 2017.
We have a management agreement with Resource Real Estate Opportunity Manager, LLC, an affiliate of our Advisor, or our Manager, to provide property management services, as applicable, for most of the properties or other real estate related assets, in each case where our Advisor is able to control the operational management of such properties. Our Manager may subcontract with an affiliate or third party to provide day-to-day property management, construction management and/or other property specific functions as applicable for the properties it manages. Our Manager also manages our real estate-related debt investments.
Resource Property Management, LLC, d/b/a “Resource Residential,” an affiliate of RAI, is a property management company that our Manager has subcontracted with to manage most of the real estate assets that we own. The senior managers and employees of Resource Residential, acting through our Manager, assist in providing property management as well as construction management services to us. Resource Residential is a subsidiary of US Residential Group LLC ("USRG"), a Dallas-based property manager that is a wholly owned subsidiary of C-III.
Competition
We believe that the current market for properties that meet our investment objectives is extremely competitive and many of our competitors have greater resources than we do. We believe that our multifamily communities are suitable for their intended purposes and adequately covered by insurance. There are a number of comparable properties located in the same submarkets that might compete with our properties. We compete with numerous other entities engaged in real estate investment activities, including individuals, corporations, banks and insurance company investment accounts, other REITs, real estate limited partnerships, the U.S. government and other entities, to acquire, manage and sell real estate properties and real estate related assets. Many of our expected competitors enjoy significant competitive advantages that result from, among other things, a lower cost of capital and
enhanced operating efficiencies. In addition, the number of entities and the amount of funds competing for suitable investments may increase.
Environmental
As an owner of real estate, we are subject to various environmental laws of federal, state and local governments. Compliance with existing laws has not had a material adverse effect on our financial condition or results of operations, and management does not believe it will have such an impact in the future. However, we cannot predict the impact of unforeseen environmental contingencies or new or changed laws or regulations on properties in which we hold an interest, or on properties that may be acquired directly or indirectly in the future.
Employees and Economic Dependency
We have no paid employees. The employees of our Advisor and its affiliates provide management, acquisition, advisory and certain administrative services for us. We are dependent on our Advisor and its affiliates for certain services that are essential to us, including the identification, evaluation, negotiation, purchase and disposition of properties and other investments; management of the daily operations of our portfolio; and other general and administrative responsibilities. In the event that these affiliated companies are unable to provide the respective services, we will be required to obtain such services from other sources.
Access to Company Information
We electronically file our Annual Report on Form 10-K, Quarterly Reports on Form 10-Q, proxy statement, Current Reports on Form 8-K and all amendments to those reports with the United States Securities and Exchange Commission (“SEC”). The public may read and copy any of the reports that are filed with the SEC at the SEC's Public Reference Room at 100 F Street, NE, Washington, DC 20549. The public may obtain information on the operation of the Public Reference Room by calling the SEC at (800)-SEC-0330. The SEC maintains an Internet site at www.sec.gov that contains reports, proxy and information statements and other information regarding issuers that file electronically.
We make available free of charge, the Annual Report on Form 10-K, Quarterly Reports on Form 10-Q, proxy statement, Current Reports on Form 8-K and all amendments to those reports on our website, www.resourcereit.com, or by responding to requests addressed to our investor relations group. These reports are available as soon as reasonably practicable after such material is electronically filed or furnished to the SEC.
ITEM 1A. RISK FACTORS
Below are some of the risks and uncertainties that could cause our actual results to differ materially from those presented in our forward-looking statements. The risks and uncertainties described below are not the only ones we face but do represent those risks and uncertainties that we believe are material to our business, operating results, prospects, and financial condition. Additional risks and uncertainties not presently known to us or that we currently deem immaterial may also harm our business.
Risks Related to an Investment in Us
There is no established public trading market for our shares; therefore, it will be difficult for you to sell your shares.
There is no current established public market for our shares and we currently have no plans to list our shares on a national securities exchange. Our charter limits your ability to transfer or sell your shares unless the prospective stockholder meets the applicable suitability and minimum purchase standards. Our charter also prohibits the ownership of more than 9.8% of our stock, unless exempted by our Board of Directors, which may inhibit large investors from desiring to purchase your shares. Moreover, our share redemption program includes numerous restrictions that limit your ability to sell your shares to us, and our Board of Directors may amend, suspend or terminate our share redemption program upon 30 days’ notice and without stockholder approval. Therefore, it will be difficult for you to sell your shares promptly or at all. If you are able to sell your shares, you would likely have to sell them at a substantial discount to their public offering price. It is also likely that your shares would not be accepted as the primary collateral for a loan. You should purchase our shares only as a long-term investment because of the illiquid nature of the shares.
Because of the concentration of a significant portion of our assets in three geographic areas, any adverse economic, real estate or business conditions in these areas could affect our operating results and our ability to make distributions to our stockholders.
As of December 31, 2017, our real estate investments in Texas, California and Georgia represented approximately 27%, 17% and 11% of the net book value of our rental properties, respectively. As a result, the geographic concentration of our portfolio makes it particularly susceptible to adverse economic developments in the Texas, California and Georgia real estate markets. Any
adverse economic or real estate developments in these markets, such as business layoffs or downsizing, industry slowdowns, relocations of businesses, changing demographics and other factors, or any decrease in demand for multifamily rentals resulting from the local business climate, could adversely affect our operating results and our ability to make distributions to stockholders.
Because we are dependent upon our Advisor and its affiliates to conduct our operations, any adverse changes in the financial health of our Advisor or its affiliates or our relationship with them could hinder our operating performance and the return on our stockholders’ investment.
We are dependent on our Advisor to manage our operations and our portfolio of real estate assets. Our Advisor depends largely upon the fees and other compensation that it receives from us in connection with the purchase, management and sale of assets to conduct its operations. Any adverse changes in the financial condition of our Advisor or our relationship with our Advisor could hinder its ability to successfully manage our operations and our portfolio of investments.
Our ability to achieve our investment objectives and to conduct our operations is dependent upon the performance of our Advisor, which is a subsidiary of our sponsor and its parent company, RAI. Our sponsor’s business is sensitive to trends in the general economy, as well as the commercial real estate and credit markets. To the extent that any decline in our sponsor’s revenues and operating results impacts the performance of our Advisor, our results of operations, and financial condition could also suffer.
The loss of or the inability to hire additional or replacement key real estate and debt finance professionals by our Advisor could delay or hinder implementation of our investment strategies, which could limit our ability to make distributions and decrease the value of your investment.
We believe that our future success depends, in large part, upon our Advisor's and its affiliates ability to retain highly skilled managerial, operational and marketing professionals. Competition for such professionals is intense, and our Advisor and its affiliates may be unsuccessful in attracting and retaining such skilled individuals. If our Advisor loses or is unable to obtain the services of highly skilled professionals, our ability to implement our investment strategies could be delayed or hindered and the value of your investment may decline.
If we make distributions from sources other than our cash flow from operations, we will have fewer funds available for the acquisition of properties and your overall return may be reduced.
We will declare distributions when our Board of Directors determines we have sufficient cash flow. We generally expect to fund distributions from interest and rental income on investments, the maturity, payoff or settlement of investments and from strategic sales of loans, debt securities, properties and other assets. However, we may set distribution rates at levels we believe we will be able to cover with anticipated future cash flows from operating activities. In order to make these cash distributions, we may be required to use alternative funding sources.
Our organizational documents permit us to make distributions from any source. If we fund distributions from borrowings, sales of properties or offering proceeds, we will have less funds available for the acquisition of real estate and real estate-related assets and your overall return may be reduced. Further, to the extent distributions exceed our cash flow from operations, a stockholder’s basis in our stock will be reduced and, to the extent distributions exceed a stockholder’s basis, the stockholder may recognize capital gain. There is no limit on the amount that we can use to fund distributions from sources other than from cash flows from operations.
During the year ended December 31, 2015, we paid aggregate distributions of $42.2 million, including $13.2 million of distributions paid in cash and $29.0 million of distributions reinvested in shares of our common stock through our distribution reinvestment plan. During the year ended December 31, 2016, we paid aggregate distributions of $43.0 million, including $14.5 million of distributions paid in cash and $28.5 million of distributions reinvested in shares of our common stock through our distribution reinvestment plan. During the year ended December 31, 2017, we paid aggregate cash distributions of $43.0 million including $15.9 million of distributions paid in cash and $27.1 million of distributions reinvested in our shares through our distribution reinvestment plan. Our net loss attributable to common stockholders for the year ended December 31, 2017 was $22.0 million and net cash provided by operating activities was $12.0 million. Our cumulative cash distributions and net loss attributable to common stockholders from inception through December 31, 2017 are $177.7 million and $118.4 million, respectively. We have funded our cumulative distributions, which includes net cash distributions and distributions reinvested by stockholders, with cash flow from operations, proceeds from disposal of real estate, and proceeds from debt financing. During 2017, distributions were funded as follows: 27.9% from operating activities, 17.1% from debt financing and 55.0% from the proceeds of property dispositions. To the extent that we pay distributions from sources other than our cash flow from operating activities or gains from asset sales, we will have fewer funds available for investment in commercial real estate and real estate-related debt, the overall return to our stockholders may be reduced and subsequent investors may experience dilution.
6
The value of a share of our common stock has been diluted as a result of our payment of stock distributions and will be further diluted if we make additional stock distributions.
We have issued stock distributions to our stockholders and may continue to issue such stock distributions in the future. We seek to purchase assets that may have limited operating cash flows. While our objective is to acquire assets that appreciate in value, there can be no assurance that assets we acquire will appreciate in value. Therefore, investors who purchased shares early in our offering, as compared with later investors, received more shares for the same cash investment as a result of any stock distributions. Because they own more shares, upon a sale or liquidation of the company, these early investors will receive more sales proceeds or liquidating distributions relative to their invested capital compared to later investors. Furthermore, unless our assets appreciate in an amount sufficient to offset the dilutive effect of the prior stock distributions, the value per share for investors who purchased our stock later in the offering will be below the value per share of earlier investors.
Future interest rate increases in response to inflation may inhibit our ability to conduct our business and acquire or dispose of real property or real estate-related debt investments at attractive prices and your overall return may be reduced.
While we expect a significant amount of our leases to be short-term multifamily leases that will not be affected by inflation, we will be exposed to inflation risk with respect to income from any long-term leases on real property and from related real estate debt investments as these may constitute a source of our cash flows from operations. Although inflation has been generally low in recent years, high inflation may in the future tighten credit and increase prices. Further, if interest rates rise, such as during an inflationary period, the cost of acquisition capital to purchasers may also rise, which could adversely impact our ability to dispose of our assets at attractive sales prices. Should we be required to acquire, hold or dispose of our assets during a period of inflation, our overall return may be reduced.
Our rights and the rights of our stockholders to recover claims against our independent directors are limited, which could reduce your and our recovery against them if they negligently cause us to incur losses.
Maryland law provides that a director has no liability in that capacity if he performs his duties in good faith, in a manner he reasonably believes to be in our best interests and with the care that an ordinarily prudent person in a like position would use under similar circumstances. Our charter provides that no independent director shall be liable to us or our stockholders for monetary damages and that we will generally indemnify them for losses unless they are grossly negligent or engage in willful misconduct. As a result, you and we may have more limited rights against our independent directors than might otherwise exist under common law, which could reduce our and your recovery from these persons if they act in a negligent manner. In addition, we may be obligated to fund the defense costs incurred by our independent directors (as well as by our other directors, officers, employees (if we ever have employees) and agents) in some cases, which would decrease the cash otherwise available for distributions to you. The SEC takes the position that indemnification against liabilities arising under the Securities Act is against public policy and unenforceable.
We may change our targeted investments, our policies and our operations without stockholder consent.
We expect to allocate a majority of our portfolio to investments in multifamily rental properties and debt secured by multifamily rental properties, but we may also purchase investments in condominium, office, retail, industrial, mixed-use, hospitality and healthcare properties and other real estate asset classes throughout the United States. Also, we are not restricted as to the following:
• | where we may acquire real estate investments; |
• | the amounts that may be invested in properties as compared with the amounts that we may invest in real estate-related debt investments or mortgage loans, each of which may be leveraged and will have differing risks and profit potential; or |
• | the amounts that may be invested in any one real estate investment (the greater the amounts invested in one asset, the greater the potential adverse effect on us if that asset is unprofitable). |
Though this is our current target portfolio, we may make adjustments to our target portfolio based on real estate market conditions and investment opportunities, and we may change our targeted investments and investment guidelines at any time without the consent of our stockholders, which could result in our making investments that are different from, and possibly riskier than, the investments we currently intend to acquire. A change in our targeted investments or investment guidelines could adversely affect the value of our common stock and our ability to make distributions to you.
Our Board of Directors determines our major policies, including our policies regarding financing, growth, debt capitalization, REIT qualification and distributions. Our Board of Directors may amend or revise these and other policies without a vote of the stockholders. Under Maryland General Corporation Law and our charter, our stockholders have a right to vote only
7
on limited matters. Our Board of Directors’ broad discretion in setting policies and our stockholders’ inability to exert control over those policies increases the uncertainty and risks you face as a stockholder.
Because the offering price in our distribution reinvestment plan offering exceeds our net tangible book value per share, investors in the offering will experience immediate dilution in the net tangible book value of their shares.
As of December 31, 2017, we are currently offering shares pursuant to our distribution reinvestment plan at $10.94 per share. Our current offering price exceeds our net tangible book value per share. Our net tangible book value per share is a rough approximation of value calculated as total book value of assets (exclusive of certain intangible items, including deferred financing costs) minus total liabilities, divided by the total number of shares of common stock outstanding. It assumes that the value of real estate assets diminishes predictably over time as shown through the depreciation and amortization of real estate investments. Real estate values have historically risen or fallen with market conditions. Net tangible book value is used generally as a conservative measure of net worth that we do not believe reflects our estimated value per share. It is not intended to reflect the value of our assets upon an orderly liquidation of the company in accordance with our investment objectives. Our net tangible book value reflects dilution in value of our common stock from the issue price as a result of (i) operating losses, which reflect accumulated depreciation and amortization of real estate investments, (ii) fees paid in connection with our initial public offering, including selling commissions and marketing fees re-allowed by our dealer manager to participating broker dealers, and (iii) stock distributions we have made. As of December 31, 2017, our net tangible book value per share was $4.43.
The actual value of shares that we repurchase under our share redemption program may be substantially less than what we pay.
As of December 31, 2017, under our share redemption program, shares currently may be repurchased at varying prices depending on (a) the purchase price paid for the shares and (b) whether the redemptions are sought upon a stockholder’s death, “qualifying disability” (as defined in the program), or confinement to a long-term care facility. The current maximum price that may be paid under the program is $10.94 per share, until such time that we announce a change in the net asset value per share. This redemption price is likely to differ from the price at which a stockholder could resell his or her shares for the reasons discussed in the risk factor above. Thus, when we repurchase shares of our common stock at $10.94 per share, the actual value of the shares that we repurchase may be less, and the repurchase may be dilutive to our remaining stockholders. Even at lower repurchase prices, the actual value of the shares may be substantially less than what we pay and the repurchase may be dilutive to our remaining stockholders.
We face risks associated with security breaches through cyber-attacks, cyber intrusions or otherwise, as well as other significant disruptions of our information technology, or IT, networks and related systems.
We will face risks associated with security breaches, whether through cyber-attacks or cyber intrusions over the Internet, malware, computer viruses, attachments to e-mails, persons inside our organization or persons with access to systems inside our organization, and other significant disruptions of our IT networks and related systems. The risk of a security breach or disruption, particularly through cyber-attack or cyber intrusion, including by computer hackers, foreign governments and cyber terrorists, has generally increased as the number, intensity and sophistication of attempted attacks and intrusions from around the world have increased. Our IT networks and related systems are essential to the operation of our business and our ability to perform day-to-day operations (including managing our building systems), and, in some cases, may be critical to the operations of certain of our tenants. There can be no assurance that our efforts to maintain the security and integrity of these types of IT networks and related systems will be effective or that attempted security breaches or disruptions would not be successful or damaging. A security breach or other significant disruption involving our IT networks and related systems could adversely impact our financial condition, results of operations, cash flows, and our ability to satisfy our debt service obligations and to pay distributions to our stockholders.
Risks Related to Conflicts of Interest
Our Advisor and its affiliates, including all of our executive officers, our affiliated directors and other key real estate professionals face conflicts of interest caused by their compensation arrangements with us, which could result in actions that are not in the long-term best interests of our stockholders.
All of our executive officers and our affiliated directors are also officers, directors, managers or key professionals of our Advisor, and other affiliated Resource Real Estate and/or C-III entities. Our Advisor and its affiliates receive substantial fees from us. These fees could influence our Advisor’s advice to us as well as the judgment of affiliates of our Advisor. Among other matters, these compensation arrangements could affect their judgment with respect to:
• | the continuation, renewal or enforcement of our agreements with our Advisor and its affiliates, including the advisory agreement and the management agreement; |
8
• | sales of properties and other investments, which may entitle our Advisor to disposition fees and the possible issuance to our Advisor of shares of our common stock through the conversion of our convertible stock; |
• | acquisitions of properties and investments in loans, which entitle our Advisor to acquisition and asset management fees, and, in the case of acquisitions or investments from other sponsored programs, might entitle affiliates of our Advisor to disposition fees in connection with its services for the seller; |
• | borrowings to acquire properties and other investments, which borrowings will increase the acquisition, debt financing, and asset management fees payable to our Advisor; |
• | whether and when we seek to list our common stock on a national securities exchange, which listing could entitle our Advisor to the issuance of shares of our common stock through the conversion of our convertible stock; |
• | whether we internalize our management, which may entail significant payments to affiliates of our Advisor; and |
• | whether and when we seek to sell the company or its assets, which sale could entitle our Advisor to disposition fees and to the issuance of shares of our common stock through the conversion of our convertible stock. |
The fees our Advisor receives in connection with the acquisition and management of assets are based on the cost of the investment, and not based on the quality of the investment or the quality of the services rendered to us. This may influence our Advisor to recommend riskier transactions to us.
Our Advisor will face conflicts of interest relating to the acquisition of assets and such conflicts may not be resolved in our favor, which could limit our ability to make distributions and reduce your overall investment return.
We rely on our sponsor and other key real estate professionals at our Advisor to identify suitable investment opportunities for us. The executive officers and several of the other key real estate professionals at our Advisor are also the key real estate professionals at the advisors to other sponsored programs and joint ventures. As such, sponsored programs and joint ventures rely on many of the same real estate professionals as will future programs. Many investment opportunities that are suitable for us may also be suitable for other programs and joint ventures. When these real estate professionals direct an investment opportunity to any sponsored program or joint venture, they, in their sole discretion, will offer the opportunity to the program or joint venture for which the investment opportunity is most suitable based on the investment objectives, portfolio and criteria of each program or joint venture. For so long as we are externally advised, our charter provides that it shall not be a proper purpose of the corporation for us to purchase real estate or any significant asset related to real estate unless our Advisor has recommended the investment to us. Thus, the real estate professionals of our Advisor could direct attractive investment opportunities to other entities. Such events could result in us investing in properties that provide less attractive returns, which may reduce our ability to make distributions to you.
Our Advisor will face conflicts of interest relating to joint ventures that we may form with affiliates of our Advisor, which conflicts could result in a disproportionate benefit to the other joint venture partners at our expense.
If approved by our conflicts committee, we may enter into joint venture agreements with other sponsored programs or affiliated entities for the acquisition, development or improvement of properties or other investments. Our Advisor and the advisors to the other Reasource Real Estate or C-III sponsored programs have the same executive officers and key employees; and these persons will face conflicts of interest in determining which program or investor should enter into any particular joint venture agreement. These persons may also face a conflict in structuring the terms of the relationship between our interests and the interests of the affiliated co-venturer and in managing the joint venture. Any joint venture agreement or transaction between us and an affiliated co-venturer will not have the benefit of arm’s length negotiation of the type normally conducted between unrelated co-venturers. The affiliated co-venturer may have economic or business interests or goals that are or may become inconsistent with our business interests or goals. These co-venturers may thus benefit to our and your detriment.
Our Advisor, the real estate professionals assembled by our Advisor, their affiliates and our officers face competing demands relating to their time, and this may cause our operations and your investment to suffer.
We rely on our Advisor, the real estate professionals our Advisor has assembled and their affiliates and officers for the day-to-day operation of our business. Our Advisor, its real estate professionals and affiliates, including our officers, have interests in other affiliated programs and engage in other business activities. As a result of their interests in other affiliated programs and the fact that they have engaged in and they will continue to engage in other business activities, they face conflicts of interest in allocating their time among us, our Advisor and other sponsored programs and other business activities in which they are involved. Should our Advisor breach its fiduciary duty to us by inappropriately devoting insufficient time or resources to our business, the returns on our investments may suffer.
9
Our executive officers and our affiliated directors face conflicts of interest related to their positions in our Advisor and its affiliates, including our property manager, which could hinder our ability to implement our business strategy and to generate returns to you.
Our executive officers and our affiliated directors are also executive officers, directors, managers and key professionals of our Advisor, our property manager and other affiliated Resource Real Estate and/or C-III entities. Their loyalties to these other entities could result in actions or inactions that breach their fiduciary duties to us and are detrimental to our business, which could harm the implementation of our business strategy and our investment and leasing opportunities. If we do not successfully implement our business strategy, we may be unable to generate the cash needed to make distributions to you and to maintain or increase the value of our assets.
Payment of substantial fees and expenses to our Advisor and its affiliates reduces cash available for investment and distribution
and increases the risk that you will not be able to recover the amount of your investment in our shares.
Our Advisor and its affiliates perform services for us in connection with the selection and acquisition of our investments, the management and leasing of our properties and the administration of our other investments. We pay them substantial fees for these services, which result in immediate dilution to the value of your investment and reduce the amount of cash available for investment or distribution to stockholders.
We also pay significant fees to our Advisor and its affiliates during our operational stage. Those fees include property management and debt servicing fees, asset management fees and obligations to reimburse our advisor and its affiliates for expenses they incur in connection with their providing services to us, including certain personnel services.
We may also pay significant fees during our listing/liquidation stage. The subordinated incentive fee that we will pay to our Advisor upon our investors receiving an agreed upon return on their investment is structured in the form of convertible stock. Our Advisor has exchanged 4,500 shares of our common stock for 45,000 shares of our convertible stock. As of December 31, 2017, our Advisor and affiliated persons owned 49,063 shares of our convertible stock, outside investors owned a total of 932 shares of our convertible stock. A total of 50,000 shares of convertible stock were issued, and 49,995 shares were outstanding at December 31, 2017.
Under limited circumstances, including the listing of our shares on a national securities exchange, these shares may be converted into shares of our common stock satisfying our obligation to pay our Advisor an incentive fee and diluting our stockholders’ interest in us.
Our Advisor can influence whether our common stock is listed for trading on a national securities exchange. Accordingly, our Advisor can influence the conversion of the convertible stock issued to it and the resulting dilution of other stockholders’ interests.
These fees and other potential payments increase the risk that the amount available for distribution to common stockholders upon a liquidation of our portfolio would be less than the purchase price of the shares in this offering. Substantial consideration paid to our Advisor and its affiliates also increases the risk that you will not be able to resell your shares at a profit, even if our shares are listed on a national securities exchange.
Risks Related to Our Corporate Structure
Our charter limits the number of shares a person may own, which may discourage a takeover that could otherwise result in a premium price to our stockholders.
Our charter, with certain exceptions, authorizes our directors to take such actions as are necessary and desirable to preserve our qualification as a REIT. To help us comply with the REIT ownership requirements of the Internal Revenue Code, our charter prohibits a person from directly or constructively owning more than 9.8% of our outstanding shares, unless exempted by our Board of Directors. This restriction may have the effect of delaying, deferring or preventing a change in control of us, including an extraordinary transaction (such as a merger, tender offer or sale of all, or substantially all, of our assets) that might provide a premium price for holders of our common stock.
Our charter permits our Board of Directors to issue stock with terms that may subordinate the rights of our common stockholders or discourage a third party from acquiring us in a manner that could result in a premium price to our stockholders.
10
Our Board of Directors may increase or decrease the aggregate number of shares of stock or the number of shares of stock of any class or series that we have authority to issue and classify or reclassify any unissued common stock or preferred stock and establish the preferences, conversion or other rights, voting powers, restrictions, limitations as to distributions, qualifications and terms or conditions of redemption of any such stock. Our board of directors could authorize the issuance of preferred stock with terms and conditions that could have priority as to distributions and amounts payable upon liquidation over the rights of the holders of our common stock. Such preferred stock could also have the effect of delaying, deferring or preventing a change in control of us, including an extraordinary transaction (such as a merger, tender offer or sale of all, or substantially all, of our assets) that might provide a premium price to holders of our common stock. A majority of our independent directors who do not have an interest in the transaction must approve any issuance of preferred stock.
You may not be able to sell your shares under our share redemption program and, if you are able to sell your shares under the program, you may not be able to recover the amount of your investment in our shares.
Our Board of Directors has approved the share redemption program, but may amend, suspend or terminate our share redemption program upon 30 days’ notice and without stockholder approval. Our Board of Directors may reject any request for redemption of shares. Further, there are many limitations on your ability to sell your shares pursuant to the share redemption program. Any stockholder requesting repurchase of their shares pursuant to our share redemption program will be required to certify to us that such stockholder acquired the shares by either (1) a purchase directly from us or (2) a transfer from the original investor by way of (i) a bona fide gift not for value to, or for the benefit of, a member of the stockholder’s immediate or extended family, (ii) a transfer to a custodian, trustee or other fiduciary for the account of the stockholder or his or her immediate or extended family in connection with an estate planning transaction, including by bequest or inheritance upon death or (iii) operation of law.
In addition, our share redemption program contains other restrictions and limitations. Shares will be redeemed on a quarterly basis, pro rata among all stockholders requesting redemption in such quarter, with a priority given to redemptions upon the death or qualifying disability of a stockholder or redemptions sought upon a stockholder’s confinement to a long-term care facility; next, to stockholders who demonstrate, in the discretion of our Board of Directors, another involuntary, exigent circumstance, such as bankruptcy; next, to stockholders subject to a mandatory distribution requirement under such stockholder’s IRA; and, finally, to other redemption requests. You must hold your shares for at least one year prior to seeking redemption under the share redemption program, except that our Board of Directors may waive this one-year holding requirement with respect to redemptions sought upon the death or qualifying disability of a stockholder or redemptions sought upon a stockholder’s confinement to a long-term care facility or for other exigent circumstances and that if a stockholder is redeeming all of his or her shares the Board of directors may waive the one-year holding requirement with respect to shares purchased pursuant to the distribution reinvestment plan. We will not redeem more than 5% of the weighted average number of shares outstanding during the twelve-month period immediately prior to the date of redemption. Our board of directors will determine from time to time, and at least quarterly, whether we have sufficient excess cash to repurchase shares. Generally, the cash available for redemption will be limited to proceeds from our distribution reinvestment plan plus 1% of the operating cash flow from the previous fiscal year (to the extent positive).
As of December 31, 2017, other than redemptions following the death or qualifying disability of a stockholder or redemptions sought upon a stockholder’s confinement to a long-term care facility, the purchase price for such shares we repurchase under our proposed redemption program equaled the greater of (a) 100% of the average issue price per share for all of your shares (as adjusted for any stock distributions, stock combinations, splits, recapitalizations and the like with respect to our common stock) or (b) 100% of the estimated value per share. Accordingly, you may receive less by selling your shares back to us than you would receive if our investments were sold for their estimated values and such proceeds were distributed in our liquidation.
Your interest in us will be diluted if we issue additional shares, which could reduce the overall value of your investment.
Our stockholders do not have preemptive rights to any shares we issue in the future. Our charter authorizes us to issue 1,010,050,000 shares of capital stock, of which 1,000,000,000 shares are designated as common stock, 50,000 shares are designated as convertible stock and 10,000,000 are designated as preferred stock. Our board of directors may increase the number of authorized shares of capital stock without stockholder approval. Our board may also elect to (1) sell additional equity securities in future public or private offerings; (2) issue shares of our common stock upon the exercise of the options we may grant to our independent directors or to our Advisor's or our Manager's employees; (3) issue shares to our Advisor, its successors or assigns, in payment of an outstanding obligation or as consideration in a related-party transaction; (4) issue shares of common stock upon the conversion of our convertible stock; or (5) issue shares of our common stock to sellers of properties we acquire in connection with an exchange of limited partnership interests of our operating partnership. To the extent we issue additional equity interests, your percentage ownership interest in us will be diluted. Further, depending upon the terms of such transactions, most notably the offering price per share, which may be less than the price paid per share in any public offering, and the value of our properties, existing stockholders may also experience a dilution in the book value of their investment in us.
11
If we are unable to obtain funding for future capital needs, cash distributions to our stockholders could be reduced and the value of our investments could decline.
If we need additional capital in the future to improve or maintain our properties or for any other reason, we may have to obtain financing from sources beyond our cash flow from operations, such as borrowings, sales of assets or future equity offerings. These sources of funding may not be available on attractive terms or at all. If we cannot procure additional funding for capital improvements, our investments may generate lower cash flows or decline in value, or both, which would limit our ability to make distributions to you and could reduce the value of your investment.
Our board of directors could opt into certain provisions of the Maryland General Corporation Law in the future, which may discourage others from trying to acquire control of us and may prevent our stockholders from receiving a premium price for their stock in connection with a business combination.
Under Maryland law, “business combinations” between a Maryland corporation and certain interested stockholders or affiliates of interested stockholders are prohibited for five years after the most recent date on which the interested stockholder becomes an interested stockholder. These business combinations include a merger, consolidation, share exchange, or, in circumstances specified in the statute, an asset transfer or issuance or reclassification of equity securities. Also under Maryland law, control shares of a Maryland corporation acquired in a control share acquisition have no voting rights except to the extent approved by a vote of two-thirds of the votes entitled to be cast on the matter. Shares owned by the acquirer, an officer of the corporation or an employee of the corporation who is also a director of the corporation are excluded from the vote on whether to accord voting rights to the control shares. Should our board opt into these provisions of Maryland law, it may discourage others from trying to acquire control of us and increase the difficulty of consummating any offer. Similarly, provisions of Title 3, Subtitle 8 of the Maryland General Corporation Law could provide similar anti-takeover protection.
Because Maryland law permits our board to adopt certain anti-takeover measures without stockholder approval, investors may be less likely to receive a “control premium” for their shares.
In 1999, the State of Maryland enacted legislation that enhances the power of Maryland corporations to protect themselves from unsolicited takeovers. Among other things, the legislation permits our board, without stockholder approval, to amend our charter to:
• | stagger our board of directors into three classes; |
• | require a two-thirds stockholder vote for removal of directors; |
• | provide that only the board can fix the size of the board; |
• | provide that all vacancies on the board, however created, may be filled only by the affirmative vote of a majority of the remaining directors in office; and |
• | require that special stockholder meetings may only be called by holders of a majority of the voting shares entitled to be cast at the meeting. |
Under Maryland law, a corporation can opt to be governed by some or all of these provisions if it has a class of equity securities registered under the Exchange Act, and has at least three independent directors. Our charter does not prohibit our board from opting into any of the above provisions permitted under Maryland law. Becoming governed by any of these provisions could discourage an extraordinary transaction (such as a merger, tender offer or sale of all or substantially all of our assets) that might provide a premium price for holders of our securities.
If we internalize our management functions, we could incur significant costs associated with being self-managed and may not be able to retain or replace key personnel; and we may have increased exposure to litigation as a result of internalizing our management functions.
We may internalize management functions provided by our Advisor, our Manager and their respective affiliates by acquiring assets and personnel from our advisor, our property manager or their affiliates. In the event we were to acquire our advisor or our property manager, we cannot be sure of the terms relating to any such acquisition.
If we internalize, we would no longer bear the costs of the various fees and expenses we expect to pay to our Advisor and to our Manager under their respective agreements; however, our direct expenses would increase due to the inclusion of general and administrative costs, including legal, accounting, and other expenses related to corporate governance, SEC reporting and compliance. We would also incur the compensation and benefits costs of our officers and other employees and consultants that are now paid by our Advisor, our Manager or their affiliates. We cannot reasonably estimate the amount of fees to our Advisor, Manager and other affiliates we would save, and the costs we would incur, if we acquired these entities. If the expenses we assume as a result of an internalization are higher than the expenses we avoid paying to our Advisor, our Manager and their affiliates, our
12
net income per share and funds from operations per share would be lower than they otherwise would have been had we not acquired these entities, potentially decreasing the amount of funds available for distribution.
Additionally, if we internalize our management functions, we would employ personnel and would be subject to potential liabilities commonly faced by employers, such as workers’ disability and compensation claims, potential labor disputes and other employee-related liabilities and grievances. Also, there can be no assurances that we will be successful in retaining key personnel at our advisor or property manager in the event of an internalization transaction. In addition, we could have difficulty integrating the functions currently performed by our Advisor, our Manager and their affiliates. Currently, the officers and employees of our Advisor, our Manager, and their affiliates perform asset management, property management, and general and administrative functions, including accounting and financial reporting, for multiple entities. We may fail to properly identify the appropriate mix of personnel and capital needs to operate as a stand-alone entity. An inability to manage an internalization transaction effectively could result in our incurring additional costs and/or experiencing deficiencies in our disclosures controls and procedures or our internal control over financial reporting. Such deficiencies could cause us to incur additional costs and our management’s attention could be diverted from effectively managing our properties and overseeing other real estate-related assets.
In addition, in recent years, internalization transactions have been the subject of stockholder litigation. Stockholder litigation can be costly and time-consuming, and there can be no assurance that any litigation expenses we might incur would not be significant or that the outcome of litigation would be favorable to us. Any amounts we are required to expend defending any such litigation will reduce the amount of funds available for investment by us in properties or other investments.
Risks Related to Investments in Real Estate
Economic and regulatory changes that impact the real estate market generally may decrease the value of our investments and weaken our operating results.
The properties we acquire and their performance are subject to the risks typically associated with real estate, including:
• | downturns in national, regional and local economic conditions; |
• | competition; |
• | adverse local conditions, such as oversupply or reduction in demand and changes in real estate zoning laws that may reduce the desirability of real estate in an area; |
• | vacancies, changes in market rental rates and the need to periodically repair, renovate and re-let space; |
• | changes in the supply of or the demand for similar or competing properties in an area; |
• | changes in interest rates and the availability of permanent mortgage financing, which may render the sale of a property or loan difficult or unattractive; |
• | changes in governmental regulations, including those involving tax, real estate usage, environmental and zoning laws; and |
• | periods of high interest rates and tight money supply. |
Any of the above factors, or a combination thereof, could result in a decrease in the value of our investments, which would have an adverse effect on our results of operations, reduce the cash available for distributions and the return on your investment.
Residents of multifamily rental properties that have experienced personal financial problems may delay enforcement of our rights, and we may incur substantial costs attempting to protect our investment.
The discounted real estate assets may involve investments in residential or commercial leases with residents or tenants who have experienced a downturn in their residential or business leases and with residents or tenants that have experienced difficulties with their personal financial situations such as a job loss, bankruptcy or bad credit rating, resulting in their failure to make timely rental payments or their default under their leases or debt instruments. In the event of any default by residents or tenants at our properties, we may experience delays in enforcing our rights and may incur substantial costs attempting to protect our investment.
The bankruptcy or insolvency of any resident or tenant also may adversely affect the income produced by our properties. If any resident or tenant becomes a debtor in a case under the U.S. Bankruptcy Code, our actions may be restricted by the bankruptcy court and our financial condition and results of operations could be adversely affected.
13
The operating costs of our properties will not necessarily decrease if our income decreases.
Certain expenses associated with ownership and operation of a property may be intentionally increased to enhance the short- and long-term success of the property in the form of capital gain and current income, such as:
• | increased staffing levels; |
• | enhanced technology applications; and |
• | increased marketing efforts. |
Certain expenses associated with the ownership and operation of a property are not necessarily reduced by events that adversely affect the income from the property, such as:
• | real estate taxes; |
• | insurance costs; and |
• | maintenance costs. |
For example, if the leased property loses tenants or rents are reduced, then those costs described in the preceding sentence are not necessarily reduced. As a result, our cost of owning and operating leased properties may, in the future, exceed the income the property generates even though the property’s income exceeded its costs at the time it was acquired. This would decrease the amount of cash available to us to distribute to you and could negatively affect your return on investment.
We will compete with third parties in acquiring, managing and selling properties and other investments, which could reduce our profitability and the return on your investment.
We believe that the current market for properties that meet our investment objectives is extremely competitive and many of our competitors have greater resources than we do. We will compete with numerous other entities engaged in real estate investment activities, including individuals, corporations, banks and insurance company investment accounts, other REITs, real estate limited partnerships, the U.S. government and other entities, to acquire, manage and sell real estate and real estate-related assets. Many of our expected competitors enjoy significant competitive advantages that result from, among other things, a lower cost of capital and enhanced operating efficiencies. In addition, the number of entities and the amount of funds competing for suitable investments may increase.
Competition with these entities may result in the following:
• | greater demand for the acquisition of real estate and real estate-related assets, which results in increased prices we must pay for our real estate and real estate-related assets; |
• | delayed investment of our capital; |
• | decreased availability of financing to us; or |
• | reductions in the size or desirability of the potential tenant base for one or more properties that we lease. |
If such events occur, you may experience a lower return on your investment.
Properties that have significant vacancies, especially discounted real estate assets, may experience delays in leasing up or could be difficult to sell, which could diminish our return on these properties.
A property may incur vacancies either by the expiration of tenant leases or the continued default of tenants under their leases. Further, our potential investments in value-add multifamily rental properties or other types of discounted properties may have significant vacancies at the time of acquisition. If vacancies continue for a prolonged period of time beyond the expected lease-up stage that we anticipate will follow any redevelopment or repositioning efforts, we may suffer reduced revenues resulting in less cash available for distributions. In addition, the resale value of the property could be diminished because the market value of a particular property depends principally upon the value of the cash flow generated by the leases associated with that property. Such a reduction on the resale value of a property could also reduce your return on investment.
We may have difficulty re-leasing underperforming or discounted properties because of the location or reputation of the property.
The nature of discounted real estate assets carries the risk that the properties underlying certain real estate investments may be located in areas of slow, stagnant, or declining economic growth. Such areas may experience high levels of crime and unemployment. In addition to the risks these conditions impose on the current tenants and owners of properties underlying the real estate investments, these conditions may harm the reputation of the property making it difficult to attract future more productive tenants and owners to the areas where the properties are located. The inability to re-lease or re-sell property abandoned, foreclosed
14
upon, or purchased in these areas may result in an unproductive use of our resources and could negatively affect our performance and your return on investment.
Because we rely on our Manager, its affiliates and third parties to manage the day-to-day affairs of any properties we acquire, should the staff of a particular property perform poorly, our operating results for that property will similarly be hindered and our net income may be reduced.
We depend upon the performance of our property managers to effectively manage our properties and real estate-related assets. Poor performance by those sales, leasing and other management staff members operating a particular property will necessarily translate into poor results of operations for that particular property. Should our Manager, its affiliates or third parties fail to identify problems in the day-to-day management of a particular property or fail to take the appropriate corrective action in a timely manner, our operating results may be hindered and our net income reduced.
If we are unable to sell a property for the price, on the terms or within the time frame we desire, it could limit our ability to pay cash distributions to you.
Many factors that are beyond our control affect the real estate market and could affect our ability to sell properties for the price, on the terms or within the time frame that we desire. These factors include general economic conditions, the availability of financing, interest rates and other factors, including supply and demand. Because real estate investments are relatively illiquid, we have a limited ability to vary our portfolio in response to changes in economic or other conditions. Further, before we can sell a property on the terms we want, it may be necessary to expend funds to correct defects or to make improvements. However, we can give no assurance that we will have the funds available to correct such defects or to make such improvements. We may be unable to sell our properties at a profit. Our inability to sell properties at the time and on the terms we want could reduce our cash flow and limit our ability to make distributions to you and could reduce the value of your investment.
Government entities, community associations and contractors may cause unforeseen delays and increase costs to redevelop and reposition value-add properties that we may acquire, which may reduce our net income and cash available for distributions to you.
We may seek to or be required to incur substantial capital obligations to redevelop or reposition existing properties that we acquire at a discount as a result of neglect of the previous owners or tenants of the properties and to sell the properties. Our Advisor and its key real estate professionals will do their best to acquire properties that do not require excessive redevelopment or modifications and that do not contain hidden defects or problems. There could, however, be unknown and excessive costs, expenses and delays associated with a discounted property’s redevelopment, repositioning or value-add upgrades. We will be subject to risks relating to the uncertainties associated with rezoning for redevelopment and other concerns of governmental entities, community associations and our construction manager’s ability to control costs and to build in conformity with plans and the established timeframe. We will pay a construction management fee to a construction manager, which may be our Manager or its affiliates, if new capital improvements are required.
If we are unable to increase rental rates or sell the redeveloped property at a price consistent with our value-add projections due to local market or economic conditions to offset the cost of the redevelopment or repositioning the property, the return on your investment may suffer. To the extent we acquire discounted properties in major metropolitan areas where the local government has imposed rent controls, we may be prohibited from increasing the rental rates to a level sufficient to cover the particular property’s redevelopment costs and expenses.
Costs of responding to both known and previously undetected environmental contamination and hazardous conditions may decrease our cash flows and limit our ability to make distributions.
Real property and the operations conducted on real property are subject to federal, state and local laws and regulations relating to protection of the environment and human health. We could be subject to liability in the form of fines, penalties or damages for noncompliance with these laws and regulations. These laws and regulations generally govern wastewater discharges, air emissions, the operation and removal of underground and above-ground storage tanks, the use, storage, treatment, transportation and disposal of solid and hazardous materials, the remediation of contamination associated with the release or disposal of solid and hazardous materials, the presence of toxic building materials, and other health and safety-related concerns.
Some of these laws and regulations may impose joint and several liability on the tenants, current or previous owners or operators of real property for the costs to investigate or remediate contaminated properties, whether the contamination occurred prior to purchase, or whether the acts causing the contamination were legal. These costs could be substantial. Such laws often impose liability whether or not the owner or operator knew of, or was responsible for, the presence of such hazardous or toxic
15
substances. Our tenants’ operations, the condition of properties at the time we buy them, operations in the vicinity of our properties, such as the presence of underground storage tanks, or activities of unrelated third parties may affect our properties.
Environmental laws also may impose liens on a property or restrictions on the manner in which a property may be used or businesses may be operated, and these restrictions may require substantial expenditures or prevent us from entering into leases with prospective tenants that may be impacted by such laws. Environmental laws provide for sanctions for noncompliance and may be enforced by governmental agencies or, in certain circumstances, by private parties. Certain environmental laws and common law principles could be used to impose liability for the release of and exposure to hazardous substances, including asbestos-containing materials and lead-based paint. Third parties may seek recovery from real property owners or operators for personal injury or property damage associated with exposure to released hazardous substances.
The presence of hazardous substances, or the failure to properly manage or remediate these substances, may hinder our ability to sell, rent or pledge such property as collateral for future borrowings. Any material expenditures, fines, penalties, or damages we must pay will reduce our ability to make distributions and may reduce the value of your investment.
Properties acquired by us may have toxic mold that could result in substantial liabilities to us.
Litigation and concern about indoor exposure to certain types of toxic molds has been increasing as the public becomes aware that exposure to mold can cause a variety of health effects and symptoms, including allergic reactions. It is impossible to eliminate all mold and mold spores in the indoor environment. Although we will attempt to acquire properties and loans secured by properties that do not contain toxic mold, there can be no assurance that none of the properties acquired by us will contain toxic mold. The difficulty in discovering indoor toxic mold growth could lead to an increased risk of lawsuits by affected persons and the risk that the cost to remediate toxic mold will exceed the value of the property. There is a risk that we may acquire properties that contain toxic mold and such properties may negatively affect our performance and your return on investment.
Uninsured losses relating to real property or excessively expensive premiums for insurance coverage could reduce our cash flows and the return on your investment.
There are types of losses, generally catastrophic in nature, such as losses due to wars, acts of terrorism, earthquakes, floods, hurricanes, pollution or environmental matters that are uninsurable or not economically insurable, or may be insured subject to limitations, such as large deductibles or co-payments. Insurance risks associated with potential acts of terrorism could sharply increase the premiums we pay for coverage against property and casualty claims. Additionally, mortgage lenders in some cases have begun to insist that commercial property owners purchase coverage against terrorism as a condition for providing mortgage loans. Such insurance policies may not be available at reasonable costs, if at all, which could inhibit our ability to finance or refinance our properties. In such instances, we may be required to provide other financial support, either through financial assurances or self-insurance, to cover potential losses. We may not have adequate coverage for such losses. If any of our properties incurs a casualty loss that is not fully insured, the value of our assets will be reduced by any such uninsured loss. In addition, other than any working capital reserve or other reserves we may establish, we have no source of funding to repair or reconstruct any uninsured property. Also, to the extent we must pay unexpectedly large amounts for insurance, we could suffer reduced earnings that would result in lower distributions.
Our costs associated with and the risk of failing to comply with the Americans with Disabilities Act, the Fair Housing Act and other tax credit programs may adversely affect cash available for distributions.
Our properties are generally expected to be subject to the Americans with Disabilities Act of 1990, as amended (the "Disabilities Act"). Under the Disabilities Act, all places of public accommodation are required to comply with federal requirements related to access and use by disabled persons. The Disabilities Act has separate compliance requirements for “public accommodations” and “commercial facilities” that generally require that buildings and services be made accessible and available to people with disabilities. The Disabilities Act’s requirements could require removal of access barriers and could result in the imposition of injunctive relief, monetary penalties or, in some cases, an award of damages. We will attempt to acquire properties that comply with the Disabilities Act or place the burden on the seller or other third party to ensure compliance with such laws. However, we cannot assure you that we will be able to acquire properties or allocate responsibilities in this manner. If we cannot, our funds used for compliance with these laws may affect cash available for distributions and the amount of distributions to you.
The multifamily rental properties we acquire must comply with Title III of the Disabilities Act, to the extent that such properties are “public accommodations” or “commercial facilities” as defined by the Disabilities Act. Compliance with the Disabilities Act could require removal of structural barriers to handicapped access in certain public areas of our apartment communities where such removal is readily achievable. The Disabilities Act does not, however, consider residential properties, such as multifamily rental properties, to be public accommodations or commercial facilities, except to the extent portions of such facilities, such as the leasing office, are open to the public.
16
We also must comply with the Fair Housing Amendment Act of 1988 (“FHAA”), which requires that multifamily rental properties first occupied after March 13, 1991 be accessible to handicapped residents and visitors. Compliance with the FHAA could require removal of structural barriers to handicapped access in a community, including the interiors of apartment units covered under the FHAA. Recently there has been heightened scrutiny of multifamily rental properties for compliance with the requirements of the FHAA and the Disabilities Act and an increasing number of substantial enforcement actions and private lawsuits have been brought against multifamily rental properties to ensure compliance with these requirements. Noncompliance with the FHAA and the Disabilities Act could result in the imposition of fines, awards of damages to private litigants, payment of attorneys’ fees and other costs to plaintiffs, substantial litigation costs and substantial costs of remediation.
Certain of our properties may be subject to the low income housing tax credits, historic preservation tax credits or other similar tax credit rules at the federal, state or municipal level. The application of these tax credit rules is extremely complicated and noncompliance with these rules may have adverse consequences for us. Noncompliance with applicable tax regulations may result in the loss of future or other tax credits and the fractional recapture of these tax credits already taken. Accordingly, noncompliance with these tax credit rules and related restrictions may adversely affect our ability to distribute any cash to our investors.
Our properties may be dispersed geographically and across various markets and sectors.
We may acquire and operate properties in different locations throughout the United States and in different markets and sectors. The success of our properties will depend largely on our ability to hire various managers and service providers in each area, market and sector where the properties are located or situated. It may be more challenging to manage a diverse portfolio. Failure to meet such challenges could reduce the value of your investment.
Newly constructed and existing multifamily rental properties or other properties that compete with any properties we may acquire in any particular location could adversely affect the operating results of our properties and our cash available for distribution.
We may acquire properties in locations that experience increases in construction of multifamily rental or other properties that compete with our properties. This increased competition and construction could:
• | make it more difficult for us to find residents to lease units in our apartment communities; |
• | force us to lower our rental prices in order to lease units in our apartment communities; or |
• | substantially reduce our revenues and cash available for distribution. |
Our efforts to upgrade multifamily rental properties to increase occupancy and raise rental rates through redevelopment and repositioning may fail, which may reduce our net income and the cash available for distributions to you.
The success of our ability to upgrade any multifamily rental properties that we may acquire and realize capital gains and current income for you on these investments materially depends upon the status of the economy where the multifamily rental property is located. Our revenues will be lower if the rental market cannot bear the higher rental rate that accompanies the upgraded multifamily rental property due to job losses or other economic hardships. Should the local market be unable to substantiate a higher rental rate for a multifamily rental property that we upgraded, we may not realize the premium rental we had assumed by a given upgrade and we may realize reduced rental income or a reduced gain or even loss upon the sale of the property. These events could cause us to reduce the cash available for distributions.
Repositioning risks could affect our profitability.
A component of our strategy is to renovate and reposition multifamily communities in order to effect long-term growth. Our renovation and repositioning activities generally entail certain risks, including the following:
• | funds may be expended and management’s time devoted to projects that may not be completed due to a variety of factors, including without limitation, the inability to obtain necessary governmental approvals; |
• | construction costs of a renovation or repositioning project may exceed original estimates, possibly making the project economically unfeasible or the economic return on a repositioned property less than anticipated; |
• | increased material and labor costs, problems with subcontractors, or other costs due to errors and omissions which occur in the renovation process; |
• | projects may be delayed due to required governmental approvals, adverse weather conditions, labor shortages or other unforeseen complications; |
• | occupancy rates and rents at a repositioned property may be less than anticipated; and |
• | the operating expenses at a repositioned property may be higher than anticipated. |
17
These risks may reduce the funds available for distribution to our stockholders. Further, the renovation and repositioning of properties is also subject to the general risks associated with real estate investments.
A concentration of our investments in any one property sector may leave our profitability vulnerable to a downturn or slowdown in such sector.
All of our investments are in the multifamily sector. Vacancy rates in multifamily rental properties and other commercial real estate properties may be related to jobless rates. As a result, we are subject to risks inherent in investments in a single type of property. The potential effects on our revenues, and as a result, on cash available for distribution, resulting from increased jobless rates as well as a general downturn or slowdown in multifamily properties could be more pronounced than if we had more fully diversified our investments.
Increased competition and the increased affordability of single-family and multifamily homes and condominiums for sale or rent could limit our ability to retain residents, lease apartment units or increase or maintain rents.
The multifamily rental properties that we own will most likely compete with numerous housing alternatives in attracting residents, including single-family and multifamily homes and condominiums. Due to the current economic conditions, competitive housing in a particular area and the increasing affordability of single-family and multifamily homes and condominiums to buy caused by relatively low mortgage interest rates and generous federal and state government programs to promote home ownership could adversely affect our ability to fully occupy any multifamily rental properties we may acquire. Further, single-family homes and condominiums available for rent could also adversely affect our ability to retain our residents, lease apartment units and increase or maintain rental rates.
Short-term multifamily leases expose us to the effects of declining market rent, which could adversely impact our ability to make cash distributions.
We expect that substantially all of our apartment leases will be for a term of one year or less. Because these leases generally permit the residents to leave at the end of the lease term or earlier in certain situations, such as when a resident loses his/her job, without penalty, our rental revenues may be impacted by declines in market rents more quickly than if our leases were for longer terms.
Risks Related to Investments in Real Estate-Related Debt Assets
Our investments in real estate-related debt investments are subject to the risks typically associated with real estate.
Our investments in mortgage, mezzanine or other real estate loans will generally be directly or indirectly secured by a lien on real property (or the equity interests in an entity that owns real property) that, upon the occurrence of a default on the loan, could result in our acquiring ownership of the property. We will not know whether the values of the properties ultimately securing our loans will remain at the levels existing on the dates of origination of those loans. If the values of the underlying properties drop, our risk will increase because of the lower value of the security associated with such loans. In this manner, real estate values could impact the values of our loan investments. Our investments in other real estate-related debt investments may be similarly affected by real estate property values. Therefore, our real estate-related debt investments are subject to the risks typically associated with real estate, which are described above under the heading “-Risks Related to Investments in Real Estate.”
If we make or invest in mortgage, mezzanine, bridge or other real estate loans, our loans will be subject to interest rate fluctuations that will affect our returns as compared to market interest rates; accordingly, the value of our stockholders’ investment would be subject to fluctuations in interest rates.
If we make or invest in fixed rate, long‑term loans and interest rates rise, the loans could yield a return that is lower than then‑current market rates. If interest rates decrease, we will be adversely affected to the extent that loans are prepaid because we may not be able to reinvest the proceeds at as high of an interest rate. If we invest in variable‑rate loans and interest rates decrease, our revenues will also decrease. For these reasons, if we invest in mortgage, mezzanine, bridge or other real estate loans, our returns on those loans and the value of our stockholders’ investment will be subject to fluctuations in interest rates.
Delays in liquidating defaulted mortgage loans could reduce our investment returns.
If we make or invest in mortgage loans and there are defaults under those mortgage loans, we may not be able to repossess and sell the underlying properties quickly. The resulting time delay could reduce the value of our investment in the defaulted mortgage loans. An action to foreclose on a property securing a mortgage loan is regulated by state statutes and regulations and is subject to many of the delays and expenses of other lawsuits if the defendant raises defenses or counterclaims. In the event of
18
default by a mortgagor, these restrictions, among other things, may impede our ability to foreclose on or sell the mortgaged property or to obtain proceeds sufficient to repay all amounts due to us on the mortgage loan.
Government action may reduce recoveries on defaulted loans.
Legislative or regulatory initiatives by federal, state or local legislative bodies or administrative agencies, if enacted or adopted, could delay foreclosure, provide new defenses to foreclosure or otherwise impair our ability to foreclose on real estate-related debt investments in default. Bankruptcy courts could, if this legislation is enacted, reduce the amount of the principal balance on a mortgage loan that is secured by a lien on the mortgaged property, reduce the interest rate, extend the term to maturity or otherwise modify the terms of a bankrupt borrower’s mortgage loan.
Property owners filing for bankruptcy may adversely affect us.
The filing of a petition in bankruptcy automatically stops or “stays” any actions to enforce the terms of all debt of the debtor, including a mortgage loan. The length of the stay and the costs associated with it will generally have an adverse impact on our profitability. Further, the bankruptcy court may take other actions that prevent us from foreclosing on the property. Any bankruptcy proceeding will, at a minimum, delay us in achieving our investment objectives and may adversely affect our profitability.
Investment in non‑conforming and non‑investment-grade loans may involve increased risk of loss.
Loans we may acquire may not conform to conventional loan criteria applied by traditional lenders and may not be rated or may be rated as non‑investment grade. Non-investment-grade ratings for these loans typically result from the overall leverage of the loans, the lack of a strong operating history for the properties underlying the loans, the borrowers’ credit history, the properties’ underlying cash flow or other factors. As a result, loans we acquire may have a higher risk of default and loss than conventional loans. Any loss we incur may reduce distributions to stockholders and adversely affect the value of our common stock.
Our investments in subordinated loans may be subject to losses.
We may acquire subordinated loans. In the event a borrower defaults on a subordinated loan and lacks sufficient capacity to cure the default, we may suffer a loss of principal or interest. In the event a borrower declares bankruptcy, we may not have full recourse to the assets of the borrower, or the assets of the borrower may not be sufficient to satisfy the loan. If a borrower defaults on our loan or on debt senior to our loan, or in the event of a borrower bankruptcy, our loan will be satisfied only after the senior debt is paid in full. Where debt senior to our loan exists, the presence of intercreditor arrangements may limit our ability to amend our loan documents, assign our loans, accept prepayments, exercise our remedies (through “standstill periods”), and control decisions made in bankruptcy proceedings relating to borrowers.
Investments in non-performing real estate assets involve greater risks than investments in stabilized, performing assets and make our future performance more difficult to predict.
Traditional performance metrics of real estate assets are generally not as reliable for non-performing real estate assets as they are for performing real estate assets. Non-performing properties, for example, do not have stabilized occupancy rates. Similarly, non-performing loans do not have a consistent stream of loan servicing or interest payments. In addition, for non-performing loans, often there is greater uncertainty that the face amount of the note will be paid in full.
In addition, we may pursue more than one strategy to create value in a non-performing real estate investment. With respect to a property, these strategies may include development, redevelopment, or lease-up of such property. With respect to a loan, these strategies may include negotiating with the borrower for a reduced payoff, restructuring the terms of the loan or enforcing our rights as lender under the loan and foreclosing on the collateral securing the loan.
The factors described above make it challenging to evaluate non-performing investments.
Delays in restructuring or liquidating non‑performing real estate securities could reduce the return on our stockholders’ investment.
Real estate securities may become non‑performing after acquisition for a wide variety of reasons. Such non‑performing real estate investments may require a substantial amount of workout negotiations or restructuring, which may entail, among other things, a substantial reduction in the interest rate and a substantial write‑down of such loan or asset. However, even if a restructuring is successfully accomplished, upon maturity of such real estate security, replacement “takeout” financing may not be available. We may find it necessary or desirable to foreclose on some of the collateral securing one or more of our investments. Inter-creditor provisions may substantially interfere with our ability to do so. Even if foreclosure is an option, the foreclosure process can be lengthy and expensive. Borrowers often resist foreclosure actions by asserting numerous claims, counterclaims and defenses,
19
including, without limitation, lender liability claims and defenses, in an effort to prolong the foreclosure action. In some states, foreclosure actions can take up to several years or more to litigate. At any time during the foreclosure proceedings, the borrower may file for bankruptcy, which would have the effect of staying the foreclosure action and further delaying the foreclosure process. Foreclosure litigation tends to create a negative public image of the collateral property and may result in disrupting ongoing leasing and management of the property. Foreclosure actions by senior lenders may substantially affect the amount that we may earn or recover from an investment.
We depend on debtors for our revenue, and, accordingly, our revenue and our ability to make distributions to our stockholders will be dependent upon the success and economic viability of such debtors.
The success of our real estate-related debt investments such as loans and debt and derivative securities materially depend on the financial stability of the debtors underlying such investments. The inability of a single major debtor or a number of smaller debtors to meet their payment obligations could result in reduced revenue or losses. In the event of a debtor default or bankruptcy, we may experience delays in enforcing our rights as a creditor, and such rights may be subordinated to the rights of other creditors. These events could negatively affect the cash available for distribution to our stockholders and the value of our stockholders’ investment.
Prepayments can adversely affect the yields on our investments.
Prepayments on debt instruments, where permitted under the debt documents, are influenced by changes in current interest rates and a variety of economic, geographic and other factors beyond our control, and consequently, such prepayment rates cannot be predicted with certainty. If we are unable to invest the proceeds of such prepayments received, the yield on our portfolio will decline. Under certain interest rate and prepayment scenarios, we may fail to recoup fully our cost of acquisition of certain investments.
Any credit ratings assigned to our investments will be subject to ongoing evaluations and revisions, and we cannot assure you that those ratings will not be downgraded.
Some of our investments may be rated by Moody’s Investors Service, Fitch Ratings or Standard & Poor's. Any credit ratings on our investments are subject to ongoing evaluation by credit rating agencies, and we cannot assure you that any such ratings will not be changed or withdrawn by a rating agency in the future if, in its judgment, circumstances warrant. If rating agencies assign a lower-than-expected rating or reduce or withdraw, or indicate that they may reduce or withdraw, their ratings of our investments in the future, the value of these investments could significantly decline, which would adversely affect the value of our investment portfolio and could result in losses upon disposition or the failure of borrowers to satisfy their debt service obligations to us. In addition, changes to the methodology and assumptions in rating commercial mortgage-backed securities by rating agencies may decrease the amount or availability of new issue commercial mortgage-backed securities rated in the highest investment grade rating category.
Risks Associated with Debt Financing
We have incurred, and may continue to incur, mortgage indebtedness and other borrowings, which increases our risk of loss due to foreclosure.
We have obtained, and may continue to obtain, lines of credit and long-term financing that may be secured by our properties and other assets. In some instances, we may acquire real properties by financing a portion of the price of the properties and mortgaging or pledging some or all of the properties purchased as security for that debt. We have also incurred, and may continue to incur, mortgage debt on properties that we already own in order to obtain funds to acquire additional properties. In addition, we may borrow as necessary or advisable to ensure that we maintain our qualification as a REIT for federal income tax purposes, including borrowings to satisfy the REIT requirement that we distribute at least 90% of our annual REIT taxable income to our stockholders (computed without regard to the dividends paid deduction and excluding net capital gain). We, however, can give you no assurance that we will be able to obtain such borrowings on satisfactory terms.
If we do mortgage a property and there is a shortfall between the cash flow from that property and the cash flow needed to service mortgage debt on that property, then the amount of cash available for distributions to stockholders may be reduced. In addition, incurring mortgage debt increases the risk of loss of a property since defaults on indebtedness secured by a property may result in lenders initiating foreclosure actions. In that case, we could lose the property securing the loan that is in default, reducing the value of your investment. For tax purposes, a foreclosure of any of our properties would be treated as a sale of the property for a purchase price equal to the outstanding balance of the debt secured by the mortgage. If the outstanding balance of the debt secured by the mortgage exceeds our tax basis in the property, we would recognize taxable income on foreclosure even though we would not necessarily receive any cash proceeds. We may give full or partial guaranties to lenders of mortgage debt on behalf of the entities that own our properties. When we give a guaranty on behalf of an entity that owns one of our properties, we will be
20
responsible to the lender for satisfaction of the debt if it is not paid by such entity. If any mortgages contain cross-collateralization or cross-default provisions, a default on a single property could affect multiple properties.
We may also obtain recourse debt to finance our acquisitions and meet our REIT distribution requirements. If we have insufficient income to service our recourse debt obligations, our lenders could institute proceedings against us to foreclose upon our assets. If a lender successfully forecloses upon any of our assets, our ability to pay cash distributions to our stockholders will be limited and you could lose all or part of your investment.
High mortgage interest rates may make it difficult for us to finance or refinance properties, which could reduce the number of properties we can acquire, our net income and the amount of cash distributions we can make.
If mortgage debt is unavailable at reasonable interest rates, we may not be able to finance the purchase of properties. If we place mortgage debt on properties, we run the risk of being unable to refinance the properties when the loans become due, or of being unable to refinance on favorable terms. If interest rates are higher when we refinance the properties, our income could be reduced. If any of these events occur, our cash flow would be reduced. This, in turn, would reduce cash available for distribution to you and may hinder our ability to raise more capital by issuing more stock or by borrowing more money.
We may not be able to access financing sources on attractive terms, which could adversely affect our ability to execute our business plan.
We may finance our assets over the long term through a variety of means, including credit facilities, issuance of commercial mortgage-backed securities, and other structured financings. Our ability to execute this strategy will depend on various conditions in the markets for financing in this manner that are beyond our control, including lack of liquidity and greater credit spreads. We cannot be certain that these markets will remain an efficient source of long‑term financing for our assets. If our strategy is not viable, we will have to find alternative forms of long‑term financing for our assets. This could subject us to more recourse indebtedness and the risk that debt service on less efficient forms of financing would require a larger portion of our cash flows, thereby reducing cash available for distribution to our stockholders and funds available for operations, as well as for future business opportunities.
Disruptions in the financial and real estate markets could adversely affect the multifamily property sector’s ability to obtain financing from Fannie Mae and Freddie Mac, which could adversely impact us.
Fannie Mae and Freddie Mac are major sources of financing for the multifamily sector. In the past, Fannie Mae and Freddie Mac have reported substantial losses and required significant amounts of additional capital. These losses coupled with the credit market’s poor perception of Fannie Mae and Freddie Mac, add to the considerable uncertainty surrounding the capital structure of both Fannie Mae and Freddie Mac. In response to the deteriorating financial condition of Fannie Mae and Freddie Mac and the credit market disruption that began in 2007, the U.S. Congress and Treasury undertook a series of actions to stabilize these government-sponsored enterprises and the financial markets. Pursuant to legislation enacted in 2008, the U.S. government placed both Fannie Mae and Freddie Mac under its conservatorship. Despite additional funding for both government-sponsored entities, the U.S. government has stated that it remains committed to reducing their portfolios. In August 2012, the U.S. Treasury modified its investment in Fannie Mae and Freddie Mac to accelerate the reduction of Fannie Mae’s and Freddie Mac’s investment portfolios and to require a sweep of all quarterly profits generated by Fannie Mae and Freddie Mac. In May 2014, the U.S. Senate Banking Committee approved legislation to wind down Fannie Mae and Freddie Mac and redesign the U.S. mortgage finance system, which legislation has to date not been acted on in the broader Senate. If new U.S. government legislation or regulations (i) heighten Fannie Mae’s and Freddie Mac’s underwriting standards, (ii) adversely affect interest rates and (iii) continue to reduce the amount of capital they can make available to the multifamily sector, it could reduce or remove entirely a vital resource for multifamily financing. Any potential reduction in loans, guarantees and credit enhancement arrangements from Fannie Mae and Freddie Mac could jeopardize the effectiveness of the multifamily sector’s available financing and decrease the amount of available liquidity and credit that could be used to acquire and diversify our portfolio of multifamily assets as well as dispose of our multifamily assets upon our liquidation.
Lenders may require us to enter into restrictive covenants relating to our operations, which could limit our ability to make distributions to our stockholders.
When providing financing, a lender may impose restrictions on us that affect our distribution and operating policies and our ability to incur additional debt. Loan documents we enter into may contain covenants that limit our ability to further mortgage the property, discontinue insurance coverage or replace our Advisor. These or other limitations may limit our flexibility and our ability to achieve our operating plans.
21
Increases in interest rates could increase the amount of our debt payments and limit our ability to pay distributions to our stockholders.
We expect that we will incur additional indebtedness in the future. Increases in interest rates may increase our interest costs, which would reduce our cash flows and our ability to pay distributions. In addition, if we need to repay existing debt during periods of higher interest rates, we might have to sell one or more of our investments in order to repay the debt, which sale at that time might not permit realization of the maximum return on such investments.
We have broad authority to incur debt, and high debt levels could hinder our ability to make distributions and decrease the value of your investment.
Although, based on current lending market conditions, we do not expect to incur debt financing that would cause our total liabilities to exceed approximately 55% to 65% of the aggregate value of our assets, our charter limits our leverage to 300% of our net assets, and we may exceed this limit with the approval of the conflicts committee of our board of directors. High debt levels would cause us to incur higher interest charges and higher debt service payments and may also be accompanied by restrictive covenants. These factors could limit the amount of cash we have available to distribute and could result in a decline in the value of your investment.
Federal Income Tax Risks
Our failure to continue to qualify as a REIT would subject us to federal income tax and reduce cash available for distribution to stockholders.
We elected to be taxed as a REIT under the Internal Revenue Code commencing with our taxable year ended December 31, 2010. We intend to continue to operate in a manner so as to continue to qualify as a REIT for federal income tax purposes. Qualification as a REIT involves the application of highly technical and complex Internal Revenue Code provisions for which only a limited number of judicial and administrative interpretations exist. Even an inadvertent or technical mistake could jeopardize our REIT status. Our continued qualification as a REIT will depend on our satisfaction of certain asset, income, organizational, distribution, stockholder ownership and other requirements on a continuing basis. Moreover, new tax legislation, administrative guidance or court decisions, in each instance potentially with retroactive effect, could make it more difficult or impossible for us to continue to qualify as a REIT. If we fail to continue to qualify as a REIT in any taxable year, we would be subject to federal and applicable state and local income tax on our taxable income at corporate rates, in which case we might be required to borrow or liquidate some investments in order to pay the applicable tax. Losing our REIT status would reduce our net income available for investment or distribution to you because of the additional tax liability. In addition, distributions to you would no longer qualify for the dividends-paid deduction and we would no longer be required to make distributions. Furthermore, if we fail to qualify as a REIT in any taxable year for which we have elected to be taxed as a REIT, we would generally be unable to elect REIT status for the four taxable years following the year in which our REIT status is lost.
Complying with REIT requirements may force us to borrow funds to make distributions to you or otherwise depend on external sources of capital to fund such distributions.
To continue to qualify as a REIT, we are required to distribute annually at least 90% of our taxable income, subject to certain adjustments, to our stockholders. To the extent that we satisfy the distribution requirement, but distribute less than 100% of our taxable income, we will be subject to federal corporate income tax on our undistributed taxable income. In addition, we may elect to retain and pay income tax on our net long-term capital gain. In that case, if we so elect, a stockholder would be taxed on its proportionate share of our undistributed long-term gain and would receive a credit or refund for its proportionate share of the tax we paid. A stockholder, including a tax-exempt or foreign stockholder, would have to file a federal income tax return to claim that credit or refund. Furthermore, we will be subject to a 4% nondeductible excise tax if the actual amount that we distribute to our stockholders in a calendar year is less than a minimum amount specified under federal tax laws.
From time-to-time, we may generate taxable income greater than our net income for GAAP. In addition, our taxable income may be greater than our cash flow available for distribution to you as a result of, among other things, investments in assets that generate taxable income in advance of the corresponding cash flow from the assets (for instance, if a borrower defers the payment of interest in cash pursuant to a contractual right or otherwise).
If we do not have other funds available in the situations described in the preceding paragraphs, we could be required to borrow funds on unfavorable terms, sell investments at disadvantageous prices or find another alternative source of funds to make distributions sufficient to enable us to distribute enough of our taxable income to satisfy the REIT distribution requirement and to avoid corporate income tax and the 4% excise tax in a particular year. These alternatives could increase our costs or reduce our equity.
22
Because of the distribution requirement, it is unlikely that we will be able to fund all future capital needs, including capital needs in connection with investments, from cash retained from operations. As a result, to fund future capital needs, we likely will have to rely on third-party sources of capital, including both debt and equity financing, which may or may not be available on favorable terms or at all. Our access to third-party sources of capital will depend upon a number of factors, including our current and potential future earnings and cash distributions.
Despite our qualification for taxation as a REIT for federal income tax purposes, we may be subject to other tax liabilities that reduce our cash flow and our ability to make distributions to you.
Despite our qualification for taxation as a REIT for federal income tax purposes, we may be subject to certain federal, state and local taxes on our income and assets, including taxes on any undistributed income or property. Any of these taxes would decrease cash available for distribution to you. For instance:
• | In order to continue to qualify as a REIT, we must distribute annually at least 90% of our REIT taxable income (which is determined without regard to the dividends paid deduction or net capital gain for this purpose) to you. |
• | To the extent that we satisfy the distribution requirement but distribute less than 100% of our REIT taxable income, we will be subject to federal corporate income tax on the undistributed income. |
• | We will be subject to a 4% nondeductible excise tax on the amount, if any, by which distributions we pay in any calendar year are less than the sum of 85% of our ordinary income, 95% of our capital gain net income and 100% of our undistributed income from prior years. |
• | If we have net income from the sale of foreclosure property that we hold primarily for sale to customers in the ordinary course of business or other non-qualifying income from foreclosure property, we must pay a tax on that income at the highest corporate income tax rate. |
• | If we sell an asset, other than foreclosure property, that we hold primarily for sale to customers in the ordinary course of business and do not qualify for a safe harbor in the Internal Revenue Code, our gain would be subject to the 100% “prohibited transaction” tax. |
• | Any domestic taxable REIT subsidiary, or TRS, of ours will be subject to federal corporate income tax on its income, and on any non-arm’s-length transactions between us and any TRS, for instance, excessive rents charged to a TRS could be subject to a 100% tax. |
• | We may be subject to tax on income from certain activities conducted as a result of taking title to collateral. |
• | We may be subject to state or local income, property and transfer taxes, such as mortgage recording taxes. |
Complying with REIT requirements may cause us to forego otherwise attractive opportunities or liquidate otherwise attractive investments.
To continue to qualify as a REIT for federal income tax purposes, we must continually satisfy tests concerning, among other things, the sources of our income, the nature and diversification of our assets, the amounts we distribute to stockholders and the ownership of our stock. As discussed above, we may be required to make distributions to stockholders at disadvantageous times or when we do not have funds readily available for distribution. Additionally, we may be unable to pursue investments that would be otherwise attractive to us in order to satisfy the requirements for qualifying as a REIT.
We must also ensure that at the end of each calendar quarter, at least 75% of the value of our assets consists of cash, cash items, government securities and qualified real estate assets, including certain mortgage loans and mortgage-backed securities. The remainder of our investment in securities (other than government securities and qualified real estate assets) generally cannot include more than 10% of the outstanding voting securities of any one issuer or more than 10% of the total value of the outstanding securities of any one issuer. In addition, in general, no more than 5% of the value of our assets can consist of the securities of any one issuer (other than government securities and qualified real estate assets) and no more than 20% of the value of our gross assets (25% for tax years ending before 2018) may be represented by securities of one or more TRSs. Finally, for the taxable years after 2015, no more than 25% of our assets may consist of debt investments that are issued by “publicly offered REITs” and would not otherwise be treated as qualifying real estate assets. If we fail to comply with these requirements at the end of any calendar quarter, we must correct such failure within 30 days after the end of the calendar quarter to avoid losing our REIT status and suffering adverse tax consequences, unless certain relief provisions apply. As a result, compliance with the REIT requirements may hinder our ability to operate solely on the basis of profit maximization and may require us to liquidate investments from our portfolio, or refrain from making, otherwise attractive investments. These actions could have the effect of reducing our income and amounts available for distribution to stockholders.
Complying with REIT requirements may limit our ability to hedge effectively.
23
The REIT provisions of the Internal Revenue Code may limit our ability to hedge our operations effectively. Our aggregate gross income from non-qualifying hedges, fees and certain other non-qualifying sources cannot exceed 5% of our annual gross income. As a result, we might have to limit our use of advantageous hedging techniques or implement those hedges through a TRS. Any hedging income earned by a TRS would be subject to federal, state and local income tax at regular corporate rates. This could increase the cost of our hedging activities or expose us to greater risks associated with interest rate or other changes than we would otherwise incur.
Liquidation of assets may jeopardize our REIT qualification.
To continue to qualify as a REIT, we must comply with requirements regarding our assets and our sources of income. If we are compelled to liquidate our investments to satisfy our obligations to our lenders, we may be unable to comply with these requirements, ultimately jeopardizing our qualification as a REIT, or we may be subject to a 100% prohibited transaction tax on any resulting gain if we sell assets that are treated as dealer property or inventory.
The prohibited transactions tax may limit our ability to engage in transactions, including disposition of assets and certain methods of securitizing loans, which would be treated as sales for federal income tax purposes.
A REIT’s net income from prohibited transactions is subject to a 100% tax. In general, prohibited transactions are sales or other dispositions of dealer property, other than foreclosure property, but including loans held primarily for sale to customers in the ordinary course of business. We might be subject to the prohibited transaction tax if we were to dispose of or securitize loans in a manner that is treated as a sale of the loans, for federal income tax purposes. In order to avoid the prohibited transactions tax, we may choose not to engage in certain sales of loans and may limit the structures we use for any securitization financing transactions, even though such sales or structures might otherwise be beneficial to us. Additionally, we may be subject to the prohibited transaction tax upon a disposition of real property. Although a safe-harbor exception to prohibited transaction treatment is available, we cannot assure you that we can comply with such safe harbor or that we will avoid owning property that may be characterized as held primarily for sale to customers in the ordinary course of our trade or business. Consequently, we may choose not to engage in certain sales of real property or may conduct such sales through a TRS.
It may be possible to reduce the impact of the prohibited transaction tax by conducting certain activities through a TRS. However, to the extent that we engage in such activities through a TRS, the income associated with such activities will be subject to a corporate income tax. In addition, the IRS may attempt to ignore or otherwise recast such activities in order to impose a prohibited transaction tax on us, and there can be no assurance that such recast will not be successful.
We also may not be able to use secured financing structures that would create taxable mortgage pools, other than in a TRS or through a subsidiary REIT.
We may recognize substantial amounts of REIT taxable income, which we would be required to distribute to you, in a year in which we are not profitable under GAAP principles or other economic measures.
We may recognize substantial amounts of REIT taxable income in years in which we are not profitable under GAAP or other economic measures as a result of the differences between GAAP and tax accounting methods. For instance, certain of our assets will be marked-to-market for GAAP purposes but not for tax purposes, which could result in losses for GAAP purposes that are not recognized in computing our REIT taxable income. Additionally, we may deduct our capital losses only to the extent of our capital gains in computing our REIT taxable income for a given taxable year. Consequently, we could recognize substantial amounts of REIT taxable income and would be required to distribute such income to you, in a year in which we are not profitable under GAAP or other economic measures.
We may distribute our common stock in a taxable distribution, in which case our stockholder may sell shares of our common stock to pay tax on such distributions, and our stockholders may receive less in cash than the amount of the dividend that is taxable.
We may make taxable distributions that are payable in cash and common stock. The IRS has issued private letter rulings to other REITs treating certain distributions that are paid partly in cash and partly in stock as taxable distributions that would satisfy the REIT annual distribution requirement and qualify for the dividends paid deduction for federal income tax purposes. Those rulings may be relied upon only by taxpayers to whom they were issued, but we could request a similar ruling from the IRS. Accordingly, it is unclear whether and to what extent we will be able to make taxable distributions payable in cash and common stock. If we made a taxable dividend payable in cash and common stock, taxable stockholders receiving such distributions will be required to include the dividend as taxable income to the extent of our current and accumulated earnings and profits, as determined for federal income tax purposes. As a result, stockholders may be required to pay income tax with respect to such distributions in excess of the cash distributions received. If a U.S. stockholder sells the common stock that it receives as a dividend in order to
24
pay this tax, the sales proceeds may be less than the amount recorded in earnings with respect to the dividend, depending on the market price of our common stock at the time of the sale. Furthermore, with respect to certain non-U.S. stockholders, we may be required to withhold U.S. federal income tax with respect to such dividends, including in respect of all or a portion of such dividend that is payable in common stock.
REIT distribution requirements could adversely affect our ability to execute our business plan.
We generally must distribute annually at least 90% of our REIT taxable income (which is determined without regard to the dividends paid deduction or net capital gain for this purpose) in order to continue to qualify as a REIT. We intend to make distributions to our stockholders to comply with the REIT requirements of the Internal Revenue Code and to avoid corporate income tax and the 4% excise tax. We may be required to make distributions to stockholders at times when it would be more advantageous to reinvest cash in our business or when we do not have funds readily available for distribution. Thus, compliance with the REIT requirements may hinder our ability to operate solely on the basis of maximizing profits.
Distributions paid by REITs do not qualify for the reduced tax rates that apply to other corporate distributions.
The maximum tax rate for “qualified dividends” paid by corporations to non-corporate stockholders is currently 20%. Distributions paid by REITs, however, generally are taxed at ordinary income rates (subject to a maximum rate of 37.0% for non-corporate stockholders), provided individuals may be able to deduct 20% of income received as ordinary REIT dividends (as of January 1, 2018), thus reducing the maximum effective federal income tax rate on such dividends, rather than the preferential rate applicable to qualified dividends.
Changes recently made to the U.S. tax laws could have a negative impact on our business.
The President signed a tax reform bill into law on December 22, 2017 (the “Tax Cuts and Jobs Act”). Among other things, the Tax Cuts and Jobs Act:
• | reduces the corporate income tax rate from 35% to 21% (including with respect to our taxable REIT subsidiary); |
• | reduces the rate of U.S. federal withholding tax on distributions made to non-U.S. stockholders by a REIT that are attributable to gains from the sale or exchange of U.S. real property interests from 35% to 21%; |
• | allows an immediate 100% deduction of the cost of certain capital asset investments (generally excluding real estate assets), subject to a phase-down of the deduction percentage over time; |
• | changes the recovery periods for certain real property and building improvements (for example, to 15 years for qualified improvement property under the modified accelerated cost recovery system, and to 30 years (previously 40 years) for residential real property and 20 years (previously 40 years) for qualified improvement property under the alternative depreciation system); |
• | restricts the deductibility of interest expense by businesses (generally, to 30% of the business’ adjusted taxable income) except, among others, real property businesses electing out of such restriction; we have not yet determined whether we and/or our subsidiaries can and/or will make such an election; |
• | requires the use of the less favorable alternative depreciation system to depreciate real property in the event a real property business elects to avoid the interest deduction restriction above; |
• | restricts the benefits of like-kind exchanges that defer capital gains for tax purposes to exchanges of real property; |
• | permanently repeals the “technical termination” rule for partnerships, meaning sales or exchanges of the interests in a partnership will be less likely to, among other things, terminate the taxable year of, and restart the depreciable lives of assets held by, such partnership for tax purposes; |
• | requires accrual method taxpayers to take certain amounts in income no later than the taxable year in which such income is taken into account as revenue in an applicable financial statement prepared under GAAP, which, with respect to certain leases, could accelerate the inclusion of rental income; |
• | eliminates the federal corporate alternative minimum tax; |
• | reduces the highest marginal income tax rate for individuals to 37% from 39.6% (excluding, in each case, the 3.8% Medicare tax on net investment income); |
• | generally allows a deduction for individuals equal to 20% of certain income from pass-through entities, including ordinary dividends distributed by a REIT (excluding capital gain dividends and qualified dividend income), generally resulting in a maximum effective federal income tax rate applicable to such dividends of 29.6% compared to 37% (excluding, in each case, the 3.8% Medicare tax on net investment income); and |
• | limits certain deductions for individuals, including deductions for state and local income taxes, and eliminates deductions for miscellaneous itemized deductions (including certain investment expenses). |
25
Many of the provisions in the Tax Cuts and Jobs Act, in particular those affecting individual taxpayers, expire at the end of 2025. As a result of the changes to U.S. federal tax laws implemented by the Tax Cuts and Jobs Act, our taxable income and the amount of distributions to our stockholders required in order to maintain our REIT status, and our relative tax advantage as a REIT, could change. As a REIT, we are required to distribute at least 90% of our taxable income to our stockholders annually.
The Tax Cuts and Jobs Act is a complex revision to the U.S. federal income tax laws with various impacts on different categories of taxpayers and industries, and will require subsequent rulemaking and interpretation in a number of areas. The long-term impact of the Tax Cuts and Jobs Act on the overall economy, government revenues, our tenants, us, and the real estate industry cannot be reliably predicted at this time. Furthermore, the Tax Cuts and Jobs Act may negatively impact certain of our tenants’ operating results, financial condition, and future business plans. The Tax Cuts and Jobs Act may also result in reduced government revenues, and therefore reduced government spending, which may negatively impact some of our tenants that rely on government funding. There can be no assurance that the Tax Cuts and Jobs Act will not negatively impact our operating results, financial condition, and future business operations.
At any time, the federal income tax laws can change. Laws and rules governing REITs or the administrative interpretations of those laws may be amended. Any of those new laws or interpretations may take effect retroactively and could adversely affect us or stockholders.
Retirement Plan Risks
If the fiduciary of an employee benefit plan subject to ERISA (such as a profit sharing, Section 401(k) or pension plan) or an owner of a retirement arrangement subject to Section 4975 of the Internal Revenue Code (such as an IRA) fails to meet the fiduciary and other standards under ERISA or the Internal Revenue Code as a result of an investment in our stock, the fiduciary could be subject to penalties and other sanctions.
There are special considerations that apply to employee benefit plans subject to ERISA (such as profit sharing, Section 401(k) or pension plans) and other retirement plans or accounts subject to Section 4975 of the Internal Revenue Code (such as an IRA) that are investing in our shares. Fiduciaries and IRA owners investing the assets of such a plan or account in our common stock should satisfy themselves that:
• | the investment is consistent with their fiduciary and other obligations under ERISA and the Internal Revenue Code; |
• | the investment is made in accordance with the documents and instruments governing the plan or IRA, including the plan’s or account’s investment policy; |
• | the investment satisfies the prudence and diversification requirements of Sections 404(a)(1)(B) and 404(a)(1)(C) of ERISA and other applicable provisions of ERISA and the Internal Revenue Code; |
• | the investment in our shares, for which no public market currently exists, is consistent with the liquidity needs of the plan or IRA; |
• | the investment will not produce an unacceptable amount of “unrelated business taxable income” for the plan or IRA; |
• | our stockholders will be able to comply with the requirements under ERISA and the Internal Revenue Code to value the assets of the plan or IRA annually; and |
• | the investment will not constitute a prohibited transaction under Section 406 of ERISA or Section 4975 of the Internal Revenue Code. |
Failure to satisfy the fiduciary standards of conduct and other applicable requirements of ERISA and the Internal Revenue Code may result in the imposition of civil and criminal penalties and could subject the fiduciary to claims for damages or for equitable remedies, including liability for investment losses. In addition, if an investment in our shares constitutes a prohibited transaction under ERISA or the Internal Revenue Code, the fiduciary or IRA owner who authorized or directed the investment may be subject to the imposition of excise taxes with respect to the amount invested. In addition, the investment transaction must be undone. In the case of a prohibited transaction involving an IRA owner, the IRA may be disqualified as a tax-exempt account and all of the assets of the IRA may be deemed distributed and subjected to tax. ERISA plan fiduciaries and IRA owners should consult with counsel before making an investment in our common stock.
If our assets are deemed to be plan assets, the Advisor and we may be exposed to liabilities under Title I of ERISA and the Internal Revenue Code.
In some circumstances where an ERISA plan holds an interest in an entity, the assets of the entity are deemed to be ERISA
26
plan assets unless an exception applies. This is known as the “look-through rule.” Under those circumstances, the obligations and other responsibilities of plan sponsors, plan fiduciaries and plan administrators, and of parties in interest and disqualified persons, under Title I of ERISA or Section 4975 of the Internal Revenue Code, may be applicable, and there may be liability under these and other provisions of ERISA and the Internal Revenue Code. We believe that our assets should not be treated as plan assets because the shares should qualify as “publicly-offered securities” that are exempt from the look-through rules under applicable Treasury Regulations. We note, however, that because certain limitations are imposed upon the transferability of shares so that we may qualify as a REIT, and perhaps for other reasons, it is possible that this exemption may not apply. If that is the case, and if the Advisor or we are exposed to liability under ERISA or the Internal Revenue Code, our performance and results of operations could be adversely affected. Prior to making an investment in us, you should consult with your legal and other advisors concerning the impact of ERISA and the Internal Revenue Code on your investment and our performance.
If you invest in our shares through an IRA or other retirement plan, you may be limited in your ability to withdraw required minimum distributions.
If you establish an IRA or other retirement plan through which you invest in our shares, federal law may require you to withdraw required minimum distributions ("RMDs") from such plan in the future. Our share redemption program limits the amount of redemptions that can be made in a given year. Additionally, you will not be eligible to have your shares redeemed until you have held your shares for at least one year. As a result, you may not be able to have your shares redeemed at a time in which you need liquidity to satisfy the RMD requirements under your IRA or other retirement plan. Even if you are able to have your shares redeemed, such redemption may be at a price less than the price at which the shares were initially purchased, depending on how long you have held your shares. If you fail to withdraw RMDs from your IRA or other retirement plan, you may be subject to certain tax penalties.
ITEM 1B. | UNRESOLVED STAFF COMMENTS |
Not applicable.
27
ITEM 2. PROPERTIES
Real Estate Investments
As of December 31, 2017, we owned interests in 30 multifamily properties. The following is a summary of our real estate properties (dollars in thousands):
Multifamily Community Name | City and State | Number of Units | Date of Acquisition (1) | Purchase Price (2) | Year of Construction | Average Unit Size (Sq. Ft.) | Physical Occupancy Rate (3) | Effective Monthly Revenue per Unit (4) | |||||||||||||
Vista Apartment Homes | (5)(6) | Philadelphia, PA | 133 | 6/17/2011 | $ | 12,000 | 1961 | 876 | 92.5% | $ | 1,598 | ||||||||||
Cannery Lofts | (7) (8) | Dayton, OH | 156 | 5/13/2011 | 7,100 | 1838 | 1,030 | 91.0% | 1,298 | ||||||||||||
Williamsburg | Cincinnati, OH | 976 | 6/20/2012 | 41,250 | 1966 | 1,099 | 86.6% | 1,014 | |||||||||||||
Retreat at Rocky Ridge | Hoover, AL | 206 | 4/18/2013 | 8,500 | 1986 | 869 | 89.9% | 899 | |||||||||||||
Trailpoint at the Woodlands | Houston, TX | 271 | 6/24/2013 | 27,200 | 1981 | 859 | 88.6% | 1,164 | |||||||||||||
The Westside Apartments | Plano, TX | 412 | 7/25/2013 | 32,200 | 1984 | 862 | 93.2% | 1,223 | |||||||||||||
Tech Center Square | Newport News, VA | 208 | 9/9/2013 | 18,250 | 1985 | 803 | 87.0% | 1,129 | |||||||||||||
Verona Apartment Homes | Littleton, CO | 276 | 9/30/2013 | 30,600 | 1985 | 744 | 92.0% | 1,353 | |||||||||||||
Skyview Apartment Homes | Westminster, CO | 224 | 9/30/2013 | 24,250 | 1985 | 748 | 92.0% | 1,250 | |||||||||||||
Maxwell Townhomes | San Antonio, TX | 316 | 12/16/2013 | 22,500 | 1982 | 1,015 | 89.9% | 1,186 | |||||||||||||
Meridian Pointe | Burnsville, MN | 339 | 12/20/2013 | 33,149 | 1988 | 982 | 89.1% | 1,422 | |||||||||||||
Evergreen at Coursey Place | (9) | Baton Rouge, LA | 352 | 1/28/2014 | 15,499 | 2003 | 999 | 86.6% | 1,207 | ||||||||||||
Pinehurst | (10) | Kansas City, MO | 146 | 1/28/2014 | 3,588 | 1983 | 816 | 95.2% | 861 | ||||||||||||
Pheasant Run | (10) | Lee's Summit, MO | 160 | 1/28/2014 | 4,277 | 1985 | 700 | 98.2% | 859 | ||||||||||||
Retreat at Shawnee | (10) | Shawnee, KS | 342 | 1/28/2014 | 5,369 | 1984 | 674 | 94.7% | 794 | ||||||||||||
Pines of York | (11) | Yorktown, VA | 248 | 1/28/2014 | 8,087 | 1974 | 987 | 96.8% | 1,046 | ||||||||||||
The Estates at Johns Creek | Alpharetta, GA | 403 | 3/28/2014 | 70,500 | 1999 | 1457 | 91.6% | 1,805 | |||||||||||||
Perimeter Circle | Atlanta, GA | 194 | 5/19/2014 | 29,500 | 1995 | 961 | 91.2% | 1,564 | |||||||||||||
Perimeter 5550 | Atlanta, GA | 165 | 5/19/2014 | 22,250 | 1995 | 906 | 93.9% | 1,429 | |||||||||||||
Aston at Cinco Ranch | Katy, TX | 228 | 6/26/2014 | 32,300 | 2000 | 1015 | 94.7% | 1,374 | |||||||||||||
Sunset Ridge | San Antonio, TX | 324 | 9/4/2014 | 35,000 | 1949 | 861 | 91.4% | 1,208 | |||||||||||||
Calloway at Las Colinas | Irving, TX | 536 | 9/29/2014 | 48,500 | 1984 | 850 | 93.7% | 1,222 | |||||||||||||
South Lamar Village | Austin, TX | 208 | 2/26/2015 | 24,000 | 1981 | 729 | 88.5% | 1,321 | |||||||||||||
Heritage Pointe | Gilbert, AZ | 458 | 3/19/2015 | 36,000 | 1986 | 697 | 91.9% | 942 | |||||||||||||
The Bryant at Yorba Linda | Yorba Linda, CA | 400 | 6/1/2015 | 118,000 | 1986 | 995 | 90.3% | 1,987 | |||||||||||||
Point Bonita Apartment Homes | Chula Vista, CA | 295 | 6/16/2015 | 49,050 | 1979 | 716 | 92.5% | 1,655 | |||||||||||||
Providence in the Park | Arlington, TX | 524 | 12/22/2016 | 63,200 | 1997 | 893 | 90.1% | 1,243 | |||||||||||||
Green Trails Apartment Homes | Lisle, IL | 440 | 5/31/2017 | 78,000 | 1988 | 828 | 88.4% | 1,474 | |||||||||||||
Terraces at Lake Mary | Lake Mary, FL | 284 | 8/31/2017 | 44,100 | 1998 | 988 | 95.1% | 1,293 | |||||||||||||
Courtney Meadows Apartments | Jacksonville, FL | 276 | 12/20/2017 | 41,400 | 2001 | 1047 | 88.0% | 1,085 | |||||||||||||
9,500 | |||||||||||||||||||||
(1) | The date of acquisition reflects the date we acquired the property, the note or the initial joint venture interest, where applicable. |
(2) | Purchase price excludes closing costs and acquisition expenses. For properties acquired through foreclosure, the purchase price reflects the contract purchase price of the note. |
(3) | Physical occupancy rate is defined as the units occupied as of December 31, 2017 divided by the total number of residential units. |
(4) | Effective monthly rental revenue per unit has been calculated based on the leases in effect as of December 31, 2017, adjusted for any tenant concessions, such as free rent. Effective monthly rental revenue per unit only includes base rents for occupied units, including affordable housing payments and subsidies. It includes other charges for storage, parking, pets, cleaning, clubhouse or other miscellaneous amounts. |
(5) | In addition to its apartment units, Vista Apartment Homes contains one commercial space which is occupied, and a number of antennae on the roof of the property that generate additional income. |
(6) | Vista Apartment Homes originally served as the collateral for a non-performing promissory note that we purchased on June 17, 2011. The contract purchase price for the note was $12.0 million, excluding closing costs. On August 2, 2011, we were the successful bidder at a sheriff's sale and formally received title to the property. |
(7) | In addition to its apartment units, Cannery Lofts contains 13 commercial spaces, 11 of which are occupied, and one parking garage with parking spaces available to rent. |
(8) | Cannery Lofts originally served as the collateral for a non-performing note that we purchased on May 13, 2011. On December 21, 2011, we entered into a settlement agreement with the borrower whereby the borrower agreed to a consensual foreclosure of the Cannery Note. We formally received title to the property on June 6, 2012. |
(9) | Joint venture interests in this property were originally purchased as a part of the Paladin acquisition in January 2014. The remaining interests in this joint venture were acquired on March 31, 2014. |
(10) | Joint venture interests in this property were originally purchased as a part of the Paladin acquisition in January 2014. The remaining interests in this joint venture were acquired on July 1, 2014. |
(11) | Joint venture interests in this property were originally purchased as a part of the Paladin acquisition in January 2014. The remaining interests in this joint venture were acquired on November 25, 2014. |
The following chart shows the geographic breakdown of our multifamily rental properties as of December 31, 2017 (based on net book value):
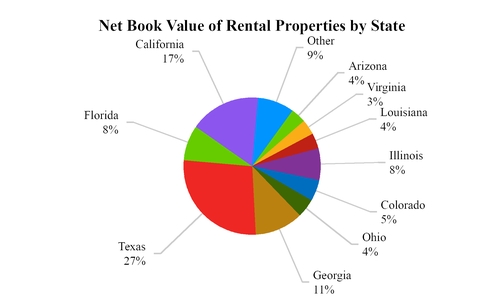
ITEM 3. LEGAL PROCEEDINGS
From time to time, we are party to legal proceedings, which arise in the ordinary course of our business. We are not currently involved in any legal proceedings of which the outcome is reasonably likely to have a material adverse effect on our results of operations or financial condition, nor are we aware of any such legal proceedings contemplated by governmental authorities.
ITEM 4. | MINE SAFETY DISCLOSURES |
Not applicable.
PART II.
ITEM 5. | MARKET FOR REGISTRANT'S COMMON EQUITY, RELATED STOCKHOLDER MATTERS AND ISSUER PURCHASES OF EQUITY SECURITIES |
Stockholder Information
As of March 21, 2018, we had 71,704,077 shares of common stock outstanding held by a total of 15,484 stockholders.
Market Information
There is no established public trading market for our common stock. Therefore, there is a risk that a stockholder may not be able to sell our stock at a time or price acceptable to the stockholder.
Estimated Value Per Share
On March 28, 2018, our board of directors approved an estimated value per share of the Company’s common stock of $10.80 based on the estimated market value of the Company’s portfolio of investments as of December 31, 2017. There have been no material changes between December 31, 2017 and the date of this filing that would impact the overall estimated value per share. We are providing this estimated value per share to assist broker-dealers that participated in our public offerings in meeting their customer account statement reporting obligations under National Association of Securities Dealers Conduct Rule 2340 as required by the Financial Industry Regulatory Authority (“FINRA”). This valuation was performed in accordance with the provisions of Practice Guideline 2013-01, Valuations of Publicly Registered Non-Listed REITs, issued by the Investment Program Association (“IPA”) in April 2013 (the “IPA Valuation Guidelines”).
Our Conflicts Committee, composed solely of all of our independent directors, is responsible for the oversight of the valuation process, including the review and approval of the valuation process and methodology used to determine the estimated value per share, the consistency of the valuation and appraisal methodologies with real estate industry standards and practices and the reasonableness of the assumptions used in the valuations and appraisals. With the approval of the conflicts committee, we engaged Duff & Phelps, LLC (“Duff & Phelps”) to provide a calculation of the range in estimated value per share of our common stock as of December 31, 2017. Duff & Phelps held discussions with senior management of our Advisor and conducted appraisals, investigations, research, review and analysis as it deemed necessary. Duff & Phelps based this range in estimated value per share upon its estimates of the “as is” market values of our interests in 30 multifamily properties and one debt investment. Duff & Phelps made adjustments to the aggregate estimated values of our investments to reflect balance sheet assets and liabilities provided by our management, which are disclosed in this Annual Report on Form 10-K before calculating a range of estimated values based on the number of outstanding shares of our common stock as of December 31, 2017. The valuation report that Duff & Phelps prepared (the “Valuation Report”) summarized the key inputs and assumptions involved in the appraisal of each of our investments. Duff & Phelps’s valuation was designed to follow the prescribed methodologies of the IPA Valuation Guidelines. The methodologies and assumptions used to determine the estimated value of our investments are described further below.
Upon the conflicts committee’s receipt and review of the Valuation Report and in light of other factors considered by our conflicts committee and the conflicts committee’s own extensive knowledge of our assets and liabilities, the conflicts committee concluded that the range in estimated value per share of $9.93 to $11.76, with an approximate midpoint value of $10.80 per share, as indicated in the Valuation Report, was appropriate. Upon recommendation by the Advisor, the Conflicts Committee recommended to our board of directors that it adopt $10.80 as the estimated value per share of our common stock, which approximates the midpoint value. Our board of directors unanimously agreed to accept the recommendation of the conflicts committee and approved $10.80 as the estimated value per share of our common stock, which determination is ultimately and solely the responsibility of the board of directors.
The following table summarizes the material components of the December 31, 2017 net asset value (in thousands, except per share amounts):
December 31, 2017 Net Asset Value | December 31, 2017 Net Asset Value per Share | ||||||
Investments | $ | 1,461,340 | $ | 20.50 | |||
Cash | 117,660 | 1.65 | |||||
Other Assets | 15,459 | 0.22 | |||||
Mortgage Notes Payable and Credit Facility | (802,617 | ) | (11.26 | ) | |||
Other Liabilities | (21,979 | ) | (0.31 | ) | |||
Net asset value | $ | 769,863 | $ | 10.80 | |||
The following table sets forth the calculation of our estimated net asset value per share as of December 31, 2017, as well as the calculation of our prior estimated net asset value per share as of December 31, 2016:
December 31, 2017 Net Asset Value per Share | December 31, 2016 Net Asset Value per Share (1) | Change in Estimated Value per Share | ||||||||||
Investments | $ | 20.50 | $ | 18.08 | $ | 2.42 | ||||||
Cash | 1.65 | 1.59 | 0.06 | |||||||||
Other Assets | 0.22 | 0.19 | 0.03 | |||||||||
Mortgage Notes Payable and Credit Facility | (11.26 | ) | (8.64 | ) | (2.62 | ) | ||||||
Other Liabilities | (0.31 | ) | (0.28 | ) | (0.03 | ) | ||||||
$ | 10.80 | $ | 10.94 | $ | (0.14 | ) | ||||||
(1) For information relating to the December 31, 2016 net asset value per share and the assumptions and methodologies used by Duff and Phelps and our management, see our Annual Report on Form 10-K filed on March 30, 2017.
As with any valuation methodology, the methodologies used are based upon a number of estimates and assumptions that may not be accurate or complete. Different parties with different assumptions and estimates could derive a different estimated value per share, and these differences could be significant. In particular, due in part to (i) the high concentration of our total assets in real estate, and (ii) the number of shares of our common stock outstanding, even modest changes in key assumptions made in appraising our real estate properties could have a very significant impact on the estimated value of our shares. The estimated value per share is not audited and does not represent the fair value of our assets less the fair value of our liabilities according to U.S. generally accepted accounting principles (“GAAP”), nor does it represent a liquidation value of our assets and liabilities or the amount that our shares of common stock would trade at on a national securities exchange. The estimated value per share does not reflect a discount for the fact that we are externally managed, nor does it reflect a real estate portfolio premium/discount versus the sum of the individual property values. The estimated value per share also does not take into account estimated disposition costs and fees for real estate properties, debt prepayment penalties that could apply upon the prepayment of certain of our debt obligations or the impact of restrictions on the assumption of debt.
Methodology
Our goal in calculating an estimated value per share is to arrive at a value that is reasonable and supportable using what we deem to be appropriate valuation and appraisal methodologies and assumptions and a process that is in accordance with the IPA Valuation Guidelines. The following is a summary of the valuation and appraisal methodologies used to calculate the estimated value per share:
Real Estate
Independent Valuation Firm
Duff & Phelps was recommended by the Advisor, and approved by the conflicts committee. Duff & Phelps is engaged in the business of appraising commercial real estate properties and is not affiliated with us or the Advisor. Neither we, the Advisor or any of its affiliates have engaged Duff & Phelps for any other types of services during the two years prior to the date of this
filing. Duff & Phelps and its affiliates may from time to time in the future perform other commercial real estate, appraisal and valuation services for us and our affiliates in transactions related to the properties that are the subjects of the appraisals, so long as such other services do not adversely affect the independence of the applicable Duff & Phelps appraiser as certified in the applicable appraisal reports.
The compensation Duff & Phelps received for its appraisal of our real estate properties was based on the scope of work and was not contingent upon the development or reporting of a predetermined value or direction in value that favors the cause of us, the amount of the value opinion, the attainment of a stipulated result, or the occurrence of a subsequent event directly related to the intended use of the appraisal. The appraisal was performed in accordance with the Code of Ethics & Standards of Professional Appraisal Practice of the Appraisal Institute and the Uniform Standards of Professional Appraisal Practice, or USPAP, the real estate appraisal industry standards created by The Appraisal Foundation. The Valuation Report was reviewed, approved and signed by an individual with the professional designation of MAI (Member of the Appraisal Institute). The use of the Valuation Report is subject to the requirements of the Appraisal Institute relating to review by its duly authorized representatives. In preparing the Valuation Report, Duff & Phelps did not, and was not requested to, solicit third party indications of interest for our common stock in connection with possible purchase thereof or the acquisition of all or any part of us.
Duff & Phelps collected all reasonably available material information that it deemed relevant in estimating the market value of our real estate properties and other investments. In conducting its investigations and analyses, Duff & Phelps took into account customary and accepted financial and commercial procedures and considerations as it deemed relevant. Although Duff & Phelps reviewed information supplied or otherwise made available by us or the Advisor for reasonableness, each assumed and relied upon the accuracy and completeness of all such information and of all information supplied or otherwise made available to it by any other party and did not independently verify any such information. Duff & Phelps relied on our management or the Advisor to advise it promptly if any information previously provided became inaccurate or was required to be updated during the period of its review.
In performing its analysis of our real estate properties and other investments, Duff & Phelps made numerous other assumptions as of various points in time with respect to industry performance, general business, economic and regulatory conditions and other matters, many of which are beyond its control and our control, as well as certain factual matters. For example, unless specifically informed to the contrary, Duff & Phelps assumed that we had clear and marketable title to each real estate property appraised, that no title defects existed, that no hazardous materials had been present or were present previously, that no deed restrictions existed, and that the properties were responsibly owned and managed by competent property management. Furthermore, Duff & Phelps’s analysis, opinions and conclusions were necessarily based upon market, economic, financial and other circumstances and conditions existing as of or prior to the date of the appraisals, and any material change in such circumstances and conditions may affect Duff & Phelps’s analyses and conclusions. The Valuation Report contains other assumptions, qualifications and limitations that qualify the analysis, opinions and conclusions set forth therein. Furthermore, the prices at which our real estate properties may actually be sold could differ from their appraised values. The Valuation Report, including the analyses, opinions and conclusions set forth in such report, is qualified by the assumptions, qualifications and limitations set forth in the Valuation Report.
The foregoing is a summary of the standard assumptions, qualifications and limitations that generally apply to the Valuation Report.
Real Estate Valuation
Duff & Phelps estimated the “as is” market value of each of our real estate properties owned as of December 31, 2017, using various methodologies, including the direct capitalization approach, discounted cash flow analyses and sales comparison approach, and relied primarily on the direct capitalization approach for our stabilized properties and discounted cash flow analyses for our unstabilized properties. The sales comparison approach was utilized as a secondary approach to value. The direct capitalization approach applies a current market capitalization rate to the properties’ net operating income. The capitalization rate was based on recent national overall capitalization rates, and the net operating income (NOI) was estimated based on Duff & Phelps’s expertise in appraising commercial real estate. The direct capitalization approach was utilized for eight of our properties that have finished renovations and stabilized their operations. Discounted cash flow analyses focus on the operating cash flows expected from the properties and the anticipated proceeds of hypothetical sales at the end of assumed holding periods, which are then discounted to their present value. Discounted cash flow analyses were utilized for 21 of our properties that were recently acquired and either not yet stabilized or are currently undergoing renovations. One property was valued at its purchase price as it was purchased shortly before December 31, 2017. Real estate is currently carried in our financial statements at its amortized cost basis. Duff & Phelps performed its appraisals as of December 31, 2017.
The following summarizes the range of overall capitalization rates used to arrive at the estimated market values of our eight stabilized properties:
Range in Values | Weighted Average Basis | ||
Overall Capitalization Rate | 5.75% to 6.50% | 6.23% | |
The following summarizes the range of terminal capitalization rates and discount rates used to arrive at the estimated market values of 18 unstabilized properties and three stabilized properties that are currently undergoing renovations:
Range in Values | Weighted Average Basis | ||
Terminal Capitalization Rate | 4.75% to 6.00% | 5.31% | |
Discount Rate | 6.25% to 7.50% | 6.83% | |
While we believe that Duff & Phelps’ assumptions and inputs are reasonable, a change in these assumptions and inputs would significantly impact the calculation of the appraised value of our real estate properties and other assets and, thus, its estimated value per share. As of December 31, 2017, the majority of our real estate assets have non-stabilized occupancies. Appraisals may provide a sense of the value of the investment, but any appraisal of the property will be based on numerous estimates, judgments and assumptions that significantly affect the appraised value of the underlying property. An appraisal of a non-stabilized property, in particular, involves a high degree of subjectivity due to higher vacancy levels and uncertainties with respect to future market rental rates and timing of lease-up and stabilization. Accordingly, different assumptions may materially change the appraised value of the property.
The total appraised value of our real estate properties using the appraisal methodologies described above was $1.46 billion compared to a total of purchase price and capital expenditures, through December 31, 2017, of $1.1 billion.
The table below illustrates the impact on the estimated value per share if the overall capitalization rates or discount rates were adjusted by 25 basis points, and assuming all other factors remain unchanged, with respect to the real estate properties referenced in the table above. Additionally, the table below illustrates the impact on the estimated value per share if the overall capitalization rates or discount rates were adjusted by 5% in accordance with the IPA Valuation Guidelines, assuming all other factors remain unchanged. The table is only hypothetical to illustrate possible results if only one change in assumptions was made, with all other factors held constant. Further, each of these assumptions could change by more than 25 basis points or 5%. Since the majority of the valuations employed utilized the discounted cash flow methodology, changes in terminal capitalization rates yielded minimal variances and are therefore excluded from the table below.
Change in Estimated Value per Share | ||||||||
Increase of 25 Basis Points | Decrease of 25 Basis Points | Increase of 5% | Decrease of 5% | |||||
Overall Capitalization Rate | $10.62 | $10.99 | $10.58 | $11.04 | ||||
Discount Rate | $10.74 | $10.86 | $10.72 | $10.88 | ||||
Debt and Preferred Equity Investments
Duff & Phelps estimated the market value of our debt and preferred equity investments, which totaled approximately $933,727, or less than 1% of our assets, by making mark-to-market adjustments to the outstanding balances owed to us under these investments as of December 31, 2017.
Other Assets and Liabilities
Duff & Phelps made adjustments to the aggregate estimated values of our investments to reflect balance sheet assets and liabilities provided by our management, which are disclosed in this Annual Report on Form 10-K.
Limitations of Estimated Value Per Share
As mentioned above, we are providing this estimated value per share to assist broker dealers that participated in our public offering in meeting their customer account statement reporting obligations. This valuation was performed in accordance with the provisions of the IPA Valuation Guidelines. The estimated value per share set forth above will first appear on the March 31, 2018 customer account statements that will be mailed in April 2018. As with any valuation methodology, the methodologies used are based upon a number of estimates and assumptions that may not be accurate or complete. Different parties with different assumptions and estimates could derive a different estimated value per share, and this difference could be significant. The estimated value per share is not audited and does not represent the fair value of our assets or liabilities according to GAAP.
Accordingly, with respect to the estimated value per share, we can give no assurance that:
• | a stockholder would be able to resell his or her shares at the estimated value per share; |
• | a stockholder would ultimately realize distributions per share equal to our estimated value per share upon liquidation of our assets and settlement of its liabilities or a sale of our company; |
• | our shares of common stock would trade at the estimated value per share on a national securities exchange; |
• | a third party would offer the estimated value per share in an arm’s-length transaction to purchase all or substantially all of our shares of common stock; |
• | another independent third-party appraiser or third-party valuation firm would agree with the our estimated value per share; or |
• | the methodology used to calculate our estimated value per share would be acceptable to FINRA or for compliance with ERISA reporting requirements. |
Further, the estimated value per share as of December 31, 2017 is based on the estimated value of our investments as of December 31, 2017. We did not make any adjustments to the valuation for the impact of other transactions occurring subsequent to December 31, 2017, including, but not limited to, (i) the issuance of common stock under the distribution reinvestment plan, (ii) net operating income earned and distributions declared, (iii) the redemption of shares and (iv) the potential conversion of convertible stock into common stock. The value of our shares will fluctuate over time in response to developments related to individual assets in our portfolio and the management of those assets and in response to the real estate and finance markets. Because of, among other factors, our high concentration of total assets in real estate and the number of shares of our common stock outstanding, any change in the value of individual assets in the portfolio, particularly changes affecting our real estate properties, could have a very significant impact on the value of our shares. The estimated value per share does not reflect a discount for the fact that we are externally managed, nor does it reflect a real estate portfolio premium/discount versus the sum of the individual property values. The estimated value per share also does not take into account estimated disposition costs and fees for real estate properties, debt prepayment penalties that could apply upon the prepayment of certain of our debt obligations or the impact of restrictions on the assumption of debt.
Distribution Reinvestment Plan
In accordance with our distribution reinvestment plan, participants in the distribution reinvestment plan acquire shares of common stock under the plan at a price equal to the estimated value per share of our common stock. Commencing on the next distribution reinvestment plan purchase date, which is on April 2, 2018, participants will acquire shares of our common stock under the plan at a price equal to $10.80 per share.
As provided under the distribution reinvestment plan, for a participant to terminate participation effective for a particular distribution, we must have received notice of termination from the participant at least ten business days prior to the last day of the month to which the distribution relates. If a participant wishes to terminate participation in the distribution reinvestment plan effective for the April 2018 purchase date, participants must notify the Company in writing of such decision, and we must receive the notice by the close of business on April 16, 2018, which is ten business days prior to the last day of April 2018, as provided under the distribution reinvestment plan.
Notice of termination should be sent by facsimile to 877-894-1124 or by mail to c/o Resource Real Estate Opportunity REIT, Inc., P.O. Box 219169, Kansas City, Missouri 64121.
Share Redemption Program
As of December 31, 2017, the redemption price for shares eligible for redemption was the greater of (a) 100% of the average issue price per share for all of the stockholder’s shares (as adjusted for any stock distributions, stock combinations, splits, recapitalizations and the like) or (b) 100% of the estimated value per share.
On March 28, 2018, our board of directors adopted a Second Amended and Restated Share Redemption Program (the “Amended SRP”). Pursuant to the Amended SRP, we will redeem shares at a purchase price equal to 95% of the current per share net asset value. The Amended SRP will be effective for all redemptions occurring after April 29, 2018.
For a stockholder’s shares to be eligible for redemption in June 2018 or to withdraw a redemption request, we must receive a written notice from the stockholder or from an authorized representative of the stockholder in good order and on a form approved by the Company by May 31, 2018.
The complete share redemption program plan document is filed as an exhibit to our Quarterly Report on Form 10-Q filed with the SEC on November 14, 2011 and is available at the SEC’s website at http://www.sec.gov and the amendment is an exhibit to the current 10-K.
Unregistered Sale of Equity Securities
All securities sold by us during the year ended December 31, 2017 were sold in an offering registered under the Securities Act.
Redemption of Securities
During the quarter ended December 31, 2017, we redeemed shares as follows:
Period | Total Number of Shares Redeemed (1) | Average Price Paid per Share | Cumulative Number of Shares Purchased as Part of a Publicly Announced Plan or Program (2) | Approximate Dollar Value of Shares Available That May Yet Be Redeemed Under the Program | ||||||
October 2017 | — | $ | — | — | (3) | |||||
November 2017 | — | $ | — | — | (3) | |||||
December 2017 | 856,120 | $ | 10.94 | 3,190,000 | (3) | |||||
856,120 | ||||||||||
(1) All purchases of our equity securities by us in the three months ended December 31, 2017 were made pursuant to our share redemption program.
(2) We announced the commencement of the program on June 16, 2010, and it was subsequently amended on September 29, 2011.
(3) We currently limit the dollar value and number of shares that may yet be redeemed under the program as described below.
There are several limitations on our ability to repurchase shares under the program:
We will not redeem in excess of 5% of the weighted-average number of shares outstanding during the 12-month period immediately prior to the effective date of redemption. Our board of directors will determine at least quarterly whether we have sufficient excess cash to repurchase shares. Generally, the cash available for redemption will be limited to proceeds from our distribution reinvestment plan plus, if we had positive operating cash flow from the previous fiscal year, 1% of all operating cash flow from the previous fiscal year.
Our share redemption program, including redemptions sought upon a stockholder's death or disability or upon confinement of a stockholder to a long-term care facility, will be available only for stockholders who purchase their shares directly from us or the transferees mentioned below, and is not intended to provide liquidity to any stockholder who acquired his or her shares by purchase from another stockholder. In connection with a request for redemption, the stockholder or his or her estate, heir or beneficiary will be required to certify to us that the stockholder acquired the shares to be repurchased either (1) directly from us or (2) from the original investor by way of (i) a bona fide gift not for value to, or for the benefit of, a member of the investor's immediate or extended family (including the investor's spouse, parents, siblings, children or grandchildren and including relatives
by marriage), (ii) through a transfer to a custodian, trustee or other fiduciary for the account of the investor or members of the investor's immediate or extended family in connection with an estate planning transaction, including by bequest or inheritance upon death or (iii) operation of law.
Our board of directors, in its sole discretion, may suspend, terminate or amend our share redemption program without stockholder approval upon 30 days' notice if it determines that such suspension, termination or amendment is in our best interest. Our board may also reduce the number of shares purchased under the share redemption program if it determines the funds otherwise available to fund our share redemption program are needed for other purposes. These limitations apply to all redemptions, including redemptions sought upon a stockholder's death, qualifying disability or confinement to a long-term care facility.
All redemption requests tendered were honored for the year ended December 31, 2017.
Distribution Information
During the year ended December 31, 2017, we paid aggregate distributions of $43.0 million, including $15.9 million of distributions paid in cash and $27.1 million of distributions reinvested in shares of common stock through our distribution reinvestment plan, as follows (dollars in thousands, except per share data):
Record Date | Per Common Share | Distribution Date | Distributions reinvested in shares of Common Stock | Net Cash Distributions | Total Aggregate Distributions | |||||||||||||
January 30, 2017 | $ | 0.05 | January 31, 2017 | $ | 2,329 | $ | 1,272 | $ | 3,601 | |||||||||
February 27, 2017 | 0.05 | February 28, 2017 | 2,308 | 1,303 | 3,611 | |||||||||||||
March 30, 2017 | 0.05 | March 31, 2017 | 2,274 | 1,314 | 3,588 | |||||||||||||
April 27, 2017 | 0.05 | April 28, 2017 | 2,273 | 1,324 | 3,597 | |||||||||||||
May 30, 2017 | 0.05 | May 31, 2017 | 2,258 | 1,350 | 3,608 | |||||||||||||
June 29, 2017 | 0.05 | June 30, 2017 | 2,249 | 1,322 | 3,571 | |||||||||||||
July 28, 2017 | 0.05 | July 31, 2017 | 2,247 | 1,333 | 3,580 | |||||||||||||
August 30, 2017 | 0.05 | August 31, 2017 | 2,250 | 1,340 | 3,590 | |||||||||||||
September 28, 2017 | 0.05 | September 29, 2017 | 2,233 | 1,335 | 3,568 | |||||||||||||
October 30, 2017 | 0.05 | October 31, 2017 | 2,237 | 1,339 | 3,576 | |||||||||||||
November 29, 2017 | 0.05 | November 30, 2017 | 2,239 | 1,349 | 3,588 | |||||||||||||
December 28, 2017 | 0.05 | December 29, 2017 | 2,217 | 1,338 | 3,555 | |||||||||||||
$ | 0.60 | $ | 27,114 | $ | 15,919 | $ | 43,033 | |||||||||||
Distributions paid, distributions declared and sources of distributions paid were as follows for the year ended December 31, 2017 (dollars in thousands, except per share data):
Distributions Paid | Distributions Declared | Sources of Distributions Paid | |||||||||||||||||||||||
Amount Paid/Percent of Total | |||||||||||||||||||||||||
2017 | Cash | Distributions Reinvested (DRIP) | Total | Cash Provided By Operating Activities | Total | Per Share | Operating Activities | Debt Financing | Dispositions | ||||||||||||||||
First Quarter | $ | 3,889 | $ | 6,911 | $ | 10,800 | $ | 3,433 | $ | 10,800 | $0.15 | $3,433 / 32% | $7,367 / 68% | — | |||||||||||
Second Quarter | $ | 3,997 | $ | 6,780 | $ | 10,777 | $ | 1,167 | $ | 10,777 | $0.15 | $1,167 / 11% | — | $9,610 / 89% | |||||||||||
Third Quarter | $ | 4,007 | $ | 6,730 | $ | 10,737 | $ | 5,237 | $ | 10,737 | $0.15 | $5,237 / 49% | — | $5,500 / 51% | |||||||||||
Fourth Quarter | $ | 4,026 | $ | 6,693 | $ | 10,719 | $ | 2,151 | $ | 10,719 | $0.15 | $2,151 / 20% | — | $8,868 / 80% | |||||||||||
Total | $ | 15,919 | $ | 27,114 | $ | 43,033 | $ | 11,988 | $ | 43,033 | $0.60 | $11,988/ 28% | $7,367 / 17% | $23,678 / 55% | |||||||||||
We have elected to be taxed as a REIT and to operate as a REIT beginning with our taxable year ended December 31, 2010. To maintain our qualification as a REIT, we will be required to make aggregate annual distributions to our common stockholders of at least 90% of our REIT taxable income (computed without regard to the dividends paid deduction and excluding net capital gain). Our Board of Directors may authorize distributions in excess of those required for us to maintain REIT status depending on our financial condition and such other factors as our Board of Directors deems relevant.
Our Board of Directors considers many factors before authorizing a cash distribution, including current and projected cash flow from operations, capital expenditure needs, general financial conditions and REIT qualification requirements. To the extent permitted by Maryland law, we may borrow funds, issue new securities or sell assets to make and cover our declared distributions, all or a portion of which could be deemed a return of capital. We may also fund such distributions from advances from our Advisor or sponsor or from our Advisor's deferral of its asset management fee, although we have no present intention to do so. Our organizational documents do not limit the amount of distributions we can fund from sources other than from cash flows from operations.
Our net loss attributable to common stockholders for the year ended December 31, 2017 was $22.0 million and net cash provided by operating activities was $12.0 million. Our cumulative cash distributions and net loss attributable to common stockholders from inception through December 31, 2017 are $177.7 million and $118.4 million, respectively. We have funded our cumulative distributions, which includes net cash distributions and distributions reinvested by stockholders, with cash flow from operating activities, proceeds from disposals of real estate assets and proceeds from debt financing. To the extent that we pay distributions from sources other than our cash flow from operating activities or gains from asset sales, we will have fewer funds available for investment in commercial real estate and real estate-related debt, the overall return to our stockholders may be reduced and subsequent investors may experience dilution.
We have not established a minimum distribution level, and our charter does not require that we make distributions to our stockholders. We will make distributions with respect to the shares of common stock in our sole discretion. No distributions will be made with respect to shares of our convertible stock.
Convertible Stock Grants by our Advisor
As of December 31, 2017, our Advisor has granted 21,210 shares of its convertible stock to employees of RAI and its subsidiaries and affiliates. Of these shares, 2,421 have been forfeited and returned to the Advisor as of December 31, 2017. The outstanding shares vest ratably over three years, and 18,177 of these shares have vested as of December 31, 2017.
ITEM 6. SELECTED FINANCIAL DATA
The following selected financial data should be read together with our "Management's Discussion and Analysis of Financial Condition and Results of Operations" in Item 7 of this report and our consolidated financial statements, including the notes, found elsewhere herein. The following table sets forth selected operating and balance sheet data (in thousands, except per share data):
As of and for the years ended December 31, | |||||||||||||||||||
Statement of operations data: | 2017 | 2016 | 2015 | 2014 | 2013 | ||||||||||||||
Revenues: | |||||||||||||||||||
Rental income | $ | 125,450 | $ | 117,745 | $ | 117,687 | $ | 99,910 | $ | 40,790 | |||||||||
Gain on foreclosures | — | — | — | — | 3,459 | ||||||||||||||
Interest and dividend income | 239 | 622 | 638 | 359 | 262 | ||||||||||||||
Total revenues | 125,689 | 118,367 | 118,325 | 100,269 | 44,511 | ||||||||||||||
Total expenses | 141,580 | 131,262 | 149,626 | 144,465 | 65,518 | ||||||||||||||
Loss before other income (expense) | (15,891 | ) | (12,895 | ) | (31,301 | ) | (44,196 | ) | (21,007 | ) | |||||||||
Other income (expense): | |||||||||||||||||||
Net gains on dispositions of properties and joint venture interests | 22,735 | 45,057 | 36,041 | 10,484 | — | ||||||||||||||
Interest expense | (28,963 | ) | (22,776 | ) | (22,080 | ) | (14,911 | ) | (951 | ) | |||||||||
Insurance proceeds in excess of cost basis | 150 | 985 | 407 | 425 | — | ||||||||||||||
Total other income (expense) | (6,078 | ) | 23,266 | 14,368 | (4,002 | ) | (951 | ) | |||||||||||
Discontinued operations: | |||||||||||||||||||
Loss from discontinued operations | — | — | — | — | (701 | ) | |||||||||||||
Net gains on dispositions of properties | — | — | — | — | 3,173 | ||||||||||||||
Income from discontinued operations, net | — | — | — | — | 2,472 | ||||||||||||||
Income (loss) from continuing operations | (21,969 | ) | 10,371 | (16,933 | ) | (48,198 | ) | (21,958 | ) | ||||||||||
Income (loss) from discontinued operations | — | — | — | — | 2,472 | ||||||||||||||
Net (loss) income | (21,969 | ) | 10,371 | (16,933 | ) | (48,198 | ) | (19,486 | ) | ||||||||||
Net (income) loss attributable to noncontrolling interests | — | (6,306 | ) | 38 | 2,021 | — | |||||||||||||
Net (loss) income attributable to common stockholders | $ | (21,969 | ) | $ | 4,065 | $ | (16,895 | ) | $ | (46,177 | ) | $ | (19,486 | ) | |||||
Basic and diluted (loss) earnings per share attributable to common stockholders: | |||||||||||||||||||
Continuing operations | $ | (0.31 | ) | $ | 0.06 | $ | (0.24 | ) | $ | (0.68 | ) | $ | (0.56 | ) | |||||
Discontinued operations | — | — | — | — | 0.06 | ||||||||||||||
Net (loss) income | $ | (0.31 | ) | $ | 0.06 | $ | (0.24 | ) | $ | (0.68 | ) | $ | (0.50 | ) | |||||
Dividends declared per common share | $ | 0.60 | $ | 0.60 | $ | 0.60 | $ | 0.45 | $ | 0.37 | |||||||||
Balance sheet data: | |||||||||||||||||||
Total assets | $ | 1,135,792 | $ | 1,034,985 | $ | 1,084,695 | $ | 972,556 | $ | 675,721 | |||||||||
Borrowings | $ | 794,671 | $ | 622,152 | $ | 613,439 | $ | 483,901 | $ | 146,014 | |||||||||
Total stockholders' equity attributable to common stockholders | $ | 318,592 | $ | 390,593 | $ | 425,246 | $ | 460,133 | $ | 517,047 | |||||||||
Total equity | $ | 318,592 | $ | 392,019 | $ | 433,099 | $ | 468,354 | $ | 517,047 | |||||||||
ITEM 7. | MANAGEMENT'S DISCUSSION AND ANALYSIS OF FINANCIAL CONDITION AND RESULTS OF OPERATIONS |
The following discussion and analysis relates to our financial statements and should be read in conjunction with the financial statements of Resource Real Estate Opportunity REIT, Inc. and notes thereto appearing elsewhere in this report. Statements contained in this “Management's Discussion and Analysis of Financial Condition and Results of Operations” that are not historical facts may be forward-looking statements. See also “Forward-Looking Statements” preceding Part I.
Overview
We were formed on June 3, 2009. We commenced active real estate operations on September 7, 2010 when we raised the minimum offering amount in our initial public offering.
We have acquired a diversified portfolio of U.S. commercial real estate and real estate-related debt. Our portfolio consists of commercial real estate assets, principally (i) multifamily rental properties purchased as non-performing or distressed loans or as real estate owned by financial institutions and (ii) multifamily rental properties to which we have added value with a capital infusion (referred to as “value add properties”). However, we are not limited in the types of real estate and real estate-related assets in which we may invest or whether we may invest in equity or debt secured by real estate and, accordingly, we may invest in other real estate assets or debt secured by real estate assets. At December 31, 2017, we held approximately 27% of our total assets in category (i) and 73% of our total assets in category (ii).
We may make adjustments to our target portfolio based on real estate market conditions and investment opportunities. We will not forego a good investment because it does not precisely fit our expected portfolio composition. Thus, to the extent our Advisor presents us with investment opportunities that allow us to meet the requirements to be treated as a real estate investment trust, or REIT, under the Internal Revenue Code and to maintain our exclusion from regulation as an investment company pursuant to the Investment Company Act, our portfolio composition may vary from what we have initially disclosed.
The primary portion of our initial public offering commenced on June 16, 2010 and closed on December 13, 2013. We continue to offer shares to our existing stockholders pursuant to our distribution reinvestment plan. We describe these offerings further in “Liquidity and Capital Resources” below.
Results of Operations
As of December 31, 2017, we owned interests in a total of 30 multifamily properties. We also owned one performing loan. During the year ended December 31, 2017, we acquired an interest in three multifamily property and we disposed of our interests in four multifamily properties. Since our inception, we have acquired interests in 52 multifamily properties. As of December 31, 2017, we had sold our interests in 22 of these properties.
Our management is not aware of any material trends or uncertainties, favorable, or unfavorable, other than national economic conditions affecting our targeted portfolio, the multifamily residential housing industry and real estate generally, which may reasonably be expected to have a material impact on either capital resources or the revenues or incomes to be derived from the operation of such assets or those that we expect to acquire.
The following table sets forth the results of our operations (in thousands):
For the Years Ended | ||||||||||||
December 31, | ||||||||||||
2017 | 2016 | 2015 | ||||||||||
Revenues: | ||||||||||||
Rental income | $ | 125,450 | $ | 117,745 | $ | 117,687 | ||||||
Interest and dividend income | 239 | 622 | 638 | |||||||||
Total revenues | 125,689 | 118,367 | 118,325 | |||||||||
Expenses: | ||||||||||||
Rental operating - expenses | 27,211 | 27,608 | 34,167 | |||||||||
Rental operating - payroll | 13,652 | 14,790 | 16,769 | |||||||||
Rental operating - real estate taxes | 14,454 | 12,668 | 13,154 | |||||||||
Subtotal - Rental operating expenses | 55,317 | 55,066 | 64,090 | |||||||||
Acquisition costs | 4,469 | 1,582 | 5,811 | |||||||||
Management fees | 16,921 | 15,724 | 15,453 | |||||||||
General and administrative | 11,061 | 13,083 | 12,776 | |||||||||
Loss on disposal of assets | 1,468 | 1,576 | 3,093 | |||||||||
Provision for loan loss | — | — | 130 | |||||||||
Depreciation and amortization expense | 52,344 | 44,231 | 48,273 | |||||||||
Total expenses | 141,580 | 131,262 | 149,626 | |||||||||
Loss before other income (expense) | (15,891 | ) | (12,895 | ) | (31,301 | ) | ||||||
Other income (expense): | ||||||||||||
Net gains on dispositions of properties and joint venture interests | 22,735 | 45,057 | 36,041 | |||||||||
Interest expense | (28,963 | ) | (22,776 | ) | (22,080 | ) | ||||||
Insurance proceeds in excess of cost basis | 150 | 985 | 407 | |||||||||
Total other income (expense) | (6,078 | ) | 23,266 | 14,368 | ||||||||
Net (loss) income | $ | (21,969 | ) | $ | 10,371 | $ | (16,933 | ) | ||||
Net (income) loss attributable to noncontrolling interests | — | (6,306 | ) | 38 | ||||||||
Net (loss) income attributable to common stockholders | $ | (21,969 | ) | $ | 4,065 | $ | (16,895 | ) | ||||
Year Ended December 31, 2017 Compared to the Year Ended December 31, 2016
The following table presents the results of operations separated into three categories: the results of operations of the 26 properties and one performing loan that that we owned for the entirety of both periods presented, properties purchased or sold during either of the periods presented, and company level revenues and expenses for the years ended December 31, 2017 and 2016 (in thousands):
For the year ended | For the year ended | ||||||||||||||||||||||||||||||
December 31, 2017 | December 31, 2016 | ||||||||||||||||||||||||||||||
Properties owned both periods | Properties purchased/sold during either period | Company level | Total | Properties owned both periods | Properties purchased/sold during either period | Company level | Total | ||||||||||||||||||||||||
Revenues: | |||||||||||||||||||||||||||||||
Rental income | $ | 108,668 | $ | 16,782 | $ | — | $ | 125,450 | $ | 103,616 | $ | 14,129 | $ | — | $ | 117,745 | |||||||||||||||
Interest and dividend income | 134 | 10 | 95 | 239 | 145 | 451 | 26 | 622 | |||||||||||||||||||||||
Total revenues | 108,802 | 16,792 | 95 | 125,689 | 103,761 | 14,580 | 26 | 118,367 | |||||||||||||||||||||||
Expenses: | |||||||||||||||||||||||||||||||
Rental operating - expenses | 23,448 | 3,756 | 7 | 27,211 | 23,660 | 3,930 | 18 | 27,608 | |||||||||||||||||||||||
Rental operating - payroll | 11,797 | 1,855 | — | 13,652 | 12,825 | 1,965 | — | 14,790 | |||||||||||||||||||||||
Rental operating - real estate taxes | 11,786 | 2,668 | — | 14,454 | 11,460 | 1,208 | — | 12,668 | |||||||||||||||||||||||
Subtotal - Rental operating expenses | 47,031 | 8,279 | 7 | 55,317 | 47,945 | 7,103 | 18 | 55,066 | |||||||||||||||||||||||
Acquisition costs | — | 4,469 | — | 4,469 | 81 | 1,501 | — | 1,582 | |||||||||||||||||||||||
Management fees | 4,816 | 751 | 11,354 | 16,921 | 4,620 | 605 | 10,499 | 15,724 | |||||||||||||||||||||||
General and administrative | 3,621 | 715 | 6,725 | 11,061 | 3,994 | 815 | 8,274 | 13,083 | |||||||||||||||||||||||
Loss on disposal of assets | 431 | 1,037 | — | 1,468 | 736 | 840 | — | 1,576 | |||||||||||||||||||||||
Depreciation and amortization expense | 43,672 | 8,672 | — | 52,344 | 40,626 | 3,605 | — | 44,231 | |||||||||||||||||||||||
Total expenses | 99,571 | 23,923 | 18,086 | 141,580 | 98,002 | 14,469 | 18,791 | 131,262 | |||||||||||||||||||||||
Income (loss) before other income (expense) | 9,231 | (7,131 | ) | (17,991 | ) | (15,891 | ) | 5,759 | 111 | (18,765 | ) | (12,895 | ) | ||||||||||||||||||
Other income (expense): | |||||||||||||||||||||||||||||||
Net gains on dispositions of properties and joint venture interests | — | 22,735 | — | 22,735 | — | 45,057 | — | 45,057 | |||||||||||||||||||||||
Interest expense | (24,086 | ) | (4,558 | ) | (319 | ) | (28,963 | ) | (19,916 | ) | (2,389 | ) | (471 | ) | (22,776 | ) | |||||||||||||||
Insurance proceeds in excess of cost basis | 124 | 26 | — | 150 | 522 | 463 | — | 985 | |||||||||||||||||||||||
Total other income (expense) | (23,962 | ) | 18,203 | (319 | ) | (6,078 | ) | (19,394 | ) | 43,131 | (471 | ) | 23,266 | ||||||||||||||||||
Net (loss) income | (14,731 | ) | 11,072 | (18,310 | ) | (21,969 | ) | (13,635 | ) | 43,242 | (19,236 | ) | 10,371 | ||||||||||||||||||
Net income attributable to noncontrolling interests | — | — | — | — | — | (6,306 | ) | — | (6,306 | ) | |||||||||||||||||||||
Net (loss) income attributable to common stockholders | $ | (14,731 | ) | $ | 11,072 | $ | (18,310 | ) | $ | (21,969 | ) | $ | (13,635 | ) | $ | 36,936 | $ | (19,236 | ) | $ | 4,065 | ||||||||||
Revenues: The $5.1 million increase in rental income for the 26 properties that we owned during both the year ended December 31, 2017 and December 31, 2016 reflects implementation of our investment strategy to increase monthly rental income after renovating and stabilizing operations and was primarily comprised of:
Multifamily Community Name | Rental increase (in thousands) | Increase/(decrease) in occupancy | Change in Effective Monthly Revenue per Unit (in dollars) | ||||||
Calloway at Las Colinas | $ | 715 | 0.75 | % | $110 | ||||
Meridian Pointe | 532 | 1.14 | % | 126 | |||||
Heritage Pointe | 525 | 1.68 | % | 90 | |||||
Village of Bonita Glen | 461 | (2.40 | )% | 176 | |||||
Williamsburg | 455 | (2.93 | )% | 74 | |||||
South Lamar Village | 279 | 2.69 | % | 89 | |||||
Perimeter Circle | 268 | 0.31 | % | 119 | |||||
Perimeter 5550 | 256 | (1.20 | )% | 155 | |||||
The Westside Apartments | 225 | (1.89 | )% | 72 | |||||
Estates at Johns Creek | 203 | (1.09 | )% | 67 | |||||
All other, net | 1,133 | ||||||||
$ | 5,052 | ||||||||
Expenses: Our total rental operating expense for the 26 properties owned during both the year ended December 31, 2017 and the year ended December 31, 2016 decreased by $0.9 million primarily due to a decrease in payroll expense. Rental operating expenses for properties purchased or sold during either period increased by $1.2 million primarily due to the purchase of four properties since December 2016.
Acquisition costs increased by $2.9 million for the year ended December 31, 2017 as compared to the year ended December 31, 2016. During the year ended December 31, 2017, we acquired three properties as compared to the acquisition of one multifamily property during the year ended December 31, 2016. Included in acquisition costs for the years ended December 31, 2017 and 2016 are $3.7 million and $1.4 million, respectively, in fees paid to related parties.
Management fees increased by $1.2 million for the year ended December 31, 2017 as compared to the year ended December 31, 2016 primarily related to the increase in asset management fees paid to the Advisor due to the ownership of additional properties and increased property values during 2016 and 2017. The asset management fee is based on the cost of real estate investments, but may be based on the appraised value, if higher.
General and administrative expenses decreased by $2.0 million for the year ended December 31, 2017 as compared to the year ended December 31, 2016 primarily due to a $1.3 million decrease in company level payroll expense as well as a decrease in reimbursed travel expenses.
Depreciation and amortization is comprised of the depreciation on our rental properties and amortization of intangible assets related to in-place leases which are amortized over a period of approximately six to eight months after acquisition. The increases (decreases) in the components of depreciation and amortization during the year ended December 31, 2017, as compared to the year ended December 31, 2016, were as follows:
Properties owned both periods | All Other Properties | Total | |||||||||
Depreciation | $ | 3,169 | $ | 1,558 | $ | 4,726 | |||||
Amortization of intangibles | (123 | ) | 3,510 | 3,387 | |||||||
$ | 3,046 | $ | 5,067 | $ | 8,113 | ||||||
The overall increase in depreciation for properties owned during both periods was due to the additional $49.6 million in capital improvements made during the years ended December 31, 2017 and 2016 in accordance with our planned renovations. The increase in amortization of in-place leases for all other properties is due to amortization of the $3.6 million capitalized for in-place leases related to the four most recent acquisitions.
Net gains on dispositions of properties and joint venture interests included in other income (expense) decreased by $22.3 million due to the sale of four properties during the year ended December 31, 2017 as compared to the sale of six properties during the year ended December 31, 2016, as follows (in thousands):
Multifamily Community | Location | Sale Date | Contract Sales price | Net Gains on Dispositions of Properties and Joint Venture Interests | ||||||||
2017 Dispositions: | ||||||||||||
Chisholm Place | Plano, Texas | May 10, 2017 | $ | 21,250 | $ | 6,922 | ||||||
Mosaic | Oklahoma City, Oklahoma | May 12, 2017 | 6,100 | 1,513 | ||||||||
Deerfield | Hermantown, Minnesota | August 16, 2017 | 23,600 | 11,035 | ||||||||
Stone Ridge | Columbia, South Carolina | September 27, 2017 | 10,534 | 3,265 | ||||||||
$ | 61,484 | $ | 22,735 | |||||||||
2016 Dispositions: | ||||||||||||
Conifer Place (1) | Norcross, Georgia | January 27, 2016 | $ | 42,500 | $ | 9,897 | ||||||
Champion Farms | Louisville, Kentucky | January 29, 2016 | 7,590 | 1,066 | ||||||||
The Ivy at Clear Creek | Houston, Texas | February 17, 2016 | 19,400 | 6,792 | ||||||||
Affinity at Winter Park | Winter Park, Florida | June 9, 2016 | 17,500 | 5,605 | ||||||||
Fieldstone | Woodland, Ohio | June 30, 2016 | 7,514 | 4,096 | ||||||||
The Nesbit Palisades | Alpharetta, Georgia | July 8, 2016 | 45,500 | 17,601 | ||||||||
$ | 140,004 | $ | 45,057 | |||||||||
(1) The net gain on dispositions of properties and joint venture interests related to Conifer Place includes $6.4 million which is attributable to noncontrolling interests.
Interest expense increased by $6.2 million for the year ended December 31, 2017 as compared to the year ended December 31, 2016 predominantly due to the $5.7 million increase related to $272.7 million in new mortgages on Williamsburg, Retreat at Rocky Ridge, Providence in the Park, Meridian Pointe and the three properties acquired during the year ended December 31, 2017.
Year Ended December 31, 2016 Compared to the Year Ended December 31, 2015
The following table presents the results of operations separated into three categories: the results of operations of the 26 properties and one performing loan that we owned for the entirety of both periods presented, properties purchased or sold during either of the periods presented, and company level revenues and expenses for the years ended December 31, 2016 and 2015 (in thousands):
For the year ended | For the year ended | ||||||||||||||||||||||||||||||
December 31, 2016 | December 31, 2015 | ||||||||||||||||||||||||||||||
Properties owned both periods | Properties purchased/sold during either period | Company level | Total | Properties owned both periods | Properties purchased/sold during either period | Company level | Total | ||||||||||||||||||||||||
Revenues: | |||||||||||||||||||||||||||||||
Rental income | $ | 91,648 | $ | 26,097 | $ | — | $ | 117,745 | $ | 81,826 | $ | 35,861 | $ | — | $ | 117,687 | |||||||||||||||
Interest and dividend income | 108 | 488 | 26 | 622 | 106 | 502 | 30 | 638 | |||||||||||||||||||||||
Total revenues | 91,756 | 26,585 | 26 | 118,367 | 81,932 | 36,363 | 30 | 118,325 | |||||||||||||||||||||||
Expenses: | |||||||||||||||||||||||||||||||
Rental operating - expenses | 22,150 | 5,440 | 18 | 27,608 | 23,580 | 10,526 | 61 | 34,167 | |||||||||||||||||||||||
Rental operating - payroll | 11,725 | 3,065 | — | 14,790 | 11,873 | 4,896 | — | 16,769 | |||||||||||||||||||||||
Rental operating - real estate taxes | 9,587 | 3,081 | — | 12,668 | 9,645 | 3,509 | — | 13,154 | |||||||||||||||||||||||
Subtotal - rental operating expenses | 43,462 | 11,586 | 18 | 55,066 | 45,098 | 18,931 | 61 | 64,090 | |||||||||||||||||||||||
Acquisition costs | 61 | 1,521 | — | 1,582 | — | 5,811 | — | 5,811 | |||||||||||||||||||||||
Management fees | 4,084 | 1,141 | 10,499 | 15,724 | 3,639 | 1,541 | 10,273 | 15,453 | |||||||||||||||||||||||
General and administrative | 3,724 | 1,085 | 8,274 | 13,083 | 4,062 | 1,952 | 6,762 | 12,776 | |||||||||||||||||||||||
Loss on disposal of assets | 640 | 936 | — | 1,576 | 869 | 2,224 | — | 3,093 | |||||||||||||||||||||||
Provision for loan loss | — | — | — | — | — | 130 | — | 130 | |||||||||||||||||||||||
Depreciation and amortization expense | 35,611 | 8,620 | — | 44,231 | 33,505 | 14,768 | — | 48,273 | |||||||||||||||||||||||
Total expenses | 87,582 | 24,889 | 18,791 | 131,262 | 87,173 | 45,357 | 17,096 | 149,626 | |||||||||||||||||||||||
Loss before other income (expense) | 4,174 | 1,696 | (18,765 | ) | (12,895 | ) | (5,241 | ) | (8,994 | ) | (17,066 | ) | (31,301 | ) | |||||||||||||||||
Other income (expense): | |||||||||||||||||||||||||||||||
Net gains on dispositions of properties and joint venture interests | — | 45,057 | — | 45,057 | — | 36,041 | — | 36,041 | |||||||||||||||||||||||
Interest expense | (16,806 | ) | (5,499 | ) | (471 | ) | (22,776 | ) | (15,834 | ) | (5,723 | ) | (523 | ) | (22,080 | ) | |||||||||||||||
Insurance proceeds in excess of cost basis | 985 | — | — | 985 | 407 | — | — | 407 | |||||||||||||||||||||||
Total other income (expense) | (15,821 | ) | 39,558 | (471 | ) | 23,266 | (15,427 | ) | 30,318 | (523 | ) | 14,368 | |||||||||||||||||||
Net income (loss) | (11,647 | ) | 41,254 | (19,236 | ) | 10,371 | (20,668 | ) | 21,324 | (17,589 | ) | (16,933 | ) | ||||||||||||||||||
Net (income) loss attributable to noncontrolling interests | — | (6,306 | ) | — | (6,306 | ) | — | 38 | — | 38 | |||||||||||||||||||||
Net income (loss) attributable to common stockholders | $ | (11,647 | ) | $ | 34,948 | $ | (19,236 | ) | $ | 4,065 | $ | (20,668 | ) | $ | 21,362 | $ | (17,589 | ) | $ | (16,895 | ) | ||||||||||
Revenues: The $9.8 million increase in rental income for the 26 properties that we owned during both the years ended December 31, 2016 and 2015 reflects implementation of our investment strategy to increase monthly rental income after renovating and stabilizing operations and was primarily comprised of:
Multifamily Community Name | Rental increase (in thousands) | Increase/(decrease) in occupancy | Increase in Effective Monthly Revenue per Unit (in dollars) | ||||||||
Meridian Pointe | $ | 1,005 | 4.15 | % | $ | 237 | |||||
Maxwell Townhomes | 973 | 4.68 | % | $ | 231 | ||||||
Estates at John's Creek | 896 | 3.55 | % | $ | 141 | ||||||
Calloway at Las Colinas | 876 | 6.94 | % | $ | 71 | ||||||
The Westside Apartments | 697 | (0.75 | )% | $ | 159 | ||||||
Verona Apartment Homes | 584 | 11.62 | % | $ | 38 | ||||||
Tech Center Square | 521 | (1.36 | )% | $ | 256 | ||||||
Perimeter Circle | 409 | (0.11 | )% | $ | 193 | ||||||
Skyview Apartment Homes | 402 | 3.49 | % | $ | 119 | ||||||
Perimeter 5550 | 374 | (0.04 | )% | $ | 202 | ||||||
All other, net | 3,085 | ||||||||||
$ | 9,822 | ||||||||||
Expenses: Our total rental operating expense for the 26 properties owned during both the year ended December 31, 2016 and the year ended December 31, 2015 decreased by $1.6 million primarily due to reductions in casualty losses due to two large fires that occurred in 2015. Rental operating expenses in the category for properties not owned both periods decreased by $7.3 million primarily due to the sale of properties in 2015 and 2016.
Acquisition costs decreased by $4.2 million for the year ended December 31, 2016 as compared to the year ended December 31, 2015. During the year ended December 31, 2015, we acquired four multifamily properties, as compared to the acquisition of one property during the year ended December 31, 2016. Included in acquisition costs for the years ended December 31, 2016 and 2015 are $1.4 million and $5.2 million, respectively, in fees paid to related parties.
Management fees increased by $271,000 for the year ended December 31, 2016 as compared to the year ended December 31, 2015 primarily related to the increase in asset management fees paid to the Advisor due to increased property values during 2015, offset by the sales of properties. Additionally, in June 2015, we purchased two properties with a total purchase price of $167.0 million. The asset management fee is based on the higher of the cost or appraised value of real estate investments.
General and administrative expenses increased by $307,000 for the year ended December 31, 2016 as compared to the year ended December 31, 2015 primarily due to a $1.4 million increase in expenses allocated by the Advisor, offset by a decrease in expenses for properties sold during the year ended December 31, 2016.
Loss on disposal of assets decreased by $1.5 million for the year ended December 31, 2016 as compared to the year ended December 31, 2015 primarily due to the timing of the replacement of appliances at our rental properties in conjunction with unit upgrades.
Depreciation and amortization is comprised of the depreciation on our rental properties and amortization of intangible assets related to in-place leases which are amortized over a period of approximately six to eight months after acquisition. The increases (decreases) in the components of depreciation and amortization during the year ended December 31, 2016, as compared to the year ended December 31, 2015, were as follows:
Properties owned both periods | All Other Properties | Total | |||||||||
Depreciation | $ | 4,008 | $ | (1,918 | ) | $ | 2,090 | ||||
Amortization of intangibles | (1,902 | ) | (4,230 | ) | (6,132 | ) | |||||
$ | 2,106 | $ | (6,148 | ) | $ | (4,042 | ) | ||||
The overall increase in depreciation for properties owned during both periods was due to the additional $28.0 million in capital improvements made during the years ended December 31, 2016 and 2015 in accordance with our planned renovations. The decrease in depreciation and amortization in the all other properties category was due to the sale of our interest in six properties during 2016 and a reduction to the amortization of the in-place leases for properties purchased in 2015.
Net gains on dispositions of properties and joint venture interests included in other income (expense) increased by $9.0 million due to the sale of six properties during the year ended December 31, 2016 as compared to the sale of six properties during the year ended December 31, 2015, as follows (in thousands):
Multifamily Community | Location | Sale Date | Contract Sales price | Net Gains on Dispositions of Properties and Joint Venture Interests | ||||||||
2016 Dispositions: | ||||||||||||
Conifer Place (1) | Norcross, Georgia | January 27, 2016 | $ | 42,500 | $ | 9,897 | ||||||
Champion Farms | Louisville, Kentucky | January 29, 2016 | 7,590 | 1,066 | ||||||||
The Ivy at Clear Creek | Houston, Texas | February 17, 2016 | 19,400 | 6,792 | ||||||||
Affinity at Winter Park | Winter Park, Florida | June 9, 2016 | 17,500 | 5,605 | ||||||||
Fieldstone | Woodland, Ohio | June 30, 2016 | 7,514 | 4,096 | ||||||||
The Nesbit Palisades | Alpharetta, Georgia | July 8, 2016 | 45,500 | 17,601 | ||||||||
$ | 140,004 | $ | 45,057 | |||||||||
2015 Dispositions: | ||||||||||||
The Alcove Apartments | Houston, Texas | January 26, 2015 | $ | 11,050 | $ | 3,784 | ||||||
107th Avenue Apartments | Omaha, Nebraska | January 29, 2015 | 250 | 50 | ||||||||
The Redford Apartments | Houston, Texas | February 27, 2015 | 32,959 | 15,303 | ||||||||
Cityside Apartments | Houston, Texas | March 2, 2015 | 24,500 | 10,028 | ||||||||
One Hundred Chevy Chase | Lexington, Kentucky | June 30, 2015 | 13,500 | 4,386 | ||||||||
The Reserve at Mt. Moriah | Memphis, Tennessee | September 18, 2015 | 5,425 | 2,490 | ||||||||
$ | 87,684 | $ | 36,041 | |||||||||
(1) The net gain on dispositions of properties and joint venture interests related to Conifer Place includes $6.4 million which is attributable to noncontrolling interests.
Interest expense increased by $696,000 for the year ended December 31, 2016 as compared to the year ended December 31, 2015. The sales of Nesbit Palisades, Ivy at Clear Creek, and Affinity at Winter Park resulted in an acceleration of $504,000 of amortization of deferred financing costs and a loss of $105,000 due to a change in the fair value of interest rate caps. Additionally, interest expense for the year ended December 31, 2016 includes $791,000 of extinguishment of loan costs related to refinancing of Tech Center Square, The Westside Apartments, Verona Apartment Homes, Cannery Lofts, Pinehurst, and Skyview Apartment Homes. The increases were offset by the net decrease in interest expense due to the sale of properties in 2015 and 2016.
Liquidity and Capital Resources
We have derived the capital required to purchase real estate investments and conduct our operations from the proceeds of our private and public offerings, secured financings from banks or other lenders, proceeds from the sale of assets, and cash flow generated from our operations.
We initially allocated a portion of the funds we raised in our initial public offering to preserve capital for our investors by supporting the maintenance and viability of the properties we have acquired and those properties that we may acquire in the future. If these allocated amounts and any other available income become insufficient to cover our operating expenses and liabilities, it may be necessary to obtain additional funds by borrowing, refinancing properties or liquidating our investment in one or more properties, debt investments or other assets we may hold. We cannot assure you that we will be able to access additional funds upon acceptable terms when we need them.
Capital Expenditures
We deployed a total of $21.6 million during the year ended December 31, 2017 for capital expenditures. The properties in which we deployed the most capital during the year ended December 31, 2017 are listed separately and the capital expenditures made on all other properties are aggregated in "All other properties" below (in thousands):
Capital deployed during the year ended | Remaining capital budgeted | |||||||
Property | December 31, 2017 | |||||||
The Bryant at Yorba Linda | $ | 4,185 | $ | 8,157 | ||||
Point Bonita Apartment Homes | 2,302 | 2,030 | ||||||
Providence in the Park | 1,896 | 3,882 | ||||||
Heritage Pointe | 1,552 | 2,768 | ||||||
Calloway at Las Colinas | 1,325 | 1,657 | ||||||
Meridian Pointe | 1,263 | 116 | ||||||
The Estates At Johns Creek | 1,168 | 767 | ||||||
Williamsburg | 1,123 | 425 | ||||||
South Lamar Village | 979 | 369 | ||||||
Sunset Ridge | 715 | 538 | ||||||
All other properties | 5,084 | 13,155 | ||||||
$ | 21,592 | |||||||
Initial Public Offering
The primary portion of our initial public offering closed on December 13, 2013. On December 26, 2013, the unsold primary offering shares were deregistered and, on December 30, 2013, the registration of the shares issuable pursuant to the distribution reinvestment plan was continued pursuant to a Registration Statement on Form S-3. A new Registration Statement on Form S-3 was filed in May 2016 to continue the distribution reinvestment plan offering. We continue to offer up to $120.0 million of shares of common stock pursuant to our distribution reinvestment plan under which our stockholders may elect to have distributions reinvested in additional shares at $10.80 per share, which is our current value per share.
Common Stock
As of December 31, 2017, an aggregate of 77.5 million shares of our $0.01 par value common stock have been issued as follows (dollars in thousands):
Shares Issued | Gross Proceeds | ||||||
Shares issued through private offering | 1,263,727 | $ | 12,582 | ||||
Shares issued through primary public offering (1) | 62,485,461 | 622,077 | |||||
Shares issued through stock distributions | 2,132,266 | — | |||||
Shares issued through distribution reinvestment plan | 11,560,597 | 118,502 | |||||
Shares issued in conjunction with the Advisor's initial investment, net of 4,500 share conversion | 15,500 | 155 | |||||
Total | 77,457,551 | $ | 753,316 | ||||
Shares redeemed and retired | (6,158,084 | ) | |||||
Total shares outstanding as of December 31, 2017 | 71,299,467 | ||||||
(1) Includes 276,056 shares held by the Advisor.
Mortgage Debt
During the year ended December 31, 2017, we borrowed an additional $207.4 million through additional mortgages on our rental properties.
The following table presents a summary of our mortgage notes payable, net (in thousands):
December 31, 2017 | December 31, 2016 | |||||||||||||||||||||||||||||||
Outstanding borrowings | Premium (Discount) | Deferred finance costs, net | Carrying Value | Outstanding borrowings | Premium (Discount) | Deferred finance costs, net | Carrying Value | |||||||||||||||||||||||||
Collateral | ||||||||||||||||||||||||||||||||
Vista Apartment Homes | $ | 14,896 | $ | — | $ | (140 | ) | $ | 14,756 | $ | 15,225 | $ | — | $ | (178 | ) | $ | 15,047 | ||||||||||||||
Cannery Lofts | 13,100 | — | (165 | ) | 12,935 | 13,100 | — | (197 | ) | 12,903 | ||||||||||||||||||||||
Deerfield | — | — | — | — | 10,359 | — | (125 | ) | 10,234 | |||||||||||||||||||||||
Trailpoint at the Woodlands | 18,368 | — | (188 | ) | 18,180 | 18,690 | — | (222 | ) | 18,468 | ||||||||||||||||||||||
Verona Apartment Homes | 32,970 | — | (475 | ) | 32,495 | 32,970 | — | (532 | ) | 32,438 | ||||||||||||||||||||||
Skyview Apartment Homes | 28,400 | — | (413 | ) | 27,987 | 28,400 | — | (462 | ) | 27,938 | ||||||||||||||||||||||
Maxwell Townhomes | 13,342 | — | (109 | ) | 13,233 | 13,602 | — | (137 | ) | 13,465 | ||||||||||||||||||||||
Pinehurst | 7,339 | — | (128 | ) | 7,211 | 7,350 | — | (154 | ) | 7,196 | ||||||||||||||||||||||
Pheasant Run | 6,250 | — | — | 6,250 | 6,250 | 43 | (9 | ) | 6,284 | |||||||||||||||||||||||
Retreat of Shawnee | 12,682 | 7 | (2 | ) | 12,687 | 12,893 | 85 | (23 | ) | 12,955 | ||||||||||||||||||||||
Evergreen at Coursey Place | 26,639 | 77 | (75 | ) | 26,641 | 27,107 | 100 | (96 | ) | 27,111 | ||||||||||||||||||||||
Pines of York | 14,717 | (235 | ) | (44 | ) | 14,438 | 14,999 | (299 | ) | (56 | ) | 14,644 | ||||||||||||||||||||
Estates at Johns Creek | 48,603 | — | (286 | ) | 48,317 | 49,596 | — | (405 | ) | 49,191 | ||||||||||||||||||||||
Chisholm Place | — | — | — | — | 11,587 | — | (143 | ) | 11,444 | |||||||||||||||||||||||
Perimeter Circle | 16,923 | — | (84 | ) | 16,839 | 17,298 | — | (143 | ) | 17,155 | ||||||||||||||||||||||
Perimeter 5550 | 13,356 | — | (70 | ) | 13,286 | 13,651 | — | (118 | ) | 13,533 | ||||||||||||||||||||||
Aston at Cinco Ranch | 22,942 | — | (210 | ) | 22,732 | 23,367 | — | (268 | ) | 23,099 | ||||||||||||||||||||||
Sunset Ridge 1 | 19,254 | 189 | (150 | ) | 19,293 | 19,699 | 259 | (205 | ) | 19,753 | ||||||||||||||||||||||
Sunset Ridge 2 | 2,890 | 26 | (19 | ) | 2,897 | 2,948 | 35 | (26 | ) | 2,957 | ||||||||||||||||||||||
Calloway at Las Colinas | 34,396 | — | (241 | ) | 34,155 | 35,083 | — | (306 | ) | 34,777 | ||||||||||||||||||||||
South Lamar Village | 12,177 | — | (80 | ) | 12,097 | 12,435 | — | (131 | ) | 12,304 | ||||||||||||||||||||||
Heritage Pointe | 25,912 | — | (284 | ) | 25,628 | 26,280 | — | (327 | ) | 25,953 | ||||||||||||||||||||||
Yorba Linda | 67,500 | — | (461 | ) | 67,039 | 67,500 | — | (661 | ) | 66,839 | ||||||||||||||||||||||
Point Bonita Apartment Homes | 26,525 | 1,660 | (285 | ) | 27,900 | 26,907 | 1,966 | (338 | ) | 28,535 | ||||||||||||||||||||||
Stone Ridge | — | — | — | — | 5,227 | — | (130 | ) | 5,097 | |||||||||||||||||||||||
The Westside Apartments | 36,820 | — | (390 | ) | 36,430 | 36,820 | — | (448 | ) | 36,372 | ||||||||||||||||||||||
Tech Center Square | 12,141 | — | (164 | ) | 11,977 | 12,375 | — | (196 | ) | 12,179 | ||||||||||||||||||||||
Williamsburg | 53,995 | — | (706 | ) | 53,289 | 53,995 | — | (828 | ) | 53,167 | ||||||||||||||||||||||
Retreat at Rocky Ridge | 11,375 | — | (223 | ) | 11,152 | 11,375 | — | (261 | ) | 11,114 | ||||||||||||||||||||||
Providence in the Park | 47,000 | — | (524 | ) | 46,476 | — | — | — | — | |||||||||||||||||||||||
Green Trails Apartment Homes | 61,500 | — | (667 | ) | 60,833 | — | — | — | — | |||||||||||||||||||||||
Meridian Pointe | 39,500 | — | (588 | ) | 38,912 | — | — | — | — | |||||||||||||||||||||||
Terraces at Lake Mary | 32,250 | — | (377 | ) | 31,873 | — | — | — | — | |||||||||||||||||||||||
Courtney Meadows Apartments | 27,100 | — | (367 | ) | 26,733 | — | — | — | — | |||||||||||||||||||||||
$ | 800,862 | $ | 1,724 | $ | (7,915 | ) | $ | 794,671 | $ | 627,088 | $ | 2,189 | $ | (7,125 | ) | $ | 622,152 | |||||||||||||||
The following table presents additional information about our mortgage notes payable, net, as of December 31, 2017 (in thousands, except percentages):
Collateral | Maturity Date | Margin over LIBOR | Annual Interest Rate | Average Monthly Debt Service | Average Monthly Escrow | |||||||||||
Vista Apartment Homes | 1/1/2022 | 2.29 | % | 3.85 | % | (1)(5) | $ | 72 | $ | 16 | ||||||
Cannery Lofts | 11/1/2023 | 2.54 | % | 4.10 | % | (1)(3) | 42 | 26 | ||||||||
Trailpoint at the Woodlands | 11/1/2023 | 2.41 | % | 3.97 | % | (1)(4) | 83 | 47 | ||||||||
Verona Apartment Homes | 10/1/2026 | 2.36 | % | 3.92 | % | (1)(3) | 100 | 40 | ||||||||
Skyview Apartment Homes | 10/1/2026 | 2.36 | % | 3.92 | % | (1)(3) | 86 | 24 | ||||||||
Maxwell Townhomes | 1/1/2022 | — | 4.32 | % | (2)(5) | 71 | 78 | |||||||||
Pinehurst | 11/1/2023 | 2.42 | % | 3.98 | % | (1)(3) | 34 | 15 | ||||||||
Pheasant Run | 10/1/2018 | 2.50 | 4.06 | % | (2)(3)(7) | 18 | 12 | |||||||||
Retreat of Shawnee | 2/1/2019 | — | 5.58 | % | (2)(5)(8) | 78 | 29 | |||||||||
Evergreen at Coursey Place | 8/1/2021 | — | 5.07 | % | (2)(5) | 154 | 37 | |||||||||
Pines of York | 12/1/2021 | — | 4.46 | % | (2)(5) | 80 | 25 | |||||||||
Estates at Johns Creek | 7/1/2020 | — | 3.38 | % | (2)(5) | 221 | 77 | |||||||||
Perimeter Circle | 7/1/2019 | — | 3.42 | % | (2)(5) | 81 | 44 | |||||||||
Perimeter 5550 | 7/1/2019 | — | 3.42 | % | (2)(5) | 64 | 32 | |||||||||
Aston at Cinco Ranch | 10/1/2021 | — | 4.34 | % | (2)(5) | 120 | 70 | |||||||||
Sunset Ridge 1 | 11/1/2020 | — | 4.58 | % | (2)(5) | 113 | 89 | |||||||||
Sunset Ridge 2 | 11/1/2020 | — | 4.54 | % | (2)(5) | 16 | — | |||||||||
Calloway at Las Colinas | 12/1/2021 | — | 3.87 | % | (2)(5) | 171 | 115 | |||||||||
South Lamar Village | 8/1/2019 | — | 3.64 | % | (2)(5) | 59 | 57 | |||||||||
Heritage Pointe | 4/1/2025 | 1.88 | % | 3.44 | % | (1)(4) | 114 | 43 | ||||||||
Yorba Linda | 6/1/2020 | 1.75 | % | 3.31 | % | (1)(3) | 203 | — | ||||||||
Point Bonita Apartment Homes | 10/1/2023 | — | 5.33 | % | (2)(5) | 152 | 61 | |||||||||
The Westside Apartments | 9/1/2026 | 2.12 | % | 3.68 | % | (1)(3) | 121 | 69 | ||||||||
Tech Center Square | 6/1/2023 | 2.58 | % | 4.14 | % | (1)(5) | 58 | 24 | ||||||||
Williamsburg | 1/1/2024 | 2.38 | % | 3.94 | % | (1)(3) | 165 | 167 | ||||||||
Retreat at Rocky Ridge | 1/1/2024 | 2.46 | % | 4.02 | % | (1)(3) | 36 | 23 | ||||||||
Providence in the Park | 2/1/2024 | 2.30 | % | 3.86 | % | (1)(3)(6) | 141 | 138 | ||||||||
Green Trails Apartment Homes | 6/1/2024 | 1.99 | % | 3.55 | % | (1)(3)(6) | 168 | 79 | ||||||||
Meridian Pointe | 8/1/2024 | 1.90 | % | 3.46 | % | (1)(3)(6) | 104 | 56 | ||||||||
Terraces at Lake Mary | 9/1/2024 | 1.91 | % | 3.47 | % | (1)(3)(6) | 86 | 46 | ||||||||
Courtney Meadows Apartments | 1/1/2025 | 1.84 | % | 3.40 | % | (1)(3)(6) | 76 | 51 | ||||||||
(1) Variable rate based on one-month LIBOR (1.56425% as of December 31, 2017) plus applicable margin.
(2) Fixed rate.
(3) Monthly interest-only payment required.
(4) Monthly fixed principal plus interest payment required.
(5) Fixed monthly principal and interest payment required.
(6) New debt placed during the year ended December 31, 2017.
(7) Automatic extension to October 1, 2018 occurred on October 1, 2017 at which time the fixed interest rate converted to a variable rate.
(8) Automatic extension to February 1, 2019 occurred on February 1, 2018 at which time the fixed interest rate converted to a variable rate.
At December 31, 2017, the weighted average interest rate of all our outstanding indebtedness was 3.86%.
Based on current lending market conditions, we expect that the debt financing we incur, on a total portfolio basis, will not exceed 55% to 65% of the cost of our real estate investments (before deducting depreciation or other non-cash reserves) plus the value of our other assets (61% as of December 31, 2017). We may also increase the amount of debt financing we use with respect to an investment over the amount originally incurred if the value of the investment increases subsequent to our acquisition and if credit market conditions permit us to do so. Our charter limits us from incurring debt such that our total liabilities may not exceed 75% of the cost (before deducting depreciation or other non-cash reserves) of our tangible assets, although we may exceed
this limit under certain circumstances. We expect that our primary liquidity source for acquisitions and long-term funding will include proceeds from dispositions and, to the extent we co-invest with other entities, capital from any future joint venture partners. We may also pursue a number of potential other funding sources, including mortgage loans, portfolio level credit lines and government financing.
Operating Costs
In addition to making investments in accordance with our investment objectives, we expect to use our capital resources to make payments to our Advisor. We make payments to our Advisor in connection with the acquisition of real estate investments and for the management of our assets and costs incurred by our Advisor in providing services to us. We describe these payments in more detail in Note 14 of the notes to our consolidated financial statements.
Under our charter, we are required to limit our total operating expenses to the greater of 2% of our average invested assets or 25% of our net income for the four most recently completed fiscal quarters, as these terms are defined in our charter, unless the Conflicts Committee of our Board of Directors has determined that such excess expenses were justified based on unusual and non-recurring factors. Operating expense reimbursements for the four fiscal quarters ended December 31, 2017 did not exceed the charter imposed limitation.
Distributions
For the year ended December 31, 2017, we paid aggregate distributions of $43.0 million, including $15.9 million of distributions paid in cash and $27.1 million of distributions reinvested in shares of our common stock through our distribution reinvestment plan, as follows (dollars in thousands, except per share data):
Record Date | Per Common Share | Distribution Date | Distributions reinvested in shares of Common Stock | Net Cash Distributions | Total Aggregate Distributions | |||||||||||||
January 30, 2017 | $ | 0.05 | January 31, 2017 | $ | 2,329 | $ | 1,272 | $ | 3,601 | |||||||||
February 27, 2017 | 0.05 | February 28, 2017 | 2,308 | 1,303 | 3,611 | |||||||||||||
March 30, 2017 | 0.05 | March 31, 2017 | 2,274 | 1,314 | 3,588 | |||||||||||||
April 27, 2017 | 0.05 | April 28, 2017 | 2,273 | 1,324 | 3,597 | |||||||||||||
May 30, 2017 | 0.05 | May 31, 2017 | 2,258 | 1,350 | 3,608 | |||||||||||||
June 29, 2017 | 0.05 | June 30, 2017 | 2,249 | 1,322 | 3,571 | |||||||||||||
July 28, 2017 | 0.05 | July 31, 2017 | 2,247 | 1,333 | 3,580 | |||||||||||||
August 30, 2017 | 0.05 | August 31, 2017 | 2,250 | 1,340 | 3,590 | |||||||||||||
September 28, 2017 | 0.05 | September 29, 2017 | 2,233 | 1,335 | 3,568 | |||||||||||||
October 30, 2017 | 0.05 | October 31, 2017 | 2,237 | 1,339 | 3,576 | |||||||||||||
November 29, 2017 | 0.05 | November 30, 2017 | 2,239 | 1,349 | 3,588 | |||||||||||||
December 28, 2017 | 0.05 | December 29, 2017 | 2,217 | 1,338 | 3,555 | |||||||||||||
$ | 0.60 | $ | 27,114 | $ | 15,919 | $ | 43,033 | |||||||||||
Distributions paid, distributions declared, and sources of distributions paid were as follows for the year ended December 31, 2017 (dollars in thousands, except per share data):
Distributions Paid | Distributions Declared | Sources of Distributions Paid | |||||||||||||||||||||||||
Amount Paid/Percent of Total | |||||||||||||||||||||||||||
2017 | Cash | Distributions Reinvested (DRIP) | Total | Cash Provided by Operating Activities | Total | Per Share | Operating Activities | Debt Financing | Dispositions | ||||||||||||||||||
First Quarter | $ | 3,889 | $ | 6,911 | $ | 10,800 | $ | 3,433 | $ | 10,800 | $0.15 | $3,433 / 32% | $7,367 / 68% | — | |||||||||||||
Second Quarter | $ | 3,997 | $ | 6,780 | $ | 10,777 | $ | 1,167 | $ | 10,777 | $0.15 | $1,167 / 11% | — | $9,610 / 89% | |||||||||||||
Third Quarter | $ | 4,007 | $ | 6,730 | $ | 10,737 | $ | 5,237 | $ | 10,737 | $0.15 | $5,237 / 49% | — | $5,500 / 51% | |||||||||||||
Fourth Quarter | $ | 4,026 | $ | 6,693 | $ | 10,719 | $ | 2,151 | $ | 10,719 | $0.15 | $2,151 / 20% | — | $8,568 / 80% | |||||||||||||
Total | $ | 15,919 | $ | 27,114 | $ | 43,033 | $ | 11,988 | $ | 43,033 | $0.60 | $11,988/ 28% | $7,367 / 17% | $23,678 / 55% | |||||||||||||
Cash distributions paid since inception were as follows (in thousands, except per share data):
Fiscal Year Paid | Per Common Share | Distributions reinvested in shares of Common Stock | Net Cash Distributions | Total Aggregate Distributions | ||||||||||||
2012 | $ | 0.15 | $ | 1,052 | $ | 841 | $ | 1,893 | ||||||||
2013 | 0.41 | 9,984 | 4,757 | 14,741 | ||||||||||||
2014 | 0.48 | 22,898 | 9,959 | 32,857 | ||||||||||||
2015 | 0.60 | 28,959 | 13,257 | 42,216 | ||||||||||||
2016 | 0.60 | 28,497 | 14,508 | 43,005 | ||||||||||||
2017 | 0.60 | 27,114 | 15,919 | 43,033 | ||||||||||||
$ | 2.84 | $ | 118,504 | $ | 59,241 | $ | 177,745 | |||||||||
Since our formation, we have issued a total of seven quarterly stock distributions of 0.015 shares each, two quarterly stock distributions of 0.0075 shares each, one quarterly stock distribution of 0.00585 shares each, and two quarterly stock distributions of 0.005 shares each of its common stock outstanding. In connection with these stock distributions, we have increased our accumulated deficit by $21.3 million as of December 31, 2017.
Our net loss attributable to common shareholders for the year ended December 31, 2017 was $22.0 million and net cash provided by operating activities was $12.0 million. Our cumulative cash distributions and net loss attributable to common stockholders from inception through December 31, 2017 were $177.7 million and $118.4 million, respectively. We have funded our cumulative distributions, which includes net cash distributions and distributions reinvested by stockholders, with cash flows from operating activities, proceeds from the disposal of real estate and proceeds from debt financing. To the extent that we pay distributions from sources other than our cash flow from operating activities or gains from asset sales, we will have fewer funds available for investment in commercial real estate and real estate-related debt, the overall return to our stockholders may be reduced and subsequent investors may experience dilution.
Funds from Operations, Modified Funds from Operations and Adjusted Funds from Operations attributable to common stockholders
Funds from operations attributable to common stockholders, or FFO, is a non-GAAP financial performance measure that is widely recognized as a measure of REIT operating performance. We use FFO as defined by the National Association of Real Estate Investment Trusts to be net income (loss), computed in accordance with GAAP excluding extraordinary items, as defined
by GAAP, and gains (or losses) from sales of property (including deemed sales and settlements of pre-existing relationships), plus depreciation and amortization on real estate assets, and after related adjustments for unconsolidated partnerships, joint ventures and subsidiaries and noncontrolling interests. We believe that FFO is helpful to our investors and our management as a measure of operating performance because it excludes real estate-related depreciation and amortization, gains and losses from property dispositions, and extraordinary items, and as a result, when compared year to year, reflects the impact on operations from trends in occupancy rates, rental rates, operating costs, development activities, general and administrative expenses, and interest costs, which are not immediately apparent from net income. Historical cost accounting for real estate assets in accordance with GAAP implicitly assumes that the value of real estate and intangibles diminishes predictably over time. Since real estate values have historically risen or fallen with market conditions, many industry investors and analysts have considered the presentation of operating results for real estate companies that use historical cost accounting alone to be insufficient. As a result, our management believes that the use of FFO, together with the required GAAP presentations, is helpful for our investors in understanding our performance. Factors that impact FFO include start-up costs, fixed costs, delay in buying assets, lower yields on cash held in accounts, income from portfolio properties and other portfolio assets, interest rates on acquisition financing and operating expenses. In addition, FFO will be affected by the types of investments in our targeted portfolio which will consist of, but are not limited to: i) multifamily rental properties purchased as non-performing or distressed loans or as real estate owned by financial institutions and (ii) multifamily rental properties to which we can add value with a capital infusion (referred to as “value add properties”).
Since FFO was promulgated, GAAP has adopted several new accounting pronouncements, such that management and many investors and analysts have considered the presentation of FFO alone to be insufficient. Accordingly, in addition to FFO, we use modified funds from operations attributable to common stockholders, or MFFO, as defined by the Investment Program Association, or IPA. MFFO excludes from FFO the following items:
(1) | acquisition fees and expenses; |
(2) | straight-line rent amounts, both income and expense; |
(3) | amortization of above- or below-market intangible lease assets and liabilities; |
(4) | amortization of discounts and premiums on debt investments; |
(5) | impairment charges; |
(6) | gains or losses from the early extinguishment of debt; |
(7) | gains or losses on the extinguishment or sales of hedges, foreign exchange, securities and other derivatives holdings except where the trading of such instruments is a fundamental attribute of our operations; |
(8) | gains or losses related to fair-value adjustments for derivatives not qualifying for hedge accounting, including interest rate and foreign exchange derivatives; |
(9) | gains or losses related to consolidation from, or deconsolidation to, equity accounting; |
(10) | gains or losses related to contingent purchase price adjustments; and |
(11) | adjustments related to the above items for unconsolidated entities in the application of equity accounting. |
We believe that MFFO is helpful in assisting management assess the sustainability of operating performance in future periods and, in particular, after our acquisition stage is complete, primarily because it excludes acquisition expenses that affect property operations only in the period in which the property is acquired. Thus, MFFO provides helpful information relevant to evaluating our operating performance in periods in which there is no acquisition activity.
As explained below, management’s evaluation of our operating performance excludes the items considered in the calculation based on the following economic considerations. Many of the adjustments in arriving at MFFO are not applicable to us. Nevertheless, we explain below the reasons for each of the adjustments made in arriving at our MFFO definition:
• | Acquisition expenses. In evaluating investments in real estate, including both business combinations and investments accounted for under the equity method of accounting, management’s investment models and analysis differentiate costs to acquire the investment from the operations derived from the investment. Prior to 2009, acquisition costs for both of these types of investments were capitalized under GAAP; however, beginning in 2009, acquisition costs related to business combinations are expensed. Both of these acquisition costs will continue to be funded from the proceeds of debt financing and proceeds from property dispositions and not from operations. We believe by excluding expensed acquisition costs, MFFO provides useful supplemental information that is comparable for each type of real estate investment and is consistent with management’s analysis of the investing and operating performance of our properties. Acquisition expenses include those paid to our Advisor or third parties. |
• | Adjustments for straight-line rents and amortization of discounts and premiums on debt investments. In the proper application of GAAP, rental receipts and discounts and premiums on debt investments are allocated to periods using |
various systematic methodologies. This application will result in income recognition that could be significantly different than underlying contract terms. By adjusting for these items, MFFO provides useful supplemental information on the realized economic impact of lease terms and debt investments and aligns results with management’s analysis of operating performance.
• | Adjustments for amortization of above or below market intangible lease assets. Similar to depreciation and amortization of other real estate related assets that are excluded from FFO, GAAP implicitly assumes that the value of intangibles diminishes predictably over time and that these charges be recognized currently in revenue. Since real estate values and market lease rates in the aggregate have historically risen or fallen with market conditions, management believes that by excluding these charges, MFFO provides useful supplemental information on the performance of the real estate. |
• | Impairment charges, gains or losses related to fair-value adjustments for derivatives not qualifying for hedge accounting and gains or losses related to contingent purchase price adjustments. Each of these items relates to a fair value adjustment, which is based on the impact of current market fluctuations and underlying assessments of general market conditions and specific performance of the holding which may not be directly attributable to current operating performance. As these gains or losses relate to underlying long-term assets and liabilities, management believes MFFO provides useful supplemental information by focusing on the changes in our core operating fundamentals rather than changes that may reflect anticipated gains or losses. In particular, because GAAP impairment charges are not allowed to be reversed if the underlying fair values improve or because the timing of impairment charges may lag the onset of certain operating consequences, we believe MFFO provides useful supplemental information related to current consequences, benefits and sustainability related to rental rate, occupancy and other core operating fundamentals. |
• | Adjustment for gains or losses related to early extinguishment of hedges, debt, consolidation or deconsolidation and contingent purchase price. Similar to extraordinary items excluded from FFO, these adjustments are not related to continuing operations. By excluding these items, management believes that MFFO provides supplemental information related to sustainable operations that will be more comparable between other reporting periods and to other real estate operators. |
By providing MFFO, we believe we are presenting useful information that also assists investors and analysts in the assessment of the sustainability of our operating performance after our acquisition stage is completed. We also believe that MFFO is a recognized measure of sustainable operating performance by the real estate industry. MFFO is useful in comparing the sustainability of our operating performance after our acquisition stage is completed with the sustainability of the operating performance of other real estate companies that are not as involved in acquisition activities or as affected by other MFFO adjustments. However, investors are cautioned that MFFO should only be used to assess the sustainability of our operating performance after our acquisition stage is completed, as it excludes acquisition costs that have a negative effect on our operating performance and the reported book value of our common stock and stockholders’ equity during the periods in which properties are acquired.
As an opportunity REIT, a core element of our investment strategy and operations is the acquisition of distressed and value-add properties and the rehabilitation and renovation of such properties in an effort to create additional value in such properties. As part of our operations, we intend to realize gains from such value-add efforts through the strategic disposition of such properties after we have added value through the execution of our business plan. As we do not intend to hold any of our properties for a specific amount of time, we intend to take advantage of opportunities to realize gains from our value-add efforts on a regular basis during the course of our operations as such opportunities become available, in all events subject to the rules regarding "prohibited transactions" of real estate investment trusts of the Internal Revenue Code. Therefore, we also use adjusted funds from operations attributable to common stockholders, or AFFO, in addition to FFO and MFFO when evaluating our operations. We calculate AFFO by adding/subtracting gains/losses realized on sales of our properties from MFFO. We believe that AFFO presents useful information that assists investors and analysts in the assessment of our operating performance as it is reflective of the impact that regular, strategic property dispositions have on our continuing operations.
Neither FFO, MFFO nor AFFO should be considered as an alternative to net income (loss) attributable to common stockholders, nor as an indication of our liquidity, nor are any of these measures indicative of funds available to fund our cash needs, including our ability to fund distributions. In particular, as we may continue to acquire properties as part of our ongoing operations, acquisition costs and other adjustments that are increases to MFFO and AFFO are, and may continue to be, a significant use of cash. Accordingly, FFO, MFFO and AFFO should be reviewed in connection with other GAAP measurements. Our FFO, MFFO and AFFO as presented may not be comparable to amounts calculated by other REITs.
The following section presents our calculation of FFO, MFFO and AFFO and provides additional information related to our operations (in thousands, except per share amounts). Amounts reported in the tables below include adjustments attributable to noncontrolling interests.
Years Ended December 31, | |||||||||||
2017 | 2016 | 2015 | |||||||||
Net income (loss) attributable to common stockholders – GAAP | $ | (21,969 | ) | $ | 4,065 | $ | (16,895 | ) | |||
Net gains on dispositions of properties and joint venture interests (2) | (22,735 | ) | (38,834 | ) | (36,041 | ) | |||||
Depreciation expense (3) | 48,729 | 43,943 | 40,808 | ||||||||
FFO attributable to common stockholders | 4,025 | 9,174 | (12,128 | ) | |||||||
Adjustments for straight-line rents | (144 | ) | 105 | (176 | ) | ||||||
Amortization of intangible lease assets (4) | 3,615 | 228 | 6,360 | ||||||||
Realized loss on change in fair value of interest rate cap related to extinguishments | 28 | 105 | — | ||||||||
Loss on extinguishment of debt | — | 791 | — | ||||||||
Debt premium amortization (4) | (465 | ) | (485 | ) | (602 | ) | |||||
Acquisition costs | 4,469 | 1,582 | 5,811 | ||||||||
MFFO attributable to common stockholders | 11,528 | 11,500 | (735 | ) | |||||||
Net gains on dispositions of properties and joint venture interests (2) | 22,735 | 38,834 | 36,041 | ||||||||
AFFO attributable to common stockholders | $ | 34,263 | $ | 50,334 | $ | 35,306 | |||||
Basic and diluted net (loss) income per common share - GAAP | $ | (0.31 | ) | $ | 0.06 | $ | (0.24 | ) | |||
FFO per share | $ | 0.06 | $ | 0.13 | $ | (0.17 | ) | ||||
MFFO per share | $ | 0.16 | $ | 0.16 | $ | (0.01 | ) | ||||
AFFO per share | $ | 0.48 | $ | 0.70 | $ | 0.50 | |||||
Weighted average shares outstanding (1) | 71,865 | 71,787 | 70,397 | ||||||||
(1) | Excludes any dilution from the potential conversion of convertible stock as the actual number of shares that will be issuable upon conversion, if any, is indeterminable at December 31, 2017, 2016, and 2015. |
(2) | Net gains on dispositions of properties and joint venture interests for the year ended December 31, 2016 excludes $6.2 million attributable to noncontrolling interests. |
(3) | Depreciation expense excludes amounts attributable to noncontrolling interests of $60,000 and $1.1 million for the years ended December 31, 2016 and 2015, respectively. |
(4) | Debt premium amortization excludes amounts attributable to noncontrolling interests of $178,000 for the year ended December 31, 2015. There was no noncontrolling interest adjustment for the years ended December 31, 2016 and 2017. |
Critical Accounting Policies
We consider these policies critical because they involve significant management judgments and assumptions, they require estimates about matters that are inherently uncertain, and they are important for understanding and evaluating our reported financial results. These judgments affect the reported amounts of our assets and liabilities and our disclosure of contingent assets and liabilities on the dates of the financial statements and the reported amounts of revenue and expenses during the reporting periods. With different estimates or assumptions, materially different amounts could be reported in our financial statements. Additionally, other companies may utilize different estimates that may impact the comparability of our results of operations to those of companies in similar businesses.
Real Estate Assets
Depreciation
We make subjective assessments as to the useful lives of our depreciable assets. These assessments have a direct impact on our net income, because, if we were to shorten the expected useful lives of our investments in real estate, we would depreciate these investments over fewer years, resulting in more depreciation expense and lower net income on an annual basis throughout the expected useful lives of these investments. We consider the period of future benefit of an asset to determine its appropriate useful life. The estimated useful lives of our assets by class are as follows:
Buildings | 27.5 years |
Building improvements | 5-27.5 years |
Furniture, fixtures, and equipment | 3-5 years |
Tenant improvements | Shorter of lease term or expected useful life |
Improvements and replacements in excess of $1,000 are capitalized when they extend the useful life of the asset. The Manager, an affiliate of the Advisor, earns a construction management fee of 5.0% of actual aggregate costs to construct improvements, or to repair, rehab or reconstruct a property. These costs are capitalized along with the related asset. Costs of repairs and maintenance are expensed as incurred.
Real Estate Purchase Price Allocation
We record above-market and below-market in-place lease values for acquired properties based on the present value (using an interest rate that reflects the risks associated with the leases acquired) of the difference between (i) the contractual amounts to be paid pursuant to the in-place leases and (ii) management's estimate of fair market lease rates for the corresponding in-place leases, measured over a period equal to the remaining non-cancelable term of the lease. We amortize any capitalized above-market or below-market lease values as an increase or reduction to rental income over the remaining non-cancelable terms of the respective leases, which we expect will range from one month to ten years.
We measure the aggregate value of other intangible assets acquired based on the difference between (i) the property valued with existing in-place leases adjusted to market rental rates and (ii) the property valued as if vacant. Management's estimates of value are expected to be made using methods similar to those used by independent appraisers (e.g., discounted cash flow analysis). Factors to be considered by management in its analysis include an estimate of carrying costs during hypothetical expected lease-up periods considering current market conditions and costs to execute similar leases.
We consider information obtained about each property as a result of our preacquisition due diligence, marketing and leasing activities in estimating the fair value of the tangible and intangible assets acquired. In estimating carrying costs, management also includes real estate taxes, insurance and other operating expenses and estimates of lost rentals at market rates during the expected lease-up periods. Management estimates costs to execute similar leases including leasing commissions and legal and other related expenses to the extent that such costs have not already been incurred in connection with a new lease origination as part of the transaction.
The total amount of other intangible assets acquired will be further allocated to in-place lease values and customer relationship intangible values based on management's evaluation of the specific characteristics of each tenant's lease and our overall relationship with that respective tenant. Characteristics to be considered by management in allocating these values include the nature and extent of our existing business relationships with a tenant, growth prospects for developing new business with the tenant, the tenant's credit quality and expectations of lease renewals (including those existing under the terms of the lease agreement), among other factors.
We amortize the value of in-place leases to expense over the initial term of the respective leases. The value of customer relationship intangibles will be amortized to expense over the initial term and, but in no event will the amortization periods for the intangible assets exceed the remaining depreciable life of the building. Should a tenant terminate its lease, the unamortized portion of the in-place lease value and customer relationship intangibles would be charged to expense in that period.
Estimates of the fair values of the tangible and intangible assets will require us to estimate market lease rates, property operating expenses, carrying costs during lease-up periods, discount rates, market absorption periods, and the number of years the property will be held for investment. The use of inappropriate estimates would result in an incorrect assessment of our purchase price allocation, which would impact the amount of our net income.
Valuation of Real Estate Assets
We continually monitor events and changes in circumstances that could indicate that the carrying amounts of our real estate and related intangible assets may not be recoverable. When indicators of potential impairment suggest that the carrying value of real estate and related intangible assets may not be recoverable, we will assess the recoverability of the assets by estimating whether we will recover the carrying value of the asset through its undiscounted future cash flows and its eventual disposition. If based on this analysis we do not believe that we will be able to recover the carrying value of the asset, we will record an impairment loss to the extent that the carrying value exceeds the estimated fair value of the asset.
Projections of future cash flows require us to estimate the expected future operating income and expenses related to an asset as well as market and other trends. The use of inappropriate assumptions in our future cash flows analysis would result in an incorrect assessment of our assets' future cash flows and fair values and could result in the overstatement of the carrying values of our real estate assets and an overstatement of our net income.
For properties held and used, an impairment loss will be recorded to the extent that the carrying value of a property exceeds the estimated fair value of the property. For properties held for sale, the impairment loss would be the adjustment to fair value less the estimated cost to dispose of the asset.
Loans Held for Investment, Net
Real estate loans held for investment are recorded at cost and reviewed for potential impairment at each balance sheet date. A loan held for investment is considered impaired when it becomes probable, based on current information, that we will be unable to collect all amounts due according to the loan's contractual terms. The amount of impairment, if any, is measured by comparing the recorded amount of the loan to the present value of the expected cash flows or the fair value of the collateral. If a loan was deemed to be impaired, we would record a reserve for loan losses through a charge to income for any shortfall. Failure to recognize impairment would result in the overstatement of the carrying values of our real estate loans receivable and an overstatement of our net income.
Preferred Equity Investment
We recorded our preferred equity investments at amortized cost. Investments, carried at amortized cost were evaluated for impairment at each reporting date. When an investment was impaired and that impairment was considered other than temporary, the amount of the loss accrual was calculated by comparing the carrying amount of the investment to its estimated fair value. This investment was repaid in full on June 6, 2016.
Dividend income was recognized when earned based on the contractual terms of the preferred equity agreement.
Discontinued Operations
Prior to January 1, 2014, assuming no significant continuing involvement by us after the sale, the sale of a property was considered a discontinued operation.
In April 2014, the Financial Accounting Standards Board ("FASB") issued authoritative guidance to change the criteria for reporting discontinued operations. Under the new guidance, only disposals representing a strategic shift in a company's operations and financial results should be reported as discontinued operations, with expanded disclosures. In addition, disclosure of the pre-tax income attributable to a disposal of a significant part of an organization that does not qualify as a discontinued operation is required. We have adopted this guidance and such guidance became effective for us as of January 1, 2014.
Goodwill
We record the excess of the cost of an acquired entity over the difference between the amounts assigned to assets acquired (including identified intangible assets) and liabilities assumed as goodwill. Goodwill is not amortized but is tested for impairment at a level of reporting referred to as a reporting unit during the fourth quarter of each calendar year, or more frequently if events or changes in circumstances indicate that the asset might be impaired.
Revenue Recognition
We recognize minimum rent, including rental abatements and contractual fixed increases attributable to operating leases, on a straight-line basis over the term of the related lease and we will include amounts expected to be received in later years in
deferred rents. We record property operating expense reimbursements due from tenants for common area maintenance, real estate taxes and other recoverable costs in the period in which the related expenses are incurred.
We make estimates of the collectability of our tenant receivables in relation to base rents, including straight-line rentals, expense reimbursements and other revenue or income. We specifically analyze accounts receivable and historical bad debts, customer creditworthiness, current economic trends and changes in customer payment terms when evaluating the adequacy of the allowance for doubtful accounts. In addition, with respect to tenants in bankruptcy, we will make estimates of the expected recovery of pre-petition and post-petition claims in assessing the estimated collectability of the related receivable. In some cases, the ultimate resolution of these claims can exceed one year. These estimates have a direct impact on our net income because a higher bad debt reserve results in less net income.
Interest income from performing loans receivable is recognized based on the contractual terms of the loan agreement. Fees related to any buy-down of the interest rate will be deferred as prepaid interest income and amortized over the term of the loan as an adjustment to interest income. Closing costs related to the purchase of a performing loan held for investment will be amortized using effective yield method over the term of the loan and accreted as an adjustment against interest income.
Adoption of New Accounting Standards
Accounting Standards Issued But Not Yet Effective
In May 2014, FASB issued ASU No. 2014-09, “Revenue from Contracts with Customers” ("ASU No. 2014-09"), which will replace most existing revenue recognition guidance in GAAP. Under the new standard, revenue is recognized when persuasive evidence of an arrangement exists, delivery has occurred, the fee is fixed or determinable, and collectability is probable. ASU No. 2014-09 requires additional disclosure about the nature, amount, timing and uncertainty of revenue and cash flows arising from customer contracts, including significant judgments and changes in judgments. We will adopt ASU 2014-09 as of January 1, 2018 using the modified retrospective approach. The majority of the our revenue is derived from residential rental income and other lease income, which are scoped out from this standard and included in the current lease accounting framework, and will be accounted for under ASU No. 2016-02, Leases, as discussed below. Revenue streams that are in the scope of the new standards include (but are not limited to) administrative and late fees and revenue sharing arrangements of cable income from contracts with cable providers at our properties. Due to the nature and timing of our identified revenue streams as of December 31, 2017, we do not anticipate the adoption of the new standards will have a material impact on our financial position or results of operations.
In February 2016, FASB issued ASU No. 2016-02, "Leases" ("ASU No. 2016-02"), which is intended to improve financial reporting about leasing transactions and requires organizations that lease assets to recognize on the balance sheet the assets and liabilities for the rights and obligations created by those leases. In September 2017, FASB issued ASU 2017-13, "Revenue Recognition (Topic 605), Revenue from Contracts with Customers (Topic 606), Leases (Topic 840), and Leases (Topic 842)", which provides additional implementation guidance on the previously issued ASU No. 2016-02 Leases (Topic 842). ASU No. 2016-02 is effective for fiscal years, and interim periods within those fiscal years, beginning after December 15, 2018. We are continuing to evaluate this guidance, however, we expect that our operating leases where we are the lessor will be accounted for on our balance sheet similar to our current accounting with the underlying leased asset recognized as real estate. We expect that executory costs and certain other non-lease components will need to be accounted for separately from the lease component of the lease with the lease component continuing to be recognized on a straight-line basis over the lease term and the executory costs and certain other non-lease components being accounted for under the new revenue recognition guidance in ASU 2014-09. For leases in which we are the lessee, primarily consisting of office equipment leases, we expect to recognize a right-of-use asset and a lease liability equal to the present value of the minimum lease payments with rental payments being applied to the lease liability and to interest expense and the right-of-use asset being amortized to expense on a straight-line basis over the term of the lease.
In June 2016, FASB issued ASU No. 2016-13, “Financial Instruments - Credit Losses”, which requires measurement and recognition of expected credit losses for financial assets held. ASU No. 2016-13 will be effective for us beginning January 1, 2019. We are evaluating this guidance; however, we do not expect the adoption of ASU No. 2016-13 to have a significant impact on our consolidated financial statements.
In August 2016, FASB issued ASU No. 2016-15, "Classification of Certain Cash Receipts and Cash Payments", which addresses eight specific cash flow issues with the objective of reducing existing diversity in practice. The guidance is effective for the Company beginning January 1, 2018. Early application is permitted. The adoption of the new requirements is not expected to have a material impact on the Company's consolidated cash flows.
In November 2016, the FASB issued ASU No. 2016-18, “Statement of Cash Flows (Topic 230): Restricted Cash” (“ASU No. 2016-18”), which provides guidance on the classification of restricted cash in the statement of cash flows. ASU No. 2016-18 is effective for the Company's fiscal year beginning January 1, 2018, and the Company does not expect the adoption of ASU No. 2016-18 to have a material effect on the Company's consolidated financial statements and disclosures.
In January 2017, FASB issued ASU No. 2017-01, "Business Combinations (Topic 850): Clarifying the Definition of Business", which clarifies the definition of a business with the objective of adding guidance to assist entities with evaluating whether transactions should be accounted for as acquisitions (or disposals) of businesses. ASU No. 2017-01 will be effective for us beginning January 1, 2018. Early application is permitted. We are evaluating this guidance and assessing the impact of this guidance on our consolidated financial statements.
In January 2017, FASB issued ASU No. 2017-04, "Intangibles - Goodwill and Other (Topic 350): Simplifying the Accounting for Goodwill Impairment", which alters the current goodwill impairment testing procedures to eliminate Step 2. Step 2 required that, if the carrying amount of a reporting unit exceeded its fair value, the implied fair value of the goodwill must be compared to the carrying amount in order to determine impairment. ASU No. 2017-04 will be effective for us beginning December 15, 2019. Early application is permitted. We are evaluating this guidance and assessing the impact of this guidance on our consolidated financial statements.
In August 2017, FASB issued ASU No. 2017-12, "Derivatives and Hedging (Topic 815): Targeted Improvements to Accounting for Hedging Activities", which expands and refines hedge accounting for both financial and non-financial risk components, aligns the recognition and presentation of the effects of hedging instruments and hedge items in the financial statements, and includes certain targeted improvements to ease the application of current guidance related to the assessment of hedge effectiveness. The update to the standard is effective for us January 1, 2019, with early adoption permitted in any interim period. We are continuing to evaluate this guidance and assessing the impact of this guidance on our consolidated financial statements.
Contractual Obligations
The following table presents our scheduled contractual obligations required for the next five years and thereafter as of December 31, 2017 (dollars in thousands):
Payments due by period | |||||||||||||||||||
Total | Less than 1 Year | 1-3 Years | 3-5 Years | More than 5 Years | |||||||||||||||
Long-Term Debt Obligations | $ | 800,862 | $ | 14,005 | $ | 208,910 | $ | 138,415 | $ | 439,532 | |||||||||
Interest on Long-Term Debt Obligations | 146,588 | 29,162 | 52,340 | 36,726 | 28,360 | ||||||||||||||
Operating Lease Obligations | 226 | 56 | 79 | 73 | 18 | ||||||||||||||
$ | 947,676 | $ | 43,223 | $ | 261,329 | $ | 175,214 | $ | 467,910 | ||||||||||
Off-Balance Sheet Arrangements
As of December 31, 2017 and 2016, we did not have any off-balance sheet arrangements or obligations.
Subsequent Events
On January 29, 2018, our Board of Directors declared a $0.05 per share cash distribution to its common stockholders of record at the close of business on January 30, 2018. On February 1, 2018, our Board of Directors declared a $0.05 per share cash distribution to its common stockholders of record at the close of business on February 27, 2018 and March 29, 2018. Such distributions were or are to be paid on January 31, February 28, and April 2, 2018.
On February 12, 2018, we entered into an agreement to purchase Addison at Sandy Spring Apartments, a 236 unit multifamily apartment complex in Sandy Springs, Georgia for $34.0 million with an expected closing date in the second quarter of 2018.
On March 12, 2018, we entered into an agreement to purchase Bristol at Grapevine Apartments, a 376 unit multifamily apartment complex in Grapevine, Texas for $44.7 million with an expected closing date in the second quarter of 2018.
On March 26, 2018, our Board of Directors approved $11.0 million of redemption requests from investors.
Amended Share Redemption Program
On March 28, 2018, our board of directors adopted a Second Amended and Restated Share Redemption Program (the “Amended SRP”). Pursuant to the Amended SRP, we will redeem shares at a purchase price equal to 95% of the current per share net asset value. The Amended SRP will be effective for all redemptions occurring after April 29, 2018.
Amended Distribution Reinvestment Plan
On March 28, 2018, our board of directors adopted a Third Amended and Restated Distribution Reinvestment Plan (the “Amended DRP”). Pursuant to the Amended DRP, shares will be sold at a price equal to 95% of the current per share net asset value. The Amended DRP will be effective for all DRP issuances after April 8, 2018.
We have evaluated subsequent events and determined that no events have occurred, other than those disclosed above, which would require an adjustment to or additional disclosure in the consolidated financial statements.
59
ITEM 7A. QUANTITATIVE AND QUALITATIVE DISCLOSURES ABOUT MARKET RISK
We are exposed to market risk from our financial instruments primarily from changes in market interest rates. We do not have exposure to any other significant market risks. We monitor interest rate risk as an integral part of our overall risk management, which recognizes the unpredictability of financial markets and seeks to reduce the potentially adverse effect on our results of operations. Our operating results are affected by changes in interest rates, primarily changes in LIBOR as a result of borrowings under our credit facility and outstanding mortgage loans.
We enter into derivative financial instruments to manage exposures that arise from business activities that result in the payment of future known and uncertain cash amounts, the value of which are determined by interest rates. Our objectives in using interest rate derivatives are to add stability to interest expense and to manage our exposure to interest rate movements. To accomplish this objective, we entered into a total of 18 interest rate caps that were designated as cash flow hedges during the years 2013 through 2017. Interest rate caps designated as cash flow hedges involve the receipt of variable amounts from a counterparty if interest rates rise above the strike rate on the contract in exchange for an up-front premium.
As of December 31, 2017 and December 31, 2016, we had $536.4 million and $340.9 million, respectively, in variable rate debt outstanding. If interest rates on the variable rate debt had been 100 basis points higher during the years ended December 31, 2017 and 2016, our annual interest expense would have increased by approximately $4.6 million and $2.5 million, respectively.
In addition, changes in interest rates affect the fair value of our fixed rate mortgage notes payable. As of December 31, 2017 and December 31, 2016, we had $264.4 million and $286.2 million, respectively, in fixed rate debt outstanding. As of December 31, 2017 and December 31, 2016, this fixed rate debt had fair values of $272.0 million and $293.5 million, respectively. Fair values are computed using rates available to us for debt with similar terms and remaining maturities. If interest rates had been 100 basis points higher as of December 31, 2017 and December 31, 2016, the fair value of this fixed rate debt would have decreased by $7.7 million and $10.3 million, respectively.
ITEM 8. FINANCIAL STATEMENTS AND SUPPLEMENTARY DATA
See the Index to Financial Statements at page F-1 of this Annual Report on Form 10-K.
ITEM 9. CHANGES IN AND DISAGREEMENTS WITH ACCOUNTANTS ON ACCOUNTING AND FINANCIAL DISCLOSURE
There were no disagreements with our independent registered public accountants during the year ended December 31, 2017.
ITEM 9A. CONTROLS AND PROCEDURES
Disclosure Controls and Procedures
We maintain disclosure controls and procedures that are designed to ensure that information required to be disclosed in our periodic reports under the Securities Exchange Act of 1934, as amended, or the Exchange Act, is recorded, processed, summarized and reported within the time periods specified in the SEC's rules and forms, and that such information is accumulated and communicated to our principal executive officer and our principal financial officer, as appropriate, to allow timely decisions regarding required disclosure. In designing and evaluating the disclosure controls and procedures, our management recognized that any controls and procedures, no matter how well designed and operated, can provide only reasonable assurance of achieving the desired control objectives, and our management necessarily was required to apply its judgment in evaluating the cost-benefit relationship of possible controls and procedures.
Under the supervision of our principal executive officer and principal financial officer, we have carried out an evaluation of the effectiveness of our disclosure controls and procedures as of the end of the period covered by this report. Based upon that evaluation, our principal executive officer and principal financial officer concluded that our disclosure controls and procedures are effective.
Management's Report on Internal Control over Financial Reporting
Our management is responsible for establishing and maintaining adequate internal control over financial reporting as defined in Rules 13a-15(f) and 15d-15(f) under the Exchange Act. Because of its inherent limitations, internal control over financial reporting may not prevent or detect misstatements. Projections of any evaluation of effectiveness to future periods are subject to the risks that controls may become inadequate because of changes in conditions, or that the degree of compliance with the policies or procedures may deteriorate.
Management assessed the effectiveness of our internal control over financial reporting as of December 31, 2017. In making this assessment, management used the criteria set forth in the 2013 version of the Internal Control - Integrated Framework issued by the Committee of Sponsoring Organizations of the Treadway Commission. Based upon this assessment, management believes that our internal control over financial reporting is effective as of December 31, 2017.
Changes in Internal Control over Financial Reporting
There has been no change in our internal control over financial reporting that occurred during the quarter ended December 31, 2017 that has materially affected, or is reasonably likely to materially affect, our internal control over financial reporting.
ITEM 9B. | OTHER INFORMATION |
Amended Share Redemption Program
On March 28, 2018, our board of directors adopted a Second Amended and Restated Share Redemption Program (the “Amended SRP”). Pursuant to the Amended SRP, we will redeem shares at a purchase price equal to 95% of the current per share net asset value. The Amended SRP will be effective for all redemptions occurring after April 29, 2018.
Amended Distribution Reinvestment Plan
On March 28, 2018, our board of directors adopted a Third Amended and Restated Distribution Reinvestment Plan (the “Amended DRP”). Pursuant to the Amended DRP, shares will be sold at a price equal to 95% of the current per share net asset value. The Amended DRP will be effective for all DRP issuances after April 9, 2018.
PART III
ITEM 10. | DIRECTORS, EXECUTIVE OFFICERS AND CORPORATE GOVERNANCE |
Code of Conduct and Ethics
We have adopted a Code of Conduct and Ethics that applies to all of our executive officers and directors, including but not limited to, our chief executive officer and chief financial officer. Our Code of Conduct and Ethics may be found at http://www.resourcereit.com, on the Prospectus/SEC Filings page.
The other information required by this Item is incorporated by reference from our 2018 Proxy Statement.
ITEM 11. | EXECUTIVE COMPENSATION |
The information required by this Item is incorporated by reference from our 2018 Proxy Statement.
ITEM 12. | SECURITY OWNERSHIP OF CERTAIN BENEFICIAL OWNERS AND MANAGEMENT AND RELATED STOCKHOLDER MATTERS |
The information required by this Item is incorporated by reference from our 2018 Proxy Statement.
ITEM 13. | CERTAIN RELATIONSHIPS AND RELATED TRANSACTIONS, AND DIRECTOR INDEPENDENCE |
The information required by this Item is incorporated by reference from our 2018 Proxy Statement.
ITEM 14. | PRINCIPAL ACCOUNTING FEES AND SERVICES |
The information required by this Item is incorporated by reference from our 2018 Proxy Statement.
PART IV
ITEM 15. | EXHIBITS AND FINANCIAL STATEMENT SCHEDULES |
The following documents are filed as part of this Annual Report on Form 10-K:
(a) | Financial Statements |
1. | See the Index to Consolidated Financial Statements at page F-1 of this report. |
(b) | Financial Statement Schedules |
i. | Schedule III Real Estate and Accumulated Depreciation |
ii. | Schedule IV - Mortgage Loans on Real Estate |
(c) | Exhibits |
Exhibit No. | Description | |||
3.1 | ||||
3.2 | ||||
4.1 | ||||
4.2 | ||||
4.3 | ||||
4.4 | ||||
10.1 | ||||
10.2 | ||||
10.3 | ||||
10.4 | ||||
21.1 | ||||
23.1 | ||||
31.1 | ||||
31.2 | ||||
32.1 | ||||
32.2 | ||||
99.1 | ||||
99.2 | ||||
99.3 | ||||
101.1 | Interactive Data Files | |||
SIGNATURES
Pursuant to the requirements of Section 13 or 15(d) of the Securities Exchange Act of 1934, the registrant has duly caused this report to be signed on its behalf by the undersigned thereunto duly authorized.
RESOURCE REAL ESTATE OPPORTUNITY REIT, INC. | ||
March 29, 2018 | By: | /s/ Alan F. Feldman |
ALAN F. FELDMAN | ||
Chief Executive Officer and Director | ||
Pursuant to the requirements of the Securities Act of 1933, this report has been signed below by the following persons on behalf of the registrant and in the capacities and on the dates indicated.
/s/ Robert C. Lieber | Director | March 29, 2018 | |
ROBERT C. LIEBER | |||
/s/ Andrew Ceitlin | Director | March 29, 2018 | |
ANDREW CEITLIN | |||
/s/ Gary Lichtenstein | Director | March 29, 2018 | |
GARY LICHTENSTEIN | |||
/s/ Lee F. Shlifer | Director | March 29, 2018 | |
LEE F. SHLIFER | |||
/s/ Alan F. Feldman | Chief Executive Officer and Director | March 29, 2018 | |
ALAN F. FELDMAN | (Principal Executive Officer) | ||
/s/ Steven R. Saltzman | Chief Financial Officer, Senior Vice President | March 29, 2018 | |
STEVEN R. SALTZMAN | and Treasurer (Principal Financial Officer and Principal Accounting Officer) | ||
INDEX TO CONSOLIDATED FINANCIAL STATEMENTS
Financial Statements | Page | |
REPORT OF INDEPENDENT REGISTERED PUBLIC ACCOUNTING FIRM
Board of Directors and Stockholders
Resource Real Estate Opportunity REIT, Inc.
Opinion on the financial statements
We have audited the accompanying consolidated balance sheets of Resource Real Estate Opportunity REIT, Inc. (a Maryland corporation) and subsidiaries (the “Company”) as of December 31, 2017 and 2016, the related consolidated statements of operations and comprehensive loss, changes in stockholders’ equity, and cash flows for each of the three years in the period ended December 31, 2017, and the related notes and schedules (collectively referred to as the “financial statements”). In our opinion, the financial statements present fairly, in all material respects, the financial position of the Company as of December 31, 2017 and 2016, and the results of its operations and its cash flows for each of the three years in the period ended December 31, 2017, in conformity with accounting principles generally accepted in the United States of America.
Basis for opinion
These financial statements are the responsibility of the Company’s management. Our responsibility is to express an opinion on the Company’s financial statements based on our audits. We are a public accounting firm registered with the Public Company Accounting Oversight Board (United States) (“PCAOB”) and are required to be independent with respect to the Company in accordance with the U.S. federal securities laws and the applicable rules and regulations of the Securities and Exchange Commission and the PCAOB.
We conducted our audits in accordance with the standards of the PCAOB. Those standards require that we plan and perform the audits to obtain reasonable assurance about whether the financial statements are free of material misstatement, whether due to error or fraud. The Company is not required to have, nor were we engaged to perform, an audit of its internal control over financial reporting. As part of our audits we are required to obtain an understanding of internal control over financial reporting but not for the purpose of expressing an opinion on the effectiveness of the Company’s internal control over financial reporting. Accordingly, we express no such opinion.
Our audits included performing procedures to assess the risks of material misstatement of the financial statements, whether due to error or fraud, and performing procedures that respond to those risks. Such procedures included examining, on a test basis, evidence supporting the amounts and disclosures in the financial statements. Our audits also included evaluating the accounting principles used and significant estimates made by management, as well as evaluating the overall presentation of the financial statements. We believe that our audits provide a reasonable basis for our opinion.
/s/ GRANT THORNTON LLP
We have served as the Company’s auditor since 2009.
Philadelphia, Pennsylvania
March 29, 2018
RESOURCE REAL ESTATE OPPORTUNITY REIT, INC.
CONSOLIDATED BALANCE SHEETS
(in thousands)
December 31, | |||||||
2017 | 2016 | ||||||
ASSETS | |||||||
Investments: | |||||||
Rental properties, net | $ | 998,889 | $ | 902,454 | |||
Other investments | 782 | 769 | |||||
Identified intangible assets, net | 1,796 | 1,855 | |||||
Total investments | 1,001,467 | 905,078 | |||||
Cash | 117,660 | 114,842 | |||||
Restricted cash | 13,401 | 10,277 | |||||
Due from related parties | 371 | 1,375 | |||||
Tenant receivables, net | 251 | 89 | |||||
Deposits | 227 | 262 | |||||
Prepaid expenses and other assets | 1,745 | 2,351 | |||||
Goodwill | 670 | 711 | |||||
Total assets | $ | 1,135,792 | $ | 1,034,985 | |||
LIABILITIES AND EQUITY | |||||||
Liabilities: | |||||||
Mortgage notes payable, net | $ | 794,671 | $ | 622,152 | |||
Accounts payable | 791 | 1,125 | |||||
Accrued expenses and other liabilities | 8,074 | 6,738 | |||||
Accrued real estate taxes | 9,195 | 7,262 | |||||
Due to related parties | 719 | 2,055 | |||||
Tenant prepayments | 1,178 | 1,069 | |||||
Security deposits | 2,572 | 2,565 | |||||
Total liabilities | $ | 817,200 | $ | 642,966 | |||
Equity: | |||||||
Preferred stock (par value $.01; 10,000,000 shares authorized, none issued) | — | — | |||||
Common stock (par value $.01; 1,000,000,000 shares authorized; 77,457,551 and 74,975,022 shares issued, respectively; and 71,299,467 and 72,006,589 shares outstanding, respectively) | 713 | 720 | |||||
Convertible stock (“promote shares”; par value $.01; 50,000 shares authorized and issued; 49,995 and 50,000 shares outstanding, respectively) | 1 | 1 | |||||
Additional paid-in capital | 635,748 | 642,523 | |||||
Accumulated other comprehensive loss | (562 | ) | (345 | ) | |||
Accumulated deficit | (317,308 | ) | (252,306 | ) | |||
Total stockholders’ equity | 318,592 | 390,593 | |||||
Noncontrolling interests | — | 1,426 | |||||
Total equity | $ | 318,592 | $ | 392,019 | |||
Total liabilities and equity | $ | 1,135,792 | $ | 1,034,985 | |||
RESOURCE REAL ESTATE OPPORTUNITY REIT, INC.
CONSOLIDATED STATEMENTS OF OPERATIONS AND COMPREHENSIVE INCOME (LOSS)
(in thousands, except per share data)
For the Years Ended | |||||||||||
December 31, | |||||||||||
2017 | 2016 | 2015 | |||||||||
Revenues: | |||||||||||
Rental income | $ | 125,450 | $ | 117,745 | $ | 117,687 | |||||
Interest and dividend income | 239 | 622 | 638 | ||||||||
Total revenues | 125,689 | 118,367 | 118,325 | ||||||||
Expenses: | |||||||||||
Rental operating - expenses | 27,211 | 27,608 | 34,167 | ||||||||
Rental operating - payroll | 13,652 | 14,790 | 16,769 | ||||||||
Rental operating - real estate taxes | 14,454 | 12,668 | 13,154 | ||||||||
Subtotal - Rental operating expenses | 55,317 | 55,066 | 64,090 | ||||||||
Acquisition costs | 4,469 | 1,582 | 5,811 | ||||||||
Management fees | 16,921 | 15,724 | 15,453 | ||||||||
General and administrative | 11,061 | 13,083 | 12,776 | ||||||||
Loss on disposal of assets | 1,468 | 1,576 | 3,093 | ||||||||
Provision for loan loss | — | — | 130 | ||||||||
Depreciation and amortization expense | 52,344 | 44,231 | 48,273 | ||||||||
Total expenses | 141,580 | 131,262 | 149,626 | ||||||||
Loss before other income (expense) | (15,891 | ) | (12,895 | ) | (31,301 | ) | |||||
Other income (expense): | |||||||||||
Net gains on dispositions of properties and joint venture interests | 22,735 | 45,057 | 36,041 | ||||||||
Interest expense | (28,963 | ) | (22,776 | ) | (22,080 | ) | |||||
Insurance proceeds in excess of cost basis | 150 | 985 | 407 | ||||||||
Total other income (expense) | (6,078 | ) | 23,266 | 14,368 | |||||||
Net (loss) income | (21,969 | ) | 10,371 | (16,933 | ) | ||||||
Net (income) loss attributable to noncontrolling interests | — | (6,306 | ) | 38 | |||||||
Net (loss) income attributable to common stockholders | $ | (21,969 | ) | $ | 4,065 | $ | (16,895 | ) | |||
Net (loss) income | $ | (21,969 | ) | $ | 10,371 | $ | (16,933 | ) | |||
Other comprehensive income (loss): | |||||||||||
Reclassification adjustment for realized loss on designated derivatives | 163 | 105 | — | ||||||||
Designated derivatives, fair value adjustments | (380 | ) | (10 | ) | (174 | ) | |||||
Total other comprehensive income (loss) | (217 | ) | 95 | (174 | ) | ||||||
Comprehensive income (loss) | (22,186 | ) | 10,466 | (17,107 | ) | ||||||
Comprehensive (income) loss attributable to noncontrolling interests | — | (6,306 | ) | 38 | |||||||
Total comprehensive income (loss) attributable to stockholders | $ | (22,186 | ) | $ | 4,160 | $ | (17,069 | ) | |||
Weighted average common shares outstanding | 71,865 | 71,787 | 70,397 | ||||||||
Basic and diluted (loss) income per common share: | |||||||||||
Net (loss) income per common share | $ | (0.31 | ) | $ | 0.06 | $ | (0.24 | ) | |||
RESOURCE REAL ESTATE OPPORTUNITY REIT, INC.
CONSOLIDATED STATEMENTS OF CHANGES IN STOCKHOLDERS’ EQUITY
FOR THE YEARS ENDED DECEMBER 31, 2017, 2016, AND 2015
(in thousands)
Common Stock | Convertible Stock | Additional Paid-in Capital | Accumulated Other Comprehensive Income (Loss) | Accumulated Deficit | Total Stockholders’ Equity | Noncontrolling interests | Total Equity | ||||||||||||||||||||||||||||||
Shares | Amount | Shares | Amount | ||||||||||||||||||||||||||||||||||
Balance at January 1, 2015 | 69,254 | $ | 693 | 50 | $ | 1 | $ | 614,024 | $ | (266 | ) | $ | (154,319 | ) | $ | 460,133 | $ | 8,221 | $ | 468,354 | |||||||||||||||||
Common stock issued through distribution reinvestment plan | 2,865 | 28 | — | — | 28,931 | — | — | 28,959 | — | 28,959 | |||||||||||||||||||||||||||
Distributions on common stock | — | — | — | — | — | — | — | — | — | — | |||||||||||||||||||||||||||
Distributions declared | — | — | — | — | — | — | (42,216 | ) | (42,216 | ) | — | (42,216 | ) | ||||||||||||||||||||||||
Common stock redemptions | (502 | ) | (5 | ) | — | — | (5,101 | ) | — | 64 | (5,042 | ) | — | (5,042 | ) | ||||||||||||||||||||||
Other comprehensive loss | — | — | — | — | — | (174 | ) | — | (174 | ) | — | (174 | ) | ||||||||||||||||||||||||
Contributions from noncontrolling interests | — | — | — | — | — | — | — | — | 151 | 151 | |||||||||||||||||||||||||||
Acquisitions of noncontrolling interests | — | — | — | — | 481 | — | — | 481 | (481 | ) | — | ||||||||||||||||||||||||||
Net loss | — | — | — | — | — | — | (16,895 | ) | (16,895 | ) | (38 | ) | (16,933 | ) | |||||||||||||||||||||||
Balance at December 31, 2015 | 71,617 | 716 | 50 | 1 | 638,335 | (440 | ) | (213,366 | ) | 425,246 | 7,853 | 433,099 | |||||||||||||||||||||||||
Common stock issued through distribution reinvestment plan | 2,642 | 26 | — | — | 28,471 | — | — | 28,497 | — | 28,497 | |||||||||||||||||||||||||||
Distributions declared | — | — | — | — | — | — | (43,005 | ) | (43,005 | ) | — | (43,005 | ) | ||||||||||||||||||||||||
Common stock redemptions | (2,252 | ) | (22 | ) | — | — | (24,283 | ) | — | — | (24,305 | ) | — | (24,305 | ) | ||||||||||||||||||||||
Other comprehensive income | — | — | — | — | — | 95 | — | 95 | — | 95 | |||||||||||||||||||||||||||
Distributions to noncontrolling interests | — | — | — | — | — | — | — | — | (9,120 | ) | (9,120 | ) | |||||||||||||||||||||||||
Deconsolidation of subsidiaries | — | — | — | — | — | — | — | — | (3,613 | ) | (3,613 | ) | |||||||||||||||||||||||||
Net income | — | — | — | — | — | — | 4,065 | 4,065 | 6,306 | 10,371 | |||||||||||||||||||||||||||
Balance at December 31, 2016 | 72,007 | 720 | 50 | 1 | 642,523 | $ | (345 | ) | (252,306 | ) | 390,593 | 1,426 | 392,019 | ||||||||||||||||||||||||
Common stock issued through distribution reinvestment plan | 2,482 | 25 | — | — | 27,089 | — | — | 27,114 | — | 27,114 | |||||||||||||||||||||||||||
Distributions declared | — | — | — | — | — | — | (43,033 | ) | (43,033 | ) | — | (43,033 | ) | ||||||||||||||||||||||||
Common stock redemptions | (3,190 | ) | (32 | ) | — | — | (34,786 | ) | — | — | (34,818 | ) | — | (34,818 | ) | ||||||||||||||||||||||
Other comprehensive loss | — | — | — | — | — | (217 | ) | — | (217 | ) | — | (217 | ) | ||||||||||||||||||||||||
Deconsolidation of noncontrolling interests | — | — | — | — | 922 | — | — | 922 | (922 | ) | — | ||||||||||||||||||||||||||
Distribution to noncontrolling interests | — | — | — | — | — | — | — | — | (504 | ) | (504 | ) | |||||||||||||||||||||||||
Net loss | — | — | — | — | — | — | (21,969 | ) | (21,969 | ) | — | (21,969 | ) | ||||||||||||||||||||||||
Balance at December 31, 2017 | 71,299 | $ | 713 | 50 | $ | 1 | $ | 635,748 | $ | (562 | ) | $ | (317,308 | ) | $ | 318,592 | $ | — | $ | 318,592 | |||||||||||||||||
RESOURCE REAL ESTATE OPPORTUNITY REIT, INC.
CONSOLIDATED STATEMENTS OF CASH FLOWS
(in thousands)
For the Years Ended | |||||||||||
December 31, | |||||||||||
2017 | 2016 | 2015 | |||||||||
Cash flows from operating activities: | |||||||||||
Net (loss) income | $ | (21,969 | ) | $ | 10,371 | $ | (16,933 | ) | |||
Adjustments to reconcile net (loss) income to net cash provided by (used in) operating activities: | |||||||||||
Loss on disposal of assets | 1,468 | 1,576 | 3,093 | ||||||||
Casualty (gains) losses | (103 | ) | (680 | ) | 782 | ||||||
Provision for loan loss | — | — | 130 | ||||||||
Loss on extinguishment of debt | — | 791 | — | ||||||||
Net gains on disposition of properties and joint venture interests | (22,735 | ) | (45,057 | ) | (36,041 | ) | |||||
Depreciation and amortization | 52,344 | 44,231 | 48,273 | ||||||||
Amortization of deferred financing costs | 2,014 | 2,120 | 1,839 | ||||||||
Amortization of debt premium (discount) | (465 | ) | (485 | ) | (779 | ) | |||||
Realized loss on change in fair value of interest rate cap | 163 | 105 | — | ||||||||
Accretion of discount and direct loan fees and costs | (39 | ) | (39 | ) | (39 | ) | |||||
Changes in operating assets and liabilities, net of acquisitions: | |||||||||||
Restricted cash | (1,286 | ) | (1,428 | ) | (1,942 | ) | |||||
Tenant receivables, net | (162 | ) | 55 | 313 | |||||||
Deposits | 35 | (65 | ) | 3 | |||||||
Prepaid expenses and other assets | 1,408 | 489 | 886 | ||||||||
Due to/from related parties, net | (313 | ) | 869 | (722 | ) | ||||||
Accounts payable and accrued expenses | 1,632 | (1,720 | ) | 583 | |||||||
Tenant prepayments | 106 | (102 | ) | (40 | ) | ||||||
Security deposits | (110 | ) | 99 | 91 | |||||||
Net cash provided by (used in) operating activities from continuing operations | 11,988 | 11,130 | (503 | ) | |||||||
Cash flows from investing activities: | |||||||||||
Proceeds from disposal of properties and joint venture interests, net of closing costs | 31,926 | 80,173 | 60,258 | ||||||||
Property acquisitions | (45,302 | ) | (63,126 | ) | (96,953 | ) | |||||
Insurance proceeds received for casualty losses | 248 | 3,171 | 794 | ||||||||
Acquisition of preferred equity interest | — | (408 | ) | (408 | ) | ||||||
Resolution of preferred equity interest | — | 4,300 | — | ||||||||
Capital expenditures | (21,592 | ) | (28,024 | ) | (43,018 | ) | |||||
Restricted cash | (434 | ) | 1,572 | (766 | ) | ||||||
Principal payments received on loans held for investment | 26 | 21 | 601 | ||||||||
Net cash used in investing activities of continuing operations | (35,128 | ) | (2,321 | ) | (79,492 | ) | |||||
RESOURCE REAL ESTATE OPPORTUNITY REIT, INC.
CONSOLIDATED STATEMENTS OF CASH FLOWS - (Continued)
(in thousands)
For the Years Ended | |||||||||||
December 31, | |||||||||||
2017 | 2016 | 2015 | |||||||||
Cash flows from financing activities: | |||||||||||
Redemptions of common stock | (34,818 | ) | (24,305 | ) | (5,042 | ) | |||||
Payment of deferred financing costs | (605 | ) | (3,200 | ) | (402 | ) | |||||
Borrowings on mortgages | 84,412 | 194,870 | 31,473 | ||||||||
Principal repayments on mortgages | (6,600 | ) | (93,990 | ) | (6,150 | ) | |||||
Borrowings on credit facility | — | 12,500 | 33,918 | ||||||||
Repayments on credit facility | — | (34,394 | ) | (22,288 | ) | ||||||
Purchase of interest rate caps | (8 | ) | (262 | ) | (95 | ) | |||||
Distributions paid on common stock | (15,919 | ) | (14,508 | ) | (13,257 | ) | |||||
Contributions of noncontrolling interests | — | — | 151 | ||||||||
Distributions to noncontrolling interests | (504 | ) | (9,120 | ) | — | ||||||
Net cash provided by financing activities of continuing operations | 25,958 | 27,591 | 18,308 | ||||||||
Net increase (decrease) in cash | 2,818 | 36,400 | (61,687 | ) | |||||||
Cash at beginning of year | 114,842 | 78,442 | 140,129 | ||||||||
Cash at end of year | $ | 117,660 | $ | 114,842 | $ | 78,442 | |||||
RESOURCE REAL ESTATE OPPORTUNITY REIT, INC.
NOTES TO CONSOLIDATED FINANCIAL STATEMENTS
DECEMBER 31, 2017
NOTE 1 – NATURE OF BUSINESS AND OPERATIONS
Resource Real Estate Opportunity REIT, Inc. (the “Company”) was organized in Maryland on June 3, 2009 to purchase a diversified portfolio of discounted U.S. commercial real estate and real estate-related assets in order to generate gains to stockholders from the potential appreciation in the value of the assets and to generate current income for stockholders by distributing cash flow from the Company’s investments. Resource Real Estate Opportunity Advisor, LLC (the “Advisor”), an indirect wholly owned subsidiary of Resource America, Inc. (“RAI”) has been engaged to manage the day-to-day operations of the Company.
RAI is a wholly-owned subsidiary of C-III Capital Partners LLC, ("C-III"), a leading commercial real estate investment management and services company engaged in a broad range of activities. C-III controls both our Advisor and Resource Real Estate Opportunity Manager, LLC (the "Manager"), the Company's property manager; C-III also controls all of the shares of common stock held by the Advisor.
Through its private offering and primary public offering, which concluded on December 13, 2013, the Company raised aggregate gross offering proceeds of $645.8 million, which resulted in the issuance of 64.9 million shares of common stock, including 276,056 shares purchased by the Advisor and 1.2 million shares sold in the Company's distribution reinvestment plan. During the years ended December 31, 2017, 2016 and 2015, the Company issued a total of 8.0 million, in aggregate, additional shares for $84.6 million pursuant to its distribution reinvestment plan. The Company's distribution reinvestment plan offering is ongoing.
The Company has acquired, and may continue to acquire, real estate and real estate-related debt. The Company has a particular focus on owning and operating multifamily assets, and has targeted, and intends to continue to target, this asset class while also possibly acquiring interests in other types of commercial property assets consistent with its investment objectives. The Company’s portfolio predominantly consists of multifamily rental properties to which the Company has added or will add value with a capital infusion (referred to as “value add properties”). However, the Company is not limited in the types of real estate assets in which it may invest and, accordingly, it may invest in other real estate-related assets either directly or together with a co-investor or joint venture partner.
The Company is organized and conducts its operations in a manner intended to allow it to qualify as a real estate investment trust (“REIT”) for U.S. federal income tax purposes under Subchapter M of the Internal Revenue Code of 1986, as amended. The Company also operates its business in a manner intended to maintain its exemption from registration under the Investment Company Act of 1940, as amended.
NOTE 2 – SUMMARY OF SIGNIFICANT ACCOUNTING POLICIES
A summary of the significant accounting policies consistently applied in the preparation of the accompanying consolidated financial statements follows:
Basis of Presentation
The accompanying consolidated financial statements have been prepared in conformity with accounting principles generally accepted in the United States of America ("GAAP").
Principles of Consolidation
The consolidated financial statements include the accounts of the Company and its wholly-owned subsidiaries as follows:
Subsidiary | Apartment Complex | Number of Units | Property Location | |||
RRE Opportunity Holdings, LLC | N/A | N/A | N/A | |||
Resource Real Estate Opportunity OP, LP | N/A | N/A | N/A | |||
RRE Charlemagne Holdings, LLC | N/A | N/A | N/A | |||
RRE Iroquois, LP (“Vista”) | Vista Apartment Homes | 133 | Philadelphia, PA | |||
RRE Iroquois Holdings, LLC | N/A | N/A | N/A | |||
RRE Cannery Holdings, LLC (“Cannery”) | Cannery Lofts | 156 | Dayton, OH | |||
RRE Williamsburg Holdings, LLC (“Williamsburg”) | Williamsburg | 976 | Cincinnati, OH | |||
WPL Holdings, LLC | N/A (a) | N/A | N/A | |||
RRE Autumn Wood Holdings, LLC ("Autumn Wood") | Retreat at Rocky Ridge | 206 | Hoover, AL | |||
RESOURCE REAL ESTATE OPPORTUNITY REIT, INC.
NOTES TO CONSOLIDATED FINANCIAL STATEMENTS – (Continued)
DECEMBER 31, 2017
RRE Village Square Holdings, LLC ("Village Square") | Trailpoint at the Woodlands | 271 | Houston, TX | |||
RRE Brentdale Holdings, LLC ("Brentdale") | The Westside Apartments | 412 | Plano, TX | |||
RRE Jefferson Point Holdings, LLC ("Jefferson Point") | Tech Center Square | 208 | Newport News, VA | |||
RRE Centennial Holdings, LLC ("Centennial") | Verona Apartment Homes | 276 | Littleton, CO | |||
RRE Pinnacle Holdings, LLC ("Pinnacle") | Skyview Apartment Homes | 224 | Westminster, CO | |||
RRE River Oaks Holdings, LLC ("River Oaks") | Maxwell Townhomes | 316 | San Antonio, TX | |||
RRE Nicollet Ridge Holdings, LLC ("Nicollet Ridge") | Meridian Pointe | 339 | Burnsville, MN | |||
RRE Addison Place, LLC ("Addison Place") | The Estates at Johns Creek | 403 | Alpharetta, GA | |||
PRIP Coursey, LLC ("Evergreen at Coursey Place") | Evergreen at Coursey Place (b) | 352 | Baton Rouge, LA | |||
PRIP 500, LLC ("Pinehurst") | Pinehurst (b) | 146 | Kansas City, MO | |||
PRIP 1102, LLC ("Pheasant Run") | Pheasant Run (b) | 160 | Lee's Summit, MO | |||
PRIP 11128, LLC ("Retreat at Shawnee") | Retreat at Shawnee (b) | 342 | Shawnee, KS | |||
PRIP Pines, LLC ("Pines of York") | Pines of York (b) | 248 | Yorktown, VA | |||
RRE Berkeley Run Holdings, LLC ("Berkley Run") | Perimeter Circle | 194 | Atlanta, GA | |||
RRE Berkeley Trace Holdings LLC ("Berkley Trace") | Perimeter 5550 | 165 | Atlanta, GA | |||
RRE Merrywood LLC ("Merrywood") | Aston at Cinco Ranch | 228 | Katy, TX | |||
RRE Sunset Ridge Holdings, LLC ("Sunset Ridge") | Sunset Ridge | 324 | San Antonio, TX | |||
RRE Parkridge Place Holdings, LLC ("Parkridge Place") | Calloway at Las Colinas | 536 | Irving, TX | |||
RRE Woodmoor Holdings, LLC ("Woodmoor") | South Lamar Village | 208 | Austin, TX | |||
RRE Gilbert Holdings, LLC ("Springs at Gilbert") | Heritage Pointe | 458 | Gilbert, AZ | |||
RRE Bonita Glen Holdings, LLC ("Bonita") | Point Bonita Apartment Homes | 295 | Chula Vista, CA | |||
RRE Yorba Linda Holdings, LLC ("Yorba Linda") | The Bryant at Yorba Linda | 400 | Yorba Linda, CA | |||
RRE Providence Holdings, LLC ("Providence in the Park") | Providence in the Park | 524 | Arlington, TX | |||
RRE Green Trails Holdings, LLC ("Green Trails") | Green Trails Apartment Homes | 440 | Lisle, IL | |||
RRE Terraces at Lake Mary Holdings, LLC ("Lake Mary") | Terraces at Lake Mary | 284 | Lake Mary, FL | |||
RRE Courtney Meadows Holdings, LLC ("Courtney Meadows") | Courtney Meadows Apartments | 276 | Jacksonville, FL | |||
9,500 | ||||||
Subsidiaries related to disposed investments: | ||||||
RRE Crestwood Holdings, LLC (“Crestwood”) | (c)(f) | N/A | N/A | |||
PRIP 5060/6310, LLC ("Governor Park") | (c)(g) | N/A | N/A | |||
RRE Campus Club Holdings, LLC (“Campus Club”) | (c) | N/A | N/A | |||
PRIP 6700, LLC ("Hilltop Village") | (b)(c)(f) | N/A | N/A | |||
RRE Westhollow Holdings, LLC (“Westhollow”) | (c) | N/A | N/A | |||
RRE Flagstone Holdings, LLC ("Flagstone") | (c)(f) | N/A | N/A | |||
RRE 107th Avenue Holdings, LLC (“107th Avenue”) | (d)(f) | N/A | N/A | |||
RRE Bristol Holdings, LLC (“Bristol”) | (c)(f) | N/A | N/A | |||
RRE Skyview Holdings, LLC ("Skyview") | (c)(f) | N/A | N/A | |||
RRE Kenwick Canterbury Holdings, LLC ("Kenwick & Canterbury") | (c) | N/A | N/A | |||
RRE Foxwood Holdings, LLC ("Foxwood") | (c)(f) | N/A | N/A | |||
PRIP 3383, LLC ("Conifer Place") | (b)(d)(f) | N/A | N/A | |||
PRIP 3700, LLC ("Champion Farms") | (b)(d)(f) | N/A | N/A | |||
RRE Armand Place Holdings, LLC ("Armand") | (d)(f) | N/A | N/A | |||
RRE Spring Hill Holdings, LLC ("Spring Hill") | (e) | N/A | N/A | |||
RRE Nob Hill Holdings, LLC ("Nob Hill") | (d)(f) | N/A | N/A | |||
PRIP 10637, LLC ("Fieldstone") | (b)(d)(f) | N/A | N/A | |||
RRE Jasmine Holdings, LLC ("Jasmine") | (d)(f) | N/A | N/A | |||
RESOURCE REAL ESTATE OPPORTUNITY REIT, INC.
NOTES TO CONSOLIDATED FINANCIAL STATEMENTS – (Continued)
DECEMBER 31, 2017
RRE Chisholm Place Holdings LLC ("Chisholm Place") | (g) | N/A | N/A | |||
RRE Park Forest Holdings, LLC ("Park Forest") | (g) | N/A | N/A | |||
RRE Deerfield Holdings, LLC ("Deerfield") | (g) | N/A | N/A | |||
PRIP Stone Ridge, LLC ("Stone Ridge") | (b)(g) | N/A | N/A | |||
N/A - Not Applicable
(a) Subsidiary transferred its interest in a portion of the Williamsburg parking lot to RRE Williamsburg Holdings, LLC in 2016.
(b) Wholly-owned subsidiary of RRE Charlemagne Holdings, LLC.
(c) Underlying investment sold prior to 2016.
(d) Underlying investment sold in 2016.
(e) Underlying investment resolved in 2016.
(f) Subsidiary was dissolved prior to December 31, 2017.
(g) Underlying investment sold in 2017.
All intercompany accounts and transactions have been eliminated in consolidation.
The consolidated financial statements reflect the Company's accounts and the accounts of the Company's majority-owned and/or controlled subsidiaries. The Company follows the provisions of Accounting Standards Codification (“ASC”) Topic 810, “Consolidation,” and accordingly consolidates entities that are variable interest entities (“VIEs”) where it has determined that it is the primary beneficiary of such entities. Once it has been determined that the Company holds a variable interest in a VIE, management performs a qualitative analysis to determine (i) if the Company has the power to direct the matters that most significantly impact the VIE's financial performance; and (ii) if the Company has the obligation to absorb the losses of the VIE that could potentially be significant to the VIE or the right to receive the benefits of the VIE that could potentially be significant to the VIE. If the Company's interest possesses both of these characteristics, the Company is deemed to be the primary beneficiary and would be required to consolidate the VIE. The Company will continually assess its involvement with VIEs and re-evaluate the requirement to consolidate them. For consolidated entities (including VIEs of which the Company is the primary beneficiary), noncontrolling interests are presented and disclosed as a separate component of stockholders' equity (not as a liability or other item outside of stockholders' equity). Consolidated net income (loss) includes the noncontrolling interests’ share of income (loss). All changes in the Company’s ownership interest in a subsidiary are accounted for as stockholders' equity transactions if the Company retains its controlling financial interest in the subsidiary. The portions of these entities that the Company does not own are presented as noncontrolling interests as of the dates and for the periods presented in the consolidated financial statements. The consolidated financial statements include the accounts of the Company's majority-owned and/or controlled subsidiaries, which are VIEs, as follows:
Subsidiary | Ownership % | Apartment Complex | Number of Units | Property Location | ||||
DT Stone Ridge, LLC | 83.4% | Stone Ridge | 188 | Columbia, SC | ||||
The property held by DT Stone Ridge, LLC was sold on September 27, 2017 and a distribution to the joint venture partner was completed in October 2017. As a result, all of the Company's subsidiaries are wholly-owned.
Until June 16, 2016, the Company had a preferred equity investment that was repaid in full on that date. The Company's preferred equity investment was a VIE for which the Company had determined it was not the primary beneficiary; therefore, the Company did not consolidate the entity. The Company was not considered the primary beneficiary of the preferred equity investee because it did not possess the unilateral power to direct the key activities of the investee that were considered most significant. The Company has no further continuing involvement with the investee. Additional information with respect to the preferred equity investment is disclosed in Note 6.
Segment Reporting
The Company does not evaluate performance on a relationship specific or transactional basis and does not distinguish its principal business or group its operations on a geographical basis for purposes of measuring performance. Accordingly, the Company believes it has a single operating segment for reporting purposes in accordance with GAAP.
RESOURCE REAL ESTATE OPPORTUNITY REIT, INC.
NOTES TO CONSOLIDATED FINANCIAL STATEMENTS – (Continued)
DECEMBER 31, 2017
Use of Estimates
The preparation of the consolidated financial statements in conformity with GAAP requires management to make estimates and assumptions that affect the reported amounts of assets and liabilities and disclosure of contingent assets and liabilities at the date of the consolidated financial statements and the reported amounts of revenues and expenses during the reporting period. Actual results could differ from those estimates.
Assets Held for Sale
The Company presents the assets and liabilities of any rental properties which qualify as held for sale, separately in the consolidated balance sheets. Real estate assets held for sale are measured at the lower of carrying amount or fair value less cost to sell. Both the real estate and the corresponding liabilities are presented separately in the consolidated balance sheets. Subsequent to classification of an asset as held for sale, no further depreciation is recorded. The Company had no rental properties included in assets held for sale as of December 31, 2017 and 2016.
Rental Properties
The Company records acquired rental properties at fair value on their respective acquisition date. The Company considers the period of future benefit of an asset to determine its appropriate useful life and depreciates the rental properties using the straight line method. The Company anticipates the estimated useful lives of its assets by class as follows:
Buildings | 27.5 years |
Building improvements | 5.0 to 27.5 years |
Furniture, fixtures, and equipment | 3.0 to 5.0 years |
Tenant improvements | Shorter of lease term or expected useful life |
Improvements and replacements in excess of $1,000 are capitalized when they have a useful life greater than or equal to one year. The Manager earns a construction management fee of 5.0% of actual aggregate costs to construct improvements, or to repair, rehab or reconstruct a property. These costs are capitalized along with the related asset. Costs of repairs and maintenance are expensed as incurred.
As of December 31, 2017, the Company's real estate investments in Texas, Georgia, and California represented approximately 27%, 11%, and 17% of the net book value of its rental property assets, respectively. As a result, the geographic concentration of the Company's portfolio makes it particularly susceptible to adverse economic developments in the Texas, Georgia, and California real estate markets. Any adverse economic or real estate developments in these markets, such as business layoffs or downsizing, industry slowdowns, relocations of businesses, changing demographics and other factors, or any decrease in demand for multifamily rentals resulting from the local business climate, could adversely affect the Company's operating results and its ability to make distributions to stockholders.
Concentration of Credit Risk
Financial instruments, which potentially subject the Company to concentration of credit risk, consist of periodic temporary deposits of cash. At December 31, 2017, the Company had $133.0 million of deposits at various banks, $119.2 million of which were over the insurance limit of the Federal Deposit Insurance Corporation. No losses have been experienced on such deposits.
Contractual Obligations
The Company leases parking space and equipment under leases with varying expiration dates through 2023. As of December 31, 2017, the total payments due under these obligations were $226,000.
Impairment of Long Lived Assets
When circumstances indicate the carrying value of a property may not be recoverable, the Company reviews the asset for permanent impairment. This review is based on an estimate of the future undiscounted cash flows, excluding interest charges, expected to result from the property’s use and eventual disposition. The review also considers factors such as expected future operating income, market and other applicable trends and residual value, as well as the effects of leasing demand, competition and other factors.
An impairment loss will be recorded to the extent that the carrying value exceeds the estimated fair value of the property for properties to be held and used. For properties held for sale, the impairment loss would be the adjustment to fair value less the
F-10
RESOURCE REAL ESTATE OPPORTUNITY REIT, INC.
NOTES TO CONSOLIDATED FINANCIAL STATEMENTS – (Continued)
DECEMBER 31, 2017
estimated cost to dispose of the asset. There were no impairment losses recorded on long lived assets during the years ended December 31, 2017, 2016 and 2015.
Loans Held for Investment, Net
The Company records acquired performing loans held for investment at cost and reviews them for potential impairment at each balance sheet date. The Company considers a loan to be impaired if one of two conditions exists. The first condition is if, based on current information and events, management believes it is probable that the Company will be unable to collect all amounts due according to the contractual terms of the loan agreement. The second condition is if the loan is deemed to be a troubled-debt restructuring (“TDR”) where a concession has been given to a borrower in financial difficulty. A TDR may not have an associated specific loan loss allowance if the principal and interest amount is considered recoverable based on current market conditions, expected collateral performance and/or guarantees made by the borrowers.
The amount of impairment, if any, is measured by comparing the recorded amount of the loan to the present value of the expected cash flows or, as a practical expedient, the fair value of the collateral. If a loan is deemed to be impaired, the Company records a reserve for loan losses through a charge to income for any shortfall.
Interest income from performing loans held for investment is recognized based on the contractual terms of the loan agreement. Fees related to any buy down of the interest rate are deferred as prepaid interest income and amortized over the term of the loan as an adjustment to interest income. The initial investment made in a purchased performing loan includes the amount paid to the seller plus fees. The initial investment frequently differs from the related loan’s principal amount at the date of the purchase. The difference is recognized as an adjustment of the yield over the life of the loan. Closing costs related to the purchase of a performing loan held for investment are amortized over the term of the loan and accreted as an adjustment to interest income.
The Company may acquire real estate loans at a discount due to the credit quality of such loans and the respective borrowers under such loans. Revenues from these loans are recorded under the effective interest method. Under this method, an effective interest rate (“EIR”) is applied to the cost basis of the real estate loan held for investment. The EIR that is calculated when the loan held for investment is acquired remains constant and is the basis for subsequent impairment testing and income recognition. However, if the amount and timing of future cash collections are not reasonably estimable, the Company accounts for the real estate receivable on the cost recovery method. Under the cost recovery method of accounting, no income is recognized until the basis of the loan held for investment has been fully recovered.
Preferred Equity Investment
The Company recorded its preferred equity investment, included in other investments on the consolidated balance sheets, at amortized cost. Investments carried at amortized cost were evaluated for impairment at each reporting date. When an investment was impaired and that impairment was considered other than temporary, the amount of the loss accrual was calculated by comparing the carrying amount of the investment to its estimated fair value. This investment was repaid in full on June 6, 2016 (See Note 6).
Dividend income was recognized when earned based on the contractual terms of the preferred equity agreement.
Allocation of the Purchase Price of Acquired and Foreclosed Assets
The company records the acquisition of real properties as business combinations. The cost of rental properties acquired directly as fee interests and through foreclosing on a loan are allocated to net tangible and intangible assets based on their relative fair values. The Company allocates the purchase price of properties to acquired tangible assets, consisting of land, buildings, fixtures and improvements, and to identified intangible lease assets and liabilities, consisting of the value of above-market and below-market leases, as applicable, the value of in-place leases and the value of tenant relationships. Fair value estimates are based on information obtained from a number of sources, including information obtained about each property as a result of pre-acquisition due diligence, marketing and leasing activities. In addition, the Company may obtain independent appraisal reports. The information in the appraisal reports along with the aforementioned information available to the Company's management is used in allocating the purchase price. The independent appraisers have no involvement in management's allocation decisions other than providing market information.
In allocating the purchase price, management also includes real estate taxes, insurance and other operating expenses and estimates of lost rentals at market rates during the expected lease-up period. Management also estimates costs to execute similar leases, including leasing commissions and legal and other related expenses, to the extent that such costs have not already been incurred in connection with a new lease origination as part of the transaction.
F-11
RESOURCE REAL ESTATE OPPORTUNITY REIT, INC.
NOTES TO CONSOLIDATED FINANCIAL STATEMENTS – (Continued)
DECEMBER 31, 2017
The Company records above-market and below-market in-place lease values for acquired properties based on the present value (using an interest rate that reflects the risks associated with the leases acquired) of the difference between (i) the contractual amounts to be paid pursuant to the in-place leases and (ii) management’s estimate of fair market lease rates for the corresponding in-place leases, measured over a period equal to the remaining non-cancelable term of the lease. The Company amortizes any capitalized above-market or below-market lease values as an increase or reduction to rental income over the remaining non-cancelable terms of the respective leases.
The Company measures the aggregate value of other intangible assets acquired based on the difference between (i) the property valued with existing in-place leases adjusted to market rental rates and (ii) the property valued as if it were vacant. Management’s estimates of value are made using methods similar to those used by independent appraisers (e.g., discounted cash flow analysis). Factors to be considered by management in its analysis include an estimate of carrying costs during hypothetical expected lease-up periods considering current market conditions and costs to execute similar leases.
The total amount of other intangible assets acquired is further allocated to customer relationship intangible values based on management’s evaluation of the specific characteristics of each tenant’s lease and the Company’s overall relationship with that respective tenant. Characteristics to be considered by management in allocating these values include the nature and extent of the Company’s existing relationships with the tenant, the tenant’s credit quality and expectations of lease renewals (including those existing under the terms of the lease agreement), among other factors.
The Company amortizes the value of in-place leases to expense over the average remaining term of the respective leases. The value of customer relationship intangibles are amortized to expense over the initial term and any renewal periods in the respective leases, but in no event will the amortization periods for the intangible assets exceed the remaining depreciable life of the building. Should a tenant terminate its lease, the unamortized portion of the in-place lease value and customer relationship intangibles associated with that tenant would be charged to expense in that period.
The determination of the fair value of assets and liabilities acquired requires the use of significant assumptions with regard to current market rental rates, discount rates and other variables. The use of inappropriate estimates would result in an incorrect assessment of the purchase price allocations, which could impact the amount of the Company’s reported net income. Initial purchase price allocations are subject to change until all information is finalized, which is generally within one year of the acquisition date.
Goodwill
The Company records the excess of the cost of an acquired entity over the difference between the amounts assigned to assets acquired (including identified intangible assets) and liabilities assumed as goodwill. Goodwill is not amortized but is tested for impairment at a level of reporting referred to as a reporting unit during the fourth quarter of each calendar year, or more frequently if events or changes in circumstances indicate that the asset might be impaired. The Company tested goodwill as of December 31, 2017 and found no indications of impairment.
Revenue Recognition
The Company recognizes minimum rent, including rental abatements and contractual fixed increases attributable to operating leases, on a straight-line basis over the term of the related lease and includes amounts expected to be received in later years.
The future minimum rental payments to be received from noncancelable operating leases for residential rental properties are $58.2 million and $95,000 for the years ending December 31, 2018 and 2019, respectively, and none thereafter. The future minimum rental payments to be received from noncancelable operating leases for commercial rental properties and antenna rentals are $440,000, $389,000, $318,000, $241,000, and $114,000 for the years ending December 31, 2018, 2019, 2020, 2021, and 2022, respectively, and none thereafter.
Revenue is primarily derived from the rental of residential housing units, however, included within rental income is other income such as pet fees, parking fees, and late fees, as well as property operating expense reimbursements due from tenants for common area maintenance, real estate taxes and other recoverable costs. The Company records the ancillary charges in the period they are earned or received and records the reimbursements in the period in which the related expenses are incurred. Total other income included within rental income was $12.6 million, $10.8 million and $11.7 million for the years ended December 31, 2017, 2016 and 2015, respectively.
F-12
RESOURCE REAL ESTATE OPPORTUNITY REIT, INC.
NOTES TO CONSOLIDATED FINANCIAL STATEMENTS – (Continued)
DECEMBER 31, 2017
Tenant Receivables
Tenant receivables are stated in the financial statements at amounts due from tenants net of an allowance for uncollectible receivables. Payment terms vary and receivables outstanding longer than the payment terms are considered past due. The Company determines its allowance by considering a number of factors, including the length of time receivables are past due, security deposits held, the Company’s previous loss history, the tenants’ current ability to pay their obligations to the Company, the condition of the general economy and the industry as a whole. The Company writes off receivables when they become uncollectible. At December 31, 2017 and 2016, there were allowances for uncollectible receivables of $149,300 and $5,200, respectively.
Income Taxes
The Company elected to be taxed as a REIT commencing with its taxable year ended December 31, 2010. To maintain its REIT qualification for U.S. federal income tax purposes, the Company is generally required to distribute at least 90% of its taxable net income (excluding net capital gains) to its stockholders as well as comply with other requirements, including certain asset, income and stock ownership tests. As a REIT, the Company is not subject to federal corporate income tax to the extent that it distributes 100% of its REIT taxable income each year. If the Company fails to qualify as a REIT, and does not qualify for certain statutory relief provisions, it is subject to U.S. federal, state and local income taxes and may be precluded from qualifying as a REIT for the subsequent four taxable years following the year in which it fails its REIT qualification. Accordingly, the Company’s failure to qualify as a REIT could have a material adverse impact on its results of operations and amounts available for distribution to its stockholders.
The dividends-paid deduction of a REIT for qualifying dividends to its stockholders is computed using the Company’s taxable income as opposed to net income reported on the financial statements. Generally, taxable income differs from net income reported on the financial statements because the determination of taxable income is based on tax provisions and not financial accounting principles.
The Company may elect to treat any of its subsidiaries as taxable REIT subsidiaries (“TRSs”). In general, the Company’s TRSs may hold assets and engage in activities that the Company cannot hold or engage in directly and generally may engage in any real estate or non-real estate-related business. A TRS is subject to U.S. federal, state and local corporate income taxes. While a TRS may generate net income, a TRS can declare dividends to the Company which will be included in the Company's taxable income and necessitate a distribution to its stockholders. Conversely, if the Company retains earnings at a TRS level, no distribution is required and the Company can increase book equity of the consolidated entity. As of December 31, 2017 and 2016, the Company had no TRSs.
The Company evaluates the benefits from tax positions taken or expected to be taken in its tax return. Only the largest amount of benefits from tax positions that will more likely than not be sustainable upon examination are recognized by the Company. The Company does not have any unrecognized tax benefits, nor interest and penalties, recorded in its consolidated financial statements and does not anticipate significant adjustments to the total amount of unrecognized tax benefits within the next 12 months.
The Company is subject to examination by the U.S. Internal Revenue Service and by the taxing authorities in other states in which the Company has significant business operations. The Company is not currently undergoing any examinations by taxing authorities. The Company is not subject to IRS examination for tax return years 2013 and prior.
The Tax Cuts and Jobs Act ("TCJA") was signed into law on December 22, 2017. The TCJA makes significant changes to the U.S. federal income tax rules for taxation of individuals and corporations (including REITs), generally effective for taxable years beginning after December 31, 2017. The Company is continuing to evaluate this legislation but does not expect it to have a significant impact.
F-13
RESOURCE REAL ESTATE OPPORTUNITY REIT, INC.
NOTES TO CONSOLIDATED FINANCIAL STATEMENTS – (Continued)
DECEMBER 31, 2017
Earnings Per Share
Basic earnings per share are calculated on the basis of the weighted-average number of common shares outstanding during the year. Basic earnings per share are computed by dividing income available to common stockholders by the weighted-average common shares outstanding during the period. Diluted earnings per share take into account the potential dilution that could occur if securities or other contracts to issue common stock were exercised and converted to common stock. None of the 49,995 shares of convertible stock (discussed in Note 15) are included in the diluted earnings per share calculations because the necessary conditions for conversion have not been satisfied as of December 31, 2017 (were such date to represent the end of the contingency period). For the purposes of calculating earnings per share, all common shares and per common share information in the financial statements have been adjusted retroactively for the effect of seven 1.5% stock distributions, two 0.75% stock distributions, one 0.585% stock distribution and two 0.5% stock distributions issued to stockholders. Common stock shares issued on the consolidated balance sheets have also been adjusted retroactively for the effect of these 12 distributions.
Reclassifications
Certain amounts in the prior year financial statements have been reclassified to conform to the current-year presentation. The impact of the reclassifications made to prior year amounts are not material and did not affect net income (loss).
Adoption of New Accounting Standards
Accounting Standards Issued But Not Yet Effective
In May 2014, FASB issued ASU No. 2014-09, “Revenue from Contracts with Customers” ("ASU No. 2014-09"), which will replace most existing revenue recognition guidance in GAAP. Under the new standard, revenue is recognized when persuasive evidence of an arrangement exists, delivery has occurred, the fee is fixed or determinable, and collectability is probable. ASU No. 2014-09 requires additional disclosure about the nature, amount, timing and uncertainty of revenue and cash flows arising from customer contracts, including significant judgments and changes in judgments. The Company will adopt ASU 2014-09 as of January 1, 2018 using the modified retrospective approach. The majority of the Company’s revenue is derived from residential rental income and other lease income, which are scoped out from this standard and included in the current lease accounting framework, and will be accounted for under ASU No. 2016-02, Leases, as discussed below. Revenue streams that are in the scope of the new standards include (but are not limited to) administrative and late fees and revenue sharing arrangements of cable income from contracts with cable providers at the Company's properties. Due to the nature and timing of the Company’s identified revenue streams as of December 31, 2017, the Company does not anticipate the adoption of the new standards will have a material impact on its financial position or results of operations.
In February 2016, FASB issued ASU No. 2016-02, "Leases" ("ASU No. 2016-02"), which is intended to improve financial reporting about leasing transactions and requires organizations that lease assets to recognize on the balance sheet the assets and liabilities for the rights and obligations created by those leases. In September 2017, the FASB issued ASU 2017-13, "Revenue Recognition (Topic 605), Revenue from Contracts with Customers (Topic 606), Leases (Topic 840), and Leases (Topic 842)", which provides additional implementation guidance on the previously issued ASU No. 2016-02 Leases (Topic 842). ASU No. 2016-02 is effective for fiscal years, and interim periods within those fiscal years, beginning after December 15, 2018. The Company is continuing to evaluate this guidance, however, the Company expects that its operating leases where it is the lessor will be accounted for on its balance sheet similar to its current accounting with the underlying leased asset recognized as real estate. The Company expects that executory costs and certain other non-lease components will need to be accounted for separately from the lease component of the lease with the lease component continuing to be recognized on a straight-line basis over the lease term and the executory costs and certain other non-lease components being accounted for under the new revenue recognition guidance in ASU 2014-09. For leases in which the Company is the lessee, primarily consisting of office equipment leases, the Company expects to recognize a right-of-use asset and a lease liability equal to the present value of the minimum lease payments with rental payments being applied to the lease liability and to interest expense and the right-of-use asset being amortized to expense on a straight-line basis over the term of the lease.
In June 2016, FASB issued ASU No. 2016-13, “Financial Instruments - Credit Losses”, which requires measurement and recognition of expected credit losses for financial assets held. ASU No. 2016-13 will be effective for the Company beginning January 1, 2019. The Company is evaluating this guidance; however, it does not expect the adoption of ASU No. 2016-13 to have a significant impact on its consolidated financial statements.
In August 2016, FASB issued ASU No. 2016-15, "Classification of Certain Cash Receipts and Cash Payments", which addresses eight specific cash flow issues with the objective of reducing existing diversity in practice. The guidance is effective for
F-14
RESOURCE REAL ESTATE OPPORTUNITY REIT, INC.
NOTES TO CONSOLIDATED FINANCIAL STATEMENTS – (Continued)
DECEMBER 31, 2017
the Company beginning January 1, 2018. Early application is permitted. The adoption of the new requirements is not expected to have a material impact on the reporting of the Company's consolidated cash flows.
In November 2016, the FASB issued ASU No. 2016-18, “Statement of Cash Flows (Topic 230): Restricted Cash” (“ASU No. 2016-18”), which provides guidance on the classification of restricted cash in the statement of cash flows. ASU No. 2016-18 is effective for the Company's fiscal year beginning January 1, 2018, and the Company does not expect the adoption of ASU No. 2016-18 to have a material effect on the Company's consolidated financial statements and disclosures.
In January 2017, FASB issued ASU No. 2017-01, "Business Combinations (Topic 850): Clarifying the Definition of Business", which clarifies the definition of a business with the objective of adding guidance to assist entities with evaluating whether transactions should be accounted for as acquisitions (or disposals) of businesses. ASU No. 2017-01 is effective for the Company beginning January 1, 2018 but early adoption is allowed. The Company believes all future acquisitions will be accounted for as asset acquisitions, not business acquisitions.
In January 2017, FASB issued ASU No. 2017-04, "Intangibles - Goodwill and Other (Topic 350): Simplifying the Accounting for Goodwill Impairment", which alters the current goodwill impairment testing procedures to eliminate Step 2. Step 2 required that, if the carrying amount of a reporting unit exceeded its fair value, the implied fair value of the goodwill must be compared to the carrying amount in order to determine impairment. ASU No. 2017-04 will be effective for the Company beginning December 15, 2019. Early application is permitted. The Company is evaluating this guidance and assessing the impact of this guidance on its consolidated financial statements.
In August 2017, FASB issued ASU No. 2017-12, "Derivatives and Hedging (Topic 815): Targeted Improvements to Accounting for Hedging Activities", which expands and refines hedge accounting for both financial and non-financial risk components, aligns the recognition and presentation of the effects of hedging instruments and hedge items in the financial statements, and includes certain targeted improvements to ease the application of current guidance related to the assessment of hedge effectiveness. The update to the standard is effective for the Company on January 1, 2019, with early adoption permitted in any interim period. The Company is continuing to evaluate this guidance and assessing the impact of this guidance on its consolidated financial statements.
NOTE 3 – SUPPLEMENTAL CASH FLOW INFORMATION
The following table presents the Company's supplemental cash flow information (in thousands):
For the Years Ended | |||||||||||
December 31, | |||||||||||
2017 | 2016 | 2015 | |||||||||
Non-cash financing and investing activities: | |||||||||||
Stock issued from distribution reinvestment plan | $ | 27,114 | $ | 28,497 | $ | 28,959 | |||||
Deferred financing costs and escrow deposits funded directly by mortgage notes and credit facility | 2,145 | 2,619 | 11,167 | ||||||||
Accrual for construction in progress | 1,346 | 1,343 | 896 | ||||||||
Non-cash activity related to sales: | |||||||||||
Deconsolidation of subsidiary and removal of related mortgage notes payable and noncontrolling interest | — | 35,152 | — | ||||||||
Mortgage notes payable settled directly with proceeds from sale of rental property | 26,976 | 55,720 | — | ||||||||
Non-cash activity related to acquisitions: | |||||||||||
Mortgage notes payable and other liabilities assumed in acquisition of rental property | — | — | 40,284 | ||||||||
Mortgage notes payable used to acquire real property | 118,705 | — | — | ||||||||
Cash paid during the period for: | |||||||||||
Interest | $ | 26,458 | $ | 20,297 | $ | 20,752 | |||||
F-15
RESOURCE REAL ESTATE OPPORTUNITY REIT, INC.
NOTES TO CONSOLIDATED FINANCIAL STATEMENTS – (Continued)
DECEMBER 31, 2017
NOTE 4 – RESTRICTED CASH
Restricted cash represents escrow deposits with lenders to be used to pay real estate taxes, insurance, and capital improvements. The following table presents a summary of the components of the Company's restricted cash (in thousands):
December 31, | |||||||
2017 | 2016 | ||||||
Real estate taxes | $ | 8,877 | $ | 6,853 | |||
Insurance | 1,995 | 1,854 | |||||
Capital improvements | 2,530 | 1,570 | |||||
Total | $ | 13,401 | $ | 10,277 | |||
In addition, the Company had unrestricted cash designated for capital expenditures of approximately $86.9 million and $101.6 million as of December 31, 2017 and 2016, respectively.
NOTE 5 – RENTAL PROPERTIES, NET
The following table presents the Company’s investments in rental properties (in thousands):
December 31, | |||||||
2017 | 2016 | ||||||
Land | $ | 196,765 | $ | 176,418 | |||
Building and improvements | 905,739 | 795,665 | |||||
Furniture, fixtures and equipment | 37,796 | 32,198 | |||||
Construction in progress | 6,297 | 5,983 | |||||
1,146,597 | 1,010,264 | ||||||
Less: accumulated depreciation | (147,708 | ) | (107,810 | ) | |||
$ | 998,889 | $ | 902,454 | ||||
Depreciation expense for the years ended December 31, 2017, 2016, and 2015 was $48.7 million, $44.0 million, and $41.9 million, respectively.
NOTE 6 − OTHER INVESTMENTS
Preferred equity investment:
On November 12, 2014, the Company, through its wholly owned subsidiary, RRE Spring Hill Holdings, LLC, made a $3.5 million preferred equity investment in Spring Hill Investors Limited Partner, LLC (the “Investment Vehicle”) and became the Preferred Member. An unaffiliated limited liability company, Presidium AMC Spring Hill Venture, LLC, owned the common equity and acted as the managing member of the Investment Vehicle. In October 2015 and March 2016, the Company increased its investment by $800,000.
The Company was paid a dividend equal to 12% of the total amount invested, of which 7% was paid monthly and the remaining amount was accrued. This preferred equity investment, including accrued interest, was repaid in full on June 6, 2016. In conjunction with the payoff, the Company received an exit fee of $230,000, which is included in interest and dividend income in the Company's consolidated statement of operations.
Loan held for investment, net:
In 2011, the Company purchased, at a discount, one performing promissory note (the "Trail Ridge Note”), which is secured by a first priority mortgage on a multifamily rental apartment community. The contract purchase price for the Trail Ridge Note
F-16
RESOURCE REAL ESTATE OPPORTUNITY REIT, INC.
NOTES TO CONSOLIDATED FINANCIAL STATEMENTS – (Continued)
DECEMBER 31, 2017
was $700,000, excluding closing costs. As of both December 31, 2017 and December 31, 2016, the Trail Ridge Note was both current and performing.
In 2011, the Company also purchased, at a discount, a non-performing promissory note (the "Heatherwood Note”), which was secured by a first priority mortgage on multifamily rental apartment communities. The contract purchase price for the Heatherwood Note was $800,000, excluding closing costs. On August 18, 2011, the Company was the successful bidder at a foreclosure sale of the property collateralizing the Heatherwood Note. Possession of the Heatherwood Apartments was obtained in February 2012 and the property was subsequently sold in April 2013. On April 18, 2013, in connection with the sale of the Heatherwood Apartments, the Company originated an $800,000 mortgage loan (the "Heatherwood Sale Note") to the purchaser of the Heatherwood Apartments on the same date. In May 2015, the Company agreed to accept $583,000 from the borrower and apply $58,000 of escrow balances in full satisfaction of the loan. As such, the Company recorded a provision for loan loss of $130,000 during the year ended December 31, 2015 related to this payoff.
The following table presents details of the balance and terms of the Trail Ridge Note, the Company's remaining loan held for investment at December 31, 2017 and 2016 (in thousands):
December 31, | |||||||
2017 | 2016 | ||||||
Unpaid principal balance | $ | 934 | $ | 960 | |||
Unamortized discount and acquisition costs | (152 | ) | (191 | ) | |||
Net book value | $ | 782 | $ | 769 | |||
Maturity date | 10/28/2021 | ||||||
Interest rate | 7.5 | % | |||||
Average monthly payment | $ | 8 | |||||
The Company has evaluated the loan for impairment and determined that, as of December 31, 2017, it was not impaired. There were no allowances for credit losses as of both December 31, 2017 and 2016. There were no charge-offs for the years ended December 31, 2017 and 2016.
NOTE 7 – ACQUISITIONS
Real Estate Investments
As of December 31, 2017, the Company owned 30 properties, including five of the 11 properties purchased on January 28, 2014 as part of the Paladin Realty Income Properties, Inc. (“Paladin”) portfolio acquisition. The Company estimated the fair values of certain of the acquired assets and liabilities based on preliminary valuations at the date of purchase. In order to finalize the fair values of the acquired assets and liabilities, a third-party appraisal was obtained for each property acquired. The Company has up to 12 months from the date of acquisition to finalize the valuation for each property. All valuations have been finalized as of December 31, 2017.
The table below summarizes the Company's wholly-owned acquisitions during the year ended December 31, 2017 and the respective fair values assigned (dollars in thousands):
Fair Value Assigned | ||||||||||||||||||||||||||||||||
Multifamily Community Name | City and State | Date of Acquisition | Contractual Purchase Price (1) | Land | Building and Improvements | Furniture, Fixtures and Equipment | Intangible Assets | Other Assets | Liabilities | |||||||||||||||||||||||
Courtney Meadows Apartments | Jacksonville, FL | 12/20/2017 | $ | 41,400 | $ | 6,159 | $ | 33,720 | $ | 629 | $ | 892 | $ | 8 | $ | (58 | ) | |||||||||||||||
Terraces at Lake Mary | Lake Mary, GL | 8/31/2017 | $ | 44,100 | $ | 5,402 | $ | 37,297 | $ | 433 | $ | 968 | $ | — | $ | (423 | ) | |||||||||||||||
Green Trails Apartment Homes | Lisle, IL | 5/31/2017 | $ | 78,000 | $ | 14,727 | $ | 61,283 | $ | 1,117 | $ | 1,695 | $ | 14 | $ | (898 | ) | |||||||||||||||
F-17
RESOURCE REAL ESTATE OPPORTUNITY REIT, INC.
NOTES TO CONSOLIDATED FINANCIAL STATEMENTS – (Continued)
DECEMBER 31, 2017
(1) | Contractual purchase price excludes closing costs, acquisition expenses, and other immaterial settlement date adjustments and pro-rations. |
Acquisitions
The Company acquired three properties during the year ended December 31, 2017. The tables below present the total revenues, net loss, and acquisition costs of the Company's acquisitions during the years ended December 31, 2017, 2016, and 2015 (dollars in thousands):
Multifamily Community | Total Revenues | Net Loss | Acquisition Costs | |||||||||||
2017 Acquisitions: | ||||||||||||||
Green Trails Apartment Homes | $ | 4,128 | $ | (1,920 | ) | $ | (1,774 | ) | ||||||
Terraces at Lake Mary | 1,394 | (1,424 | ) | (1,290 | ) | |||||||||
Courtney Meadows Apartments | 103 | (879 | ) | (1,217 | ) | |||||||||
Various properties | — | — | (188 | ) | (1 | ) | ||||||||
$ | 5,625 | $ | (4,223 | ) | $ | (4,469 | ) | |||||||
Multifamily Community | Total Revenues | Net Loss | Acquisition Costs | |||||||||||
2016 Acquisitions: | ||||||||||||||
Providence in the Park | $ | 193 | $ | (781 | ) | $ | (1,509 | ) | ||||||
Various properties | — | — | (73 | ) | (1 | ) | ||||||||
$ | 193 | $ | (781 | ) | $ | (1,582 | ) | |||||||
Multifamily Community | Total Revenues | Net Loss | Acquisition Costs | |||||||||
2015 Acquisitions: | ||||||||||||
South Lamar Village | $ | 2,086 | $ | (1,580 | ) | $ | (692 | ) | ||||
Heritage Pointe | 3,019 | (2,173 | ) | (1,005 | ) | |||||||
Yorba Linda | 4,584 | (3,405 | ) | (2,761 | ) | |||||||
Point Bonita Apartment Homes | 2,431 | (2,144 | ) | (1,353 | ) | |||||||
$ | 12,120 | $ | (9,302 | ) | $ | (5,811 | ) | |||||
(1) | Acquisition fees paid related to additional investments in properties to fund additional capital reserves. |
F-18
RESOURCE REAL ESTATE OPPORTUNITY REIT, INC.
NOTES TO CONSOLIDATED FINANCIAL STATEMENTS – (Continued)
DECEMBER 31, 2017
NOTE 8 – DISPOSITION OF PROPERTIES AND DECONSOLIDATION OF INTERESTS
The following table presents details of our disposition and deconsolidation activity during the years ended December 31, 2017, 2016, and 2015 (in thousands):
Multifamily Community | Location | Sale Date | Contract Sales price | Net Gains on Dispositions of Properties and Joint Venture Interests | Revenues Attributable to Properties Sold | Net Income Attributable to Properties Sold | ||||||||||||||
2017 Dispositions: | ||||||||||||||||||||
Chisholm Place | Plano, Texas | May 10, 2017 | $ | 21,250 | $ | 6,922 | $ | 823 | $ | 6,657 | ||||||||||
Mosaic | Oklahoma City, Oklahoma | May 12, 2017 | 6,100 | 1,513 | 473 | 1,441 | ||||||||||||||
Deerfield | Hermantown, Minnesota | August 16, 2017 | 23,600 | 11,035 | 1,653 | 11,037 | ||||||||||||||
Stone Ridge | Columbia, South Carolina | September 27, 2017 | 10,534 | 3,265 | 1,291 | 3,060 | ||||||||||||||
$ | 61,484 | $ | 22,735 | $ | 4,240 | $ | 22,195 | |||||||||||||
2016 Dispositions: | ||||||||||||||||||||
Conifer Place (1) | Norcross, Georgia | January 27, 2016 | $ | 42,500 | $ | 9,897 | $ | 365 | $ | 9,942 | ||||||||||
Champion Farms | Louisville, Kentucky | January 29, 2016 | 7,590 | 1,066 | 220 | 1,125 | ||||||||||||||
The Ivy at Clear Creek | Houston, Texas | February 17, 2016 | 19,400 | 6,792 | 386 | 6,629 | ||||||||||||||
Affinity at Winter Park | Winter Park, Florida | June 9, 2016 | 17,500 | 5,605 | 1,010 | 5,757 | ||||||||||||||
Fieldstone | Woodland, Ohio | June 30, 2016 | 7,514 | 4,096 | 1,548 | 4,325 | ||||||||||||||
The Nesbit Palisades | Alpharetta, Georgia | July 8, 2016 | 45,500 | 17,601 | 2,615 | 17,739 | ||||||||||||||
$ | 140,004 | $ | 45,057 | $ | 6,144 | $ | 45,517 | |||||||||||||
2015 Dispositions: | ||||||||||||||||||||
The Alcove Apartments | Houston, Texas | January 26, 2015 | $ | 11,050 | $ | 3,784 | $ | 199 | $ | 3,819 | ||||||||||
107th Avenue Apartments | Omaha, Nebraska | January 29, 2015 | 250 | 50 | 3 | 50 | ||||||||||||||
The Redford Apartments | Houston, Texas | February 27, 2015 | 32,959 | 15,303 | 1,274 | 15,652 | ||||||||||||||
Cityside Apartments | Houston, Texas | March 2, 2015 | 24,500 | 10,028 | 701 | 10,290 | ||||||||||||||
One Hundred Chevy Chase | Lexington, Kentucky | June 30, 2015 | 13,500 | 4,386 | 828 | 4,027 | ||||||||||||||
The Reserve at Mt. Moriah | Memphis, Tennessee | September 18, 2015 | 5,425 | 2,490 | 1,135 | 2,202 | ||||||||||||||
$ | 87,684 | $ | 36,041 | $ | 4,140 | $ | 36,040 | |||||||||||||
(1) | On January 27, 2016, the Company and its joint venture partner sold Conifer Place, which resulted in the deconsolidation of the entity as of January 27, 2016. Net income (loss) attributable to properties sold presented includes $6.3 million attributable to noncontrolling interests. |
NOTE 9 – IDENTIFIED INTANGIBLE ASSETS, NET
Identified intangible assets, net, relate to in-place apartment unit rental and antennae leases. The value of the acquired in-place leases totaled $1.8 million and $1.9 million as of December 31, 2017 and 2016, respectively, net of accumulated amortization of $26.6 million and $24.3 million, respectively. The weighted-average remaining life of the acquired apartment unit rental leases is five months and seven months as of December 31, 2017 and 2016, respectively. Expected amortization for the antennae leases at the Vista Apartment Homes for the years ended December 31, 2018, 2019, 2020, and 2021 are $14,000, $13,000, $9,000, and $5,000, respectively, and none thereafter. Amortization of the rental and antennae leases for the years ended December 31, 2017, 2016, and 2015 was $3.6 million, $228,000, and $6.4 million, respectively.
F-19
RESOURCE REAL ESTATE OPPORTUNITY REIT, INC.
NOTES TO CONSOLIDATED FINANCIAL STATEMENTS – (Continued)
DECEMBER 31, 2017
The following table presents the Company's expected amortization for the rental and antennae leases for the next five years ending December 31, and thereafter (in thousands):
2018 | $ | 1,770 | |
2019 | 13 | ||
2020 | 9 | ||
2021 | 4 | ||
Thereafter | — | ||
$ | 1,796 | ||
NOTE 10 – GOODWILL
The following table presents a rollforward of the Company's activity in goodwill for the years ended December 31, 2017 and 2016 (in thousands):
Balance, January 1, 2016 | $ | 1,231 | |
Activity - 2016: Sale of Conifer Place, Champion Farms, and Fieldstone | (520 | ) | |
Balance, December 31, 2016 | 711 | ||
Activity - 2017: Sale of Stone Ridge | (41 | ) | |
Balance, December 31, 2017 | $ | 670 | |
F-20
RESOURCE REAL ESTATE OPPORTUNITY REIT, INC.
NOTES TO CONSOLIDATED FINANCIAL STATEMENTS – (Continued)
DECEMBER 31, 2017
NOTE 11 – MORTGAGE NOTES PAYABLE, NET
The following table presents a summary of the Company's mortgage notes payable, net (in thousands):
December 31, 2017 | December 31, 2016 | |||||||||||||||||||||||||||||||
Outstanding borrowings | Premium (Discount) | Deferred finance costs, net | Carrying Value | Outstanding borrowings | Premium (Discount) | Deferred finance costs, net | Carrying Value | |||||||||||||||||||||||||
Collateral | ||||||||||||||||||||||||||||||||
Vista Apartment Homes | $ | 14,896 | $ | — | $ | (140 | ) | $ | 14,756 | $ | 15,225 | $ | — | $ | (178 | ) | $ | 15,047 | ||||||||||||||
Cannery Lofts | 13,100 | — | (165 | ) | 12,935 | 13,100 | — | (197 | ) | 12,903 | ||||||||||||||||||||||
Deerfield | — | — | — | — | 10,359 | — | (125 | ) | 10,234 | |||||||||||||||||||||||
Trailpoint at the Woodlands | 18,368 | — | (188 | ) | 18,180 | 18,690 | — | (222 | ) | 18,468 | ||||||||||||||||||||||
Verona Apartment Homes | 32,970 | — | (475 | ) | 32,495 | 32,970 | — | (532 | ) | 32,438 | ||||||||||||||||||||||
Skyview Apartment Homes | 28,400 | — | (413 | ) | 27,987 | 28,400 | — | (462 | ) | 27,938 | ||||||||||||||||||||||
Maxwell Townhomes | 13,342 | — | (109 | ) | 13,233 | 13,602 | — | (137 | ) | 13,465 | ||||||||||||||||||||||
Pinehurst | 7,339 | — | (128 | ) | 7,211 | 7,350 | — | (154 | ) | 7,196 | ||||||||||||||||||||||
Pheasant Run | 6,250 | — | — | 6,250 | 6,250 | 43 | (9 | ) | 6,284 | |||||||||||||||||||||||
Retreat of Shawnee | 12,682 | 7 | (2 | ) | 12,687 | 12,893 | 85 | (23 | ) | 12,955 | ||||||||||||||||||||||
Evergreen at Coursey Place | 26,639 | 77 | (75 | ) | 26,641 | 27,107 | 100 | (96 | ) | 27,111 | ||||||||||||||||||||||
Pines of York | 14,717 | (235 | ) | (44 | ) | 14,438 | 14,999 | (299 | ) | (56 | ) | 14,644 | ||||||||||||||||||||
Estates at Johns Creek | 48,603 | — | (286 | ) | 48,317 | 49,596 | — | (405 | ) | 49,191 | ||||||||||||||||||||||
Chisholm Place | — | — | — | — | 11,587 | — | (143 | ) | 11,444 | |||||||||||||||||||||||
Perimeter Circle | 16,923 | — | (84 | ) | 16,839 | 17,298 | — | (143 | ) | 17,155 | ||||||||||||||||||||||
Perimeter 5550 | 13,356 | — | (70 | ) | 13,286 | 13,651 | — | (118 | ) | 13,533 | ||||||||||||||||||||||
Aston at Cinco Ranch | 22,942 | — | (210 | ) | 22,732 | 23,367 | — | (268 | ) | 23,099 | ||||||||||||||||||||||
Sunset Ridge 1 | 19,254 | 189 | (150 | ) | 19,293 | 19,699 | 259 | (205 | ) | 19,753 | ||||||||||||||||||||||
Sunset Ridge 2 | 2,890 | 26 | (19 | ) | 2,897 | 2,948 | 35 | (26 | ) | 2,957 | ||||||||||||||||||||||
Calloway at Las Colinas | 34,396 | — | (241 | ) | 34,155 | 35,083 | — | (306 | ) | 34,777 | ||||||||||||||||||||||
South Lamar Village | 12,177 | — | (80 | ) | 12,097 | 12,435 | — | (131 | ) | 12,304 | ||||||||||||||||||||||
Heritage Pointe | 25,912 | — | (284 | ) | 25,628 | 26,280 | — | (327 | ) | 25,953 | ||||||||||||||||||||||
Yorba Linda | 67,500 | — | (461 | ) | 67,039 | 67,500 | — | (661 | ) | 66,839 | ||||||||||||||||||||||
Point Bonita Apartment Homes | 26,525 | 1,660 | (285 | ) | 27,900 | 26,907 | 1,966 | (338 | ) | 28,535 | ||||||||||||||||||||||
Stone Ridge | — | — | — | — | 5,227 | — | (130 | ) | 5,097 | |||||||||||||||||||||||
The Westside Apartments | 36,820 | — | (390 | ) | 36,430 | 36,820 | — | (448 | ) | 36,372 | ||||||||||||||||||||||
Tech Center Square | 12,141 | — | (164 | ) | 11,977 | 12,375 | — | (196 | ) | 12,179 | ||||||||||||||||||||||
Williamsburg | 53,995 | — | (706 | ) | 53,289 | 53,995 | — | (828 | ) | 53,167 | ||||||||||||||||||||||
Retreat at Rocky Ridge | 11,375 | — | (223 | ) | 11,152 | 11,375 | — | (261 | ) | 11,114 | ||||||||||||||||||||||
Providence in the Park | 47,000 | — | (524 | ) | 46,476 | — | — | — | — | |||||||||||||||||||||||
Green Trails Apartment Homes | 61,500 | — | (667 | ) | 60,833 | — | — | — | — | |||||||||||||||||||||||
Meridian Pointe | 39,500 | — | (588 | ) | 38,912 | — | — | — | — | |||||||||||||||||||||||
Terraces at Lake Mary | 32,250 | — | (377 | ) | 31,873 | — | — | — | — | |||||||||||||||||||||||
Courtney Meadows Apartments | 27,100 | — | (367 | ) | 26,733 | — | — | — | — | |||||||||||||||||||||||
$ | 800,862 | $ | 1,724 | $ | (7,915 | ) | $ | 794,671 | $ | 627,088 | $ | 2,189 | $ | (7,125 | ) | $ | 622,152 | |||||||||||||||
F-21
RESOURCE REAL ESTATE OPPORTUNITY REIT, INC.
NOTES TO CONSOLIDATED FINANCIAL STATEMENTS – (Continued)
DECEMBER 31, 2017
The following table presents additional information about the Company's mortgage notes payable, net, at December 31, 2017 (in thousands, except percentages):
Collateral | Maturity Date | Annual Interest Rate | Average Monthly Debt Service | Average Monthly Escrow | ||||||||
Vista Apartment Homes | 1/1/2022 | 3.85% | (1)(5) | $ | 72 | $ | 16 | |||||
Cannery Lofts | 11/1/2023 | 4.10% | (1)(3) | 42 | 26 | |||||||
Trailpoint at the Woodlands | 11/1/2023 | 3.97% | (1)(4) | 83 | 47 | |||||||
Verona Apartment Homes | 10/1/2026 | 3.92% | (1)(3) | 100 | 40 | |||||||
Skyview Apartment Homes | 10/1/2026 | 3.92% | (1)(3) | 86 | 24 | |||||||
Maxwell Townhomes | 1/1/2022 | 4.32% | (2)(5) | 71 | 78 | |||||||
Pinehurst | 11/1/2023 | 3.98% | (1)(3) | 34 | 15 | |||||||
Pheasant Run | 10/1/2018 | 4.06% | (2)(3)(7) | 18 | 12 | |||||||
Retreat of Shawnee | 2/1/2019 | 5.58% | (2)(5)(8) | 78 | 29 | |||||||
Evergreen at Coursey Place | 8/1/2021 | 5.07% | (2)(5) | 154 | 37 | |||||||
Pines of York | 12/1/2021 | 4.46% | (2)(5) | 80 | 25 | |||||||
Estates at Johns Creek | 7/1/2020 | 3.38% | (2)(5) | 221 | 77 | |||||||
Perimeter Circle | 7/1/2019 | 3.42% | (2)(5) | 81 | 44 | |||||||
Perimeter 5550 | 7/1/2019 | 3.42% | (2)(5) | 64 | 32 | |||||||
Aston at Cinco Ranch | 10/1/2021 | 4.34% | (2)(5) | 120 | 70 | |||||||
Sunset Ridge 1 | 11/1/2020 | 4.58% | (2)(5) | 113 | 89 | |||||||
Sunset Ridge 2 | 11/1/2020 | 4.54% | (2)(5) | 16 | — | |||||||
Calloway at Las Colinas | 12/1/2021 | 3.87% | (2)(5) | 171 | 115 | |||||||
South Lamar Village | 8/1/2019 | 3.64% | (2)(5) | 59 | 57 | |||||||
Heritage Pointe | 4/1/2025 | 3.44% | (1)(4) | 114 | 43 | |||||||
Yorba Linda | 6/1/2020 | 3.31% | (1)(3) | 203 | — | |||||||
Point Bonita Apartment Homes | 10/1/2023 | 5.33% | (2)(5) | 152 | 61 | |||||||
The Westside Apartments | 9/1/2026 | 3.68% | (1)(3) | 121 | 69 | |||||||
Tech Center Square | 6/1/2023 | 4.14% | (1)(5) | 58 | 24 | |||||||
Williamsburg | 1/1/2024 | 3.94% | (1)(3) | 165 | 167 | |||||||
Retreat at Rocky Ridge | 1/1/2024 | 4.02% | (1)(3) | 36 | 23 | |||||||
Providence in the Park | 2/1/2024 | 3.86% | (1)(3)(6) | 141 | 138 | |||||||
Green Trails Apartment Homes | 6/1/2024 | 3.55% | (1)(3)(6) | 168 | 79 | |||||||
Meridian Pointe | 8/1/2024 | 3.46% | (1)(3)(6) | 104 | 56 | |||||||
Terraces at Lake Mary | 9/1/2024 | 3.47% | (1)(3)(6) | 86 | 46 | |||||||
Courtney Meadows Apartments | 1/1/2025 | 3.40% | (1)(3)(6) | 76 | 51 | |||||||
(1) Variable rate based on one-month LIBOR of 1.56425% (as of December 31, 2017) plus applicable margin.
(2) Fixed rate.
(3) Monthly interest-only payment currently required.
(4) Monthly fixed principal plus interest payment required.
(5) Fixed monthly principal and interest payment required.
(6) New debt placed during the year ended December 31, 2017.
(7) Automatic extension to October 1, 2018 occurred on October 1, 2017 at which time the fixed interest rate converted to a variable rate.
(8) Automatic extension to February 1, 2019 occurred on February 1, 2018 at which time the fixed interest rate converted to a variable rate.
Loans assumed as part of the Point Bonita Apartment Homes, South Lamar Village, Paladin (Pinehurst, Pheasant Run, Retreat of Shawnee, Evergreen at Coursey Place, Pines of York), Sunset Ridge and Maxwell Townhomes acquisitions were recorded at fair value. The premium or discount is amortized over the remaining term of the loans and included in interest expense. For the years ended December 31, 2017, 2016, and 2015, interest expense was reduced by $465,000, $485,000, and $779,000, respectively, for the amortization of the premium or discount.
F-22
RESOURCE REAL ESTATE OPPORTUNITY REIT, INC.
NOTES TO CONSOLIDATED FINANCIAL STATEMENTS – (Continued)
DECEMBER 31, 2017
All mortgage notes are collateralized by a first mortgage lien on the assets of the respective property as named in the table above. The amount outstanding on the mortgages may be prepaid in full during the entire term with a prepayment penalty on the majority of mortgages held.
The following table presents the Company's annual principal payments on outstanding borrowings for each of the next five years ending December 31, and thereafter (in thousands):
2018 | $ | 14,005 | ||
2019 | 64,215 | |||
2020 | 144,695 | |||
2021 | 102,886 | |||
2022 | 35,529 | |||
Thereafter | 439,532 | |||
$ | 800,862 | |||
The mortgage notes payable are recourse only with respect to the properties that secure the notes, subject to certain limited standard exceptions, as defined in each mortgage note. The Company has guaranteed the mortgage notes by executing a guarantee with respect to the properties. These exceptions are referred to as “carveouts.” In general, carveouts relate to damages suffered by the lender for a borrower’s failure to pay rents, insurance or condemnation proceeds to lender, failure to pay water, sewer and other public assessments or charges, failure to pay environmental compliance costs or to deliver books and records, in each case as required in the loan documents. The exceptions also require the Company to guarantee payment of audit costs, lender’s enforcement of its rights under the loan documents and payment of the loan if the borrower voluntarily files for bankruptcy or seeks reorganization, or if a related party of the borrower does so with respect to the subsidiary. The Company has also guaranteed the completion and payment of costs of completion of no less than $7.0 million of renovations to The Estates at Johns Creek by July 1, 2018. These renovations were completed as of December 31, 2017, and the guaranty was released.
The Company may borrow an additional $7.5 million on the mortgage secured by The Bryant at Yorba Linda when certain debt service coverage and loan to value criteria are met. The Bryant at Yorba Linda mortgage loan includes a net worth and liquidity covenant. The Company was in compliance with all covenants related to this loan as of December 31, 2017.
On December 20, 2013, the Company, through a wholly-owned subsidiary, entered into a loan, ("Tech Center Loan") with PNC Bank, National Association. Draws under the Tech Center Loan were secured by the assets of Tech Center Square (formerly known as the Jefferson Point Apartments). The Company provided a repayment guarantee of all interest and scheduled monthly principal payments (excluding the final payment at maturity for the outstanding balance.) The Company paid certain closing costs in connection with the Tech Center Loan including loan fees totaling $75,000. In March 2016, the Company amended the loan, removing any additional borrowing capacity and requiring monthly principal repayments beginning April 1, 2016. The interest rate on the loan was also increased from one-month LIBOR plus 2% to one-month LIBOR plus 2.25%. On May 3, 2016, the existing loan was repaid in full and was refinanced with a different lender.
On December 27, 2013, the Company, through a wholly-owned subsidiary, entered into a loan ("Westside Loan") with U.S. Bank National Association for $29.7 million. Draws under the Westside Loan were secured by the assets of The Westside Apartments. The Company could draw the remaining $6.7 million when certain debt service coverage and loan to value criteria were met. Amounts repaid on the loan could not be reborrowed. The Company had provided a $6.5 million repayment guarantee. The Company paid certain closing costs in connection with the Westside Loan, including loan fees totaling $222,000. On September 1, 2016, the existing loan was repaid in full and was refinanced with a different lender.
In addition to Tech Center Square Apartments and The Westside Apartments, the Company refinanced the loans on Verona Apartment Homes, Skyview Apartment Homes, Pinehurst, and Cannery Lofts during the year ended December 31, 2016. As a result, $791,000 of loss on extinguishment of debt was included in interest expense on the consolidated statement of operations for the year ended December 31, 2016.
Deferred financing costs incurred to obtain financing are amortized over the term of the related debt. During the years ended December 31, 2017, 2016, and 2015, $1.9 million, $1.8 million, and $1.5 million, respectively, of amortization of deferred financing costs were included in interest expense. Accumulated amortization as of December 31, 2017 and 2016 was $4.0 million and $2.6 million, respectively.
F-23
RESOURCE REAL ESTATE OPPORTUNITY REIT, INC.
NOTES TO CONSOLIDATED FINANCIAL STATEMENTS – (Continued)
DECEMBER 31, 2017
The following table presents the Company's estimated amortization of the existing deferred financing costs for the next five years ending December 31, and thereafter (in thousands):
2018 | $ | 1,683 | |
2019 | 1,580 | ||
2020 | 1,302 | ||
2021 | 1,067 | ||
2022 | 871 | ||
Thereafter | 1,412 | ||
$ | 7,915 | ||
NOTE 12 – CREDIT FACILITY
The secured revolving credit facility with Bank of America, N.A. (“Bank of America”), as amended, matured on May 23, 2017 and was closed; all collateral subject to the revolving credit line was released. For the year ended December 31, 2017, the Company paid an unused line of credit fee to Bank of America of $250,000, which is included in interest expense in the consolidated statements of operations and comprehensive income (loss). For the years ended December 31, 2017 and 2016, the Company had weighted average borrowings of $0 and $6.8 million, respectively, under the Bank of America Credit Facility. The interest rate of the line was LIBOR plus 3.0%, and the weighted average interest rate for the borrowings in 2016 was 3.44%
Deferred financing costs incurred to obtain financing are amortized over the term of the related debt. During the years ended December 31, 2017, 2016, and 2015, $0, $321,000, and $327,000, respectively, of amortization of deferred financing costs were included in interest expense. Deferred financing costs were fully amortized on the date of maturity. Accumulated amortization as of December 31, 2017 and 2016 was $0 and $857,000, respectively.
NOTE 13 - ACCUMULATED OTHER COMPREHENSIVE LOSS
The following table presents the changes in each component of the Company's accumulated other comprehensive loss for the years ended December 31, 2017, 2016, and 2015 (dollars in thousands):
Balance, January 1, 2015 | $ | (266 | ) |
Unrealized loss on designated derivatives | (174 | ) | |
Balance, December 31, 2015 | (440 | ) | |
Reclassification adjustment for realized loss on designated derivatives | 105 | ||
Unrealized loss on designated derivatives | (10 | ) | |
Balance, December 31, 2016 | (345 | ) | |
Reclassification adjustment for realized loss on designated derivatives | 163 | ||
Unrealized loss on designated derivatives | (380 | ) | |
Balance, December 31, 2017 | $ | (562 | ) |
NOTE 14 – CERTAIN RELATIONSHIPS AND RELATED PARTY TRANSACTIONS
In the ordinary course of its business operations, the Company has ongoing relationships with several related parties.
Relationship with RAI and C-III
Property loss pool. The Company's properties participate in a property loss self-insurance pool with other properties directly and indirectly managed by RAI and C-III, which is backed by a catastrophic insurance policy. Substantially all of the receivables from related parties represent insurance deposits held in escrow by RAI and C-III to the self-insurance pool which, if unused, will be returned to the Company. The pool covers losses up to $2.5 million, after a $25,000 deductible per incident. Claims beyond the insurance pool limits will be covered by the catastrophic insurance policy, which covers claims up to $250.0 million, after a $25,000 deductible per incident. Therefore, unforeseen or catastrophic losses in excess of the Company's insured limits could have a material adverse effect on the Company's financial condition and operating results. During the years ended December 31, 2017 and 2016, the Company paid $1.0 million and $1.8 million into the insurance pools.
F-24
RESOURCE REAL ESTATE OPPORTUNITY REIT, INC.
NOTES TO CONSOLIDATED FINANCIAL STATEMENTS – (Continued)
DECEMBER 31, 2017
General liability loss pool. The Company's properties participated in a general liability pool with other properties directly or indirectly managed by RAI and C-III until April 22, 2017. The pool covers claims up to $50,000 per incident through April 22, 2017. Effective April 23, 2017, the loss pool was eliminated, and the Company now participates (with other properties directly or indirectly managed by RAI and C-III) in a general liability policy. The insured limit for the general liability policy is $76 million in total claims, after a $25,000 deductible per incident.
Internal audit fees. RAI performs internal audit services for the Company.
Directors and officers liability insurance. The Company participates in a liability insurance program for directors and officers coverage with other C-III managed entities and subsidiaries for coverage up to $100.0 million. The Company paid premiums of $304,047 in connection with this insurance program during the year ended December 31, 2017.
Other expenses. The Company utilizes the services of The Planning and Zoning Resource Company, an affiliate of C-III, for zoning reports for acquisitions.
Relationship with the Advisor
In September 2009, the Company entered into an advisory agreement (the “Advisory Agreement”) pursuant to which the Advisor provides the Company with investment management, administrative and related services. The Advisory Agreement was amended in January 2010 and further amended in January 2011 and March 2015. The Advisory Agreement has a one-year term and renews for an unlimited number of successive one-year terms upon the approval of the conflicts committee of the Company's board of directors. The Company renewed the advisory agreement for another year on September 15, 2017. Under the Advisory Agreement, the Advisor receives fees and is reimbursed for its expenses as set forth below:
Acquisition fees. The Company pays the Advisor an acquisition fee of 2.0% of the cost of investments acquired on behalf of the Company, plus any capital expenditure reserves allocated, or the amount funded by the Company to acquire loans, including acquisition expenses and any debt attributable to such investments.
Asset management fees. The Company pays the Advisor a monthly asset management fee equal to one-twelfth of 1.0% of the higher of the cost or the independently appraised value of each asset, without deduction for depreciation, bad debts or other non-cash reserves. The asset management fee is based only on the portion of the costs or value attributable to the Company’s investment in an asset if the Company does not own all or a majority of an asset and does not manage or control the asset.
Disposition fees. The Advisor earns a disposition fee in connection with of the sale of a property equal to the lesser of one-half of the aggregate brokerage commission paid, or if none is paid, 2.75% of the contract sales price.
Debt financing fees. The Advisor earns a debt financing fee equal to 0.5% of the amount available under any debt financing obtained for which it provided substantial services.
Expense reimbursements. The Company also pays directly or reimburses the Advisor for all of the expenses paid or incurred by the Advisor or its affiliates on behalf of the Company or in connection with the services provided to the Company in relation to its public offering, including its ongoing distribution reinvestment plan offering.
Reimbursements also include expenses the Advisor incurs in connection with providing services to the Company, including the Company’s allocable share of costs for Advisor personnel and overhead, out of pocket expenses incurred in connection with the selection and acquisition of properties or other real estate related debt investments, whether or not the Company ultimately acquires the investment. However, the Company will not reimburse the Advisor or its affiliates for employee costs in connection with services for which the Advisor earns acquisition or disposition fees.
Relationship with the Manager
The Manager manages the Company's real estate properties and real estate-related debt investments and coordinates the leasing of, and manages construction activities related to, some of the Company’s real estate properties pursuant to the terms of the management agreement with the Manager.
Property management fees. The Manager earns 4.5% of the gross receipts from the Company's properties, provided that for properties that are less than 75% occupied, the Manager receives a minimum fee for the first 12 months of ownership, for performing certain property management and leasing activities.
F-25
RESOURCE REAL ESTATE OPPORTUNITY REIT, INC.
NOTES TO CONSOLIDATED FINANCIAL STATEMENTS – (Continued)
DECEMBER 31, 2017
Construction management fees. The Manager earns a construction management fee of 5.0% of actual aggregate costs to construct improvements, or to repair, rehab or reconstruct a property.
Debt servicing fees. The Manager earns a debt servicing fee of 2.75% on payments received from loans held by the Company for investment.
Information technology fees and Operating Expense reimbursement. During the ordinary course of business, the Manager or other affiliates of RAI may pay certain shared information technology fees and operating expenses on behalf of the Company.
Relationship with Other Related Parties
The Company has also made payments for legal services to the law firm of Ledgewood P.C. (“Ledgewood”). Until 1996, the Chairman of RAI was of counsel to Ledgewood. In connection with the termination of his affiliation with Ledgewood and its redemption of his interest, the Chairman continues to receive certain payments from Ledgewood, but as of September 8, 2016 is no longer the Chairman of RAI. Until March 2006, an executive of RAI was the managing member of Ledgewood. This executive remained of counsel to Ledgewood through June 2007, at which time he became an Executive Vice President of RAI, but as of September 8, 2016 is no longer an executive of RAI.
The Company utilizes the services of a printing company, Graphic Images, LLC (“Graphic Images”), whose principal owner is the father of RAI’s Chief Financial Officer.
The following table presents the Company's amounts payable to and amounts receivable from such related parties (in thousands):
As of December 31, | |||||||
2017 | 2016 | ||||||
Due from related parties: | |||||||
RAI and affiliates | $ | 371 | $ | 1,375 | |||
Due to related parties: | |||||||
Advisor: | |||||||
Asset management fees | $ | 15 | $ | — | |||
Operating expense reimbursements | 32 | 1,285 | |||||
Subtotal, due to Advisor | 47 | 1,285 | |||||
Manager: | |||||||
Property management fees | 476 | 456 | |||||
Operating expense reimbursements | 196 | 314 | |||||
Subtotal, due to Manager | 672 | 770 | |||||
Total, due to related parties | $ | 719 | $ | 2,055 | |||
F-26
RESOURCE REAL ESTATE OPPORTUNITY REIT, INC.
NOTES TO CONSOLIDATED FINANCIAL STATEMENTS – (Continued)
DECEMBER 31, 2017
The following table presents the Company's fees earned by and expenses paid to such related parties (in thousands):
For the Years Ended | |||||||||||
December 31, | |||||||||||
2017 | 2016 | 2015 | |||||||||
Fees earned / expenses paid to related parties: | |||||||||||
Advisor: | |||||||||||
Acquisition fees (1) | $ | 3,670 | $ | 1,452 | $ | 5,179 | |||||
Asset management fees (2) | 11,352 | 10,484 | 10,240 | ||||||||
Disposition fees (3) | 361 | 686 | 1,140 | ||||||||
Debt financing fees (4) | 1,036 | 532 | 697 | ||||||||
Overhead allocation (5) | 4,442 | 5,621 | 3,733 | ||||||||
Internal audit fees (5) | 69 | 44 | 41 | ||||||||
Manager : | |||||||||||
Property management fees (2) | $ | 5,589 | $ | 5,137 | $ | 4,748 | |||||
Construction management fees (6) | 764 | 926 | 1,895 | ||||||||
Construction payroll reimbursements (6) | 191 | 310 | 483 | ||||||||
Information technology fees (5) | — | 418 | 365 | ||||||||
Operating expense reimbursements (7) | 1,015 | 2,273 | 2,174 | ||||||||
Debt servicing fees (2) | 2 | 15 | 33 | ||||||||
Other: | |||||||||||
Ledgewood (5) | $ | — | $ | 121 | $ | 169 | |||||
The Planning & Zoning Resource Company (1) | 4 | — | — | ||||||||
Graphic Images (5) | 9 | 91 | 59 | ||||||||
(1) Included in Acquisition costs on the consolidated statements of operations and comprehensive income (loss).
(2) Included in Management fees on the consolidated statements of operations and comprehensive income (loss).
(3) Included in Net gains on dispositions of properties and joint venture interests on the consolidated statements of operations and comprehensive income (loss).
(4) Included in Mortgage notes payable, net on the consolidated balance sheets.
(5) Included in General and administrative costs on the consolidated statements of operations and comprehensive income (loss).
(6) Included in Rental Properties, net on the consolidated balance sheets.
(7) Included in Rental operating expenses on the consolidated statements of operations and comprehensive income (loss).
F-27
RESOURCE REAL ESTATE OPPORTUNITY REIT, INC.
NOTES TO CONSOLIDATED FINANCIAL STATEMENTS – (Continued)
DECEMBER 31, 2017
NOTE 15 – EQUITY
Preferred Stock
The Company’s charter authorizes the Company to issue 10.0 million shares of its $0.01 par value preferred stock. As of December 31, 2017 and 2016, no shares of preferred stock were issued and outstanding.
Common Stock
As of December 31, 2017, the Company had issued an aggregate of 77,457,551 shares of its $0.01 par value common stock as follows (dollars in thousands):
Shares Issued | Gross Proceeds | ||||||
Shares issued through private offering | 1,263,727 | $ | 12,582 | ||||
Shares issued through primary public offering (1) | 62,485,461 | 622,077 | |||||
Shares issued through stock distributions | 2,132,266 | — | |||||
Shares issued through distribution reinvestment plan | 11,560,597 | 118,502 | |||||
Shares issued in conjunction with the Advisor's initial investment, net of 4,500 share conversion | 15,500 | 155 | |||||
Total | 77,457,551 | $ | 753,316 | ||||
Shares redeemed and retired | (6,158,084 | ) | |||||
Total shares outstanding as of December 31, 2017 | 71,299,467 | ||||||
(1) Includes 276,056 shares held by the Advisor.
Convertible Stock
As of December 31, 2017 and 2016, the Company had 49,995 and 50,000 shares, respectively, of $0.01 par value convertible stock outstanding of which the Advisor and affiliated persons own 49,063 shares and outside investors own 932 shares at December 31, 2017. In 2017, the Company repurchased and retired five shares. The convertible stock will convert into shares of the Company’s common stock upon the occurrence of (a) the Company having paid distributions to common stockholders that in the aggregate equal 100% of the price at which the Company originally sold the shares plus an amount sufficient to produce a 10% cumulative, non-compounded annual return on the shares at that price; or (b) if the Company lists its common stock on a national securities exchange and, on the 31st trading day after listing, the Company’s value based on the average trading price of its common stock since the listing, plus prior distributions, combine to meet the same 10% return threshold.
Each of these two events is a “Triggering Event.” Upon a Triggering Event, the Company's convertible stock will, unless its advisory agreement has been terminated or not renewed on account of a material breach by its Advisor, generally be converted into a number of shares of common stock equal to 1/50,000 of the quotient of:
(A) | the lesser of |
(i) 25% of the amount, if any, by which
(1) | the value of the Company as of the date of the event triggering the conversion plus the total distributions paid to its stockholders through such date on the then-outstanding shares of its common stock exceeds |
(2) | the sum of the aggregate issue price of those outstanding shares plus a 10% cumulative, non-compounded, annual return on the issue price of those outstanding shares as of the date of the event triggering the conversion, or |
(ii) 15% of the amount, if any, by which
(1) | the value of the Company as of the date of the event triggering the conversion plus the total distributions paid to its stockholders through such date on the then-outstanding shares of its common stock exceeds |
F-28
RESOURCE REAL ESTATE OPPORTUNITY REIT, INC.
NOTES TO CONSOLIDATED FINANCIAL STATEMENTS – (Continued)
DECEMBER 31, 2017
(2) | the sum of the aggregate issue price of those outstanding shares plus a 6% cumulative, non-compounded, annual return on the issue price of those outstanding shares as of the date of the event triggering the conversion, divided by |
(B) | the value of the Company divided by the number of outstanding shares of common stock, in each case, as of the date of the event triggering the conversion. As of December 31, 2017, no triggering events have occurred. |
Redemption of Securities
During the year ended December 31, 2017, the Company redeemed shares of its outstanding common stock as follows (in thousands, except per share data):
Period | Total Number of Shares Redeemed (1) | Average Price Paid per Share | ||
January 2017 | — | — | ||
February 2017 | — | — | ||
March 2017 | 696 | $10.83 | ||
April 2017 | — | — | ||
May 2017 | — | — | ||
June 2017 | 957 | $10.94 | ||
July 2017 | — | — | ||
August 2017 | — | — | ||
September 2017 | 681 | $10.94 | ||
October 2017 | — | — | ||
November 2017 | — | — | ||
December 2017 | 856 | $10.94 | ||
3,190 | ||||
(1) All redemptions of equity securities by the Company during the year ended December 31, 2017 were made pursuant to the Company's share redemption program.
All redemption requests tendered were honored during the year ended December 31, 2017.
The Company will not redeem in excess of 5% of the weighted-average number of shares outstanding during the 12-month period immediately prior to the effective date of redemption. The Company's board of directors will determine at least quarterly whether it has sufficient excess cash to repurchase shares. Generally, the cash available for redemptions will be limited to proceeds from the Company's distribution reinvestment plan plus, if the Company has positive operating cash flow from the previous fiscal year, 1% of all operating cash flow from the previous year.
The Company's board of directors, in its sole discretion, may suspend, terminate or amend the Company's share redemption program without stockholder approval upon 30 days' notice if it determines that such suspension, termination or amendment is in the Company's best interest. The Company's board may also reduce the number of shares purchased under the share redemption program if it determines the funds otherwise available to fund the Company's share redemption program are needed for other purposes. These limitations apply to all redemptions, including redemptions sought upon a stockholder's death, qualifying disability or confinement to a long-term care facility.
F-29
RESOURCE REAL ESTATE OPPORTUNITY REIT, INC.
NOTES TO CONSOLIDATED FINANCIAL STATEMENTS – (Continued)
DECEMBER 31, 2017
Distributions
For the year ended December 31, 2017, the Company paid aggregate distributions of $43.0 million, including $15.9 million of distributions paid in cash and $27.1 million of distributions reinvested in shares of common stock through the Company's distribution reinvestment plan, as follows (in thousands, except per share data):
Record Date | Per Common Share | Distribution Date | Distributions Reinvested in Shares of Common Stock | Net Cash Distributions | Total Aggregate Distributions | |||||||||||||
January 30, 2017 | $ | 0.05 | January 31, 2017 | $ | 2,329 | $ | 1,272 | $ | 3,601 | |||||||||
February 27, 2017 | 0.05 | February 28, 2017 | 2,308 | 1,303 | 3,611 | |||||||||||||
March 30, 2017 | 0.05 | March 31, 2017 | 2,274 | 1,314 | 3,588 | |||||||||||||
April 27, 2017 | 0.05 | April 28, 2017 | 2,273 | 1,324 | 3,597 | |||||||||||||
May 30, 2017 | 0.05 | May 31, 2017 | 2,258 | 1,350 | 3,608 | |||||||||||||
June 29, 2017 | 0.05 | June 30, 2017 | 2,249 | 1,322 | 3,571 | |||||||||||||
July 28, 2017 | 0.05 | July 31, 2017 | 2,247 | 1,333 | 3,580 | |||||||||||||
August 30, 2017 | 0.05 | August 31, 2017 | 2,250 | 1,340 | 3,590 | |||||||||||||
September 28, 2017 | 0.05 | September 29, 2017 | 2,233 | 1,335 | 3,568 | |||||||||||||
October 30, 2017 | 0.05 | October 31, 2017 | 2,237 | 1,339 | 3,576 | |||||||||||||
November 29, 2017 | 0.05 | November 30, 2017 | 2,239 | 1,349 | 3,588 | |||||||||||||
December 28, 2017 | 0.05 | December 29, 2017 | 2,217 | 1,338 | 3,555 | |||||||||||||
$ | 0.60 | $ | 27,114 | $ | 15,919 | $ | 43,033 | |||||||||||
Since its formation, the Company has declared a total of seven quarterly stock distributions of 0.015 shares each, two quarterly stock distributions of 0.0075 shares each, one quarterly stock distribution of 0.00585 shares each, and two quarterly stock distributions of 0.005 shares each of its common stock outstanding.
NOTE 16 – FAIR VALUE MEASURES AND DISCLOSURES
In analyzing the fair value of its investments accounted for on a fair value basis, the Company follows the fair value hierarchy, which requires an entity to maximize the use of observable inputs and minimize the use of unobservable inputs when measuring fair value. The Company determines fair value based on quoted prices when available or, if quoted prices are not available, through the use of alternative approaches, such as discounting the expected cash flows using market interest rates commensurate with the credit quality and duration of the investment. The fair value of cash, tenant receivables and accounts payable, approximate their carrying value due to their short nature. The hierarchy followed defines three levels of inputs that may be used to measure fair value:
Level 1 - Quoted prices in active markets for identical assets and liabilities that the reporting entity has the ability to access at the measurement date.
Level 2 - Inputs other than quoted prices included within Level 1 that are observable for the asset and liability or can be corroborated with observable market data for substantially the entire contractual term of the asset or liability.
Level 3 - Unobservable inputs that reflect the entity’s own assumptions about the assumptions that market participants would use in the pricing of the asset or liability and are consequently not based on market activity, but rather through particular valuation techniques.
The determination of where an asset or liability falls in the hierarchy requires significant judgment. The Company evaluates its hierarchy disclosures each quarter; depending on various factors, it is possible that an asset or liability may be classified differently from quarter to quarter. However, the Company expects that changes in classifications between levels will be rare.
Derivatives (interest rate caps), which are reported at fair value in the consolidated balance sheets, are valued by a third-party pricing agent using an income approach with models that use, as their primary inputs, readily observable market parameters. This valuation process considers factors including interest rate yield curves, time value, credit and volatility factors (Level 2).
F-30
RESOURCE REAL ESTATE OPPORTUNITY REIT, INC.
NOTES TO CONSOLIDATED FINANCIAL STATEMENTS – (Continued)
DECEMBER 31, 2017
The following table presents information about the Company's assets measured at fair value on a recurring basis and indicates the fair value hierarchy of the valuation techniques utilized by the Company to determine such fair value as follows (in thousands):
Level 1 | Level 2 | Level 3 | Total | ||||||||||||
December 31, 2017 | |||||||||||||||
Assets: | |||||||||||||||
Interest rate caps | $ | — | $ | 49 | $ | — | $ | 49 | |||||||
$ | — | $ | 49 | $ | — | $ | 49 | ||||||||
December 31, 2016 | |||||||||||||||
Assets: | |||||||||||||||
Interest rate caps | $ | — | $ | 242 | $ | — | $ | 242 | |||||||
$ | — | $ | 242 | $ | — | $ | 242 | ||||||||
The following table presents the carrying and fair values of the Company’s loan held for investment, net, and mortgage notes payable-outstanding borrowings (in thousands):
December 31, 2017 | December 31, 2016 | ||||||||||||||
Carrying Amount | Fair Value | Carrying Amount | Fair Value | ||||||||||||
Loan held for investment, net | $ | 782 | $ | 1,057 | $ | 769 | $ | 1,104 | |||||||
Mortgage notes payable- outstanding borrowings | (800,862 | ) | (802,523 | ) | (627,088 | ) | (620,578 | ) | |||||||
The fair value of the loan held for investment, net was estimated using rates available to the Company for debt with similar terms and remaining maturities (Level 3).
The carrying amount of the mortgage notes payable presented is the outstanding borrowings excluding premium or discount and deferred finance costs, net. The fair value of the mortgage notes payable was estimated using rates available to the Company for debt with similar terms and remaining maturities (Level 3).
NOTE 17 – DERIVATIVES AND HEDGING ACTIVITIES
Risk Management Objective of Using Derivatives
The Company is exposed to certain risk arising from both its business operations and economic conditions. The Company principally manages its exposures to a wide variety of business and operational risks through management of its core business activities. The Company manages economic risks, including interest rate, liquidity, and credit risk primarily by managing the amount, sources, and duration of its debt funding and the use of derivative financial instruments. Specifically, the Company enters into derivative financial instruments to manage exposures that arise from business activities that result in the receipt or payment of future known and uncertain cash amounts, the value of which are determined by interest rates. The Company’s derivative financial instruments are used to manage differences in the amount, timing, and duration of the Company’s known or expected cash receipts and its known or expected cash payments principally related to the Company’s investments and borrowings.
As a condition to certain of the Company’s financing facilities, from time to time the Company may be required to enter into certain derivative transactions as may be required by the lender. These transactions would generally be in line with the Company’s own risk management objectives and also service to protect the lender.
Cash Flow Hedges of Interest Rate Risk
The Company’s objectives in using interest rate derivatives are to add stability to interest expense and to manage its exposure to interest rate movements. To accomplish this objective, the Company entered into a total of 18 interest rate caps that were designated as cash flow hedges. Interest rate caps designated as cash flow hedges involve the receipt of variable amounts from a counterparty if interest rates rise above the strike rate on the contract in exchange for an up-front premium.
F-31
RESOURCE REAL ESTATE OPPORTUNITY REIT, INC.
NOTES TO CONSOLIDATED FINANCIAL STATEMENTS – (Continued)
DECEMBER 31, 2017
The effective portion of changes in the fair value of derivatives designated and that qualify as cash flow hedges is recorded in accumulated other comprehensive income and is subsequently reclassified into earnings in the period that the hedged forecasted transaction affects earnings. During the years ended December 31, 2017 and 2016, such derivatives were used to hedge the variable cash flows, indexed to USD-LIBOR, associated with existing variable-rate loan agreements. The ineffective portion of the change in fair value of the derivatives is recognized directly in earnings. During the year ended December 31, 2017, the Company had a loss of $162,636 due to hedge ineffectiveness. During the year ended December 31, 2016, the Company had a loss of $104,941 due to hedge ineffectiveness related to the sales of Nesbit Palisades and Ivy at Clear Creek.
Amounts reported in accumulated other comprehensive income related to derivatives will be reclassified to interest expense as interest payments are made on the Company’s variable-rate debt. At December 31, 2017, the Company estimates that an additional $203,188 will be reclassified as an increase to interest expense over the next 12 months.
As of December 31, 2017, the Company had the following outstanding interest rate derivatives that were designated as cash flow hedges of interest rate risk (dollars in thousands):
Interest Rate Derivative | Number of Instruments | Notional | Maturity Dates | |||||
Interest Rate Caps | 18 | $ | 477,825 | January 1, 2018 to January 1, 2021 | ||||
Tabular Disclosure of Fair Values of Derivative Instruments on the Balance Sheet
The table below presents the fair value of the Company’s derivative financial instruments on the consolidated balance sheets as of December 31, 2017 and 2016 (in thousands):
Asset Derivatives | Liability Derivatives | |||||||||||||||||||||||
December 31, 2017 | December 31, 2016 | December 31, 2017 | December 31, 2016 | |||||||||||||||||||||
Balance Sheet | Fair Value | Balance Sheet | Fair Value | Balance Sheet | Fair Value | Balance Sheet | Fair Value | |||||||||||||||||
Prepaid expenses and other assets | $ | 49 | Prepaid expenses and other assets | $ | 242 | — | $ | — | — | $ | — | |||||||||||||
NOTE 18 – OPERATING EXPENSES
Under its charter, the Company must limit its total operating expenses to the greater of 2% of its average invested assets or 25% of its net income for the four most recently completed fiscal quarters, unless the conflicts committee of the Company’s board of directors has determined that such excess expenses were justified based on unusual and non-recurring factors. Operating expenses for the four quarters ended December 31, 2017 were in compliance with the charter imposed limitation.
Allocated payroll expense associated with a portion of the compensation paid by the Advisor or its affiliates to the Company's executive officers was included in general and administrative in the consolidated statements of operations and comprehensive (loss) income and was reimbursed to the Advisor during the years ended December 31, 2017 and 2016. This expense is included in "overhead allocation" in Note 14.
NOTE 19 – INSURANCE PROCEEDS IN EXCESS OF COST BASIS
For the year ended December 31, 2017, there were $150,000 of insurance proceeds in excess of cost basis included on the consolidated statements of operations and comprehensive income (loss) received in 2017 from casualties that occurred in prior years at Evergreen at Coursey, Verona Apartment Homes, Skyview Apartment Homes, Meridian Pointe, Chisholm Place and Perimeter Circle.
For the year ended December 31, 2016, there were $985,000 of insurance proceeds in excess of cost basis included on the consolidated statements of operations and comprehensive income (loss). The Company received $735,000 of proceeds from insurers, net of expenses, due to incidents at Deerfield, The Westside Apartments, and Chisholm Place in 2016 and $250,000 of proceeds from insurers, net of expenses, due to incidents at Verona Apartment Homes, Skyview Apartment Homes, Meridian Pointe, and Stone Ridge in 2015.
F-32
RESOURCE REAL ESTATE OPPORTUNITY REIT, INC.
NOTES TO CONSOLIDATED FINANCIAL STATEMENTS – (Continued)
DECEMBER 31, 2017
For the year ended December 31, 2015, there were $407,000 of insurance proceeds in excess of cost basis included on the consolidated statements of operations and comprehensive income (loss). The Company received $247,000 of proceeds due to prior owners from insurers, net of expenses, due to an incident at Stone Ridge in 2013 and $160,000 of proceeds from insurers, net of expenses, due to an incident at Chisholm Place in 2014.
NOTE 20 – QUARTERLY FINANCIAL DATA (UNAUDITED)
The following tables present the Company's operating results by quarter (in thousands, except share data):
Quarterly Results for 2017 | March 31 | June 30 | September 30 | December 31 | ||||||||||||
(unaudited) | (unaudited) | (unaudited) | (unaudited) | |||||||||||||
Revenues | $ | 30,205 | $ | 31,030 | $ | 32,333 | $ | 32,121 | ||||||||
Net income (loss) attributable to common stockholders | (8,866 | ) | (3,162 | ) | 2,191 | (12,132 | ) | |||||||||
Net income (loss) per common share | $ | (0.12 | ) | $ | (0.04 | ) | $ | 0.03 | $ | (0.18 | ) | |||||
Quarterly Results for 2016 | March 31 | June 30 | September 30 | December 31 | ||||||||||||
(unaudited) | (unaudited) | (unaudited) | (unaudited) | |||||||||||||
Revenues | $ | 30,556 | $ | 30,721 | $ | 28,575 | $ | 28,515 | ||||||||
Net income (loss) | 8,480 | 2,427 | 9,637 | (10,173 | ) | |||||||||||
Less: net (income) loss attributable to noncontrolling interests | (6,281 | ) | (25 | ) | — | — | ||||||||||
Net income (loss) attributable to common stockholders | 2,199 | 2,402 | 9,637 | (10,173 | ) | |||||||||||
Net income (loss) per common share | $ | 0.03 | $ | 0.03 | $ | 0.14 | $ | (0.14 | ) | |||||||
NOTE 21 – SUBSEQUENT EVENTS
On January 29, 2018, the Company's Board of Directors declared a $0.05 per share cash distribution to its common stockholders of record at the close of business on January 30, 2018. On February 1, 2018, the Company's Board of Directors declared a $0.05 per share cash distribution to its common stockholders of record at the close of business on February 27, 2018 and March 29, 2018. Such distributions were or are to be paid on January 31, February 28, and April 2, 2018.
On February 12, 2018, the Company entered into an agreement to purchase Addison at Sandy Spring Apartments, a 236 unit multifamily apartment complex in Sandy Springs, Georgia for $34.0 million with an expected closing date in the second quarter of 2018.
On March 12, 2018, the Company entered into an agreement to purchase Bristol at Grapevine Apartments, a 376 unit multifamily apartment complex in Grapevine, Texas for $44.7 million with an expected closing date in the second quarter of 2018.
On March 26, 2018, the Company's Board of Directors approved $11.0 million of redemption requests from investors.
On March 28, 2018, the Company's Board of Directors approved and adopted a Second Amended and Restated Share Redemption Program (the “Amended SRP”). Pursuant to the Amended SRP, the Company will redeem shares at a purchase price equal to 95% of the current net asset value per share redeemed. The Amended SRP will be effective for all redemptions occurring after April 29, 2018. In addition, the Board approved and adopted a Third Amended and Restated Distribution Reinvestment Plan (the “Amended DRP”). Pursuant to the Amended DRP, shares will be sold at a price equal to 95% of the current per share net asset value. The Amended DRP will be effective for all DRP issuances after April 8, 2018.
The Company has evaluated subsequent events and determined that no events have occurred, other than those disclosed above, which would require an adjustment to or additional disclosure in the consolidated financial statements.
F-33
RESOURCE REAL ESTATE OPPORTUNITY REIT, INC. SCHEDULE III Real Estate and Accumulated Depreciation December 31, 2017 (in thousands) | ||||||||||||||||||||||||||
Column A | Column B | Column C | Column D | Column E | Column F | Column G | Column H | Column I | ||||||||||||||||||
Description | Encumbrances | Initial cost to Company | Cost capitalized subsequent to acquisition | Gross Amount at which carried at close of period | Accumulated Depreciation | Date of Construction | Date Acquired | Life on which depreciation in latest income is computed | ||||||||||||||||||
Buildings and Land Improvements | Improvements Carrying Costs | Buildings and Land Improvements Total | ||||||||||||||||||||||||
Real estate owned: | ||||||||||||||||||||||||||
Residential | $ | 14,897 | $ | 11,076 | $ | 4,508 | $ | 15,584 | $ | (4,734 | ) | 1961 | 6/17/2011 | 3 - 27.5 years | ||||||||||||
Philadelphia, PA | ||||||||||||||||||||||||||
Residential | 13,100 | 8,273 | 1,759 | 10,032 | (2,640 | ) | 1838 | 5/13/2011 | 3 - 27.5 years | |||||||||||||||||
Dayton, OH | ||||||||||||||||||||||||||
Residential | 53,995 | 39,341 | 13,008 | 52,349 | (16,531 | ) | 1966 | 6/20/2012 | 3 - 27.5 years | |||||||||||||||||
Cincinnati, OH | ||||||||||||||||||||||||||
Residential | 11,375 | 8,064 | 3,672 | 11,736 | (2,796 | ) | 1986 | 4/18/2013 | 3 - 27.5 years | |||||||||||||||||
Hoover, AL | ||||||||||||||||||||||||||
Residential | 18,368 | 26,496 | 4,075 | 30,571 | (6,631 | ) | 1981 | 6/24/2013 | 3 - 27.5 years | |||||||||||||||||
Houston, TX | ||||||||||||||||||||||||||
Residential | 36,820 | 31,001 | 5,438 | 36,439 | (6,876 | ) | 1984 | 7/25/2013 | 3 - 27.5 years | |||||||||||||||||
Plano, TX | ||||||||||||||||||||||||||
Residential | 12,141 | 17,583 | 2,759 | 20,342 | (4,038 | ) | 1985 | 9/9/2013 | 3 - 27.5 years | |||||||||||||||||
Newport News, VA | ||||||||||||||||||||||||||
Residential | 32,970 | 23,321 | 10,091 | 33,412 | (5,565 | ) | 1985 | 9/30/2013 | 3 - 27.5 years | |||||||||||||||||
Littleton, CO | ||||||||||||||||||||||||||
Residential | 28,400 | 29,509 | (1,735 | ) | 27,774 | (4,958 | ) | 1985 | 9/30/2013 | 3 - 27.5 years | ||||||||||||||||
Westminster, CO | ||||||||||||||||||||||||||
Residential | 13,342 | 21,831 | 6,359 | 28,190 | (6,295 | ) | 1982 | 12/16/2013 | 3 - 27.5 years | |||||||||||||||||
San Antonio, TX | ||||||||||||||||||||||||||
Residential (2) | 39,500 | 32,142 | 5,354 | 37,496 | (6,396 | ) | 1988 | 12/20/2013 | 3 - 27.5 years | |||||||||||||||||
Burnsville, MN | ||||||||||||||||||||||||||
Residential | 48,603 | 69,111 | 8,946 | 78,057 | (12,336 | ) | 1999 | 3/28/2014 | 3 - 27.5 years | |||||||||||||||||
Alpharetta, GA | ||||||||||||||||||||||||||
Residential | 26,639 | 42,001 | 1,075 | 43,076 | (7,048 | ) | 2003 | 5/5/2014 | 3 - 27.5 years | |||||||||||||||||
Baton Rouge, LA | ||||||||||||||||||||||||||
Residential | 16,923 | 28,911 | 3,199 | 32,110 | (4,620 | ) | 1995 | 5/19/2014 | 3 - 27.5 years | |||||||||||||||||
Atlanta, GA | ||||||||||||||||||||||||||
Residential | 13,356 | 21,796 | 3,214 | 25,010 | (3,622 | ) | 1995 | 5/19/2014 | 3 - 27.5 years | |||||||||||||||||
Atlanta, GA | ||||||||||||||||||||||||||
RESOURCE REAL ESTATE OPPORTUNITY REIT, INC. SCHEDULE III Real Estate and Accumulated Depreciation December 31, 2017 (in thousands) (Continued) | ||||||||||||||||||||||||||
Column A | Column B | Column C | Column D | Column E | Column F | Column G | Column H | Column I | ||||||||||||||||||
Description | Encumbrances | Initial cost to Company | Cost capitalized subsequent to acquisition | Gross Amount at which carried at close of period | Accumulated Depreciation | Date of Construction | Date Acquired | Life on which depreciation in latest income is computed | ||||||||||||||||||
Buildings and Land Improvements | Improvements Carrying Costs | Buildings and Land Improvements Total | ||||||||||||||||||||||||
Residential | 22,942 | 31,385 | 3,147 | 34,532 | (4,992 | ) | 2000 | 6/26/2014 | 3 - 27.5 years | |||||||||||||||||
Katy, TX | ||||||||||||||||||||||||||
Residential | 12,682 | 18,250 | 1,222 | 19,472 | (3,645 | ) | 1984 | 7/1/2014 | 3 - 27.5 years | |||||||||||||||||
Shawnee, KS | ||||||||||||||||||||||||||
Residential | 6,250 | 11,898 | 583 | 12,481 | (2,374 | ) | 1985 | 7/1/2014 | 3 - 27.5 years | |||||||||||||||||
Lee's Summit, MO | ||||||||||||||||||||||||||
Residential | 7,338 | 9,691 | 799 | 10,490 | (2,024 | ) | 1983 | 7/1/2014 | 3 - 27.5 years | |||||||||||||||||
Kansas City, MO | ||||||||||||||||||||||||||
Residential | 22,145 | 34,554 | 5,952 | 40,506 | (5,064 | ) | 1949 | 9/4/2014 | 3 - 27.5 years | |||||||||||||||||
San Antonio, TX | ||||||||||||||||||||||||||
Residential | 34,395 | 47,075 | 6,691 | 53,766 | (7,329 | ) | 1984 | 9/29/2014 | 3 - 27.5 years | |||||||||||||||||
Irving, TX | ||||||||||||||||||||||||||
Residential | 14,717 | 21,204 | 580 | 21,784 | (3,153 | ) | 1974 | 11/25/2014 | 3 - 27.5 years | |||||||||||||||||
Yorktown, VA | ||||||||||||||||||||||||||
Residential | 12,177 | 23,370 | 5,192 | 28,562 | (3,307 | ) | 1981 | 2/26/2015 | 3 - 27.5 years | |||||||||||||||||
Austin, TX | ||||||||||||||||||||||||||
Residential | 25,912 | 35,070 | 5,773 | 40,843 | (4,318 | ) | 1986 | 3/19/2015 | 3 - 27.5 years | |||||||||||||||||
Gilbert, AZ | ||||||||||||||||||||||||||
Residential | 67,500 | 116,036 | 8,177 | 124,213 | (8,459 | ) | 1986 | 6/1/2015 | 3 - 27.5 years | |||||||||||||||||
Orange County, CA | ||||||||||||||||||||||||||
Residential | 26,525 | 50,365 | 4,542 | 54,907 | (3,633 | ) | 1988 | 6/16/2015 | 3 - 27.5 years | |||||||||||||||||
Chula Vista, CA | ||||||||||||||||||||||||||
Residential | 47,000 | 61,490 | 1,304 | 62,794 | (2,317 | ) | 1997 | 12/22/2016 | 3 - 27.5 years | |||||||||||||||||
Arlington, TX | ||||||||||||||||||||||||||
Residential | 61,500 | 77,127 | 259 | 77,386 | (1,506 | ) | 1988 | 5/31/2017 | 3 - 27.5 years | |||||||||||||||||
Lisle, IL | ||||||||||||||||||||||||||
Residential | 32,250 | 43,132 | (396 | ) | 42,736 | (501 | ) | 1998 | 8/31/2017 | 3 - 27.5 years | ||||||||||||||||
Lake Mary, FL | ||||||||||||||||||||||||||
RESOURCE REAL ESTATE OPPORTUNITY REIT, INC. SCHEDULE III Real Estate and Accumulated Depreciation December 31, 2017 (in thousands) (Continued) | ||||||||||||||||||||||||||
Column A | Column B | Column C | Column D | Column E | Column F | Column G | Column H | Column I | ||||||||||||||||||
Description | Encumbrances | Initial cost to Company | Cost capitalized subsequent to acquisition | Gross Amount at which carried at close of period | Accumulated Depreciation | Date of Construction | Date Acquired | Life on which depreciation in latest income is computed | ||||||||||||||||||
Buildings and Land Improvements | Improvements Carrying Costs | Buildings and Land Improvements Total | ||||||||||||||||||||||||
Residential | 27,100 | 40,508 | (561 | ) | 39,947 | — | 2001 | 12/20/2017 | 3 - 27.5 years | |||||||||||||||||
Jacksonville, FL | ||||||||||||||||||||||||||
$ | 800,862 | $ | 1,031,611 | $ | 114,986 | $ | 1,146,597 | $ | (147,708 | ) | ||||||||||||||||
For the Years Ended | |||||||||||
December 31, | |||||||||||
2017 | 2016 | 2015 | |||||||||
Investments in Rental Properties: | |||||||||||
Balance, beginning of the period | $ | 1,010,264 | $ | 1,063,211 | $ | 857,151 | |||||
Acquisitions | 160,767 | 61,490 | 224,841 | ||||||||
Improvements, etc. | 21,592 | 28,024 | 43,018 | ||||||||
Dispositions during the period | (46,026 | ) | (142,461 | ) | (61,799 | ) | |||||
Balance, close of the period (1) | $ | 1,146,597 | $ | 1,010,264 | $ | 1,063,211 | |||||
Accumulated depreciation: | |||||||||||
Balance, beginning of the period | $ | (107,810 | ) | $ | (77,363 | ) | $ | (45,133 | ) | ||
Sales | 8,146 | 12,737 | 9,031 | ||||||||
Disposals | 685 | 819 | 652 | ||||||||
Depreciation | (48,729 | ) | (44,003 | ) | (41,913 | ) | |||||
Balance, close of the period (1) | $ | (147,708 | ) | $ | (107,810 | ) | $ | (77,363 | ) | ||
(1) Includes properties held for sale at 12/31/2015.
RESOURCE REAL ESTATE OPPORTUNITY REIT, INC.
SCHEDULE IV
Mortgage Loans on Real Estate
December 31, 2017
(dollars in thousands)
Column A | Column B | Column C | Column D | Column E | Column F | Column G | Column H | |||||||||||||
Description | Interest rate | Final maturity date | Periodic payment term | Prior liens | Face amount of mortgages | Carrying amount of mortgages | Principal amount of loans subject to delinquent principal or interest | |||||||||||||
Residential Columbia City, IN | Fixed interest rate of 7.5% | 10/28/2021 | N/A | N/A | $ | 1,058 | $ | 782 | $ | — | ||||||||||
$ | 1,058 | $ | 782 | $ | — | |||||||||||||||
Year Ended | |||
December 31, 2017 | |||
Balance, beginning of the period | $ | 769 | |
Interest accretion | 39 | ||
Principal reductions | (26 | ) | |
Balance, end of the period | $ | 782 | |