Attached files
| file | filename |
|---|---|
| 8-K - 8-K - NEW PEOPLES BANKSHARES INC | d937158d8k.htm |
 Annual Shareholders’ Meeting June 2, 2015 Exhibit 99.1 |
 INTRODUCTION OF DIRECTORS • Lynn Keene, Chairman • Charles Gent, Vice-Chairman • Tim Ball • Joe Carter • John Cox • Eugene Hearl • Michael McGlothlin • Fred Meade • Scott White 1 |
 INTRODUCTION OF SENIOR MANAGEMENT TEAM • Todd Asbury, President and CEO • Frank Sexton, Jr., EVP and COO • Karen Wimmer, EVP and CCO • Joseph Pennington, SVP and CFO • Andy Mullins, FSVP and Senior Retail Officer • Debbie Arrington, SVP - Banking Operations • Tammy Herron, Interim SVP & Senior Commercial Loan Officer • Doug Horne, SVP and Area Manager – Cumberland Area • Dorothy Meade, SVP and Area Manager – TriCities and East River Mountain Area • Richard Smith, SVP and Area Manager – Clinch Mountain Area 2 |
 Our Mission The mission of New Peoples Bank is to provide high quality, state of the art, golden rule banking services to our communities, while generating a reasonable return to our stockholders and providing a challenging and rewarding work environment for our family of employees. • We believe in exceeding our customers' expectations through exceptional service. • We believe in being honest in all our dealings with our customers and employees. • We are a locally owned and operated financial institution committed to generating a reasonable and stable return to our shareholders. • We are committed to lifelong learning for our employees and believe it is a requirement for doing business in the 21st century. 3 |
 Cautionary Statement Regarding Forward-Looking Statements
This presentation includes forward-looking statements. These forward-looking statements are based on current expectations that involve risks, uncertainties, and assumptions. Should one or more of these risks or uncertainties materialize or should underlying assumptions prove incorrect, actual results may differ materially. These risks include: changes in business or other market conditions; the timely development, production and acceptance of new products and services; the challenge of managing asset/liability levels; the management of credit risk and interest rate risk; the difficulty of keeping expense growth at modest levels while increasing revenues; and other risks detailed from time to time in the Company's Securities and Exchange Commission reports including, but not limited to, the most recent quarterly report filed on Form 10-Q, current reports filed on Form 8-K, and the Annual Report on Form 10-K for the most recent fiscal year end. Pursuant to the Private Securities Litigation Reform Act of 1995, the Company does not undertake to update forward-looking statements to reflect circumstances or events that occur after the date the forward-looking statements are made. 4 |
 2014 - A Year of Stabilization and Building a Foundation for the Future • Major Initiatives • Improved our Capital Position • Streamlined our branching network • Improved/stabilized Asset Quality issues • Nearing full compliance with Written Agreement • Obtained regulatory approval to pay 5 years of cumulative deferred interest on trust preferred securities in 4 th quarter of 2014 • Made changes in management to prepare for future 5 |
 Strategic Priorities NEAR-TERM PRIORITIES (1-2 years) Emerge from Operating Agreement Reduce credit risk profile Conservative/modest growth Increase earnings and capital Maximize efficiencies Improve risk management capabilities Continue to recruit, develop and support our people |
 Emerge From Operating
Agreement 7 |
 Emerge From Operating Agreement • Entered a formal Written Agreement with the Federal Reserve and the VA Bureau of Financial Institutions in July 2010 • To date, we have fully complied with nearly all of the requirements. Three are partially in compliance, but we believe we have sufficiently addressed these. • Our goal is to no longer be under the formal Written Agreement by 2016 8 |
 Reduce Credit Risk Profile
9 |
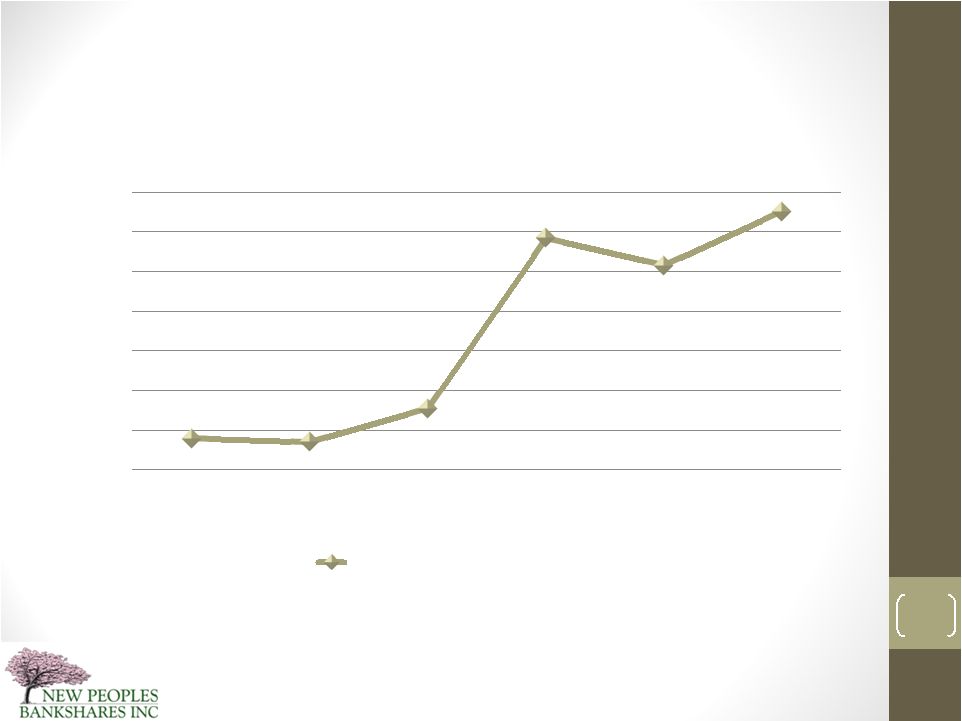
 Reduce Credit Risk Profile • We continue to make steady progress in resolving poor asset quality issues • Nonperforming Assets remain high, but continue decreasing • Our goal is to reduce classified assets at least 25% annually • During 2014, classified assets decreased by $18.4 million, or 30.24% 10 |
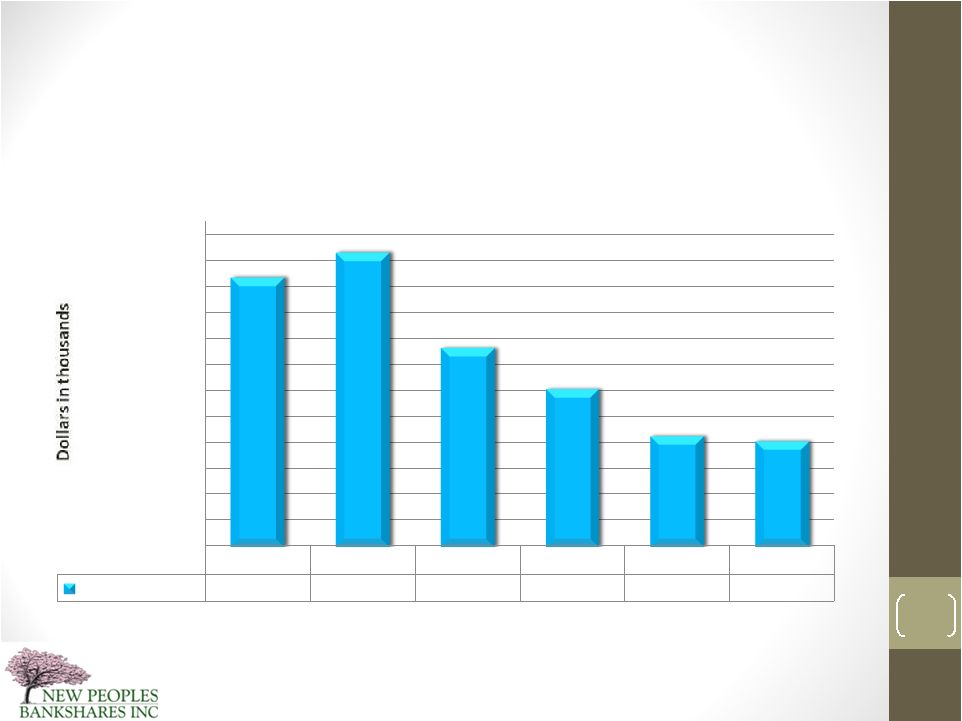 Classified Assets (In thousands)
December 31, 2010 through March, 31, 2015
2010 2011 2012 2013 2014 2015 Classified Assets $103,762 $113,393 $76,641 $60,976 $42,538 $40,689 $0 $10,000 $20,000 $30,000 $40,000 $50,000 $60,000 $70,000 $80,000 $90,000 $100,000 $110,000 $120,000 Classified Assets 11 |
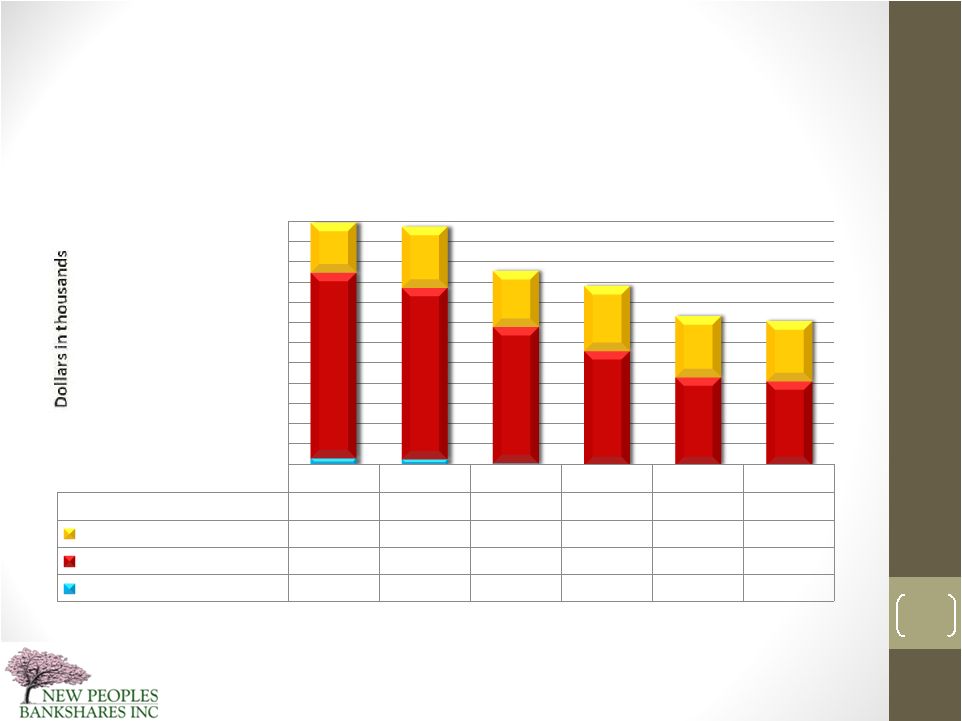 Nonperforming Assets (In thousands)
December 31, 2010 through March 31, 2015
2010 2011 2012 2013 2014 2015 Total NPAs $59,820 $58,912 $47,956 $44,161 $36,910 $35,559 OREO $12,346 $15,092 $13,869 $15,853 $15,049 $14,837 Nonaccrual Loans $45,781 $42,316 $33,536 $28,307 $21,861 $20,722 90 Days + Accruing Interest $1,693 $1,504 $551 $1 $- $- $0 $5,000 $10,000 $15,000 $20,000 $25,000 $30,000 $35,000 $40,000 $45,000 $50,000 $55,000 $60,000 Nonperforming Assets 12 |
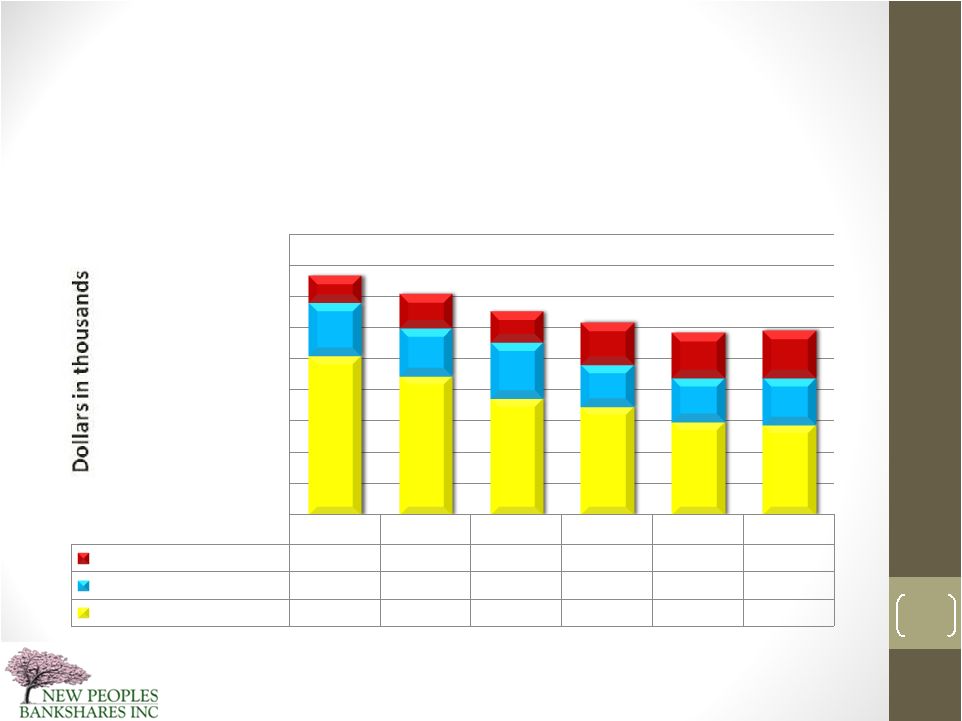
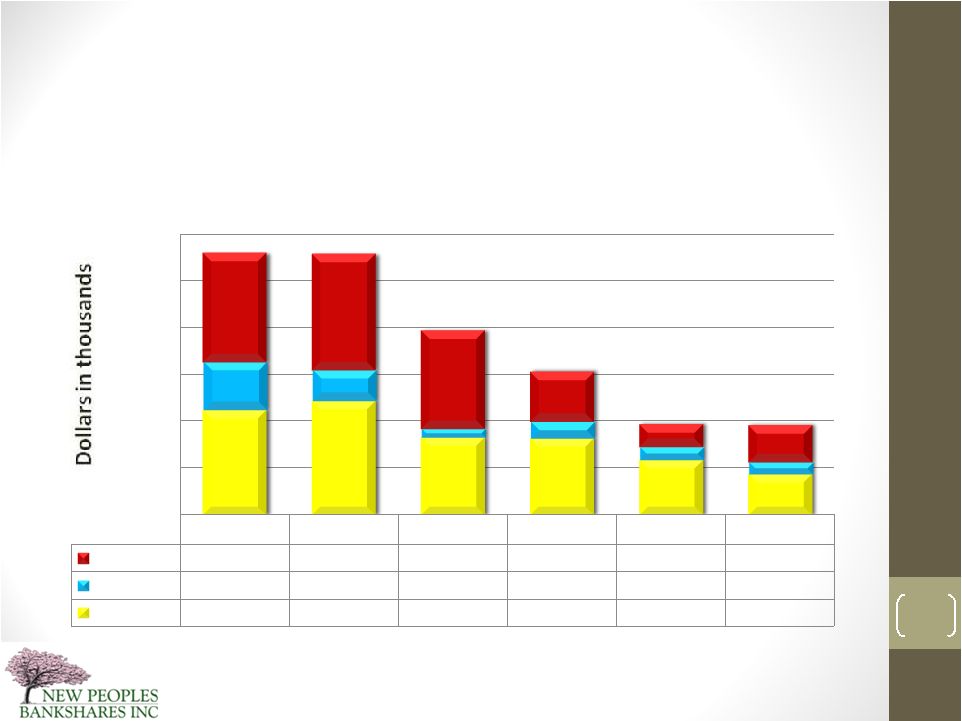 Delinquency Trends 30+ days (In thousands)
December 31, 2010 through March 31, 2015
2010 2011 2012 2013 2014 2015 90 Days+ $23,404 $24,820 $21,002 $10,702 $4,952 $7,855 60-89 Days $10,110 $6,609 $1,956 $3,625 $2,634 $2,481 30-59 Days $22,426 $24,328 $16,492 $16,370 $11,882 $8,928 $0 $10,000 $20,000 $30,000 $40,000 $50,000 $60,000 Loan Portfolio Delinquencies 13 |
 Conservative/ Modest Growth
14 |
 Consolidated Financial Snapshot Balance Sheet Measures March 31, 2015 December 31, 2014 December 31, 2013 Total Assets $ 660.1 million $ 651.1 million $ 684.7 million Investment Securities available for sale $ 100.1 million $ 100.1 million $ 79.1 million Total Loans $ 449.9 million $ 457.5 million $ 493.0 million Total Allowance for Loan Loss $ 9.0 million $ 9.9 million $ 13.1 million Total Deposits $ 593.3 million $ 585.2 million $ 619.0 million Total Equity Capital $ 43.9 million $ 42.9 million $ 40.0 million Tangible Book Value $1.92 $1.87 $1.83 Basic Shares Outstanding 22,878,654 22,878,654 21,872,293 15 |
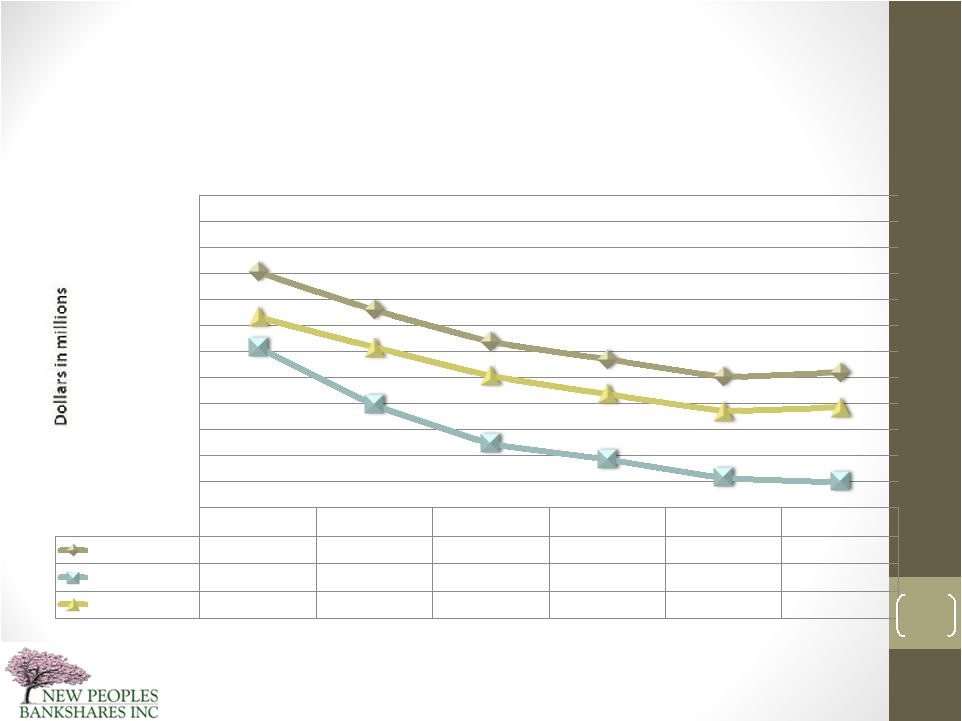 Strategic Shrinking Trend (In Millions)
December
31,
2010
-
March
31,
2015
2010 2011 2012 2013 2014 2015 Total Assets $852.6 $780.4 $719.0 $684.7 $651.1 $660.1 Total Loans $707.8 $597.8 $522.4 $493.0 $457.5 $449.9 Total Deposits $766.1 $708.3 $652.9 $619.0 $585.2 $593.3 $400 $450 $500 $550 $600 $650 $700 $750 $800 $850 $900 $950 $1,000 16 |
 Increase Earnings/ Capital
17 |
 Consolidated Earnings Snapshot Earnings 3-Months Ended March 31, 2015 December 31, 2014 December 31, 2013 Net Income $ 622 thousand $ 240 thousand $ 1.5 million Net Income per Share $ 0.03 $ 0.01 $ 0.07 Net Interest Income $ 5.4 million $ 22.6 million $ 25.3 million Net Interest Margin % 3.74% 3.71% 4.03% Provision for Loan Losses $ -0- $ -0- $ 550 thousand Noninterest Income $ 1.4 million $ 6.2 million $ 5.5 million Noninterest Expenses $ 6.2 million $ 28.6 million $ 28.9 million Salaries and Benefits $ 2.9 million $ 12.7 million $ 13.4 million OREO Expenses $ 359 thousand $ 2.3 million $ 2.3 million 18 |
 Return on Average Assets December 31, 2010 through March 31, 2015 -1.05% -1.07% -0.86% 0.21% 0.04% 0.38% -1.25% -1.00% -0.75% -0.50% -0.25% 0.00% 0.25% 0.50% 2010 2011 2012 2013 2014 2015 1st QTR Return on Average Assets 19 |
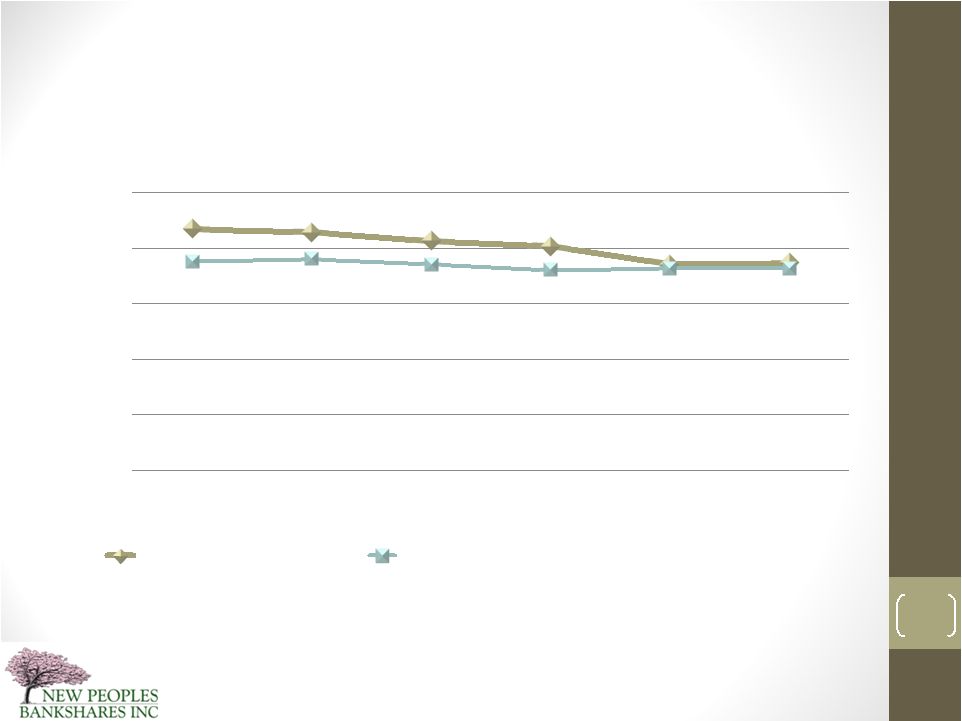 Net Interest Margin Trend December 31, 2010 through March 31, 2015 4.35% 4.29% 4.13% 4.03% 3.71% 3.74% 3.76% 3.81% 3.71% 3.61% 3.64% 3.64% 0.00% 1.00% 2.00% 3.00% 4.00% 5.00% 2010 2011 2012 2013 2014 2015 Net Interest Margin Peer Data BHC $500 Million to $1 Billion 20 Peer Data Source: Federal Reserve Board of Governors Bank Holding Company Performance Report |
 Increase Capital
21 |
 2014 Capital Improvements • Issued 1,006,361 shares of common stock at $1.75 per share via warrants being exercised, of which the majority was from the Board and Management • Received regulatory approval to pay the deferred interest payments and first quarter 2015 payment on trust preferred securities 22 |
 Improving Our Capital Position 23 Capital Ratios (Bank only) March 31, 2015 December 31, 2014 December 31, 2013 Equity to Assets Ratio* 6.64% 6.58% 5.84% Tier 1 Leverage Ratio 8.88% 8.19% 7.49% Tier 1 Risk Based Capital Ratio 15.17% 14.46% 12.69% Total Risk Based Capital Ratio 16.44% 15.73% 13.96% NPB Goals Tier 1 Leverage Ratio 9% Tier 1 Risk Based Capital Ratio 13% Total Risk Based Capital Ratio 15% *consolidated |
 Capital Ratio Trend – Actual Tier 1 Leverage Ratio (Bank Only)
December 31, 2010 through March 31, 2015
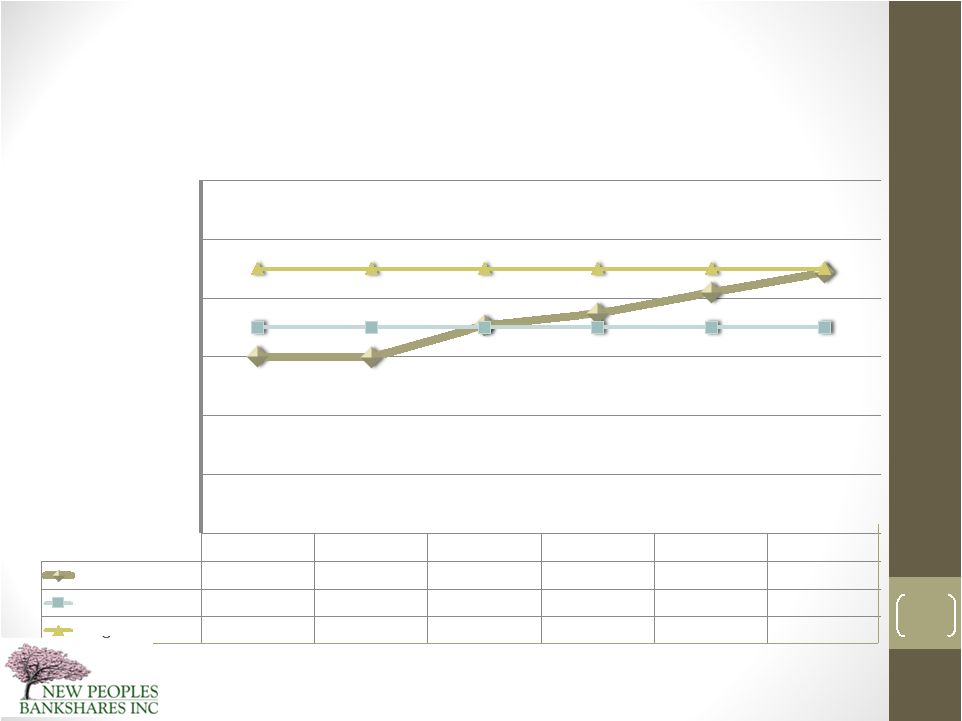
2010 2011 2012 2013 2014 2015 Leverage Ratio 6.00% 5.99% 7.08% 7.49% 8.19% 8.88% Short Term Goal 7.00% 7.00% 7.00% 7.00% 7.00% 7.00% Long Term Goal 9.00% 9.00% 9.00% 9.00% 9.00% 9.00% 0.00% 2.00% 4.00% 6.00% 8.00% 10.00% 12.00% 24 |
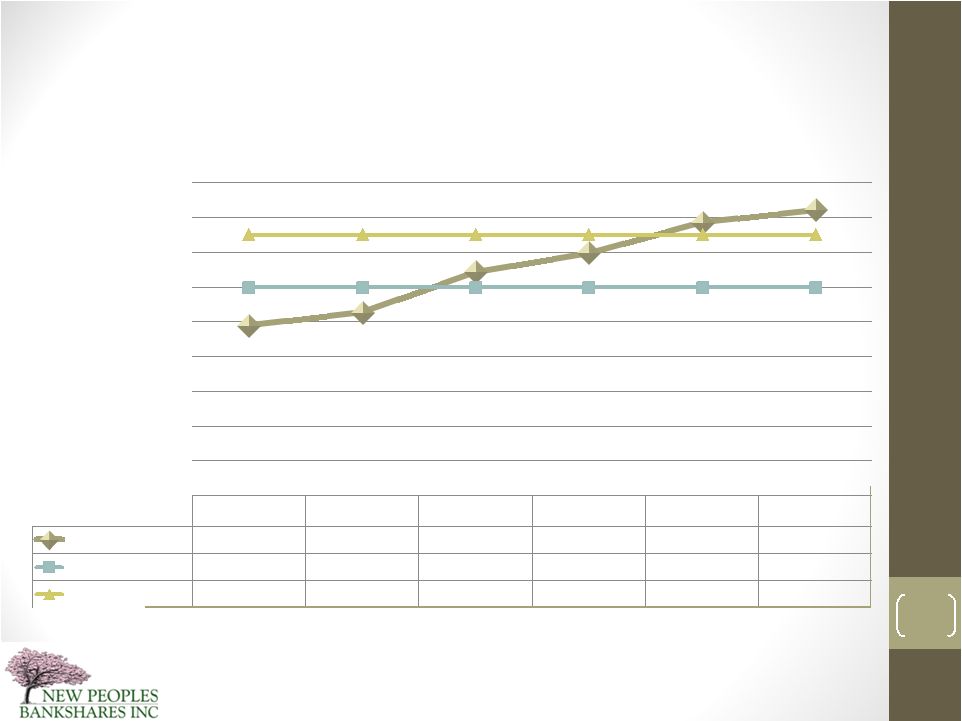 Capital Ratio Trend – Actual Total Risk Based Capital Ratio (Bank Only) December 31, 2010 through March 31, 2015 2010 2011 2012 2013 2014 2015 RBC Ratio 9.79% 10.56% 12.88% 13.96% 15.73% 16.44% Short Term Goal 12.00% 12.00% 12.00% 12.00% 12.00% 12.00% Long Term Goal 15.00% 15.00% 15.00% 15.00% 15.00% 15.00% 0.00% 2.00% 4.00% 6.00% 8.00% 10.00% 12.00% 14.00% 16.00% 18.00% 25 |
 Maximize Efficiencies
26 |
 Changing Deposit Mix • We have intentionally worked at shifting the deposit mix to increase non-interest and lower interest deposits and reduce higher cost time deposits • This will help us in the future to be able to better manage our interest expenses when interest rates rise in the future • It also establishes a stronger base of deposits that are more likely to stay with the bank • In the first quarter of 2015, total non-maturity deposits grew $16.7 million while time deposits decreased $8.6 million 27 |
 Deposit Mix (In thousands)
December 31, 2010 through March 31, 2015
2010 2011 2012 2013 2014 2015 Non-Int Bearing $87,839 $109,629 $98,432 $137,745 $143,950 $152,814 Int Bearing DDAs, Savings $168,141 $153,028 $181,945 $134,261 $141,268 $149,113 Time Deposits $510,100 $445,658 $372,473 $346,991 $299,974 $291,397 $0 $100,000 $200,000 $300,000 $400,000 $500,000 $600,000 $700,000 $800,000 $900,000 Deposit Mix 28 |
 Leverage Technology to Improve Efficiencies, Compliance and Customer Service Experience • In late 2014, we made decisions to utilize technology to a greater extent
to improve efficiency
• In 2015, we are: • Creating a customer contact center for more responsive, more efficient customer service • Changing the way we do the origination, underwriting, processing, and documentation of consumer lending • Implementing a technology tool for all bank employees to better serve our customers and increase cross selling of our various products and services • Extending mobile banking services including a mobile banking application which includes mobile deposit capture • Working on implementing online deposit and loan account opening • Exploring a ‘digital’ branch website • Beta testing a “branch of the future” concept that allows us to better
serve our customers and utilize technology to help us do this at the
branch level
29 |
 Optimizing Branch Productivity and Efficiencies • Consolidated the following four branches in the 4 th quarter of 2014: • Bland, VA • Norton, VA • Jonesville, VA • Bluewell, WV • Reduced total full-time-equivalent employees by 21 or 7.95%, in 2014 to 243 • Reduced salary and employee benefits expenses • Negligible impact on deposits • We continue to monitor our branches and are taking appropriate actions to maximize overall branch performance 30 |
 Improve Risk Management
Capabilities
31 |
 Improve Risk Management Capabilities • In the past few years, we have implemented Enterprise Risk Management Practices • The key areas of risk that we monitor and manage are: • Credit • Interest Rate • Liquidity • Price • Operational • Compliance/ Legal • Strategic • Reputation • We utilize this new management process to help us determine capital levels
needed, to identify where our highest risks are and to place the necessary
attention to these areas to reduce them to more acceptable
levels •
We believe that we are ahead of many financial institutions in our risk
management practices
• Our highest levels of risk are currently related to Credit Risk and Pricing Risk
32 |
 Continue to Recruit, Develop
and Support Our People
33 * * * * * * * * |
 Continue to Recruit, Develop and Support Our People • 243 full-time-equivalent employees at year end • We are working on the following things to accomplish this goal • Continue to further develop a management development program • Recruit talented commercial lenders, credit management, insurance salespeople, and investment advisors • Review and update our succession planning throughout the organization • Enhance Board oversight and governance • Continue to improve organization communication • Develop incentive compensation plan tied to performance 34 |
 Looking Forward
35 |
 Strategic Priorities LONG-TERM PRIORITIES (2-5 years) Enhance shareholder liquidity, value and return Differentiate ourselves from the competition through superior service and our local market presence Continue targeted growth in clearly defined segments Expand on building a growing portfolio of low cost relationship-based deposits Continue to develop and support our people |
 Financial Goals 2015-2017 2015 2016 2017 Financial Assets $635M $650M $668M Asset Growth -3.24% 2.37% 2.82% Loan Growth -0.58% 1.33% 3.23% Deposit Growth -4.01% 2.22% 2.38% Return on Average Assets 0.57% 0.68% 1.01% Return on Average Equity 6.14% 6.88% 9.84 % Net Interest Margin >3.85% >3.90% >4.00% Non-Interest Income >0.85% >0.90% >0.90% *Non-Performing Assets as % of Total Assets <6.0% <4.0% <3.25% Classified Assets to Tier 1+ALLL ratio <50% <40% <30% Tier 1 Capital Leverage >8.00% >8.50% >8.50% Operating DDA/Int Chking /MMA as % of Total Deposits >48% >50% >50% Efficiency <90% <85% <80% *Includes TDRs |
 FIRST QUARTER-2015 • Net income of $622 thousand, or $.03 per share • Total assets grew $9.0 million to $660.1 million • Total non-maturity deposits grew $16.7 million while time deposits decreased $8.6 million • Total equity was $43.9 million at quarter end • The Company is considered well-capitalized under regulatory standards • Nonperforming assets declined $1.3 million • The allowance for loan loss was 1.99% of total loans at quarter end • No provision for loan losses taken 38 |
 For You the Shareholder • We are working to make New Peoples Bankshares a high performing financial institution • We desire to enhance profitability in the next 5 years to recover the $17.0 million in retained deficit of losses so we may pay a cash dividend • We will strive to make your investment more secure by ensuring that your money is invested in a strong, well capitalized and well managed company • We will remain locally owned and operated…your bank from your community • We will strive to increase liquidity in your stock so that when you desire, you may buy or sell your stock more readily • We work for you and we will do our very best to reward you and to make you happy as an investor of New Peoples Bankshares 39 |
 Summary 2014 was a year of improvements A profitable year, albeit a nominal profit Capital ratios improved across the board Asset Quality is improving and showing positive trends (no provisions take
in 2015) The bank is substantially compliant with the Written Agreement The Company’s balance sheet, personnel, and footprint are well positioned
heading into 2015
We are optimistic about the immediate and long-term future; however,
we still are working through the asset quality issues of the past,
but we are making significant headway for a safe and profitable
future Thank you!
40 |
 Thank you! 41 |
 Questions and Answers 42 |