Attached files
| file | filename |
|---|---|
| EX-32 - EXHIBIT 32 - NEW PEOPLES BANKSHARES INC | dex32.htm |
| EX-21 - EXHIBIT 21 - NEW PEOPLES BANKSHARES INC | dex21.htm |
| EX-23.1 - EXHIBIT 23.1 - NEW PEOPLES BANKSHARES INC | dex231.htm |
| EX-31.1 - EXHIBIT 31.1 - NEW PEOPLES BANKSHARES INC | dex311.htm |
| EX-31.2 - EXHIBIT 31.2 - NEW PEOPLES BANKSHARES INC | dex312.htm |
Table of Contents
United States
Securities and Exchange Commission
Washington, D.C. 20549
FORM 10-K
| x | ANNUAL REPORT PURSUANT TO SECTION 13 OR 15(d) OF THE SECURITIES EXCHANGE ACT OF 1934 |
For fiscal year ended December 31, 2009
Commission File Number 000-33411
New Peoples Bankshares, Inc.
(Exact name of registrant as specified in its charter)
| Virginia | 31-1804543 | |
| (State or other jurisdiction of incorporation or organization) |
(I.R.S. Employer Identification No.) | |
| 67 Commerce Drive Honaker, VA |
24260 | |
| (Address of principal executive offices) | (Zip Code) | |
Registrant’s telephone number, including area code (276) 873-7000
Securities registered pursuant to Section 12(b) of the Act:
None
Securities registered pursuant to Section 12(g) of the Act:
Common Stock - $2 Par Value
Indicate by check mark if the registrant is a well-known seasoned issuer, as defined in Rule 405 of the Securities Act. Yes ¨ No x
Indicate by check mark if the registrant is not required to file reports pursuant to Section 13 of Section 15 (d) of the Act. Yes ¨ No x
Indicate by check mark whether the registrant (1) has filed all reports required to be filed by Section 13 or 15(d) of the Securities Exchange Act of 1934 during the preceding 12 months (or for such shorter period that the registrant was required to file such reports), and (2) has been subject to such filing requirements for the past 90 days. Yes ¨ No x
Indicate by check mark whether the registrant has submitted electronically and posted on its corporate Web site, if any, every Interactive Data File required to be submitted and posted pursuant to Rule 405 of Regulation S-T (§232.405 of this chapter) during the preceding 12 months (or for such shorter period that the registrant was required to submit and post such files). Yes ¨ No ¨
Indicate by check mark if disclosure of delinquent filers pursuant to Item 405 of Regulation S-K Section 229.405 is not contained herein, and will not be contained, to the best of registrant’s knowledge, in definitive proxy or information statements incorporated by reference in Part III of this Form 10-K or any amendment to this Form 10-K. ¨
Indicate by check mark whether the registrant is a large accelerated filer, an accelerated filer, a non-accelerated filer, or a smaller reporting company. See the definitions of “large accelerated filer” , “accelerated filer,” and “smaller reporting company” in Rule 12b-2 of the Exchange Act. (Check one):
| Large accelerated filer | ¨ | Accelerated filer | x | |||
| Non-accelerated filer |
¨ (Do not check if smaller reporting company) | Smaller reporting company | ¨ | |||
Indicate by check mark whether the registrant is a shell company (as defined in Rule 12b-2 of the Act). Yes ¨ No x
The aggregate market value of the common stock held by non-affiliates, based on the last reported sales prices of $10.00 per share on the last business day of the second quarter of 2009 was $88,036,560.00.
The number of shares outstanding of the registrant’s common stock was 10,009,037 as of March 15, 2010.
DOCUMENTS INCORPORATED BY REFERENCE:
Items 10 through 14 are incorporated by reference to the annual proxy statement.
Table of Contents
2
Table of Contents
PART I
| Item 1. | Business |
General
New Peoples Bankshares, Inc. (New Peoples) is a Virginia bank holding company headquartered in Honaker, Virginia. Prior to January 1, 2009, New Peoples was a financial holding company. New Peoples subsidiaries include: New Peoples Bank, Inc., a Virginia banking corporation (the Bank) and NPB Web Services, Inc., a web design and hosting company (NPB Web). In July 2004, NPB Capital Trust I was formed for the issuance of trust preferred securities. In September 2006, NPB Capital Trust 2 was formed for the issuance of trust preferred securities. NPB Financial Services, Inc., an insurance and investment services corporation (NPB Financial) was a subsidiary of New Peoples until January 1, 2009 when it became a subsidiary of the Bank.
The Bank offers a range of banking and related financial services focused primarily on serving individuals, small to medium size businesses, and the professional community. We strive to serve the banking needs of our customers while developing personal, hometown relationships with them. Our board of directors believes that marketing customized banking services enables us to establish a niche in the financial services marketplace where we do business.
The Bank is headquartered in Honaker, Virginia and operates 31 full service offices in the southwestern Virginia counties of Russell, Scott, Washington, Tazewell, Buchanan, Dickenson, Wise, Lee, Smyth, and Bland; Mercer County in southern West Virginia and the eastern Tennessee counties of Sullivan and Washington. The close proximity and mobile nature of individuals and businesses in adjoining counties and nearby cities in Virginia, West Virginia and Tennessee places these markets within our bank’s targeted trade area, as well.
We provide professionals and small and medium size businesses in our market area with responsive and technologically advanced banking services. These services include loans that are priced on a deposit relationship basis, easy access to our decision makers, and quick and innovative action necessary to meet a customer’s banking needs. Our capitalization and lending limit enable us to satisfy the credit needs of a large portion of the targeted market segment. When a customer needs a loan that exceeds our lending limit, we try to find other financial institutions to participate in the loan with us.
Our History
The Bank was incorporated under the laws of the Commonwealth of Virginia on December 9, 1997 and began operations on October 28, 1998. On September 27, 2001, the shareholders of the Bank approved a plan of reorganization under which they exchanged their shares of Bank common stock for shares of New Peoples common stock. On November 30, 2001, the reorganization was completed and the Bank became New Peoples’ wholly owned subsidiary.
In June 2003, New Peoples formed two new wholly-owned subsidiaries, NPB Financial Services, Inc. and NPB Web Services, Inc.
NPB Financial is a full-service insurance and investment firm, dealing in personal and group life, health, and disability products, along with mutual funds, fixed rate annuities, variable annuities, fee based asset management and other investment products through a broker/dealer relationship with UVEST Financial Services, Inc.
NPB Web is an internet web site development and hosting company. It produces custom designed web pages for use on the world wide web and serves as a web site host for customers and non-profit organizations. It also develops the web sites of other New Peoples’ subsidiaries and supplies advertising and marketing expertise for New Peoples.
In July 2004, NPB Capital Trust I was formed to issue $11.3 million in trust preferred securities.
In September 2006, NPB Capital Trust 2 was formed to issue $5.2 million in trust preferred securities.
3
Table of Contents
Location and Market Area
We initially opened with full service branches in Honaker and Weber City, Virginia and in 1999 opened a full service branch in Castlewood, Virginia. During 2000, we opened full service branches in Haysi and Lebanon, Virginia. During 2001, we opened branches in Pounding Mill, Virginia and Princeton, West Virginia. In 2002, we opened branch offices in Gate City, Clintwood, Big Stone Gap, Tazewell and Davenport, Virginia. During 2003, we expanded into Grundy, Dungannon, and Bristol, Virginia. We expanded into Tennessee and opened an office in Bloomingdale, Tennessee in 2003, as well. In 2004, we opened offices in Richlands, Abingdon, and Bristol, Virginia. In 2005 full service branches were opened in Bluefield and Cleveland, Virginia. During 2006, we opened full service branches in Esserville, Pound, and Lee County, Virginia and Jonesborough, Tennessee. During 2007, we opened full service offices in Bland, and Chilhowie, Virginia; and Bramwell, West Virginia. We purchased two operating branches from another bank, including deposits and loans located in Norton and Pennington Gap, Virginia in June 2007. During 2008, we opened one full service office in Bluewell, West Virginia.
In order to open additional banking offices, we must obtain prior regulatory approval which takes into account a number of factors, including, among others, a determination that we have adequate capital and a finding that the public interest will be served.
Internet Site
In March 2001, we opened our internet banking site at www.newpeoplesbank.com. The site includes a customer service area that contains branch and ATM locations, product descriptions and current interest rates offered on deposit accounts. Customers with internet access can access account balances, make transfers between accounts, enter stop payment orders, order checks, and use an optional bill paying service.
Available Information
We file annual, quarterly, and current reports, proxy statements and other information with the Securities and Exchange Commission (the SEC). Our SEC filings are filed electronically and are available to the public over the internet at the SEC’s web site at www.sec.gov. In addition, any document we file with the SEC can be read and copied at the SEC’s public reference facilities at 100 F Street, N.E., Washington, D.C. 20549. Copies of documents can be obtained at prescribed rates by writing to the Public Reference Section of the SEC at 100 F Street, N.E., Washington, D.C. 20549. The public may obtain information on the operation of the Public Reference Room by calling the SEC at 1-800-SEC-0330. We also provide a link to our filings on the SEC website, free of charge, through our internet website www.npbankshares.com under “Investor Relations.”
Banking Services
General. We accept deposits, make consumer and commercial loans, issue drafts, and provide other services customarily offered by a commercial bank, such as business and personal checking and savings accounts, walk-up tellers, drive-in windows, and 24-hour automated teller machines. The Bank is a member of the Federal Reserve System and its deposits are insured under the Federal Deposit Insurance Act to the limits provided thereunder.
We offer a full range of short-to-medium term commercial and personal loans. Commercial loans include both secured and unsecured loans for working capital (including inventory and receivables), business expansion (including acquisition of real estate and improvements) and purchase of equipment and machinery. Consumer loans may include secured and unsecured loans for financing automobiles, home improvements, education, personal investments and other purposes.
Our lending activities are subject to a variety of lending limits imposed by state law. While differing limits apply in certain circumstances based on the type of loan or the nature of the borrower (including the borrower’s relationship to the Bank), in general, the Bank is subject to a loan-to-one borrower limit of an amount equal to 15% of its capital and surplus in the case of loans which are not fully secured by readily marketable or other permissible types of collateral. The Bank voluntarily may choose to impose a policy limit on loans to a single borrower that is less than the legal lending limit.
We obtain short-to-medium term commercial and personal loans through direct solicitation of business owners and continued business from existing customers. Completed loan applications are reviewed by our loan officers. As part of the application process, information is obtained concerning the income, financial condition, employment and credit history of the applicant. If commercial real estate is involved, information is also obtained concerning cash flow after debt service. Loan quality is analyzed based on the Bank’s experience and its credit underwriting guidelines.
4
Table of Contents
Loans by type as a percentage of total loans are as follows:
| December 31, | |||||||||||||||
| 2009 | 2008 | 2007 | 2006 | 2005 | |||||||||||
| Commercial, financial and agricultural |
15.56 | % | 15.26 | % | 17.77 | % | 18.34 | % | 20.08 | % | |||||
| Real estate – construction |
9.41 | % | 8.96 | % | 5.63 | % | 6.63 | % | 5.61 | % | |||||
| Real estate – mortgage |
66.02 | % | 67.04 | % | 67.87 | % | 65.18 | % | 64.47 | % | |||||
| Installment loans to individuals |
9.01 | % | 8.74 | % | 8.73 | % | 9.85 | % | 9.84 | % | |||||
| Total |
100.00 | % | 100.00 | % | 100.00 | % | 100.00 | % | 100.00 | % | |||||
Commercial Loans. We make commercial loans to qualified businesses in our market area. Our commercial lending consists primarily of commercial and industrial loans to finance accounts receivable, inventory, property, plant and equipment. Commercial business loans generally have a higher degree of risk than residential mortgage loans, but have commensurately higher yields. Residential mortgage loans generally are made on the basis of the borrower’s ability to make repayment from employment and other income and are secured by real estate whose value tends to be easily ascertainable. In contrast, commercial business loans typically are made on the basis of the borrower’s ability to make repayment from cash flow from its business and are secured by business assets, such as commercial real estate, accounts receivable, equipment and inventory. As a result, the availability of funds for the repayment of commercial business loans may be substantially dependent on the success of the business itself.
Further, the collateral for commercial business loans may depreciate over time and cannot be appraised with as much precision as residential real estate. To manage these risks, our underwriting guidelines require us to secure commercial loans with both the assets of the borrowing business and other additional collateral and guarantees that may be available. In addition, we actively monitor certain measures of the borrower, including advance rate, cash flow, collateral value and other appropriate credit factors.
Residential Mortgage Loans. Our residential mortgage loans consist of residential first and second mortgage loans, residential construction loans, home equity lines of credit and term loans secured by first and second mortgages on the residences of borrowers for home improvements, education and other personal expenditures. We make mortgage loans with a variety of terms, including fixed and floating or variable rates and a variety of maturities.
Under our underwriting guidelines, residential mortgage loans generally are made on the basis of the borrower’s ability to make repayment from employment and other income and are secured by real estate whose value tends to be easily ascertainable. These loans are made consistent with the appraisal policies and real estate lending policies, which detail maximum loan-to-value ratios and maturities.
Construction Loans. Construction lending entails significant additional risks, compared to residential mortgage lending. Construction loans often involve larger loan balances concentrated with single borrowers or groups of related borrowers. Construction loans also involve additional risks attributable to the fact that loan funds are advanced upon the security of property under construction, which is of uncertain value prior to the completion of construction. Thus, it is more difficult to evaluate accurately the total loan funds required to complete a project and related loan-to-value ratios. To minimize the risks associated with construction lending, loan-to-value limitations for residential, multi-family and non-residential construction loans are in place. These are in addition to the usual credit analysis of borrowers. Management feels that the loan-to-value ratios help to minimize the risk of loss and to compensate for fluctuations in the real estate market. Maturities for construction loans generally range from 4 to 12 months for residential property and from 6 to 18 months for non-residential and multi-family properties.
Consumer Loans. Our consumer loans consist primarily of installment loans to individuals for personal, family and household purposes. The specific types of consumer loans that we make include home improvement loans, debt consolidation loans and general consumer lending. Consumer loans entail greater risk than residential mortgage loans do, particularly in the case of consumer loans that are unsecured, such as lines of credit, or secured by rapidly depreciating assets such as automobiles. In such cases, any repossessed collateral for a defaulted consumer loan may not provide an adequate source of repayment of the outstanding loan balance as a result of the greater likelihood of damage, loss or depreciation. The remaining deficiency often does not warrant further substantial collection efforts against the borrower. In addition, consumer loan collections are dependent on the borrower’s continuing financial stability, and thus are more likely to be adversely affected by job loss, divorce, illness or personal bankruptcy. Furthermore, the application of various federal and state laws, including federal and state bankruptcy and insolvency laws, may limit the amount which can be recovered on such loans. A borrower may also be able to assert against the Bank as an assignee any claims and defenses that it has against the seller of the underlying collateral.
5
Table of Contents
Our underwriting policy for consumer loans seek to moderate risk and minimize losses, primarily through a careful analysis of the borrower. In evaluating consumer loans, we require our lending officers to review the borrower’s level and stability of income, past credit history and the impact of these factors on the ability of the borrower to repay the loan in a timely manner. In addition, we maintain an appropriate margin between the loan amount and collateral value.
Other Bank Services. Other bank services include safe deposit boxes, cashier’s checks, certain cash management services, traveler’s checks, direct deposit of payroll and social security checks and automatic drafts for various accounts. We offer ATM card services that can be used by our customers throughout Virginia and other regions. We also offer MasterCard and VISA credit card services through an intermediary. Electronic banking services include debit cards, internet banking, telephone banking and wire transfers.
We do not presently anticipate exercising trust powers, but we are able to provide similar services through our affiliation with UVEST Financial Services, Inc.
Competition
The banking business is highly competitive. We compete as a financial intermediary with other commercial banks, savings and loan associations, credit unions, mortgage banking firms, consumer finance companies, securities brokerage firms, insurance companies, money market mutual funds and other financial institutions operating in the southwestern Virginia, southern West Virginia, and eastern Tennessee market area and elsewhere. Our market area is a highly competitive, highly branched banking market.
Competition in the market area for loans to small businesses and professionals, the Bank’s target market, is intense, and pricing is important. Many of our competitors have substantially greater resources and lending limits than we have. They offer certain services, such as extensive and established branch networks and trust services that we do not expect to provide or will not provide in the near future. Moreover, larger institutions operating in the market area have access to borrowed funds at lower costs than are available to us. Deposit competition among institutions in the market area also is strong. As a result, it is possible that we may pay above-market rates to attract deposits.
While pricing is important, our principal method of competition is service. As a community banking organization, we strive to serve the banking needs of our customers while developing personal, hometown relationships with them. As a result, we provide a significant amount of service and a range of products without the fees that customers can expect from larger banking institutions.
According to a market share report prepared by the Federal Deposit Insurance Corporation (the FDIC), as of June 30, 2009, the most recent date for which market share information is available, the Bank’s deposits as a percentage of total deposits in its major market areas were as follows: Russell County, VA – 29.87%, Scott County, VA – 34.39%, Dickenson County, VA – 23.92%, Tazewell County, VA – 7.87%, Smyth County, VA – 2.26%, Lee County, VA – 6.77%, Buchanan County, VA – 10.74%, Wise County, VA – 10.92%, city of Norton, VA – 22.36%, Bland County, VA – 28.92%, combined Washington County, VA and the City of Bristol, VA – 3.07%, Mercer County, WV – 9.04%, Sullivan County, TN – 0.67%, and Washington County, TN – 0.47%.
Employees
As of December 31, 2009, we had 367 total employees, of which 341 were full-time employees. None of our employees is covered by a collective bargaining agreement, and we consider relations with employees to be excellent.
Supervision and Regulation
General. As a bank holding company, we are subject to regulation under the Bank Holding Company Act of 1956, as amended (“BHCA”), and the examination and reporting requirements of the Board of Governors of the Federal Reserve System (the “Federal Reserve”). We are also subject to Chapter 13 of the Virginia Banking Act, as amended (“Virginia Act”). As a state-chartered commercial bank, the Bank is subject to regulation, supervision and examination by the Virginia State Corporation Commission’s Bureau of Financial Institutions (“BFI”). As a member of the Federal Reserve system, the Bank is also subject to regulation, supervision and examination by the Federal Reserve. Other federal and state laws, including various consumer protection and compliance laws, govern the activities of the Bank, such as the investments that it makes and the aggregate amount of loans that it may grant to one borrower.
6
Table of Contents
The following description summarizes the most significant federal and state laws applicable to New Peoples and its subsidiaries. To the extent that statutory or regulatory provisions are described, the description is qualified in its entirety by reference to that particular statutory or regulatory provision.
The Bank Holding Company Act. Under the BHCA, the Federal Reserve examines New Peoples periodically. New Peoples is also required to file periodic reports and provide any additional information that the Federal Reserve may require. Activities at the bank holding company level are generally limited to:
| • | banking, managing or controlling banks; |
| • | furnishing services to or performing services for its subsidiaries; and |
| • | engaging in other activities that the Federal Reserve has determined by regulation or order to be so closely related to banking as to be a proper incident to these activities. |
Thus, the activities we can engage in are restricted as a matter of law.
With some limited exceptions, the BHCA requires every bank holding company to obtain the prior approval of the Federal Reserve before:
| • | acquiring substantially all the assets of any bank; |
| • | acquiring direct or indirect ownership or control of any voting shares of any bank if after such acquisition it would own or control more than 5% of the voting shares of such bank (unless it already owns or controls the majority of such shares); or |
| • | merging or consolidating with another bank holding company. |
As a result, our ability to engage in certain strategic activities is conditioned on regulatory approval.
In addition, and subject to some exceptions, the BHCA and the Change in Bank Control Act require Federal Reserve approval prior to any person or company acquiring “control” of a bank holding company as defined in the statutes and regulations. These requirements make it more difficult for control of our company to change.
The Virginia Act. As a bank holding company registered with the BFI, we must provide the BFI with information concerning our financial condition, operations and management, among other reports required by the BFI. New Peoples is also examined by the BFI in addition to its Federal Reserve examinations. Similar to the BHCA, the Virginia Act requires that the BFI approve the acquisition of direct or indirect ownership or control of more than 5% of the voting shares of any Virginia bank or bank holding company like us.
Payment of Dividends. New Peoples is a separate legal entity that derives the majority of its revenues from dividends paid to it by its subsidiaries. The Bank is subject to laws and regulations that limit the amount of dividends it can pay. In addition, both New Peoples and the Bank are subject to various regulatory restrictions relating to the payment of dividends, including requirements to maintain capital at or above regulatory minimums. Banking regulators have indicated that banking organizations should generally pay dividends only if the organization’s net income available to common shareholders over the past year has been sufficient to fully fund the dividends and the prospective rate of earnings retention appears consistent with the organization’s capital needs, asset quality and overall financial condition. The FDIC has the general authority to limit the dividends paid by FDIC insured banks if the FDIC deems the payment to be an unsafe and unsound practice. The FDIC has indicated that paying dividends that deplete a bank’s capital base to an inadequate level would be an unsound and unsafe banking practice. . During the year ended December 31, 2009 the Bank declared and paid dividends to New Peoples totaling $500 thousand in order to service debt obligations. However, in October 2009, the Federal Reserve Bank of Richmond (“Richmond FRB”) restricted the Bank from paying dividends to the Company. It is therefore highly unlikely that the Company will pay any dividends at least until the Richmond FRB’s restriction is removed.
As the recession continues to impact asset quality and earnings at financial institutions as the above discussion states, the regulatory authorities have broad discretion to, and may, further restrict the payment of dividends by affected financial institutions and this could impact us.
7
Table of Contents
Capital Requirements. The Federal Reserve has issued risk-based and leverage capital guidelines applicable to banking organizations that it supervises. Under the risk-based capital requirements, the Bank is each generally required to maintain a minimum ratio of total capital to risk-weighted assets (including certain off-balance sheet activities, such as standby letters of credit) of 8%. At least half of the total capital must be composed of “Tier 1 Capital”, which is defined as common equity, retained earnings and qualifying perpetual preferred stock, less certain intangibles. The remainder may consist of “Tier 2 Capital”, which is defined as specific subordinated debt, some hybrid capital instruments and other qualifying preferred stock and a limited amount of the loan loss allowance. These risk-based capital standards attempt to measure capital adequacy relative to the institution’s risk profiles. In addition, each of the federal banking regulatory agencies has established minimum leverage capital requirements for banking organizations. Under these requirements, banking organizations must maintain a minimum ratio of Tier 1 capital to adjusted average quarterly assets of between 3% and 5%, subject to federal bank regulatory evaluation of an organization’s overall safety and soundness. The principal objective of the leverage ratio is to constrain the degree to which an institution may leverage its equity capital base. In sum, the capital measures used by the federal banking regulators are:
| • | the Total Capital ratio, which is the total of Tier 1 Capital and Tier 2 Capital; |
| • | the Tier 1 Capital ratio; and |
| • | the leverage ratio. |
Under these regulations, a bank will be:
| • | “well capitalized” if it has a Total Capital ratio of 10% or greater, a Tier 1 Capital ratio of 6% or greater, a leverage ratio of 5% or greater, and is not subject to any written agreement, order, capital directive, or prompt corrective action directive by a federal bank regulatory agency to meet and maintain a specific capital level for any capital measure; |
| • | “adequately capitalized” if it has a Total Capital ratio of 8% or greater, a Tier 1 Capital ratio of 4% or greater, and a leverage ratio of 4% or greater – or 3% in certain circumstances – and is not well capitalized; |
| • | “undercapitalized” if it has a Total Capital ratio of less than 8%, a Tier 1 Capital ratio of less than 4% - or 3% in certain circumstances; |
| • | “significantly undercapitalized” if it has a Total Capital ratio of less than 6%, a Tier 1 Capital ratio of less than 3%, or a leverage ratio of less than 3%; or |
| • | “critically undercapitalized” if its tangible equity is equal to or less than 2% of average quarterly tangible assets, |
The risk-based capital standards of the Federal Reserve explicitly identify concentrations of credit risk and the risk arising from non-traditional activities, as well as an institution’s ability to manage these risks, as important factors to be taken into account by the agency in assessing an institution’s overall capital adequacy. The capital guidelines also provide that an institution’s exposure to a decline in the economic value of its capital due to changes in interest rates be considered as a factor in evaluating a banking organization’s capital adequacy. Thus, the capital level of a bank can be of regulatory concern even if it is “well-capitalized” under the regulatory formula.
The regulators may take various corrective actions with respect to a financial institution considered to be capital deficient. These powers include, but are not limited to, requiring the institution to be recapitalized, prohibiting asset growth, restricting interest rates paid or dividends, requiring prior approval of capital distributions by any bank holding company that controls the institution, requiring divestiture by the institution of its subsidiaries or by the holding company of the institution itself, requiring new election of directors, and requiring the dismissal of directors and officers. As discussed above, in October 2009 the Richmond FRB imposed a prohibition on the Bank paying dividends to preserve capital. Bank holding companies can be called upon to boost their subsidiary bank’s capital and to partially guarantee the institution’s performance under its capital restoration plan. If this occurs, capital which otherwise would be available for holding company purposes, including possible distributions to shareholders, would be required to be downstreamed to one or more subsidiary bank. In this respect, the Richmond FRB also notified New Peoples that we must defer dividends on our trust preferred issuances. As of December 31, 2009, the Bank was “well capitalized,” with a Total Capital ratio of 10.59%; a Tier 1 Capital ratio of 9.76%; and a leverage ratio 7.40%.
8
Table of Contents
Other Safety and Soundness Regulations. There are a number of obligations and restrictions imposed on bank holding companies and their bank subsidiaries by federal law and regulatory policy that are designed to reduce potential loss exposure to the depositors of such depository institutions and to the FDIC insurance funds in the event that the depository institution is insolvent or is in danger of becoming insolvent. For example, the Federal Reserve requires a bank holding company to serve as a source of financial strength to its subsidiary depository institutions and to commit resources to support such institutions in circumstances where it might not do so otherwise. These requirements can restrict the ability of bank holding companies to deploy their capital as they otherwise might.
Interstate Banking and Branching. Banks in Virginia may branch without geographic restriction. Current federal law authorizes interstate acquisitions of banks and bank holding companies without geographic limitation. Bank holding companies may acquire banks in any state without regard to state law except for state laws requiring a minimum time a bank must be in existence to be acquired. The Virginia Act generally permits out of state bank holding companies or banks to acquire Virginia banks or bank holding companies subject to regulatory approval. These laws have the effect of increasing competition in banking markets.
Monetary Policy. The commercial banking business is affected not only by general economic conditions but also by the monetary policies of the Federal Reserve. The Federal Reserve’s monetary policies have had a significant effect on the operating results of commercial banks in the past and are expected to continue to do so in the future. In view of unsettled conditions in the national and international economy and money markets, as well as governmental fiscal and monetary policies their impact on interest rates, deposit levels, loan demand or the business and earnings of the Bank is unpredictable.
Federal Reserve System. Depository institutions that maintain transaction accounts or nonpersonal time deposits are subject to reserve requirements. These reserve requirements are subject to adjustment by the Federal Reserve. Because required reserves must be maintained in the form of vault cash or in a non-interest-bearing account at, or on behalf of, a Federal Reserve Bank, the effect of the reserve requirement is to reduce the amount of the institution’s interest-earning assets.
Transactions with Affiliates. Transactions between banks and their affiliates are governed by Sections 23A and 23B of the Federal Reserve Act. These provisions restrict the amount and provide conditions with respect to loans, investments, transfers of assets and other transactions between New Peoples and the Bank.
Loans to Insiders. The Bank is subject to rules on the amount, terms and risks associated with loans to executive officers, directors, principal shareholders and their related interest.
Community Reinvestment Act. Under the Community Reinvestment Act, depository institutions have an affirmative obligation to assist in meeting the credit needs of their market areas, including low and moderate-income areas, consistent with safe and sound banking practice. The Community Reinvestment Act emphasizes the delivery of bank products and services through branch locations in its market areas and requires banks to keep data reflecting their efforts to assist in its community’s credit needs. Depository institutions are periodically examined for compliance with the Community Reinvestment Act and are periodically assigned ratings in this regard. Banking regulators consider a depository institution’s Community Reinvestment Act rating when reviewing applications to establish new branches, undertake new lines of business, and/or acquire part or all of another depository institution. An unsatisfactory rating can significantly delay or even prohibit regulatory approval of a proposed transaction by a bank holding company or its depository institution subsidiaries. A bank holding company will not be permitted to become a financial holding company and no new activities authorized under the GLBA (see below) may be commenced by a holding company or by a bank financial subsidiary if any of its bank subsidiaries received less than a “satisfactory” rating in its latest Community Reinvestment Act examination. The Bank received a rating of “Satisfactory” at its last Community Reinvestment Act performance evaluation, as of August 3, 2009.
Other Laws. Banks and other depository institutions also are subject to numerous consumer-oriented laws and regulations. These laws, which include the Truth in Lending Act, the Truth in Savings Act, the Real Estate Settlement Procedures Act, the Electronic Funds Transfer Act, the Equal Credit Opportunity Act, the Fair and Accurate Credit Transactions Act of 2003 and the Fair Housing Act, require compliance by depository institutions with various disclosure and consumer information handling requirements. These and other similar laws result in significant costs to financial institutions and create potential liability for financial institutions, including the imposition of regulatory penalties for inadequate compliance.
Gramm-Leach-Bliley Act of 1999. The Gramm-Leach-Bliley Act of 1999 (“GLBA”) covers a broad range of issues, including a repeal of most of the restrictions on affiliations among depository institutions, securities firms and insurance companies.
9
Table of Contents
For example, the GLBA permits unrestricted affiliations between banks and securities firms. It also permits bank holding companies to elect to become financial holding companies, which can engage in a broad range of financial services, including securities activities such as underwriting, dealing, investment, merchant banking, insurance underwriting, sales and brokerage activities. In order to become a financial holding company, a bank holding company and all of its affiliated depository institutions must be well-capitalized, well-managed and have at least a satisfactory Community Reinvestment Act rating. We converted to bank holding company status on January 1, 2009 from “financial holding company.” We believe we adequately provide the products and services our customers currently need or want as a bank holding company.
Essentially GLBA removed many of the limitations on affiliations between commercial banks and their holding companies and other financially related business that had been in place since the Depression. Recently, this effect of GLBA has been the subject of controversy and cited as one of the causes of the financial services crisis. Accordingly, legislation restoring some of the limitations removed by GLBA is a possibility. Any such change would not materially affect us.
The GLBA also provides that the states continue to have the authority to regulate insurance activities, but prohibits the states in most instances from preventing or significantly interfering with the ability of a bank, directly or through an affiliate, to engage in insurance sales, solicitations or cross-marketing activities.
USA Patriot Act. The USA Patriot Act provides for the facilitation of information sharing among governmental entities and financial institutions for the purpose of combating terrorism and money laundering. Regulatory authorities must consider the effectiveness of a financial institution’s anti-money laundering activities, for example, its procedures for effective customer identification, when reviewing bank mergers and acquisitions. Various other laws and regulations require the Bank to cooperate with governmental authorities in respect to counter-terrorism activities. Although it does create a reporting obligation and cost of compliance for the Bank, the USA Patriot Act has not materially affected New Peoples’ products, services or other business activities.
Privacy and Fair Credit Reporting. Financial institutions, such as the Bank, are required to disclose their privacy policies to customers and consumers and require that such customers or consumers be given a choice (through an opt-out notice) to forbid the sharing of nonpublic personal information about them with nonaffiliated third persons. The Bank also requires business partners with whom it shares such information to have adequate security safeguards and to abide by the redisclosure and reuse provisions of applicable law. In addition to adopting federal requirements regarding privacy, individual states are authorized to enact more stringent laws relating to the use of customer information. To date, Virginia has not done so. These privacy laws create compliance obligations and potential liability for the Bank
Sarbanes-Oxley Act. The Sarbanes-Oxley Act of 2002 (the “Sarbanes-Oxley Act”) is intended to increase corporate responsibility, provide enhanced penalties for accounting and auditing improprieties by publicly traded companies and to protect investors by improving the accuracy and reliability of corporate disclosures made pursuant to the securities law. The changes required by the Sarbanes-Oxley Act and its implementing regulations are intended to allow shareholders to monitor the performance of companies and their directors more easily and effectively.
The Sarbanes-Oxley Act generally applies to all domestic companies, such as New Peoples, that file periodic reports with the Securities and Exchange Commission (“SEC”) under the Securities Exchange Act of 1934, as amended. The Sarbanes-Oxley Act includes significant additional disclosure requirements and expanded corporate governance rules and the SEC has adopted extensive additional disclosures, corporate governance provisions and other related rules pursuant to it. New Peoples has expended, and will continue to expend, considerable time and money in complying with the Sarbanes-Oxley Act.
Emergency Economic Stabilization Act of 2008. EESA was enacted in response to the financial crises affecting the banking system and financial markets. Pursuant to the EESA, the U.S. Treasury was given the authority to, among other things, purchase up to $700 billion of mortgages, mortgage-backed securities and certain other financial instruments from financial institutions for the purpose of stabilizing and providing liquidity to the U.S. financial markets.
Pursuant to EESA, the Department of the Treasury implemented the Troubled Asset Relief Program Capital Purchase Program (the “TARP Capital Purchase Program”) under which the Treasury agreed to make $250 billion of capital available to U.S. financial institutions in the form of preferred stock (from the $700 billion authorized by the EESA). Numerous requirements have been imposed on TARP participating financial institutions, particularly requirements related to executive compensation. We did not elect to apply to participate in TARP.
10
Table of Contents
American Recovery and Reinvestment Act of 2009. The ARRA was enacted on February 17, 2009. The ARRA includes a wide variety of programs intended to stimulate the economy and provide for extensive infrastructure, energy, health, and education needs. In addition, the ARRA imposes certain new executive compensation and corporate governance obligations on all current and future TARP Capital Purchase Program recipients until the institution has redeemed the preferred stock, which TARP Capital Purchase Program recipients are now permitted to do under the ARRA without regard to the three year holding period and without the need to raise new capital, subject to approval of its primary federal regulator. Because we did not participate in TARP, we are not affected by these requirements.
Federal Deposit Insurance Corporation. The Bank’s deposits are insured by the Deposit insurance Fund, as administered by the FDIC, to the maximum amount permitted by law. The maximum deposit insurance amount per depositor has been increased from $100,000 to $250,000 until December 31, 2013. Due to the increased number of bank failures resulting from the credit crisis and severe recession, FDIC premiums have materially increased and are likely to increase further. This is a significant expense for us and is likely to continue to be. Additionally, the FDIC has established its Temporary Liquidity Guarantee Program (“TLGP”). Under the transaction account guarantee program of the TLGP, the FDIC fully guarantees, until June 30, 2010, all non-interest-bearing transaction accounts, including NOW accounts with interest rates of 0.5 percent or less and IOLTAs (lawyer trust accounts). Under TLGP’s Debt Guarantee Program, TLGP guaranteed all senior unsecured debt of insured depository institutions or their qualified holding companies issued between October 14, 2008 and June 30, 2009 with a stated maturity greater than 30 days. Institutions were required to opt-out of the TLGP if they did not wish to participate. We elected to participate in the transaction account guarantee program of the TLGP, but opted out of the debt guarantee program.
Future Regulatory Uncertainty. Because federal and state regulation of financial institutions changes regularly and is the subject of constant legislative debate, New Peoples cannot forecast how regulation of financial institutions may change in the future and impact its operations. Although Congress in recent years has sought to reduce the regulatory burden on financial institutions with respect to the approval of specific transactions, New Peoples fully expects that the financial institution industry will remain heavily regulated in the near future and that additional laws or regulations may be adopted further regulating specific banking practices.
| Item 1A. | Risk Factors |
Difficult market conditions have adversely affected our industry.
Continued declines in the housing market over the past year after the previous dramatic declines, with falling home prices and increasing foreclosures, unemployment and under-employment, have negatively impacted the credit performance of real estate related loans and resulted in significant write-downs of asset values by financial institutions. These write-downs, initially of asset-backed securities but spreading to other securities and loans, have caused many financial institutions to seek additional capital, to reduce or eliminate dividends, to merge with larger and stronger institutions and, in some cases, to fail. Reflecting concern about the stability of the financial markets generally and the strength of counterparties, many lenders and institutional investors have reduced providing funding to borrowers, including to other financial institutions. This market turmoil and tightening of credit have led to an increased level of commercial and consumer delinquencies, lack of consumer confidence, increased market volatility and widespread reduction of business activity generally. The resulting economic pressure on consumers and lack of confidence in the financial markets adversely affects our business and results of operations. Market developments may affect consumer confidence levels and may cause further adverse changes in payment patterns, causing increases in delinquencies and default rates, which may impact our charge-offs and provision for credit losses. A worsening of these conditions would likely exacerbate the adverse effects of these difficult market conditions on us and others in the financial institutions industry.
Recent levels of market volatility are unprecedented.
The capital and credit markets experienced volatility and disruption although this appears to have stabilized. In 2009, the volatility and disruption reached unprecedented levels. In some cases, the markets have produced downward pressure on stock prices and credit availability for certain issuers without regard to those issuers’ underlying financial strength. If these levels of market disruption and volatility return, there can be no assurance that we will not experience an adverse effect, which may be material, on our ability to access capital and on our business, financial condition and results of operations.
11
Table of Contents
Liquidity is important to financial institutions and market conditions as well as regulatory actions could adversely affect us in this respect.
The ability of a financial institution to make loans, return funds to its depositors as required and to meet its funding commitments depends to a large measure on a stable deposit base and access to other sources for borrowing such as advances from the Federal Home Loan Bank of Atlanta, overnight federal funds, repurchase agreements and other credit sources. The factors discussed above, the performance of New Peoples in the difficult economic environment and the actions of regulatory authorities in response to these conditions may result in diminished access by us to these liquidity sources, in turn affecting our ability to fund our regular business activities.
The soundness of other financial institutions could adversely affect us.
Our ability to engage in routine funding transactions could be adversely affected by the actions and commercial soundness of other financial institutions. Financial services institutions are interrelated as a result of trading, clearing, counterparty or other relationships. We have exposure to many different industries and counterparties, and we routinely execute transactions with counterparties in the financial industry. As a result, defaults by, or even rumors or questions about, one or more financial services institutions, or the financial services industry generally, have led to market-wide liquidity problems and could lead to losses or defaults by us or by other institutions. Many of these transactions expose us to credit risk in the event of default of our counterparty or client. In addition, our credit risk may be exacerbated when the collateral held by us cannot be realized upon or is liquidated at prices not sufficient to recover the full amount of the financial instrument exposure due us. There is no assurance that any such losses would not materially and adversely affect our results of operations.
The impact on us of recently enacted legislation, in particular the Emergency Economic Stabilization Act of 2008 and American Recovery and Reinvestment Act of 2009 and their implementing regulations, and actions by the FDIC, cannot be predicted at this time.
The programs established or to be established under the EESA, ARRA and Troubled Asset Relief Program may have adverse effects upon us. We may face increased regulation of our industry. Compliance with such regulation may increase our costs and limit our ability to pursue business opportunities. Also, participation in specific programs may subject us to additional restrictions. The affects of participating or not participating in any such programs and the extent of our participation in such programs cannot reliably be determined at this time.
Because there is no market for New Peoples common stock, your ability to readily sell any shares you hold is doubtful.
Our stock is not listed on a stock market, and we have no intention of listing it. If you want to sell shares of our stock, you will need to find a buyer and negotiate the price.
Changes in interest rates could have an adverse effect on our income particularly if we have a period of general inflation.
Our profitability depends to a large extent upon our net interest income. Net interest income is the difference between interest income on interest-earning assets, such as loans and investments, and interest expense on interest-bearing liabilities, such as deposits and borrowings. Our net interest income will be adversely affected if market interest rates change so that the interest we pay on deposits and borrowings increases faster than the interest we earn on loans and investments. Changes in interest rates also affect the value of our loans. An increase in interest rates could adversely affect borrowers’ ability to pay the principal or interest on existing loans or reduce their desire to borrow more money. This may lead to an increase in our nonperforming assets or a decrease in loan originations, either of which could have a material and negative effect on our results of operations. Interest rates are highly sensitive to many factors that are partly or completely outside of our control, including governmental monetary policies, domestic and international economic and political conditions and general economic conditions such as inflation, recession, unemployment and money supply. Fluctuations in market interest rates are neither predictable nor controllable and may have a material and negative effect on our business, financial condition and results of operations.
We have a high concentration of loans secured by real estate and the downturn in the real estate market should it deepen or be extended, could result in additional losses and materially and adversely affect business, financial condition, results of operations and future prospects further.
A significant portion of our loan portfolio is dependent on real estate. In addition to the financial strength and cash flow characteristics of the borrower in each case, we often secure loans with real estate collateral. At December 31, 2009, approximately 75.42% of our loans have real estate as a primary or secondary component of collateral. The real estate collateral in each case provides an alternate source of repayment in the event of default by the borrower and may deteriorate in value during the time the credit is extended. Further adverse changes in the economy affecting values of real estate generally or in our primary markets specifically could significantly impair the value of our collateral and result in further under-collateralization in our portfolio. In such a case, it would be likely that we would be required to increase our provision for loan losses, beyond current provisions, which would negatively affect our results of operations. Liquidation of collateral securing a loan to satisfy the debt during a period of reduced real estate values diminishes our ability to recover fully on defaulted loans by foreclosing and selling the real estate collateral and we would be more likely to suffer losses on defaulted loans. These circumstances could adversely affect our current profitability and financial condition.
12
Table of Contents
If we need additional capital in the future to support our business or to respond to regulatory requirements, we may not be able to obtain it on terms that are favorable. This could negatively affect our performance and the value of our common stock.
While our current business strategy calls for future growth, general economic, market or regulatory conditions impact this strategy. Our ability to raise capital through the sale of additional securities will depend primarily upon our financial condition and the condition of financial markets. To the extent future growth, our performance as affected by the recession, or regulatory requirements dictate the need for us to obtain additional capital, it is likely we may have to obtain additional capital on terms that are disadvantageous to our existing shareholders.
We rely heavily on our management team and the unexpected loss of any of those personnel could adversely affect our operations; we depend on our ability to attract and retain key personnel.
We are a customer-focused and relationship-driven organization. We expect our future growth to be driven in a large part by the relationships maintained with our customers by our executives and senior lending officers. From time to time we enter into employment agreements with certain of our executives. The existence of such agreements, however, does not necessarily assure that we will be able to continue to retain the services of such executives. The unexpected loss of any of our key employees could have a material adverse effect on our business and possibly result in reduced revenues and earnings.
Our reputation as a safe and sound financial institution is an important factor in our success and could be damaged by circumstances some of which we do not control.
We, like all financial institutions, have an important stake in our good reputation among customers, investors and other constituencies. Damage to our reputation can occur under many circumstances. Some of these we can control and some, like litigation or regulatory actions, we cannot fully control. For example, as a result of our most recent examination, the Bank anticipates entering into a formal agreement with its primary regulators. These types of occurrences could adversely affect our business and negatively impact our reputation.
Additional provisions for our allowance for loan losses may adversely affect our results of operations.
We maintain an allowance for loan losses that we believe is a reasonable estimate of known and inherent losses in our loan portfolio. Through a periodic review and consideration of the loan portfolio, management determines the amount of the allowance for loan losses by considering general market conditions, credit quality of the loan portfolio, the collateral supporting the loans and performance of our customers relative to their financial obligations with us. While we added substantially to our allowance for loan losses in 2009 in response to the continued deterioration of the economy, the amount of future losses is susceptible to changes in economic, operating and other conditions, including changes in interest rates, that may be beyond our control, and these losses may exceed our current estimates even though we made a substantial increase in our loan loss reserve in 2009. Rapidly growing loan portfolios are, by their nature, unseasoned. As a result, estimating loan loss allowances is more difficult, and may be more susceptible to changes in estimates, and to losses exceeding estimates, than more seasoned portfolios. Although we believe the allowance for loan losses is a reasonable estimate of known and inherent losses in our loan portfolio, we cannot fully predict such losses or that our loan loss allowance will be adequate in the future. Excessive loan losses could have a material impact on our financial performance. Due to the severe recession, we expect to make additions to our loan loss reserve levels which may affect our short-term earnings.
13
Table of Contents
Federal and state regulators periodically review our allowance for loan losses and may require us to increase our provision for loan losses or recognize further loan charge-offs, based on judgments different than those of our management. Any increase in the amount of our provision or loans charged-off as required by these regulatory agencies could have a negative effect on our operating results.
Lack of seasoning of our loan portfolio may increase the risk of credit defaults in the future, which would adversely affect our financial condition and results of operation.
Although we have experienced lenders who are familiar with their customer base, some of our loans are too new to have exhibited signs of weakness. In addition, recent expansions into new markets increase credit risk. In general, new loans do not begin to show signs of credit deterioration or default until they have been outstanding for some period of time, a process referred to as “seasoning.” As a result, a portfolio of older loans will usually behave more predictably than a newer portfolio, although there can be no assurance that more seasoned loans will be of higher quality or perform better. Because a portion of our loan portfolio is relatively new and the economic recovery continues to be slow, the current level of delinquencies and defaults may not be representative of the level that will prevail, which may be significantly higher than current levels. A higher rate of delinquencies or defaults on loans could cause us to increase our provision for loan losses and otherwise negatively affect our financial condition, results of operations and financial prospects.
Our profitability may suffer because of rapid and unpredictable changes in the highly regulated environment in which we operate.
We are subject to extensive supervision by several governmental regulatory agencies at the federal and state levels. These agencies examine financial and bank holding companies and commercial banks, establish capital and other financial requirements and approve new branches, acquisitions or other changes of control. Our ability to establish new banks or branches or make acquisitions is conditioned on receiving required regulatory approvals from the applicable regulators. Recently enacted, proposed and future banking legislation and regulations have had, and will continue to have, or may have a significant impact on the financial services industry. These regulations, which are intended to protect depositors and not our shareholders, and the interpretation and application of them by federal and state regulators, are beyond our control, may change rapidly and unpredictably and can be expected to influence our earnings and growth. Such changes could subject us to additional costs, limit the types of financial services and products we may offer, increase the ability of non-banks to offer competing financial services and products, and/or assist competitors that are not subject to similar regulation, among other things. Failure to comply with laws, regulations or policies could result in sanctions by regulatory agencies, civil money penalties and damage to our reputation, which could have a material adverse effect on our business, financial condition and results of operation.
The Bank’s ability to pay dividends is subject to regulatory limitations which, to the extent we require such dividends in the future, affects our ability to pay our obligations and pay dividends.
We are a separate legal entity from the Bank and our other subsidiaries and we do not have significant operations of our own. We currently depend on the Bank’s cash and liquidity as well as dividends paid by it to us to pay our operating expenses. As discussed above, in October 2009, the Richmond FRB imposed a restriction which prevents the Bank from paying dividends to us. This adversely impacts the Company because these dividends were a major source of the Company’s income. At the same time the Richmond FRB notified us that we must defer dividends on our trust preferred issues since the source for these payments was the dividends from the Bank. While we anticipate that these restrictions will be eliminated when capital ratios improve, until then the inability to receive dividends from the Bank could adversely affect our financial condition, results of operations, cash flows and prospects.
14
Table of Contents
Our business is subject to various lending and other economic risks that adversely impact our results of operations and financial condition.
Changes in economic conditions, particularly the current and prolonged economic slowdown, hurts our business. Our business is directly affected by political and market conditions, broad trends in industry and finance, legislative and regulatory changes, changes in governmental monetary and fiscal policies and inflation, all of which are beyond our control. We have already been adversely affected by these factors. We are in technical default under the terms of our line of credit with a correspondent bank. This loan is secured by our stock in the Bank. Current conditions make it more difficult for us to replace this line of credit or cure the default. Failure to do so could have a materially negative impact on us. A continuing deterioration in economic conditions, in particular within our geographic region, could result in the following consequences intensifying any of which could further hurt our business materially:
| • | loan delinquencies may increase further; |
| • | problem assets and foreclosures may increase further; |
| • | demand for our products and services may decline further; and |
| • | collateral for loans made by us may decline in value further, in turn reducing a client’s borrowing power, and reducing the value of assets and collateral associated with our loans held for investment. |
Although our market area is somewhat economically diverse, in certain areas the local economies are more reliant upon agriculture and coal mining. To the extent an economic downturn disproportionately affected these two industries, the above-described negative effects could be exacerbated.
The downturn in the real estate market has hurt our business and absent a recovery will continue to do so. Our business activities and credit exposure are concentrated in Virginia, West Virginia and Tennessee and at December 31, 2009, approximately 75.42% of our loans have real estate as a primary or secondary component of collateral. As such, the downturn in this regional real estate market hurts our business because of the geographic concentration within this regional area. If there is a further decline in real estate values in our local markets, the collateral for our loans will provide less security. As a result, our ability to recover on defaulted loans by selling the underlying real estate would be diminished, and we would be more likely to suffer losses on defaulted loans. In addition, we would be required to add to our loan loss reserve which negatively impacts earnings.
We face strong competition from other financial institutions, financial service companies and other organizations offering services similar to those offered by us and our subsidiaries, which could hurt our business.
Our business operations are centered primarily in Virginia, West Virginia, and Tennessee. Increased competition within this region may result in reduced loan originations and deposits. Ultimately, we may not be able to compete successfully against current and future competitors. Many competitors offer the types of loans and banking services that we offer. These competitors include other savings associations, national banks, regional banks and other community banks. We also face competition from many other types of financial institutions, including finance companies, brokerage firms, insurance companies, credit unions, mortgage banks and other financial intermediaries. In particular, the Bank’s competitors include other state and national banks and major financial companies whose greater resources may afford them a marketplace advantage by enabling them to maintain numerous banking locations and to mount extensive promotional and advertising campaigns.
Additionally, banks and other financial institutions with larger capitalization and financial intermediaries not subject to bank regulatory restrictions have larger lending limits and are thereby able to serve the credit needs of larger clients. These institutions, particularly to the extent they are more diversified than us, may be able to offer the same loan products and services that we offer at more competitive rates and prices. If we are unable to attract and retain banking clients, we may be unable to continue the Bank’s loan and deposit growth and our business, financial condition and prospects may be negatively affected.
We may be adversely affected by economic conditions in our markets.
Our banking operations are located primarily in the Virginia counties of Buchanan, Dickenson, Lee, Russell, Scott, Smyth, Tazewell, Washington, and Wise, the West Virginia county of Mercer and the Tennessee counties of Sullivan and Washington. Because our lending is concentrated in this market, we will be affected by the general economic conditions in the area. Changes in the economy may influence the growth rate of our loans and deposits, the quality of the loan portfolio and loan and deposit pricing. A significant further decline in general economic conditions caused by inflation, recession, unemployment or other factors beyond our control would have an additional impact on the demand for banking products and services generally, which could negatively affect our financial condition and performance. We also have lending exposure in the Coastal Carolina market which has been particularly impacted by the real estate recession. Additional declines in this market could adversely affect us further.
15
Table of Contents
Failure to maintain effective systems of internal and disclosure control could have a material adverse effect on our results of operation and financial condition.
Effective internal and disclosure controls are necessary for us to provide reliable financial reports and effectively prevent fraud and to operate successfully as a public company. If we cannot provide reliable financial reports or prevent fraud, our reputation and operating results would be harmed. As part of our ongoing monitoring of internal control we may discover material weaknesses or significant deficiencies in our internal control as defined under standards adopted by the Public Company Accounting Oversight Board, or PCAOB, that require remediation. Under the PCAOB standards, a “material weakness” is a deficiency, or a combination of deficiencies, in internal control over financial reporting, such that there is a reasonable possibility that a material misstatement of the company’s annual or interim financial statements will not be prevented or detected on a timely basis. We have in the past discovered, and may in the future discover, areas of our internal controls that need improvement. As discussed in Item 9A. Controls and Procedures, we identified certain material weaknesses as a result of our assessment of internal controls over financial reporting. These material weaknesses related to the need to update classification codes for real estate and construction loans and the maintenance of an effective control environment. We have taken the remedial actions discussed in Item 9A and have determined that the identified material weaknesses have been remediated. Even so, we are continuing to work to improve our internal controls. We cannot be certain that these measures will ensure that we implement and maintain adequate controls over our financial processes and reporting in the future. Any failure to maintain effective controls or to timely effect any necessary improvement of our internal and disclosure controls could, among other things, result in losses from fraud or error, harm our reputation or cause investors to lose confidence in our reported financial information, all of which could have a material adverse effect on our results of operation and financial condition.
| Item 1B. | Unresolved Staff Comments |
As of March 15, 2010, there were no unresolved comments from the staff of the SEC with respect to any of New Peoples’ periodic or current reports.
| Item 2. | Properties |
At December 31, 2009, the Company’s net investment in premises and equipment in service was $35.0 million. Our main office and operations center is located in Honaker, Virginia. This location contains a full service branch, and our administration and operations center.
The Bank owns 28 of its 31 full service branches. The owned properties in Virginia are located in Abingdon, Big Stone Gap, Bluefield, Bland, Bristol, Castlewood, Chilhowie, Clintwood, Gate City, Grundy, Haysi, Honaker, Jonesville, Lebanon, Norton, Pennington Gap, Pound, Pounding Mill, Richlands, Tazewell, and Weber City. Offices in Princeton, West Virginia and Bloomingdale and Jonesborough, Tennessee are also owned by the Bank.
The Bank has three operating lease arrangements of varying lengths. These full service branches are located in Bramwell, West Virginia and in Cleveland and Davenport, Virginia.
We believe that all of our properties are maintained in good operating condition and are suitable and adequate for our operational needs.
| Item 3. | Legal Proceedings |
In the course of operations, we may become a party to legal proceedings. We are not aware of any material pending or threatened legal proceedings.
| Item 4. | Reserved |
16
Table of Contents
PART II
| Item 5. | Market for Registrant’s Common Equity, Related Stockholder Matters and Issuer Purchases of Equity Securities |
(a) Market Information
The Bank acts as the transfer agent for New Peoples. At present, there is no public trading market for our common stock. Trades in our common stock occur sporadically on a local basis.
The high and low bids known to us of our common stock for each quarter in the past two years are set forth in the table below. These bids are obtained through inquiry by our stock transfer agent of shareholders transferring stock. Other transactions may have occurred at prices about which we are not aware.
| 2009 | 2008 | |||||||||||
| High | Low | High | Low | |||||||||
| 1st quarter |
$ | 12.00 | $ | 9.00 | $ | 15.00 | $ | 10.00 | ||||
| 2nd quarter |
12.00 | 10.00 | 13.00 | 6.00 | ||||||||
| 3rd quarter |
12.00 | 6.56 | 13.00 | 8.68 | ||||||||
| 4th quarter |
10.00 | 4.66 | 12.50 | 9.00 | ||||||||
The most recent sales price of which management is aware was $6.99 per share on March 8, 2010.
(b) Holders
On March 15, 2010, there were approximately 4,405 shareholders of record.
(c) Dividends
On September 12, 2007, we issued a 13 for 10 stock split effected in the form of a stock dividend to all shareholders of record on September 4, 2007. We have never declared a cash dividend. The declaration of dividends in the future will depend on our earnings and capital requirements and compliance with regulatory mandates. We are subject to certain restrictions imposed by the reserve and capital requirements of federal and Virginia banking statutes and regulations. Additionally, we intend to follow a policy of retaining earnings, if any, for the purpose of increasing net worth and reserves in light of the unsettled nature of the current economy. So long as the restriction imposed by the FRB Richmond on the Bank’s ability to pay dividends to the Company remains, the Company is unlikely to have the resources with which to pay a dividend. As a result, we do not anticipate paying a dividend on our common stock in 2010. See Note 16 and Note 23 of the Notes to the Consolidated Financial Statements for further discussion of dividend limitations and capital requirements.
(d) Stock Performance Graph
There currently is not a public trading market for the Company’s Common Stock. The Company, however, is frequently informed of the sales price at which shares of Common Stock are exchanged in privately negotiated transactions. Because shares of Common Stock are not listed or traded on an exchange or in the over-the-counter market, the Company cannot be certain that the prices at which such shares have historically sold are not higher than the prices that would prevail in an active market where securities professionals participate. As a result, the comparisons presented in the following graph do not reflect similar market conditions.
17
Table of Contents
The following graph compares the Company’s cumulative shareholder return on its Common Stock, assuming an initial investment of $100 and reinvestment of all dividends, with the cumulative return on the S&P 500, the NASDAQ Composite, and SNL Securities Bank and Thrift Index using the same assumptions, as of December 31 st of each year since December 31, 2004.
New Peoples Bankshares, Inc.
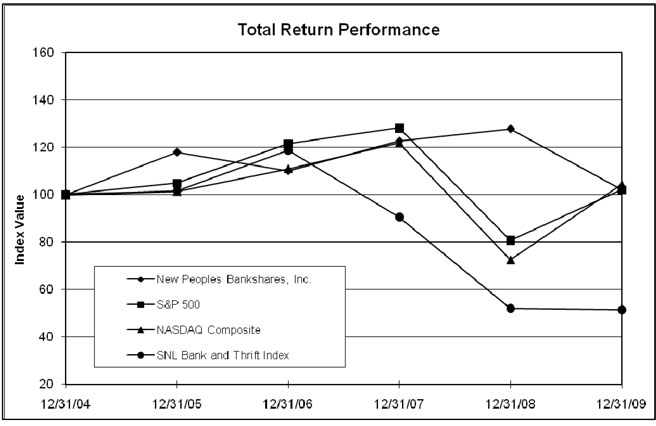
| Period Ending | ||||||||||||
| Index |
12/31/04 | 12/31/05 | 12/31/06 | 12/31/07 | 12/31/08 | 12/31/09 | ||||||
| New Peoples Bankshares, Inc. |
100.00 | 117.86 | 110.00 | 122.57 | 127.68 | 102.14 | ||||||
| S&P 500 |
100.00 | 104.91 | 121.48 | 128.16 | 80.74 | 102.11 | ||||||
| NASDAQ Composite |
100.00 | 101.37 | 111.03 | 121.92 | 72.49 | 104.31 | ||||||
| SNL Bank and Thrift Index |
100.00 | 101.57 | 118.68 | 90.50 | 52.05 | 51.35 | ||||||
Source: SNL Financial LC, Charlottesville, VA
18
Table of Contents
| Item 6. | Selected Financial Data |
The following consolidated summary sets forth selected financial data for us for the periods and at the dates indicated. The selected financial data has been derived from our audited financial statements. The following is qualified in its entirety by the detailed information and the financial statements included elsewhere in this Form 10-K.
| For the Years Ended December 31, | ||||||||||||||||||||
| (Amounts in thousands, except per share data) |
2009 | 2008 | 2007 | 2006 | 2005 | |||||||||||||||
| Income Statement Data | ||||||||||||||||||||
| Gross interest income |
$ | 50,188 | $ | 52,317 | $ | 51,447 | $ | 41,280 | $ | 30,507 | ||||||||||
| Gross interest expense |
18,563 | 23,095 | 25,738 | 19,393 | 11,279 | |||||||||||||||
| Net interest income |
31,815 | 29,222 | 25,709 | 21,887 | 19,228 | |||||||||||||||
| Provision for possible loan losses |
12,841 | 1,500 | 3,840 | 1,277 | 1,130 | |||||||||||||||
| Non-interest income |
5,449 | 6,162 | 4,651 | 3,460 | 2,822 | |||||||||||||||
| Non-interest expense |
29,847 | 27,231 | 23,674 | 19,805 | 16,710 | |||||||||||||||
| Net income (loss) |
(3,686 | ) | 4,737 | 2,870 | 3,090 | 2,723 | ||||||||||||||
| Per Share Data and Shares Outstanding (1) | ||||||||||||||||||||
| Net income (loss), basic |
(0.37 | ) | 0.47 | 0.29 | 0.31 | 0.27 | ||||||||||||||
| Net income (loss), diluted |
(0.37 | ) | 0.46 | 0.28 | 0.30 | 0.26 | ||||||||||||||
| Cash dividends |
— | — | — | — | — | |||||||||||||||
| Book value at end of period |
4.66 | 5.03 | 4.54 | 4.25 | 3.93 | |||||||||||||||
| Tangible book value at period end |
4.21 | 4.56 | 4.06 | 4.25 | 3.93 | |||||||||||||||
| Period-End Balance Sheet Data |
||||||||||||||||||||
| Total assets |
857,910 | 807,898 | 765,951 | 635,819 | 527,770 | |||||||||||||||
| Total loans |
763,570 | 721,174 | 682,260 | 569,198 | 468,045 | |||||||||||||||
| Total allowance for loan losses |
(18,588 | ) | (6,904 | ) | (6,620 | ) | (4,870 | ) | (3,943 | ) | ||||||||||
| Total deposits |
760,714 | 705,688 | 657,033 | 572,187 | 462,692 | |||||||||||||||
| Shareholders’ equity |
46,619 | 50,323 | 45,249 | 42,346 | 38,964 | |||||||||||||||
| Performance Ratios |
||||||||||||||||||||
| Return on average assets |
(0.44 | )% | 0.61 | % | 0.42 | % | 0.54 | % | 0.56 | % | ||||||||||
| Return on average shareholders’ equity |
(7.37 | )% | 9.98 | % | 6.60 | % | 7.61 | % | 7.28 | % | ||||||||||
| Average shareholders’ equity to average assets |
5.94 | % | 6.09 | % | 6.34 | % | 7.06 | % | 7.72 | % | ||||||||||
| Net interest margin (2) |
4.14 | % | 4.13 | % | 4.11 | % | 4.11 | % | 4.38 | % | ||||||||||
| Asset Quality Ratios | ||||||||||||||||||||
| Net charge-offs to average loans |
0.15 | % | 0.17 | % | 0.34 | % | 0.07 | % | 0.07 | % | ||||||||||
| Allowance to period-end gross loans |
2.43 | % | 0.96 | % | 0.97 | % | 0.86 | % | 0.84 | % | ||||||||||
| Nonperforming loans to gross loans |
3.74 | % | 0.89 | % | 0.47 | % | 0.21 | % | 0.12 | % | ||||||||||
| Capital and Liquidity Ratios |
||||||||||||||||||||
| Risk-based: |
||||||||||||||||||||
| Tier 1 capital |
8.12 | % | 9.50 | % | 8.73 | % | 10.84 | % | 11.78 | % | ||||||||||
| Total capital |
9.83 | % | 10.78 | % | 10.29 | % | 12.20 | % | 12.71 | % | ||||||||||
| Leverage capital ratio |
6.14 | % | 7.72 | % | 7.22 | % | 8.94 | % | 9.63 | % | ||||||||||
| Total equity to total assets |
5.43 | % | 6.23 | % | 5.91 | % | 6.66 | % | 7.38 | % | ||||||||||
| (1) | We have adjusted all share amounts and per share data to reflect, a 10% stock dividend in June 2005 and a 13 for 10 stock split effected in the form of a stock dividend in September 2007. |
| (2) | Net interest margin is calculated as tax-equivalent net interest income divided by average earning assets and represents our net yield on our earning assets. |
19
Table of Contents
| Item 7. | Management’s Discussion and Analysis of Financial Condition and Results of Operations |
Caution About Forward Looking Statements
We make forward looking statements in this annual report that are subject to risks and uncertainties. These forward looking statements include statements regarding our profitability, liquidity, allowance for loan losses, interest rate sensitivity, market risk, growth strategy, and financial and other goals. The words “believes,” “expects,” “may,” “will,” “should,” “projects,” “contemplates,” “anticipates,” “forecasts,” “intends,” or other similar words or terms are intended to identify forward looking statements.
These forward looking statements are subject to significant uncertainties because they are based upon or are affected by factors including the following: the difficult market conditions in our industry; the unprecedented levels of market volatility; the effects of soundness of other financial institutions; the uncertain outcome of recently enacted legislation to stabilize the U.S. financial system; the potential impact on us of recently enacted legislation; the lack of a market for our common stock; the ability to successfully manage our growth or implement our growth strategies if we are unable to identify attractive markets, locations or opportunities to expand in the future; maintaining capital levels adequate to support our growth; maintaining cost controls and asset qualities as we open or acquire new branches; the successful management of interest rate risk; changes in interest rates and interest rate policies; reliance on our management team, including our ability to attract and retain key personnel; changes in general economic and business conditions in our market area; risks inherent in making loans such as repayment risks and fluctuating collateral values; competition with other banks and financial institutions, and companies outside of the banking industry, including those companies that have substantially greater access to capital and other resources; demand, development and acceptance of new products and services; problems with technology utilized by us; changing trends in customer profiles and behavior; and changes in banking and other laws and regulations applicable to us.
Because of these uncertainties, our actual future results may be materially different from the results indicated by these forward looking statements. In addition, our past results of operations do not necessarily indicate our future results. We expressly disclaim any obligation to update or revise any forward-looking statements, whether as a result of new information, future events or otherwise, except as required by law.
For additional discussion of risk factors that may cause our actual future results to differ materially from the results indicated within forward looking statements, please see Item 1A – Risk Factors herein.
General
The following commentary discusses major components of our business and presents an overview of our consolidated financial position at December 31, 2009 and 2008 as well as results of operations for the years ended December 31, 2009, 2008 and 2007. This discussion should be reviewed in conjunction with the consolidated financial statements and accompanying notes and other statistical information presented elsewhere in this Form 10-K.
New Peoples generates a significant amount of its income from the net interest income earned by the Bank. Net interest income is the difference between interest income and interest expense. Interest income depends on the amount of interest-earning assets outstanding during the period and the interest rates earned thereon. The Bank’s interest expense is a function of the average amount of deposits and borrowed money outstanding during the period and the interest rates paid thereon. The quality of the assets further influences the amount of interest income lost on nonaccrual loans and the amount of additions to the allowance for loan losses. The Bank also generates noninterest income from service charges on deposit accounts and commissions on insurance and investment products sold.
In October, 2009, New Peoples was notified by the Richmond FRB that we must defer dividends on our trust preferred issuances. Until further notice the Richmond FRB also restricted the Bank from paying dividends to New Peoples which is the source for serving these payments. When capital ratios improve we anticipate the restrictions to be released.
As a result of our most recent examination, the Bank anticipates entering a formal agreement with its primary regulators in 2010.
20
Table of Contents
Overview
At December 31, 2009, New Peoples Bankshares, Inc. reports total assets were $857.9 million, total loans were $763.6 million, and total deposits were $760.7 million. The Company had a total net loss after tax of $3.7 million or $0.37 per basic share and per diluted share for the year ended December 31, 2009 as compared to net income of $4.7 million, or $0.47 per basic share and $0.46 per diluted share for the year ended December 31, 2008. The annualized return on average assets for the fiscal year 2009 was (0.44)% as compared to 0.61% for the same period in 2008. The annualized return on average equity was (7.37)% for the fiscal year 2009 and 9.98% for the same period in 2008.
The net loss for the year ending 2009 is solely related to the $11.3 million increased provision for loan loss. We did this prudentially in light of the current economic circumstances. At December 31, 2009, our allowance for loan loss totaled $18.6 million, or 2.43% of total loans, as compared with a total of $6.9 million, and 0.96% of total loans, in 2008. Net charge-offs year-to-date for 2009 as a percentage of total average loans were 0.15% as compared to 0.17% in 2008. Even though net charge offs actually decreased in 2009, we experienced an increase in impaired loans to $30.1 million with an estimated allowance of $8.8 million for potential losses at December 31, 2009 as compared to $6.8 million in impaired loans with an estimated allowance of $218 thousand at the end of 2008. These factors underlay the significant increase in the allowance for loan loss leading to the net loss for 2009. Given the current high level of unemployment and slow economic recovery, we believe the increased allowance to be appropriate and adequate.
The Bank remains well capitalized as defined by regulatory agencies. The following ratios existed at December 31, 2009: Tier 1 leverage ratio of 7.40%; Tier 1 risk based capital ratio of 9.76%; and Total risk based capital ratio of 10.59%. We anticipate continued capital growth through retained earnings and slower asset growth in the near future.
Asset quality improvement is our main focus. We have made several changes recently to enhance our credit function. For example, we have hired a consulting firm, Credit Risk Management, to assist us in improving credit underwriting, loan portfolio risk management, and loan review. In addition, we have named Sharon V. Borich as our Senior Vice President and Chief Credit Officer with overall responsibility for the credit function of the Bank. We are putting additional emphasis on loan training. We are committed to these enhancements to further strengthen our credit culture. While still meeting loan demand, we are obviously focused on credit quality.
The ratio of nonperforming assets to total assets is 3.99% at December 31, 2009 in comparison to 1.11% at December 31, 2008. Nonperforming assets, which include nonaccrual loans, other real estate owned and past due loans greater than 90 days still accruing interest, were $34.2 million at December 31, 2009 and $8.9 million at December 31, 2008. The majority of these assets are real estate development projects outside of our market area, primarily in the coastal Carolinas. In addition, there are also some similar projects located in Northeastern Tennessee. We are undertaking aggressive efforts to work out these credits. However, this will take some time.
New Peoples Bankshares, Inc. and its subsidiary New Peoples Bank, Inc. has 31 branch locations throughout Southwest Virginia, southern West Virginia, and northeastern Tennessee providing traditional banking, investment and insurance services to its customers.
Critical Accounting Policies
Certain critical accounting policies affect the more significant judgments and estimates used in the preparation of our financial statements. Our most critical accounting policy relates to our provision for loan losses, which reflects the estimated losses resulting from the inability of our customers to make required payments. If the financial condition of our borrowers were to deteriorate, resulting in an impairment of their ability to make payments, our estimates would be updated, and additional provisions could be required. For further discussion of the estimates used in determining the allowance for loan losses, we refer you to the section on “Provision for Loan Losses” in this discussion. For further discussion of our other critical accounting policies, see Note 2, Summary of Significant Accounting Policies, to our Consolidated Financial Statements, found in Item 8 to this annual report on Form 10-K.
Net Interest Income and Net Interest Margin
The Company’s primary source of income, net interest income, increased $2.6 million, or 8.87% from 2008 to 2009. The increase in net interest income is due primarily to an increase in volume of loans and a reduction in the cost of funds. Interest expense decreased $4.5 million, or 19.62%, from $23.1 million for the year ending 2008 to $18.6 million in 2009 as a result of historic low interest rates. The net interest margin for the year ending December 31, 2009 was 4.14% as compared to 4.13% for the same period in 2008. The net interest margin continued to trend upward during the last half of 2009.
21
Table of Contents
Net interest income for the year ended 2008 increased to $29.2 million from $25.5 million in 2007. This was an increase of $3.7 million, or 14.47%. The majority of the growth was related to the increased loan volume during the fiscal 2008. Loan income increased to $51.9 million for 2008 from $50.9 million for 2007, which was an increase of $1.0 million, or 2.02%. Total interest expense was $23.1 million for 2008 as compared to $25.7 million for 2007. This $2.6 million, or 10.3%, decrease resulted mainly from an increase in loan production and a decrease in the cost of funds.
The following table shows the rates paid on earning assets and deposit liabilities for the periods indicated.
Net Interest Margin Analysis
Average Balances, Income and Expense, and Yields and Rates
(Dollars in thousands)
| For the Year Ended December 31, 2009 |
For the Year Ended December 31, 2008 |
For the Year Ended December 31, 2007 |
||||||||||||||||||||||||||||
| Average Balance |
Income/ Expense |
Yields/ Rates |
Average Balance |
Income/ Expense |
Yields/ Rates |
Average Balance |
Income/ Expense |
Yields/ Rates |
||||||||||||||||||||||
| ASSETS |
||||||||||||||||||||||||||||||
| Loans (1), (2), (3) |
$ | 747,971 | $ | 50,188 | 6.71 | % | $ | 697,733 | $ | 51,911 | 7.44 | % | $ | 611,101 | $ | 50,884 | 8.33 | % | ||||||||||||
| Federal funds sold |
10,648 | 26 | 0.24 | % | 1,881 | 35 | 1.86 | % | 2,779 | 129 | 4.64 | % | ||||||||||||||||||
| Other investments (3) |
7,134 | 89 | 1.25 | % | 8,525 | 371 | 4.35 | % | 7,421 | 254 | 3.42 | % | ||||||||||||||||||
| Total Earning Assets |
765,753 | 50,303 | 6.57 | % | 708,139 | 52,317 | 7.39 | % | 621,301 | 51,267 | 8.25 | % | ||||||||||||||||||
| Less: Allowance for loans losses |
(10,245 | ) | (6,756 | ) | (5,280 | ) | ||||||||||||||||||||||||
| Non-earning assets |
87,655 | 78,723 | 69,372 | |||||||||||||||||||||||||||
| Total Assets |
$ | 843,163 | $ | 780,106 | 685,393 | |||||||||||||||||||||||||
| LIABILITIES AND STOCKHOLDERS’ EQUITY |
||||||||||||||||||||||||||||||
| Deposits |
||||||||||||||||||||||||||||||
| Demand – Interest bearing |
$ | 39,384 | $ | 233 | 0.59 | % | $ | 32,192 | $ | 240 | 0.75 | % | $ | 20,957 | $ | 164 | 0.78 | % | ||||||||||||
| Savings |
84,215 | 994 | 1.18 | % | 58,784 | 682 | 1.16 | % | 45,135 | 485 | 1.07 | % | ||||||||||||||||||
| Time deposits |
522,439 | 15,491 | 2.97 | % | 489,788 | 19,817 | 4.05 | % | 458,369 | 22,949 | 5.01 | % | ||||||||||||||||||
| Other Borrowings |
30,937 | 1,312 | 4.24 | % | 37,511 | 1,351 | 3.60 | % | 15,820 | 857 | 5.42 | % | ||||||||||||||||||
| Trust Preferred Securities |
16,496 | 533 | 3.23 | % | 16,496 | 1,005 | 6.09 | % | 16,496 | 1,283 | 7.78 | % | ||||||||||||||||||
| Total interest bearing liabilities |
693,471 | 18,563 | 2.68 | % | 634,771 | 23,095 | 3.64 | % | 556,777 | 25,738 | 4.62 | % | ||||||||||||||||||
| Non-interest bearing deposits |
95,372 | 92,677 | 79,932 | |||||||||||||||||||||||||||
| Other liabilities |
4,278 | 5,186 | 5,206 | |||||||||||||||||||||||||||
| Total Liabilities |
793,121 | 732,634 | 641,915 | |||||||||||||||||||||||||||
| Stockholders’ Equity |
50,042 | 47,472 | 43,477 | |||||||||||||||||||||||||||
| Total Liabilities and Stockholders’ Equity |
$ | 843,163 | $ | 780,106 | 685,393 | |||||||||||||||||||||||||
| Net Interest Income |
$ | 31,740 | $ | 29,222 | $ | 25,529 | ||||||||||||||||||||||||
| Net Interest Margin |
4.14 | % | 4.13 | % | 4.11 | % | ||||||||||||||||||||||||
| Net Interest Spread |
3.89 | % | 3.75 | % | 3.63 | % | ||||||||||||||||||||||||
| (1) | Non-accrual loans have been included in the average balance of loans outstanding. |
| (2) | Loan fees have been included in interest income on loans. |
| (3) | Tax exempt income is not significant and has been treated as fully taxable. |
Net interest income is affected by changes in both average interest rates and average volumes of interest-earning assets and interest-bearing liabilities. The following table sets forth the amounts of the total changes in interest income and expense which can be attributed to rate (change in rate multiplied by old volume) and volume (change in volume multiplied by old rate) for the periods indicated. The change in interest due to both volume and rate has been allocated to the change due to rates.
22
Table of Contents
Volume and Rate Analysis
(Dollars in thousands)
| 2009 Compared to 2008 Increase (Decrease) |
2008 Compared to 2007 Increase (Decrease) |
|||||||||||||||||||||||
| Volume Effect |
Rate Effect |
Change in Interest Income/ Expense |
Volume Effect |
Rate Effect |
Change in Interest Income/ Expense |
|||||||||||||||||||
| Interest Income: |
||||||||||||||||||||||||
| Loans |
$ | 3,738 | $ | (5,461 | ) | $ | (1,723 | ) | $ | 7,214 | $ | (6,187 | ) | $ | 1,027 | |||||||||
| Federal funds sold |
163 | (172 | ) | (9 | ) | (42 | ) | (52 | ) | (94 | ) | |||||||||||||
| Other investments |
(61 | ) | (221 | ) | (282 | ) | 38 | 79 | 117 | |||||||||||||||
| Total Earning Assets |
3,840 | (5,854 | ) | (2,014 | ) | 7,210 | (6,160 | ) | 1,050 | |||||||||||||||
| Interest Bearing Liabilities: |
||||||||||||||||||||||||
| Demand |
54 | (61 | ) | (7 | ) | 88 | (12 | ) | 76 | |||||||||||||||
| Savings |
295 | 17 | 312 | 147 | 50 | 197 | ||||||||||||||||||
| All other time deposits |
1,321 | (5,647 | ) | (4,326 | ) | 1,573 | (4,705 | ) | (3,132 | ) | ||||||||||||||
| Other borrowings |
(237 | ) | 198 | (39 | ) | 1,175 | (681 | ) | 494 | |||||||||||||||
| Trust Preferred Securities |
— | (472 | ) | (472 | ) | — | (278 | ) | (278 | ) | ||||||||||||||
| Total Interest Bearing Liabilities |
1,433 | (5,965 | ) | (4,532 | ) | 2,983 | (5,626 | ) | (2,643 | ) | ||||||||||||||
| Change in Net Interest Income |
$ | 2,407 | $ | 111 | $ | 2,518 | $ | 4,227 | $ | (534 | ) | $ | 3,693 | |||||||||||
Loans
Our primary source of income comes from interest earned on loans receivable. Loan production slowed in 2009 as evidenced by total loans increasing $42.4 million, or 5.88%. We have purposely kept loan growth at a minimum as we remain focused on minimizing credit risks in the loan portfolio in the current economic downturn. We plan to decrease the loan portfolio in the near future as we reduce our exposure to certain risks. Total loans increased $38.9 million and $113.1 million for the years 2008 and 2007, respectively. A schedule of loans by type is set forth immediately below. Approximately 75.42% of the loan portfolio is secured by real estate at the end of 2009.
Loans receivable outstanding are summarized as follows:
| Loan Portfolio December 31, | |||||||||||||||
| (Dollars in thousands) |
2009 | 2008 | 2007 | 2006 | 2005 | ||||||||||
| Commercial, financial and agricultural |
$ | 118,844 | $ | 110,060 | $ | 121,198 | $ | 104,372 | $ | 93,987 | |||||
| Real estate – construction |
71,854 | 64,595 | 38,420 | 37,716 | 26,267 | ||||||||||
| Real estate – mortgage |
504,071 | 483,471 | 463,079 | 371,021 | 301,740 | ||||||||||
| Installment loans to individuals |
68,801 | 63,048 | 59,563 | 56,089 | 46,051 | ||||||||||
| Total |
$ | 763,570 | $ | 721,174 | $ | 682,260 | $ | 569,198 | $ | 468,045 | |||||
23
Table of Contents
Our loan maturities as of December 31, 2009 are shown in the following table:
| Maturities of Loans | ||||||||||||
| (Dollars in thousands) |
Less than One Year |
One to Five Years |
After Five Years |
Total | ||||||||
| Commercial, financial and agricultural |
$ | 51,307 | $ | 51,339 | $ | 16,198 | $ | 118,844 | ||||
| Real estate – construction |
53,339 | 11,994 | 6,521 | 71,854 | ||||||||
| Real estate – mortgage |
113,329 | 264,274 | 126,468 | 504,071 | ||||||||
| Installment loans to individuals |
15,506 | 48,039 | 5,256 | 68,801 | ||||||||
| Total |
$ | 233,481 | $ | 375,646 | $ | 154,443 | $ | 763,570 | ||||
| Loans with fixed rates |
$ | 88,472 | $ | 144,023 | $ | 148,755 | $ | 381,250 | ||||
| Loans with variable rates |
145,009 | 231,623 | 5,688 | 382,320 | ||||||||
| Total |
$ | 233,481 | $ | 375,646 | $ | 154,443 | $ | 763,570 | ||||
This above table reflects the earlier of the maturity or re-pricing dates for loans at December 31, 2009. In preparing this table, no assumptions are made with respect to loan prepayments. Loan principal payments are included in the earliest period in which the loan matures or can be re-priced. Principal payments on installment loans scheduled prior to maturity are included in the period of maturity or re-pricing.
Provision for Loan Losses
The calculation of the allowance for loan losses is considered a critical accounting policy. The adequacy of the allowance for loan losses is based upon management’s judgment and analysis. The following factors are included in our evaluation of determining the adequacy of the allowance: risk characteristics of the loan portfolio, current and historical loss experience, concentrations and internal and external factors such as general economic conditions.
The allowance for loan losses increased to $18.6 million at December 31, 2009 as compared to $6.9 million at December 31, 2008. The allowance for loan losses at the end of 2009 was approximately 2.43% of total loans as compared to 0.96% at the end of 2008. Net loans charged off for 2009 were $1.3 million, or 0.16% of average loans, and $1.2 million, or 0.17% of average loans, in 2008. The provision for loan losses was $12.8 million for 2009 as compared with $1.5 million for 2008 and $3.8 million in 2007.
Certain risks exist in the Bank’s loan portfolio. Historically, we have experienced significant annual loan growth. Although we have experienced lenders who are familiar with their customer base, some of the loans are too new to have exhibited signs of weakness. Recent expansions into new markets increase potential credit risk. In addition, a majority of the loans are collateralized by real estate located in our market area. It is our policy to sufficiently collateralize loans to help minimize loss exposures in case of default. The recent negative trends in the national real estate market and economy pose potential threats. Local real estate market values have shown some deterioration but remain relatively stable, while national real estate markets have experienced a downturn. It is uncertain as to when or if local real estate values will be more significantly impacted. We do not believe that there will be a severely negative effect in our market area, but because of the uncertainty we deem it prudent to assign more of the allowance to these types of loans. Prior to 2008, we had purchased participation construction loans in the Coastal Carolina area. The totals of these credits were $12.7 million at December 31, 2009, and $13.7 million at December 31, 2008. This market area has posed some higher risk, but decreased collateral values still provide adequate coverage on these credits with the exception of one loan totaling $3.4 million at December 31, 2009. This credit has an estimated exposure of $1.2 million. In addition to the Coastal Carolina area, we have a $7.0 million construction loan project in the Pigeon Forge, Tennessee area that has experienced deterioration in market value. The estimated exposure on this credit is $3.5 million. Our market area is somewhat diverse, but certain areas are more reliant upon agriculture and coal mining. As a result, increased risk of loan impairments is possible if these industries experience a significant downturn although we do not believe this to be likely at least in the near future. We consider these factors to be the primary higher risk characteristics of the loan portfolio.
An evaluation of individual loans is performed by the loan review function. Loans are initially risk rated by the originating loan officer. If deteriorations in the financial condition of the borrower and the capacity to repay the debt occur, along with other factors, the loan may be downgraded. This is typically determined by either the loan officer or loan reviewers. Guidance for the evaluation is established by the regulatory authorities who periodically review the Bank’s loan portfolio for compliance. Classifications used by the Bank are exceptional, very good, standard, acceptable, transitory risk, other assets especially mentioned, substandard, doubtful and loss.
24
Table of Contents
All loans classified as other assets especially mentioned, substandard, doubtful and loss are individually reviewed for impairment. If collateral appraisals are outdated, we generally obtain updated appraisals. An evaluation is made to determine if the collateral is sufficient for each of these credits. If an exposure exists, a specific allowance is directly made for the amount of the potential loss in addition to estimated liquidation and disposal costs. The evaluation is inherently subjective as it requires estimates that are susceptible to significant revision as more information becomes available. Impaired loans increased to $30.1 million with a valuation allowance of $8.8 million at December 31, 2009 as compared to $6.8 million with a valuation allowance of $218 thousand at December 31, 2008. Of the $30.1 million recorded as impaired loans, $28.6 million were nonperforming loans, which includes nonaccrual loans and past due 90 days or more. Impaired loans increased $23.3 million, or 342.65%, from $6.8 million recorded as impaired loans at December 31, 2008. The increase is primarily due to nonperformance of three real estate development loans located in northeastern Tennessee totaling $13.7 million with an estimated exposure totaling $5.4 million. These three credits comprise 58.80% of the $23.3 million increase in impaired loans. The remaining difference is made up of various credits in Southwest Virginia. Management is aggressively working to reduce the impaired credits at minimal loss.
Loans delinquent greater than 90 days still accruing interest and loans in non-accrual status present higher risks. At December 31, 2009, there were 80 loans in non-accrual status totaling $24.7 million, or 3.24% of total loans. At December 31, 2008, there were 36 loans in non-accrual status totaling $6.4 million, or 0.89% of total loans. The amounts of interest that would have been recognized on these loans were $1.4 million and $221 thousand in the years 2009 and 2008, respectively. There were 46 loans past due 90 days or greater and still accruing interest totaling $3.9 million, or 0.51% of total loans at December 31, 2009. There were 3 loans past due 90 days or greater and still accruing interest totaling $33 thousand in 2008. It is our policy to stop accruing interest on a loan, and to classify that loan as non-accrual, under the following circumstances: (a) whenever we are advised by the borrower that scheduled payment or interest payments cannot be met, (b) when our best judgment indicates that payment in full of principal and interest can no longer be expected, or (c) when any such loan or obligation becomes delinquent for 90 days unless it is both well secured and in the process of collection. Non-accrual loans did not have a significant impact on interest income in any of the periods presented. No loans are classified as troubled debt restructurings. There are also no loans identified as “potential problem loans.” We do not have any commitments to lend additional funds to non-performing debtors. Following is a summary of non-accrual and past due loans greater than 90 days still accruing interest:
Non-Accrual and Past Due Loans
(Dollars in thousands)
| December 31, | ||||||||||||||||||||
| 2009 | 2008 | 2007 | 2006 | 2005 | ||||||||||||||||
| Non-accruing loans |
||||||||||||||||||||
| Commercial, financial and agricultural |
$ | 1,027 | $ | 100 | $ | 1,250 | $ | 246 | $ | 19 | ||||||||||
| Real estate – construction |
13,727 | 2,875 | 351 | — | — | |||||||||||||||
| Real estate – mortgage |
9,670 | 3,269 | 1,128 | 857 | 407 | |||||||||||||||
| Installment loans to individuals |
289 | 170 | 217 | 103 | 20 | |||||||||||||||
| Total Non-accruing loans |
24,713 | 6,414 | 2,946 | 1,206 | 446 | |||||||||||||||
| Loans past due 90 days or more and still accruing |
3,875 | 33 | 267 | 9 | 116 | |||||||||||||||
| Total |
$ | 28,588 | $ | 6,447 | $ | 3,213 | $ | 1,215 | $ | 562 | ||||||||||
| Percent of total loans |
3.74 | % | 0.89 | % | 0.47 | % | 0.21 | % | 0.12 | % | ||||||||||
In addition to impaired loans, the remaining loan portfolio is evaluated based on past due history, economic conditions, and internal processes. Past due data and the last five year historical quarterly charge off data per loan category is evaluated and compared to Virginia peers. Where we do not have loss experience, we apply the peer data. Otherwise, we compare our loss experience to the peer group and weigh it accordingly to the various associated risks. Economic data used include Central Appalachia regional unemployment information, gross domestic product growth, and interest rates are external factors. Lastly, we also evaluate our internal processes of underwriting and consider the inherent risks present in the portfolio due to past and present lending practices. These factors are not directly allocated to a particular loan category and are considered unallocated in the breakdown data in the table below. This is a new methodology applied in the last quarter of 2009. In past allowance for loan loss evaluation models, these factors were allocated to the different loan types. As economic conditions, performance of our loans and internal processes change, it is possible that future increases may be needed to the allowance for loan losses. The following table provides a summary of the activity in the allowance for loan losses.
25
Table of Contents
Analysis of the Allowance for Loan Losses
(Dollars in thousands)
| For the Years Ended December 31, | ||||||||||||||||||||
| Activity |
2009 | 2008 | 2007 | 2006 | 2005 | |||||||||||||||
| Beginning Balance |
$ | 6,904 | $ | 6,620 | $ | 4,870 | $ | 3,943 | $ | 3,090 | ||||||||||
| Provision charged to expense |
12,841 | 1,500 | 3,840 | 1,277 | 1,130 | |||||||||||||||
| Loan Losses: |
||||||||||||||||||||
| Commercial, financial and agricultural |
(129 | ) | (591 | ) | (1,701 | ) | (52 | ) | (4 | ) | ||||||||||
| Real estate – construction |
(446 | ) | (44 | ) | (2 | ) | — | (12 | ) | |||||||||||
| Real estate – mortgage |
(367 | ) | (256 | ) | (179 | ) | (148 | ) | (16 | ) | ||||||||||
| Installment loans to individuals |
(334 | ) | (420 | ) | (284 | ) | (223 | ) | (266 | ) | ||||||||||
| Total loan losses |
(1,276 | ) | (1,311 | ) | (2,166 | ) | (423 | ) | (298 | ) | ||||||||||
| Recoveries: |
||||||||||||||||||||
| Commercial, financial and agricultural |
37 | 18 | 20 | — | — | |||||||||||||||
| Real estate – construction |
8 | — | — | — | — | |||||||||||||||
| Real estate – mortgage |
21 | 17 | 6 | 44 | 2 | |||||||||||||||
| Installment loans to individuals |
53 | 60 | 50 | 29 | 19 | |||||||||||||||
| Total recoveries |
119 | 95 | 76 | 73 | 21 | |||||||||||||||
| Net charge offs |
(1,157 | ) | (1,216 | ) | (2,090 | ) | (350 | ) | (277 | ) | ||||||||||
| Balance at End of Period |
$ | 18,588 | $ | 6,904 | $ | 6,620 | $ | 4,870 | $ | 3,943 | ||||||||||
| Net charge offs as a % of average loans |
0.15 | % | 0.17 | % | 0.34 | % | 0.07 | % | 0.07 | % | ||||||||||
We have allocated the allowance according to the amount deemed to be reasonably necessary to provide for the possibility of losses being incurred within each of the categories of loans. The allocation of the allowance as shown in the following table should not be interpreted as an indication that loan losses in future years will occur in the same proportions or that the allocation indicates future loan loss trends. Furthermore, the portion allocated to each loan category is not the total amount available for future losses that might occur within such categories since the total allowance is a general allowance applicable to the entire portfolio.
The allocation of the allowance for loan losses is based on our judgment of the relative risk associated with each type of loan. We have allocated 19% of the allowance to cover real estate loans, which constituted 66.02% of our loan portfolio at December 31, 2009. The allocation reflects their lower risk. Mortgage loans are secured by real estate whose value tends to be easily ascertainable. These loans are made consistent with appraisal policies and real estate lending policies, which detail maximum loan-to-value ratios and maturities.
We have allocated 43% of the allowance to cover real estate construction loans, which constituted 9.41% of our loan portfolio at December 31, 2009. Construction loans are secured by real estate with values that are dependent upon market and economic conditions. Values may not always be easily ascertainable. These loans are made consistent with appraisal policies and real estate lending policies, which detail maximum loan-to-value ratios and maturities. Based upon recent appraised values of construction loans considered impaired, the percentage of the allowance for loan losses attributed to construction loans increased in 2009.
We have allocated 9% of the allowance to commercial loans, which constituted 15.56% of our loan portfolio at December 31, 2009. This allocation decreased as a percentage of the allowance for loan losses as a result of the increased percentages related to real estate and construction loan. In addition, the new methodology resulted in shifting unallocated factors from the loan types to an unallocated balance. Commercial business loans typically are made on the basis of the borrower’s ability to make repayment from cash flow from its business and are secured by business assets, such as accounts receivable, equipment and inventory. As a result, the availability of funds for the repayment of commercial business loans may be substantially dependent on the success of the business itself.
We have allocated 8% of the allowance to consumer installment loans, which constituted 9.01% of our loan portfolio at December 31, 2009. Consumer installment loans entail greater risk than commercial or real estate loans, because the loans may be unsecured, such as lines of credit, or secured by rapidly depreciable assets such as automobiles. In addition, consumer loan collections are dependent on the borrower’s continuing financial stability, and thus are more likely to be adversely affected by job loss, divorce, illness or personal bankruptcy. Losses related to consumer loans have been influenced by the increase in personal bankruptcies in recent years. To date, the largest majority of all loans charged off by the Bank have been consumer loans. The allocation as a percentage of the allowance for loan losses did decrease in proportion as a result of the increased exposure to real estate and construction loans. In addition, the shift of unallocated factors reduced this percentage as well.
26
Table of Contents
The following table shows the balance and percentage of our allowance for loan losses (or “ALLL”) allocated to each major category of loans.
Allocation of the Allowance for Loan Losses
December 31, 2005 through December 31, 2009
(Dollars in thousands)
| December 31, 2009 | December 31, 2008 | December 31, 2007 | |||||||||||||||||||||||||
| Amount | % of ALLL |
% of Loans |
Amount | % of ALLL |
%of Loans |
Amount | % of ALLL |
% of Loans |
|||||||||||||||||||
| Commercial |
$ | 1,710 | 9 | % | 15.56 | % | $ | 3,866 | 56 | % | 15.26 | % | $ | 3,254 | 49 | % | 17.76 | % | |||||||||
| R/E – const. |
8,036 | 43 | % | 9.41 | % | 621 | 9 | % | 8.96 | % | 199 | 3 | % | 5.63 | % | ||||||||||||
| R/E – mortg. |
3,525 | 19 | % | 66.02 | % | 1,036 | 15 | % | 67.04 | % | 1,200 | 18 | % | 67.88 | % | ||||||||||||
| Installment |
1,501 | 8 | % | 9.01 | % | 1,381 | 20 | % | 8.74 | % | 1,967 | 30 | % | 8.73 | % | ||||||||||||
| Unallocated |
3,816 | 21 | % | — | — | — | — | ||||||||||||||||||||
| Total |
$ | 18,588 | 100 | % | 100.00 | % | $ | 6,904 | 100 | % | 100.00 | % | $ | 6,620 | 100 | % | 100.00 | % | |||||||||
| December 31, 2006 | December 31, 2005 | |||||||||||||||||
| Amount | % of ALLL |
% of Loans |
Amount | % of ALLL |
% of Loans |
|||||||||||||
| Commercial |
$ | 1,704 | 35 | % | 18.34 | % | $ | 1,380 | 35 | % | 20.08 | % | ||||||
| R/E – const. |
146 | 3 | % | 6.63 | % | 118 | 3 | % | 5.61 | % | ||||||||
| R/E – mortg. |
828 | 17 | % | 65.18 | % | 671 | 17 | % | 64.47 | % | ||||||||
| Installment |
2,192 | 45 | % | 9.85 | % | 1,774 | 45 | % | 9.84 | % | ||||||||
| Unallocated |
— | — | — | — | ||||||||||||||
| Total |
$ | 4,870 | 100 | % | 100.00 | % | 3,943 | 100 | % | 100.00 | % | |||||||
Other Real Estate Owned
Other real estate owned increased $3.1 million, or 126.08%, to $5.6 million at December 31, 2009 from $2.5 million at December 31, 2008. We anticipate total other real estate owned to increase in the near future as we foreclose on real estate collateralized loans. In the last quarter of 2009, management decided to add the Duffield branch location to other real estate owned since this building is no longer intended to be used as a branch location. All properties are being marketed for sale. The values at December 31, 2009 were adjusted to reflect current fair market values based upon market conditions.
Investment Securities
Total investment securities decreased to $2.6 million at December 31, 2009 from $3.4 million at December 31, 2008. All securities are classified as available for sale for liquidity purposes. The carrying amount of certain securities pledged by us to secure public deposits totaled $900 thousand at December 31, 2009 as compared to $400 thousand at December 31, 2008.
As we slow loan growth, we are beginning to build an investment portfolio. We anticipate increasing the size of the portfolio during 2010. The portfolio will be comprised of short to mid-term investments.
The carrying values of investment securities and the different types of investments are shown in the following table:
Investment Securities Portfolio
(Dollars in thousands)
| December 31, |
2009 | 2008 | 2007 | |||||||||||||||
| Amortized Cost |
Fair Value |
Amortized Cost |
Fair Value |
Amortized Cost |
Fair Value | |||||||||||||
| Available for Sale | ||||||||||||||||||
| U.S. Government Agencies |
$ | 1,999 | $ | 2,037 | $ | 3,000 | $ | 3,063 | $ | 4,495 | $ | 4,502 | ||||||
| Taxable municipals |
317 | 312 | — | — | — | — | ||||||||||||
| Mortgage backed securities |
249 | 257 | 378 | 386 | 467 | 472 | ||||||||||||
| Total Securities AFS |
$ | 2,565 | $ | 2,606 | $ | 3,378 | $ | 3,449 | $ | 4,962 | $ | 4,974 | ||||||
The amortized cost, fair value and weighted average yield of investment securities at December 31, 2009 by contractual maturity, are shown in the following schedule. Expected maturities will differ from contractual maturities because issuers may have the right to call or prepay obligations with or without call or prepayment penalties.
27
Table of Contents
Maturities of Securities
(Dollars in thousands)
| Securities Available for Sale |
Amortized Cost |
Fair Value |
Weighted Average Yield |
||||||
| Due in one year or less |
$ | 1,500 | $ | 1,534 | 3.18 | % | |||
| Due after one year through five years |
747 | 760 | 3.20 | % | |||||
| Due after five years through ten years |
318 | 312 | 5.45 | % | |||||
| Due after ten years |
— | — | — | ||||||
| Total |
$ | 2,565 | $ | 2,606 | 3.44 | % | |||
Deposits
Total deposits were $760.7 million at December 31, 2009, an increase of $55.0 million, or 7.80%, from $705.7 million at December 31, 2008. This growth is attributed to the new branch opened in 2008 in Bluewell, West Virginia and from continued growth in various other branches. In addition, many larger banks in our market area drastically lowered their time deposit interest rates during 2009. We lowered our interest rates, as well, however not by as much as the larger banks. As a result, we experienced a growth in time deposits during 2009. We have also developed some new consumer and commercial deposit products that have contributed to core deposit growth.
The largest areas of growth were in time deposits. This area of deposits increased $53.2 million, or 10.95%, during 2009 from $486.0 million at December 31, 2008 to $539.2 million at December 31, 2009. Demand and savings deposits increased slightly during 2009. Noninterest bearing demand deposits decreased $7.1 million, or 7.47%, to $88.3 million in 2009 from $95.4 million in 2008. Interest-bearing demand deposits increased by $8.3 million, or 23.98%, to $42.8 million in 2009 from $34.5 million in 2008. This increase is primarily attributed to growth in our new Freedom 50 checking account. Savings deposits increased $680 thousand, or 0.76%, to $90.5 million in 2009 from $89.8 million in 2008. Time deposits increased by $53.2 million, or 10.95%, to $539.2 million at December 31, 2009 from $486.0 million in 2008. During 2009, many larger banks in our market area drastically lowered their time deposit interest rates. We decreased our interest rates also, but not to the same level as the larger regional banks and the megabanks. As a result, we experienced a growth in time deposits during 2009. Part of this growth was in the CDARs time deposits that allow customers to be FDIC insured above the normal level. These time deposits increased $15.1 million during 2009.
Time deposits of $100,000 or more equaled approximately 24.77% of deposits at the end of 2009 and 23.47% of deposits at the end of 2008. The increase is primarily due to the increased FDIC insurance coverage to $250 thousand from $100 thousand.
We have brokered deposits totaling $2.9 million with a term of 10 years. These deposits were used to fund a particular 10 year balloon mortgage product. Internet accounts are limited to customers located in the surrounding geographical area. The average balance of and the average rate paid on deposits is shown in the net interest margin analysis above.
Maturities of time certificates of deposit of $100,000 or more outstanding are summarized as follows:
Maturities of Time Deposits of $100 Thousand and More
(Dollars in thousands)
| December 31, 2009 | |||
| Three months or less |
$ | 51,281 | |
| Over three months through six months |
63,852 | ||
| Over six months through twelve months |
52,457 | ||
| Over one year |
20,871 | ||
| Total |
$ | 188,461 | |
28
Table of Contents
Noninterest Income
2009 and 2008 Changes
Noninterest income decreased $101 thousand, or 1.82%, from $5.6 million in 2008 to $5.4 million in 2009. The primary reason for the decrease is a reduction in insurance and investment fee income due to poor market conditions and reduced sales staff. This category of noninterest income decreased $320 thousand, or 32.89%, from $973 thousand in 2008 to $653 thousand in 2009. This type of income is cyclical to market conditions. We anticipate it to increase as market conditions improve. Service charges remained flat in 2009 from 2008. Service charges on deposit accounts are primarily overdraft fees. We experienced slower growth in income in 2009 from service charges due to improved customer conveniences and service from extended banking cutoff times and a customer friendly overdraft waived fees policy change. With recent regulatory changes applicable to overdraft fees in 2010, we anticipate this source of income to slightly decrease in the future. Fees, commissions and other income increased $310 thousand, or 22.17% in 2009. The main reason is that interchange fees from ATM and debit cards increased during 2009 by $301 thousand, or 32.60%. This is the result of increased usage by consumers. Life insurance investment income from bank owned life insurance policies was slightly reduced due to lower interest rates. When interest rates increase, we anticipate this category of income to increase.
Noninterest income as a percentage of average assets decreased to 0.65% in 2009 from 0.79% in 2008 and 0.68% in 2007. We anticipate this percentage to remain flat during 2010 for the same reasons that they were flat in 2009.
2008 and 2007 Changes
Noninterest income increased $899 thousand, or 19.33%, to $5.5 million for 2008 as compared to $4.7 million in 2007. Deposit service fees, retail investment sales and insurance commissions increased as a result of increased volume to $2.7 million in 2008 from $2.5 million in 2007. Fees, commissions and other income increased to $1.4 million in 2008 from $1.0 million in 2007. This increase is primarily related to ATM and bank card interchange fees. Insurance and investment commissions also increased in 2008 to $973 thousand from $769 thousand in 2007. This is the result of additional sales staff, stronger customer relationships, and meeting customer needs that are underserved for these types of products in some of our markets.
Noninterest Expense
2009 and 2008 Changes
Noninterest expenses increased $3.2 million, or 12.13%, to $29.8 million in 2009 from $26.6 million in 2008. Following are explanations of the increase.
The FDIC insurance premium increased $1.5 million, or 201.66%, from $724 thousand to $2.2 million. We incurred a one-time special assessment in June 2009 totaling $375 thousand. In addition, we opted into the government’s Temporary Liquidity Guarantee Program which insures all noninterest bearing demand deposits with unlimited FDIC insurance through June 30, 2010. Finally, higher assessments have been imposed on banks as a result of the economic recession. Each of these is contributing factors to the increased FDIC premiums. We anticipate this expense to increase in 2010 as well.
In addition, other real estate owned and repossessed vehicle expenses increased $726 thousand to $860 thousand in 2009 from $134 thousand in 2008. The increase is related to an increase in foreclosures and repossessions in 2009. We also re-assessed the values of the properties in other real estate owned in late 2009 and wrote down these assets by $577 thousand to allow for fair market value changes in the properties since the original date that the assets were acquired. In the year 2008, we had a net gain on the sale of other real estate owned property of $612 thousand. In 2009, however, we had a net loss of $143 thousand. This $755 thousand, or 123.37%, change also contributes to the overall increase in noninterest expenses.
Salaries and employee benefits decreased from $15.6 million in 2008 to $15.2 million in 2009. This $476 thousand decrease is related to the Board of Director’s decision to not pay employee bonuses in 2009. In addition, we did not open any new branches in 2009 and this held these expenses down. Historically, we have opened multiple branches annually and had new hires for these offices which have resulted in annual increases in salaries and benefits.
Other operating expenses increased $695 thousand, or 15.91%, to $5.1 million in 2009 from $4.4 million in 2008. The increase is related to increased professional fees incurred from increased legal, accountant and consultant fees during 2009. These fees increased as the result of complying with the material weakness in internal controls identified in 2008 which now have been fully remediated.
The ratio of noninterest expense as a percentage of average assets slightly increased in 2009 to 3.54% as compared to 3.49% in 2008. We expect greater efficiencies to result as we maximize the performance of our branches and as the economy improves. Our efficiency ratio, which is defined as noninterest expense divided by the sum of net interest income plus noninterest income, was 79.84% in 2009 as compared to 76.96% for 2008.
29
Table of Contents
2008 and 2007 Changes
Noninterest expenses increased $2.9 million, or 12.44%, in 2008 to $26.6 million from $23.7 million in 2007. The majority of the increase is related to additional operating expenses from a new branch location in 2008, and a full year of expenses for the five new branches opened in 2007. A net gain of $612 thousand from the sale of other real estate owned was realized in 2008 and reduced noninterest expenses for the year.
The total salaries and benefits expense in the year 2008 was $15.6 million which is a $1.7 million, or 11.80%, increase over $14.0 million in the year 2007. The increase is primarily related to the new branches opened, a full recognition of salaries and benefits of employees added in prior years and annual raises for existing employees.
Occupancy and equipment expenses directly correlate with branch expansion. Occupancy expense increased $439 thousand, or 24.72%, to $2.2 million for 2008 as compared to $1.8 million for 2007. Equipment expense for the period of 2008 increased $91 thousand, or 4.04% from $2.3 million in 2007.
An increase of FDIC assessment fees of $357 thousand for 2008 to $724 thousand from $367 thousand in 2007 was realized. Other operating expenses increased $646 thousand, or 17.36%, from $3.7 million for the year 2007 to $4.4 million in the year 2008. Legal expenses increased during the year as we pursued various capital raising initiatives that were not implemented due to market conditions during both 2007 and 2008. Other operating expenses have increased as our branch network has expanded.
The ratio of noninterest expense as a percentage of average assets slightly increased in 2008 to 3.49% from 3.45% in 2007. Our efficiency ratio was 76.96% for 2008 as compared to 77.98% for 2007.
Life Insurance and Related Change of Accounting Estimate
We have life insurance policies on the lives of two key officers and two former key officers. The Bank is the beneficiary under each policy. The total cash surrender value of the policies was $10.5 million and $10.2 million at December 31, 2009 and December 31, 2008, respectively. Total income for the policies during 2009 was $440 thousand as compared to $475 thousand and $433 thousand for the years ending 2008 and 2007, respectively. As described below, in 2007 we transferred all existing insurance policies from general accounts products to separate account products.
In the latter part of 2006 and in January 2007, management began exploring the option to purchase additional bank owned life insurance to financially protect the Company in case of the death of other key employees. During the first half of 2007, due diligence was conducted on products and companies. During this process, the option to purchase separate account bank owned life insurance became available to the Company in addition to the traditional general account bank owned life insurance product. The primary difference between the two is that the separate account product offers the Company greater flexibility in investing the funds to yield a higher return and also a larger variety of investments from which to choose. The earnings stream of the investment is managed through a stable wrap provider. General account products are sold directly by a particular insurance company which makes the investment decisions and gives substantially less flexibility in investment options. In addition, separate account products may be classified as a 20% risk weight for capital regulatory calculations as opposed to 100% risk weights for the general account products. The separate account product has typically been offered to large financial institutions, but now it is available to smaller community banks. The Company’s past asset size and capital levels did not qualify us for separate account bank owned life insurance. But since the Company experienced asset and capital growth, the option to purchase and like-kind exchange, or 1035 exchange, the existing policies became available. As a result, management decided to purchase the separate account product and 1035 exchange the existing policies.
Up until this time, the intention of management left the option open to cash in the existing policies before the death of the insured officers. This created a deferred tax liability on the earnings of the policies which typically would be tax exempt since they are life insurance proceeds. Management, the Bank Owned Life Insurance and Compensation Committees met and decided in August 2007 to change existing policies and any new purchases of bank owned life insurance to the separate account product. The Board of Directors ratified this decision in September 2007. As a result, management changed its intention to keep the life insurance policies until the death of the insured.
This resulted in a change of accounting estimate. As a result, the deferred taxes were adjusted by $638 thousand and income tax expense was reduced by the same amount during the third quarter of 2007.
30
Table of Contents
Income Taxes
Due to timing differences between book and tax treatment of several income and expense items, a deferred tax asset of $5.4 million existed at December 31, 2009 as compared to a deferred tax asset of $1.2 million at December 31, 2008. The $4.2 million difference is primarily related to the increased provision to the allowance for loan loss in 2009. Only direct charge-offs are permitted as tax deductions. The deferred tax asset represents decreases to future income tax liabilities from future increased deductions for allowance for loan losses. Our income tax expense was computed at the normal corporate income tax rate of 34% of taxable income included in net income. We do not have significant nontaxable income or nondeductible expenses.
Capital Resources
Our total capital at the end of 2009 was $46.6 million compared to $50.3 million in 2008. The decrease was $3.7 million, or 7.36%. The Bank remains well-capitalized at the end of 2009, as defined by the capital guidelines of the bank regulators. New Peoples’ capital as a percentage of total assets was 5.43% at December 31, 2009 compared to 6.23% at December 31, 2008. The decrease in New Peoples’ capital is due to the net loss incurred in 2009 as a result of the increased provision for loan losses.
New Peoples did not apply to participate in the federal Troubled Asset Relief Program, or TARP, funds as we thought participation might not be in the best long-term interest of our stockholders. Our region did not experience a rapid rise in real estate prices in recent years. Likewise, real estate values have not declined precipitously like many other regions of the country. Regional rates of unemployment have held fairly steady compared to other regions.
Total asset growth for 2009 slowed and we anticipate this slower rate of growth to continue in the near future. We still have targeted markets that we anticipate entering in the future as conditions permit, and additional capital may be needed to implement those strategic plans. However, our primary source of capital for asset growth comes from retained earnings. Our strategic plan, including geographic growth, can be supported by projected retained earnings unless projected earnings are adversely affected by asset quality deterioration due to the severe recession. Therefore, under current economic conditions, we believe it is prudent to increase capital to absorb potential losses that may occur if asset quality deteriorates further. We are aware that capital needs and requirements are affected by the level of problem assets, growth, earnings and other factors. It is possible that retained earnings alone may not provide sufficient capital for this economic cycle and additional sources of capital may have to be obtained. We are exploring various options to increase capital, which may include a stock offering.
In June 2008, a majority of New Peoples’ stockholders voted to amend the Articles of Incorporation to authorize 50 million shares of common stock. Prior to this approval, 12 million shares of common stock were authorized.
No cash dividends have been paid historically and none are anticipated in the foreseeable future. New Peoples’ strategic plan is to continue growing but at a slower pace. Earnings will continue to be retained to build capital.
Liquidity
We have not experienced liquidity issues during 2009. We closely monitor our liquidity and have a variety of ways to increase liquidity levels as needed. At December 31, 2009 and December 31, 2008, we had liquid assets in the form of cash, due from banks and federal funds sold of approximately $39.6 million and $23.9 million, respectively. We are continuing to increase short-term assets during 2010.
At December 31, 2009, we had borrowings from the Federal Home Loan Bank totaling $25.4 million as compared to $26.6 million at December 31, 2008. Of these borrowings at December 31, 2009, none are overnight and subject to daily interest rate changes. Term notes of $15.2 million mature in the year 2012. Two additional borrowings totaling $10.2 million have a maturity date in the year 2018, but reduce in principal amounts monthly. We also used our line of credit with the Federal Home Loan Bank to issue a letter of credit for $7.0 million to the Treasury Board of Virginia for collateral on public funds. An additional $69.4 million was available on December 31, 2009 on the $101.7 million line of credit which is secured by a blanket lien on our residential real estate loans.
At December 31, 2009, all of our investments are classified as available-for-sale, providing an additional source of liquidity in the amount of $1.6 million, which is net of those securities pledged as collateral. We anticipate developing an investment portfolio in the near future as we shrink our loan portfolio and increase deposits. This will primarily serve as a source of liquidity while yielding a higher return than federal funds sold.
31
Table of Contents
As mentioned above, in the second quarter of 2008, we utilized $7.0 million of our Federal Home Loan Bank line of credit as a letter of credit for public funds collateral. This was authorized by the state legislature in the 2008 session, and we have taken advantage of this efficient way to secure these deposits.
Our loan to deposit ratio was 100.38% at December 31, 2009 and 102.19% at year end 2008. We anticipate this ratio to decrease below 100% as we continue to grow deposits in our branch network. We can further lower the ratio as management deems appropriate by managing the rate of growth in our loan portfolio and by offering special promotions to entice new deposits. This can be done by changing interest rates charged or limiting the amount of new loans approved.
On November 21, 2008, the Board of Directors of the Federal Deposit Insurance Corporation (“FDIC”) adopted a final rule relating to the Temporary Liquidity Guarantee Program (“TLG Program”). The TLG Program was announced by the FDIC on October 14, 2008, preceded by the determination of systemic risk by the Secretary of the Department of Treasury (after consultation with the President), as an initiative to counter the system-wide crisis in the nation’s financial sector. Under the TLG Program the FDIC will (i) guarantee, through the earlier of maturity or June 30, 2012, certain newly issued senior unsecured debt issued by participating institutions on or after October 14, 2008, and before June 30, 2009 and (ii) provide full FDIC deposit insurance coverage for non-interest bearing transaction deposit accounts, Negotiable Order of Withdrawal (“NOW”) accounts paying less than 0.50% interest per annum and Interest on Lawyers Trust Accounts (“IOLTA”) accounts held at participating FDIC-insured institutions through December 31, 2009. Coverage under the TLG Program was available for the first 30 days without charge. The fee assessment for coverage of senior unsecured debt ranges from 50 basis points to 100 basis points per annum, depending on the initial maturity of the debt. The fee assessment for deposit insurance coverage is 10 basis points per quarter on amounts in covered accounts exceeding $250,000. In December 2008, the Bank elected to participate in both guarantee programs, which provide the Bank with an additional source of liquidity. An option to extend through June 30, 2010 the TLG Program for full FDIC insurance coverage for deposit accounts mentioned above was elected by the Bank.
In the event we need additional funds, we have the ability to purchase federal funds under established lines of credit totaling $27.4 million. In addition, in the third quarter of 2008 we joined with the Promontory Interfinancial Network, LLC, otherwise known as CDARS. CDARS allows our customers to access FDIC insurance protection on multi-million dollar certificates of deposit through our Bank. When a customer places a large deposit through CDARS, we place their funds into certificates of deposit with other banks in the CDARS network in increments of less than $100,000 so that principal and interest are eligible for FDIC insurance protection. CDARS also permits its members to use their treasury desk for one-way funds purchasing to meet liquidity needs on a term-basis. We have tested this program for liquidity planning purposes. We do not have any funds purchased through the one-way purchase program. At December 31, 2009, we had customer deposits of $22.4 million in CDARS deposits as compared to $7.3 million in 2008.
Another source of liquidity available to us is through the brokered deposits market. We currently have $2.9 million in 10 year term time deposits comprised of $3 thousand increments at a yielded interest rate of 4.10%. We utilized this low cost source of funds to match funding for a 10 year balloon mortgage product. With the exception of CDARS time deposits, we have no other brokered deposits. Though this has not been a strategy in the past, we may utilize this source in the future as a lower cost source of funds.
In September 2009, the Bank obtained approval for the Federal Reserve Bank discount window for overnight funding needs. We may collateralize this line with investment securities and loans at our discretion. We currently do not have collateral pledged, but we may physically deliver collateral to the Federal Reserve and obtain funding. We do not, however, anticipate using this funding source.
Additional liquidity is expected to be provided by the future growth that management expects in deposit accounts and from loan repayments. We believe that this future growth will result from an increase in market share in our targeted trade area.
During 2009, we lost availability of $1.6 million on our $6.5 million holding company line of credit obtained from Silverton Bank. The reason that we lost this availability was due to the failure of Silverton Bank in early 2009. We are in technical default under this line of credit which is secured by our stock in The Bank. We are currently trying to refinance the outstanding $4.9 million balance. As indicated above, the inability of the Bank to pay dividends to the Company because of the restriction imposed by Richmond FRB may impact our ability to refinance this balance.
With the lines of credit available, anticipated deposit growth, CDARs, the TLG Program, and other external sources of funding, we believe we have adequate liquidity and capital resources to meet our requirements and needs for the foreseeable future. However, liquidity can be affected by a number of factors such as counterparty willingness or ability to extend credit, regulatory actions and customer preferences, some of which are beyond our control.
32
Table of Contents
Financial Instruments with Off-Balance-Sheet Risk
The Bank is a party to financial instruments with off-balance-sheet risk in the normal course of business to meet the financing needs of its customers and to reduce its own exposure to fluctuations in interest rates. These financial instruments include commitments to extend credit and standby letters of credit. Those instruments involve, to varying degrees, elements of credit and interest rate risk in excess of the amount recognized in the balance sheet. The contract or notional amounts of those instruments reflect the extent of involvement the Bank has in particular classes of financial instruments.
The Bank’s exposure to credit loss in the event of nonperformance by the other party to the financial instrument for commitments to extend credit and standby letters of credit is represented by the contractual amount of those instruments. The Bank uses the same credit policies in making commitments and conditional obligations as it does for on-balance-sheet instruments.
A summary of the contract amount of the Bank’s exposure to off-balance-sheet risk as of December 31, 2009 and 2008 is as follows:
| (Dollars in thousands) |
2009 | 2008 | ||||
| Financial instruments whose contract amounts represent credit risk: |
||||||
| Commitments to extend credit |
$ | 48,022 | $ | 51,190 | ||
| Standby letters of credit |
5,159 | 4,022 | ||||
Commitments to extend credit are agreements to lend to a customer as long as there is no violation of any condition established in the contract. Commitments generally have fixed expiration dates or other termination clauses and may require payment of a fee. Since many of the commitments are expected to expire without being drawn upon, the total commitment amounts do not necessarily represent future cash requirements. The Bank evaluates each customer’s credit worthiness on a case-by-case basis. The amount of collateral obtained, if deemed necessary by the Bank upon extension of credit, is based on management’s credit evaluation of the counterparty. Collateral held varies but may include accounts receivable, inventory, property and equipment, and income-producing commercial properties.
Unfunded commitments under lines of credit are commitments for possible future extensions of credit to existing customers. Those lines of credit may not actually be drawn upon to the total extent to which the Bank is committed.
Standby letters of credit are conditional commitments issued by the Bank to guarantee the performance of a customer to a third party. Those guarantees are primarily issued to support public and private borrowing arrangements, including commercial paper, bond financing, and similar transactions. The credit risk involved in issuing letters of credit is essentially the same as that involved in extending loan facilities to customers. The Bank holds certificates of deposit, deposit accounts, and real estate as collateral supporting those commitments for which collateral is deemed necessary.
Contractual Obligations
New Peoples and its subsidiaries have Federal Home Loan Bank advances, operating lease obligations and line of credit and trust preferred securities indebtedness. The following is a breakdown of the payment obligations over the life of the agreements:
| Payments Due by Period | |||||||||||||||
| (Dollars in thousands) |
Total | Less than 1 year |
1-3 years | 3-5 years | More than 5 years | ||||||||||
| Trust preferred securities indebtedness |
$ | 16,496 | $ | — | $ | — | $ | — | $ | 16,496 | |||||
| Federal Home Loan Bank advances |
25,383 | — | 15,225 | — | 10,158 | ||||||||||
| Line of credit |
4,900 | — | 4,900 | ||||||||||||
| Operating Lease Obligations |
245 | 33 | 66 | 67 | 79 | ||||||||||
| Total |
$ | 47,024 | $ | 33 | $ | 20,191 | $ | 67 | $ | 26,733 | |||||
33
Table of Contents
Interest Sensitivity
At December 31, 2009, we had a negative cumulative gap rate sensitivity ratio of 50.00% for the one year re-pricing period, compared to 40.27% at December 31, 2008. A negative cumulative gap generally indicates that net interest income would improve in a declining interest rate environment as liabilities re-price more quickly than assets. Conversely, net interest income would probably decrease in periods during which interest rates are increasing. We are closely monitoring our position and implementing adjustments periodically to strategically position ourselves to enhance earnings in current and anticipated interest rate environments. On a quarterly basis, management reviews our interest rate risk and has decided that the current position is an acceptable risk.
Interest Sensitivity Analysis
December 31, 2009
(Dollars in thousands)
| 1- 90 Days |
91-365 Days |
1-3 Years |
4-5 Years |
6-15 Years |
Over 15 Years |
Total | |||||||||||||||||||||
| Uses of funds: |
|||||||||||||||||||||||||||
| Loans |
$ | 123,147 | $ | 81,910 | $ | 170,928 | $ | 230,668 | $ | 110,791 | $ | 46,126 | $ | 763,570 | |||||||||||||
| Federal funds sold |
9,582 | — | — | — | — | — | 9,582 | ||||||||||||||||||||
| Investments |
4,592 | 1,534 | 503 | — | 312 | — | 6,941 | ||||||||||||||||||||
| Bank owned life insurance |
10,549 | — | — | — | — | — | 10,549 | ||||||||||||||||||||
| Total earning assets |
$ | 147,870 | $ | 83,444 | $ | 171,431 | $ | 230,668 | $ | 111,103 | $ | 46,126 | $ | 790,642 | |||||||||||||
| Sources of funds: |
|||||||||||||||||||||||||||
| Interest Bearing DDA |
$ | 42,769 | $ | — | $ | — | $ | — | $ | — | $ | — | $ | 42,769 | |||||||||||||
| Savings & MMDA |
90,467 | — | — | — | — | — | 90,467 | ||||||||||||||||||||
| Time Deposits |
161,850 | 310,145 | 54,053 | 10,238 | 2,874 | — | 539,160 | ||||||||||||||||||||
| Trust preferred securities |
16,496 | — | — | — | — | — | 16,496 | ||||||||||||||||||||
| Other borrowings |
4,900 | — | 15,225 | — | 10,158 | — | 30,283 | ||||||||||||||||||||
| Total interest bearing liabilities |
$ | 316,482 | $ | 310,145 | $ | 69,278 | $ | 10,238 | $ | 13,032 | $ | — | $ | 719,175 | |||||||||||||
| Discrete Gap |
$ | (168,612 | ) | $ | (226,701 | ) | $ | 102,153 | $ | 220,430 | $ | 98,071 | $ | 46,126 | $ | 71,467 | |||||||||||
| Cumulative Gap |
$ | (168,612 | ) | $ | (395,313 | ) | $ | (293,160 | ) | $ | (72,730 | ) | $ | 25,341 | $ | 71,467 | |||||||||||
| Cumulative Gap as % of Total Earning Assets |
(21.33 | )% | (50.00 | )% | (37.08 | )% | (9.20 | )% | 3.21 | % | 9.04 | % | |||||||||||||||
34
Table of Contents
| Item 7A. | Quantitative and Qualitative Disclosures About Market Risk |
Market risk is the risk of loss due to adverse changes in current and future cash flows, fair values, earnings or capital due to adverse movements in interest rates and other factors, including foreign exchange rates and commodity prices. Because we have no significant foreign exchange activities and hold no commodities, interest rate risk represents the primary risk factor affecting our balance sheet and net interest margin. Significant changes in interest rates by the Federal Reserve could result in similar changes in other interest rates that could affect interest earned on our loan and investment portfolios and interest paid on our deposit accounts. Changes in the interest rates earned and paid also affect the estimated fair value of our interest bearing assets and liabilities.
Our Asset and Liability Committee has been delegated the responsibility of managing our interest-sensitive balance sheet accounts to maximize earnings while managing interest rate risk. The committee, comprised of various members of senior management and five external board members, is also responsible for establishing policies to monitor and limit our exposure to interest rate risk and to manage our liquidity and capital positions. The committee satisfies its responsibilities through quarterly meetings during which product pricing issues, liquidity measures, capital levels, and interest sensitivity positions are monitored.
We use an asset/liability management and simulation software model to periodically measure the potential impact on net interest income of projected or hypothetical changes in interest rates. Our policy objective is to monitor our position and to manage our short-term and long-term interest rate risk exposure. Our board of directors has established percentages for the maximum potential reductions in net interest income that we are willing to accept, which result from changes in interest rates over the next 12-month period. The percentage limitations relate to instantaneous and sustained parallel changes in interest rates of plus and minus certain basis points.
The following tables summarize our established percentage limitations and the sensitivity of our net interest income to various interest rate scenarios for the next 12 months, based on assets and liabilities as of December 31, 2009 and 2008. During 2009, we increased some of our established limitations to match our interest risk tolerance. The changes of percentages of modeled changes in net interest income from 2008 to 2009 are reflective of the strategies implemented during a historically low interest rate environment. Our position changed from 2008 to 2009 to be in line with an interest rate decline to best enhance earnings. As interest rates increase, we will implement different strategies to enhance our earnings. At both dates, our interest rate risk is within the established limitations except for the 100 basis point increase scenario. This slight variance is an acceptable risk; however, we have begun to implement the strategy to lengthen the maturity of time deposits.
| 2009 | ||||
| Immediate Estimated Increase Basis Point Change In Interest Rates |
% Increase (Decrease) in Net Interest Income |
Established Limitation | ||
| +300 |
(17.97)% | (20.00)% | ||
| +200 |
(12.07)% | (15.00)% | ||
| +100 |
(8.92)% | (7.00)% | ||
| -100 |
5.88% | (7.00)% | ||
| -200 |
6.12% | (15.00)% | ||
| -300 |
6.10% | (20.00)% | ||
| 2008 | ||||
| Immediate Estimated Increase Basis Point Change In Interest Rates |
% Increase (Decrease) in Net Interest Income |
Established Limitation | ||
| +300 |
(10.90)% | (15.00)% | ||
| +200 |
(7.69)% | (10.00)% | ||
| +100 |
(3.99)% | (7.00)% | ||
| -100 |
9.38% | (7.00)% | ||
| -200 |
11.32% | (10.00)% | ||
| -300 |
17.06% | (15.00)% | ||
35
Table of Contents
The type of modeling used to generate the above tables does not take into account all strategies that we might adopt in response to a sudden and sustained change in interest rates. These strategies may include asset/liability acquisitions of appropriate maturities in the cash market and may also include off-balance sheet alternatives to the extent such activity is authorized by the board of directors.
The committee is also responsible for long-term asset/liability management and completes the following functions:
| • | Monitoring available opportunities to undertake major corrective actions (in the nature and mix of assets and liabilities) for structural mismatches. |
| • | Determining the appropriateness of fixed rate vs. variable rate lending and investment strategies and formulation of policies to influence this activity. |
| • | Developing parameters for the investment portfolio in the context of overall balance sheet management (liquidity, interest rate risk, credit risk, risk-based capital, price risk, and earnings). |
| • | Establishing financial goals, including minimum standards for return on assets and equity. |
| • | Overseeing the long-term strategic use of capital to maximize the return on equity within reasonable levels of risk. |
36
Table of Contents
| Item 8. | Financial Statements and Supplementary Data |
CONTENTS
37
Table of Contents
REPORT OF INDEPENDENT REGISTERED PUBLIC ACCOUNTING FIRM
To the Board of Directors and Stockholders
New Peoples Bankshares, Inc.
Honaker, Virginia
We have audited the accompanying consolidated balance sheets of New Peoples Bankshares, Inc. as of December 31, 2009 and 2008, and the related consolidated statements of income, stockholders’ equity, and cash flows for each of the years in the three-year period ended December 31, 2009. New Peoples Bankshares, Inc.’s management is responsible for these consolidated financial statements. Our responsibility is to express an opinion on these consolidated financial statements based on our audits.
We conducted our audits in accordance with the standards of the Public Company Accounting Oversight Board (United States). Those standards require that we plan and perform the audit to obtain reasonable assurance about whether the financial statements are free of material misstatement. An audit includes examining, on a test basis, evidence supporting the amounts and disclosures in the financial statements. An audit also includes assessing the accounting principles used and significant estimates made by management, as well as evaluating the overall financial statement presentation. We believe that our audits provide a reasonable basis for our opinion.
In our opinion, the consolidated financial statements referred to above present fairly, in all material respects, the financial position of New Peoples Bankshares, Inc. as of December 31, 2009 and 2008, and the results of its operations and its cash flows for each of years in the three-year period ended December 31, 2009 in conformity with accounting principles generally accepted in the United States of America.
As more fully discussed in Note 21, at December 31, 2009, New Peoples Bankshares, Inc. was in technical default under the terms of its line of credit agreement with a correspondent bank. Collateral for the line of credit includes New Peoples Bankshares, Inc.’s ownership in New Peoples Bank. Also, as discussed in Note 16, the Board of Directors of the Federal Reserve Bank of Richmond has prohibited the payment of dividends by New Peoples Bank to New Peoples Bankshares, Inc.
We also have audited, in accordance with the standards of the Public Company Accounting Oversight Board (United States), New Peoples Bankshares, Inc.’s internal control over financial reporting as of December 31, 2009, based on criteria established in Internal Control—Integrated Framework issued by the Committee of Sponsoring Organizations of the Treadway Commission (COSO), and our report dated March 15, 2010 expressed an unqualified opinion.
| /S/ BROWN, EDWARDS AND COMPANY, L.L.P. |
| CERTIFIED PUBLIC ACCOUNTANTS |
Christiansburg, Virginia
March 15, 2010
38
Table of Contents
REPORT OF INDEPENDENT REGISTERED PUBLIC ACCOUNTING FIRM
To the Board of Directors and
Stockholders of New Peoples Bankshares, Inc.
Honaker, Virginia
We have audited New Peoples Bankshares, Inc.’s internal control over financial reporting as of December 31, 2009, based on criteria established in Internal Control—Integrated Framework issued by the Committee of Sponsoring Organizations of the Treadway Commission (COSO). New Peoples Bankshares, Inc.’s management is responsible for maintaining effective internal control over financial reporting and for its assessment of the effectiveness of internal control over financial reporting, included in the accompanying Management’s Annual Report on Internal Control over Financial Reporting. Our responsibility is to express an opinion on the company’s internal control over financial reporting based on our audit.
We conducted our audit in accordance with the standards of the Public Company Accounting Oversight Board (United States). Those standards require that we plan and perform the audit to obtain reasonable assurance about whether effective internal control over financial reporting was maintained in all material respects. Our audit of internal control over financial reporting included obtaining an understanding of internal control over financial reporting, assessing the risk that a material weakness exists, and testing and evaluating the design and operating effectiveness of internal control based on the assessed risk. Our audit also included performing such other procedures as we considered necessary in the circumstances. We believe that our audit provides a reasonable basis for our opinion.
A company’s internal control over financial reporting is a process designed to provide reasonable assurance regarding the reliability of financial reporting and the preparation of financial statements for external purposes in accordance with generally accepted accounting principles. A company’s internal control over financial reporting includes those policies and procedures that (1) pertain to the maintenance of records that, in reasonable detail, accurately and fairly reflect the transactions and dispositions of the assets of the company; (2) provide reasonable assurance that transactions are recorded as necessary to permit preparation of financial statements in accordance with generally accepted accounting principles, and that receipts and expenditures of the company are being made only in accordance with authorizations of management and directors of the company; and (3) provide reasonable assurance regarding prevention or timely detection of unauthorized acquisition, use, or disposition of the company’s assets that could have a material effect on the financial statements.
Because of its inherent limitations, internal control over financial reporting may not prevent or detect misstatements. Also, projections of any evaluation of effectiveness to future periods are subject to the risk that controls may become inadequate because of changes in conditions, or that the degree of compliance with the policies or procedures may deteriorate.
In our opinion, New Peoples Bankshares, Inc. maintained, in all material respects, effective internal control over financial reporting as of December 31, 2009, based on criteria established in Internal Control—Integrated Framework issued by the Committee of Sponsoring Organizations of the Treadway Commission (COSO).
We have also audited, in accordance with the standards of the Public Company Accounting Oversight Board (United States), the balance sheets and the related statements of income, stockholders’ equity, and cash flows of New Peoples Bankshares, Inc., and our report dated March 15, 2010 expressed an unqualified opinion.
| /S/ BROWN, EDWARDS AND COMPANY, L.L.P. |
| CERTIFIED PUBLIC ACCOUNTANTS |
Christiansburg, Virginia
March 15, 2010
39
Table of Contents
DECEMBER 31, 2009 AND 2008
(IN THOUSANDS EXCEPT SHARE and SHARE DATA)
| 2009 | 2008 | |||||||
| ASSETS |
||||||||
| Cash and due from banks |
$ | 29,978 | $ | 22,099 | ||||
| Federal funds sold |
9,582 | 1,813 | ||||||
| Total Cash and Cash Equivalents |
39,560 | 23,912 | ||||||
| Investment Securities |
||||||||
| Available-for-sale |
2,606 | 3,449 | ||||||
| Loans receivable |
763,570 | 721,174 | ||||||
| Allowance for loan losses |
(18,588 | ) | (6,904 | ) | ||||
| Net Loans |
744,982 | 714,270 | ||||||
| Bank premises and equipment, net |
34,958 | 36,829 | ||||||
| Equity securities (restricted) |
3,996 | 3,903 | ||||||
| Other real estate owned |
5,643 | 2,496 | ||||||
| Accrued interest receivable |
4,292 | 4,537 | ||||||
| Life insurance investments |
10,549 | 10,153 | ||||||
| Goodwill and other intangibles |
4,514 | 4,633 | ||||||
| Deferred taxes |
5,400 | 1,153 | ||||||
| Other assets |
1,410 | 2,563 | ||||||
| Total Assets |
$ | 857,910 | $ | 807,898 | ||||
| LIABILITIES |
||||||||
| Deposits |
||||||||
| Demand deposits |
||||||||
| Noninterest bearing |
$ | 88,318 | $ | 95,448 | ||||
| Interest-bearing |
42,769 | 34,498 | ||||||
| Savings deposits |
90,467 | 89,787 | ||||||
| Time deposits |
539,160 | 485,955 | ||||||
| Total Deposits |
760,714 | 705,688 | ||||||
| FHLB advances |
25,383 | 26,582 | ||||||
| Accrued interest payable |
1,617 | 2,155 | ||||||
| Accrued expenses and other liabilities |
2,181 | 1,741 | ||||||
| Line of credit borrowing |
4,900 | 4,913 | ||||||
| Trust preferred securities |
16,496 | 16,496 | ||||||
| Total Liabilities |
811,291 | 757,575 | ||||||
| STOCKHOLDERS’ EQUITY |
||||||||
| Common stock - $2.00 par value; 50,000,000 shares authorized; |
20,018 | 20,017 | ||||||
| 10,009,037 and 10,008,902 shares issued and outstanding for 2009 and 2008, respectively Additional paid-in-capital |
21,683 | 21,683 | ||||||
| Retained earnings |
4,890 | 8,576 | ||||||
| Accumulated other comprehensive income (loss) |
28 | 47 | ||||||
| Total Stockholders’ Equity |
46,619 | 50,323 | ||||||
| Total Liabilities and Stockholders’ Equity |
$ | 857,910 | $ | 807,898 | ||||
The accompanying notes are an integral part of this statement.
40
Table of Contents
CONSOLIDATED STATEMENTS OF INCOME
FOR THE YEARS ENDED DECEMBER 31, 2009, 2008 AND 2007
(IN THOUSANDS EXCEPT SHARE AND PER SHARE DATA)
| 2009 | 2008 | 2007 | ||||||||||
| INTEREST AND DIVIDEND INCOME |
||||||||||||
| Loans including fees |
$ | 50,188 | $ | 51,911 | $ | 50,884 | ||||||
| Federal funds sold |
26 | 35 | 129 | |||||||||
| Investments |
89 | 208 | 254 | |||||||||
| Dividends on equity securities (restricted) |
75 | 163 | 180 | |||||||||
| Total Interest and Dividend Income |
50,378 | 52,317 | 51,447 | |||||||||
| INTEREST EXPENSE |
||||||||||||
| Deposits |
||||||||||||
| Demand |
233 | 240 | 164 | |||||||||
| Savings |
994 | 682 | 485 | |||||||||
| Time deposits below $100,000 |
9,807 | 12,556 | 14,851 | |||||||||
| Time deposits above $100,000 |
5,684 | 7,261 | 8,098 | |||||||||
| FHLB advances |
1,061 | 1,217 | 857 | |||||||||
| Other borrowings |
251 | 134 | — | |||||||||
| Trust Preferred Securities |
533 | 1,005 | 1,283 | |||||||||
| Total Interest Expense |
18,563 | 23,095 | 25,738 | |||||||||
| NET INTEREST INCOME |
31,815 | 29,222 | 25,709 | |||||||||
| PROVISION FOR LOAN LOSSES (Note 6) |
12,841 | 1,500 | 3,840 | |||||||||
| NET INTEREST INCOME AFTER PROVISION FOR LOAN LOSSES |
18,974 | 27,722 | 21,869 | |||||||||
| NONINTEREST INCOME |
||||||||||||
| Service charges |
2,648 | 2,704 | 2,455 | |||||||||
| Fees, commissions and other income |
1,708 | 1,398 | 994 | |||||||||
| Insurance and investment fees |
653 | 973 | 769 | |||||||||
| Life insurance investment income |
440 | 475 | 433 | |||||||||
| Total Noninterest Income |
5,449 | 5,550 | 4,651 | |||||||||
| NONINTEREST EXPENSES |
||||||||||||
| Salaries and employee benefits (Note 14) |
15,152 | 15,628 | 13,978 | |||||||||
| Occupancy expense |
2,044 | 2,215 | 1,776 | |||||||||
| Equipment expense |
2,469 | 2,345 | 2,254 | |||||||||
| Advertising and public relations |
433 | 477 | 437 | |||||||||
| Data processing and telecommunications |
1,500 | 1,341 | 1,114 | |||||||||
| FDIC Assessment |
2,184 | 724 | 367 | |||||||||
| Other real estate owned and repossessed vehicles |
860 | 134 | 27 | |||||||||
| Net loss (gains) on sale of other real estate owned |
143 | (612 | ) | — | ||||||||
| Other operating expenses |
5,062 | 4,367 | 3,721 | |||||||||
| Total Noninterest Expenses |
29,847 | 26,619 | 23,674 | |||||||||
| INCOME(LOSS) BEFORE INCOME TAXES |
(5,424 | ) | 6,653 | 2,846 | ||||||||
| INCOME TAX EXPENSE(BENEFIT) (Note 9) |
||||||||||||
| Current income tax expense |
(1,738 | ) | 1,916 | 614 | ||||||||
| Change of accounting estimate (Note 13) |
— | — | (638 | ) | ||||||||
| Total Income Tax Expense (benefit) |
(1,738 | ) | 1,916 | (24 | ) | |||||||
| NET INCOME (LOSS) |
$ | (3,686 | ) | $ | 4,737 | $ | 2,870 | |||||
| Earnings (Loss) Per Share |
||||||||||||
| Basic |
$ | (0.37 | ) | $ | 0.47 | $ | 0.29 | |||||
| Fully Diluted |
$ | (0.37 | ) | $ | 0.46 | $ | 0.28 | |||||
| Average Weighted Shares of Common Stock |
||||||||||||
| Basic |
10,008,943 | 9,980,348 | 9,957,949 | |||||||||
| Fully Diluted |
10,008,943 | 10,234,909 | 10,371,577 | |||||||||
The accompanying notes are an integral part of this statement.
41
Table of Contents
CONSOLIDATED STATEMENTS OF STOCKHOLDERS’ EQUITY
FOR THE YEARS ENDED DECEMBER 31, 2009, 2008 AND 2007
(IN THOUSANDS INCLUDING SHARE DATA)
| Shares of Common Stock |
Common Stock |
Additional Paid in Capital |
Retained Earnings |
Accumulated Other Comprehensive Income (Loss) |
Total Stockholders’ Equity |
Comprehensive Income (Loss) |
||||||||||||||||||
| Balance, December 31, 2006 |
7,657 | $ | 15,314 | $ | 21,465 | $ | 5,565 | $ | 2 | $ | 42,346 | $ | 3,107 | |||||||||||
| Net Income |
2,870 | 2,870 | 2,870 | |||||||||||||||||||||
| 13-for-10 stock split, September 12, 2007 |
2,298 | $ | 4,596 | (4,596 | ) | |||||||||||||||||||
| Unrealized gain (net of deferred tax of $4) on available-for-sale securities |
5 | 5 | 5 | |||||||||||||||||||||
| Stock Options Exercised |
4 | 9 | 19 | 28 | ||||||||||||||||||||
| Balance, December 31, 2007 |
9,959 | $ | 19,919 | $ | 21,484 | $ | 3,839 | $ | 7 | $ | 45,249 | $ | 2,875 | |||||||||||
| Net Income |
4,737 | 4,737 | 4,737 | |||||||||||||||||||||
| Unrealized gain(net of deferred tax of $21) on available-for-sale securities |
40 | 40 | 40 | |||||||||||||||||||||
| Stock Options Exercised |
49 | 98 | 199 | 297 | ||||||||||||||||||||
| Balance, December 31, 2008 |
10,008 | $ | 20,017 | $ | 21,683 | $ | 8,576 | $ | 47 | $ | 50,323 | $ | 4,777 | |||||||||||
| Net Income (Loss) |
(3,686 | ) | (3,686 | ) | (3,686 | ) | ||||||||||||||||||
| Unrealized loss(net of deferred tax of $10) on available-for-sale securities |
(19 | ) | (19 | ) | (19 | ) | ||||||||||||||||||
| Stock Options Exercised |
1 | 1 | — | 1 | ||||||||||||||||||||
| Balance, December 31, 2009 |
10,009 | $ | 20,018 | $ | 21,683 | $ | 4,890 | $ | 28 | $ | 46,619 | $ | (3,704 | ) | ||||||||||
The accompanying notes are an integral part of this statement.
42
Table of Contents
CONSOLIDATED STATEMENTS OF CASH FLOWS
FOR THE YEARS ENDED DECEMBER 31, 2009, 2008 AND 2007
(IN THOUSANDS)
| 2009 | 2008 | 2007 | ||||||||||
| CASH FLOWS FROM OPERATING ACTIVITIES |
||||||||||||
| Net Income (Loss) |
$ | (3,686 | ) | $ | 4,737 | $ | 2,870 | |||||
| Adjustments to reconcile net income to net cash provided by operating activities: |
||||||||||||
| Depreciation |
2,832 | 3,000 | 2,598 | |||||||||
| Provision for Loan Losses |
12,841 | 1,500 | 3,840 | |||||||||
| Income (less expenses) on Life Insurance |
(396 | ) | (408 | ) | (368 | ) | ||||||
| (Gain) loss on sale of fixed assets |
(1 | ) | 3 | — | ||||||||
| (Gain) loss on sale of foreclosed real estate |
143 | (612 | ) | — | ||||||||
| Adjustment of carrying value of foreclosed real estate |
577 | — | — | |||||||||
| Accretion of bond premiums/discounts |
— | (6 | ) | (19 | ) | |||||||
| Deferred tax (benefit) expense |
(4,247 | ) | 112 | (1,375 | ) | |||||||
| Amortization of core deposit intangible |
119 | 196 | 103 | |||||||||
| Net change in: |
||||||||||||
| Interest receivable |
245 | 432 | (829 | ) | ||||||||
| Other assets |
1,153 | (1,492 | ) | 867 | ||||||||
| Accrued interest payable |
(538 | ) | (667 | ) | 39 | |||||||
| Accrued expense and other liabilities |
440 | (176 | ) | (90 | ) | |||||||
| Net Cash Provided by Operating Activities |
9,483 | 6,619 | 7,636 | |||||||||
| CASH FLOWS FROM INVESTING ACTIVITIES |
||||||||||||
| Net increase in loans |
(49,299 | ) | (41,766 | ) | (102,228 | ) | ||||||
| Purchase of securities available for sale |
(816 | ) | (4,000 | ) | (4,990 | ) | ||||||
| Proceeds from sale and maturities of securities available-for-sale available-for-sale |
1,639 | 5,570 | 3,533 | |||||||||
| Purchase of Federal Reserve Bank stock |
— | (120 | ) | (128 | ) | |||||||
| (Purchase) sale of Federal Home Loan Bank stock |
(93 | ) | 475 | (1,978 | ) | |||||||
| Acquisition of branches |
||||||||||||
| Loans acquired |
— | — | (13,691 | ) | ||||||||
| Deposits assumed |
— | — | 60,380 | |||||||||
| Bank premises |
— | — | (1,178 | ) | ||||||||
| Goodwill and other intangibles |
— | — | (4,932 | ) | ||||||||
| Payments for the purchase of property |
(1,708 | ) | (4,940 | ) | (6,874 | ) | ||||||
| Proceeds from sales of other real estate owned |
2,627 | 1,804 | — | |||||||||
| Net Cash Used in Investing Activities |
(47,650 | ) | (42,977 | ) | (72,086 | ) | ||||||
| CASH FLOW FROM FINANCING ACTIVITIES |
||||||||||||
| Common stock options exercised |
1 | 297 | 28 | |||||||||
| Net increase in line of credit borrowings |
(13 | ) | 4,913 | — | ||||||||
| Net change in: |
||||||||||||
| Demand deposits |
1,141 | 19,409 | 12,582 | |||||||||
| Savings deposits |
680 | 45,066 | (3,425 | ) | ||||||||
| Time deposits |
53,205 | (15,820 | ) | 15,310 | ||||||||
| Net increase (decrease) in FHLB borrowings |
(1,199 | ) | (15,852 | ) | 42,434 | |||||||
| Net Cash Provided by Financing Activities |
53,815 | 38,013 | 66,929 | |||||||||
| Net increase in cash and cash equivalents |
15,648 | 1,655 | 2,376 | |||||||||
| Cash and Cash Equivalents, Beginning of Year |
23,912 | 22,257 | 19,881 | |||||||||
| Cash and Cash Equivalents, End of Year |
$ | 39,560 | $ | 23,912 | $ | 22,257 | ||||||
| Supplemental Disclosure of Cash Paid During the Year for: |
||||||||||||
| Interest |
$ | 18,025 | $ | 22,428 | $ | 25,777 | ||||||
| Taxes |
$ | 1,300 | $ | 1,625 | $ | 1,153 | ||||||
| Supplemental Disclosure of Non Cash Transactions: |
||||||||||||
| Other real estate acquired in settlement of foreclosed loans |
$ | 6,494 | $ | 1,637 | $ | 521 | ||||||
| Loans made to finance sale of foreclosed real estate |
$ | 1,113 | $ | 50 | $ | 828 | ||||||
The accompanying notes are an integral part of this statement.
43
Table of Contents
NOTES TO CONSOLIDATED FINANCIAL STATEMENTS
NOTE 1 NATURE OF OPERATIONS
Nature of Operations – New Peoples Bankshares, Inc. (“The Company”) is a bank holding company whose principal activity is the ownership and management of a community bank. New Peoples Bank (“Bank”) was organized and incorporated under the laws of the Commonwealth of Virginia on December 9, 1997. The Bank commenced operations on October 28, 1998, after receiving regulatory approval. As a state chartered member bank, the Bank is subject to regulation by the Virginia Bureau of Financial Institutions, the Federal Deposit Insurance Corporation and the Federal Reserve Bank. The Bank provides general banking services to individuals, small and medium size businesses and the professional community of southwestern Virginia, southern West Virginia, and eastern Tennessee. On June 9, 2003, the Company formed two wholly owned subsidiaries, NPB Financial Services, Inc. and NPB Web Services, Inc. On July 7, 2004 the Company established NPB Capital Trust I for the purpose of issuing trust preferred securities. On September 27, 2006, the Company established NPB Capital Trust 2 for the purpose of issuing additional trust preferred securities.
NOTE 2 SUMMARY OF SIGNIFICANT ACCOUNTING POLICIES:
Consolidation Policy – The consolidated financial statements include the Company, the Bank, NPB Financial Services, Inc., and NPB Web Services, Inc. All significant intercompany balances and transactions have been eliminated. In accordance with ASC 810 R, NPB Capital Trust I and 2 are not included in the consolidated financial statements.
Use of Estimates – The preparation of financial statements in conformity with generally accepted accounting principles requires management to make estimates and assumptions that affect the reported amounts of assets and liabilities, disclosure of contingent assets and liabilities at the date of the financial statements and the reported amounts of revenues and expenses during the reporting period. Actual results could differ from those estimates. The determination of the adequacy of the allowance for loan losses is based on estimates that are particularly susceptible to significant changes in the economic environment and market conditions.
Cash and Cash Equivalents – Cash and cash equivalents as used in the cash flow statements include cash and due from banks and federal funds sold.
Investment Securities – Management determines the appropriate classification of securities at the time of purchase. If management has the intent and the Bank has the ability at the time of purchase to hold securities until maturity, they are classified as held to maturity and carried at amortized historical cost. Securities not intended to be held to maturity are classified as available for sale and carried at fair value. Securities available for sale are intended to be used as part of the Bank’s asset and liability management strategy and may be sold in response to changes in interest rates, prepayment risk or other similar factors.
The amortization of premiums and accretion of discounts are recognized in interest income using the effective interest method over the period to maturity. Realized gains and losses on dispositions are based on the net proceeds and the adjusted book value of the securities sold, using the specific identification method. Realized gains (losses) on securities available-for-sale are included in noninterest income and, when applicable, are reported as a reclassification adjustment, net of tax, in other comprehensive income. Unrealized gains and losses on investment securities available for sale are based on the difference between book value and fair value of each security. These gains and losses are credited or charged to stockholders’ equity, whereas realized gains and losses flow through the income statement.
Loans – Loans are carried on the balance sheet at unpaid principal balance, net of any unearned interest and the allowance for loan losses. Interest income on loans is computed using the effective interest method, except where serious doubt exists as to the collectibility of the loan, in which case accrual of the income is discontinued.
It is the Bank’s policy to stop accruing interest on a loan, and classify that loan as non-accrual under the following circumstances: (a) whenever we are advised by the borrower that scheduled payment or interest payments cannot be met, (b) when our best judgment indicates that payment in full of principal and interest can no longer be expected, or (c) when any such loan or obligation becomes delinquent for 90 days unless it is both well secured and in the process of collection. All interest accrued but not collected for loans that are placed on nonaccrual or charged off are reversed against interest income. The interest on these loans is accounted for on the cash basis or cost-recovery method, until qualifying for return to accrual. Loans are returned to accrual status when all the principal and interest
44
Table of Contents
NEW PEOPLES BANKSHARES, INC.
NOTES TO CONSOLIDATED FINANCIAL STATEMENTS (CONTINUED)
NOTE 2 SUMMARY OF SIGNIFICANT ACCOUNTING POLICIES (CONTINUED):
Loans (Continued) – amounts contractually due are brought current and prospects for future contractual payments are reasonably assured.
A loan is considered impaired when, based on current information and events, it is probable that the Company will be unable to collect the scheduled payments of principal or interest when due according to the contractual terms of the loan agreement. Factors considered by management in determining impairment include payment status, collateral value, and the probability of collecting scheduled principal and interest payments when due. Loans that experience insignificant payment delays and payment shortfalls generally are not classified as impaired. Management determines the significance of payment delays and payment shortfalls on a case-by-case basis, taking into consideration all of the circumstances surrounding the loan and the borrower, including the length of the delay, the reasons for the delay, the borrower’s prior payment record, and the amount of the shortfall in relation to the principal and interest owed. Impairment is measured on a loan by loan basis for commercial and construction loans by either the present value of expected future cash flows discounted at the loan’s effective interest rate, the loan’s obtainable market price, or the fair value of the collateral if the loan is collateral dependent.
Significant Group Concentrations of Credit Risk – The Company recognizes a concentration as any obligation, direct or indirect, of the same or affiliated interests which represent 25% or more of the Company’s capital structure, or $11.7 million as of December 31, 2009. Most of the Company’s activities are with customers located within the southwest Virginia, southern West Virginia, and northeastern Tennessee region. Certain concentrations may pose credit risk. The Bank does not have any significant concentrations to any one industry or customer.
Allowance for Loan Losses – The allowance for loan losses is maintained at a level that, in management’s judgment, is adequate to absorb credit losses inherent in the loan portfolio. The loan portfolio is analyzed periodically and loans are assigned a risk rating. Allowances for impaired loans are generally determined based on collateral values or the present value of estimated cash flows. A general allowance is made for all other loans not considered impaired as deemed appropriate by management. In determining the adequacy of the allowance, management considers the following factors: the nature of the portfolio, credit concentrations, trends in historical loss experience, specific impaired loans, the estimated value of any underlying collateral, prevailing environmental factors and economic conditions, and other inherent risks. While management uses available information to recognize losses on loans, further reductions in the carrying amounts of loans may be necessary based on changes in collateral values and changes in estimates of cash flows on impaired loans. This evaluation is inherently subjective as it requires estimates that are susceptible to significant revision as more information becomes available.
The allowance is increased by a provision for loan losses, which is charged to expense and reduced by charge-offs, net of recoveries. Loans are charged against the allowance for loan losses when management believes that collectability of the principal is unlikely. Past due status is determined based on contractual terms.
Bank Premises and Equipment – Land, buildings and equipment are recorded at cost less accumulated depreciation. Depreciation is computed using the straight-line method over the following estimated useful lives:
| Type |
Estimated useful life | |
| Buildings |
39 years | |
| Paving and landscaping |
15 years | |
| Computer equipment and software |
3 to 5 years | |
| Vehicles |
5 years | |
| Furniture and other equipment |
5 to 7 years |
Advertising Cost – Advertising costs are expensed in the period incurred.
Stock Options – The Company records compensation related to stock options pursuant to ASC 718 which requires the estimated fair market value of the expense to be reflected over the period the award is earned which is presumed to be the vesting period. No stock options were granted in 2009, 2008 or 2007.
45
Table of Contents
NEW PEOPLES BANKSHARES, INC.
NOTES TO CONSOLIDATED FINANCIAL STATEMENTS (CONTINUED)
NOTE 2 SUMMARY OF SIGNIFICANT ACCOUNTING POLICIES (CONTINUED):
Income Taxes – Deferred income tax assets and liabilities are determined using the liability (or balance sheet) method. Under this method, the net deferred tax asset or liability is determined based on the tax effects of the temporary differences between the book and tax bases of the various balance sheet assets and liabilities and gives current recognition to changes in tax rates and laws.
In the event the Company has unrecognized tax expense in future accounting periods, the Company will recognize interest in interest expense and penalties in operating expenses. There were no interest or penalties related to an unrecognized tax position for the years ended December 31, 2009, 2008 and 2007. Because of the immaterial impact of deferred tax accounting, other than interest and penalties, the reversal of the Company’s treatment by taxing authorities would not affect the annual effective tax rate but would defer or accelerate the payment of cash to the taxing authority. The Company’s tax filings for years ended 2006 through 2008 are currently open to audit under statutes of limitations by the Internal Revenue Service (“IRS”) and the Virginia Department of Taxation.
Financial Instruments – Off-balance-sheet instruments – In the ordinary course of business, the Bank has entered into commitments to extend credit. Such financial instruments are recorded in the financial statements when they are funded.
Comprehensive Income – Generally accepted accounting principles require that recognized revenue, expenses, gains and losses be included in net income. Although certain changes in assets and liabilities, such as unrealized gains and losses on available for sale securities, are reported as a separate component of the equity section of the balance sheet, such items, along with net income, are components of comprehensive income.
Earnings Per Share – Basic earnings per share computations are based on the weighted average number of shares outstanding during each year. Dilutive earnings per share reflects the additional common shares that would have been outstanding if dilutive potential common shares had been issued. Potential common shares that may be issued relate to outstanding options and are determined by the Treasury Method.
For the year ending December 31, 2009, potential common shares were anti-dilutive and were not included in the calculation. Basic and diluted net income per common share calculations follows:
| (Amounts in Thousands, Except Share and Per Share Data) |
For the years ended December 31, | |||||||||
| 2009 | 2008 | 2007 | ||||||||
| Net income available to common shareholders |
$ | (3,686 | ) | $ | 4,737 | $ | 2,870 | |||
| Weighted average shares outstanding |
10,008,943 | 9,980,348 | 9,957,949 | |||||||
| Dilutive shares for stock options |
— | 254,561 | 413,628 | |||||||
| Weighted average dilutive shares outstanding |
10,008,943 | 10,234,909 | 10,371,577 | |||||||
| Basic earnings per share |
$ | (0.37 | ) | $ | 0.47 | $ | 0.29 | |||
| Diluted earnings per share |
$ | (0.37 | ) | $ | 0.46 | $ | 0.28 | |||
Other Real Estate Owned – Other real estate owned represents properties acquired through foreclosure or deed taken in lieu of foreclosure. At the time of acquisition, these properties are recorded at the lower of cost or fair value less estimated costs to sell. Expenses incurred in connection with operating these properties and subsequent write-downs, if any, are charged to expense. Subsequent to foreclosure, management periodically considers the adequacy of the reserve for losses on the property. Gains and losses on the sales of these properties are credited or charged to income in the year of the sale.
Business Combinations – For purchase acquisitions accounted for as a business combination, the Company is required to record the assets acquired, including identified intangible assets and liabilities assumed at their fair value, which in many instances involves estimates based on third party valuations, such as appraisals, or internal valuations based on discounted cash flow analyses or other valuation techniques. The determination of the useful lives of intangible assets is subjective, as is the appropriate amortization method for such intangible assets. In addition, purchase acquisitions may result in goodwill, which is subject to ongoing periodic impairment testing based on the fair value of net assets acquired compared to the carrying value of goodwill. Changes in acquisition multiples, the overall interest rate environment, or the continuing operations of the assets acquired could have a significant
46
Table of Contents
NEW PEOPLES BANKSHARES, INC.
NOTES TO CONSOLIDATED FINANCIAL STATEMENTS (CONTINUED)
NOTE 2 SUMMARY OF SIGNIFICANT ACCOUNTING POLICIES (CONTINUED):
Business Combinations (continued) - impact on the periodic impairment testing. For additional discussion concerning our valuation of intangible assets, see Note 12, “Intangible Assets.”
NOTE 3 DEPOSITS IN AND FEDERAL FUNDS SOLD TO BANKS:
The Bank had federal funds sold and cash on deposit with other commercial banks amounting to $9.6 million and $1.8 million at December 31, 2009 and 2008, respectively. Deposit amounts at other commercial banks may, at times, exceed federally insured limits.
NOTE 4 INVESTMENT SECURITIES:
The amortized cost and estimated fair value of securities are as follows:
| (Dollars are in thousands) |
Amortized Cost |
Gross Unrealized Gains |
Gross Unrealized Losses |
Approximate Fair Value | ||||||||
| December 31, 2009 |
||||||||||||
| Available for Sale | ||||||||||||
| U.S. Government Agencies |
$ | 1,999 | $ | 38 | $ | — | $ | 2,037 | ||||
| Taxable municipals |
317 | — | 5 | 312 | ||||||||
| Mortgage backed securities |
249 | 8 | — | 257 | ||||||||
| Total Securities AFS |
$ | 2,565 | $ | 46 | $ | 5 | $ | 2,606 | ||||
| December 31, 2008 |
||||||||||||
| Available for Sale | ||||||||||||
| U.S. Government Agencies |
$ | 3,000 | $ | 63 | $ | — | $ | 3,063 | ||||
| Taxable municipals |
— | — | — | — | ||||||||
| Mortgage backed securities |
378 | 7 | — | 386 | ||||||||
| Total Securities AFS |
$ | 3,378 | $ | 70 | $ | — | $ | 3,449 | ||||
At December 31, 2009 and 2008, the available for sale portfolio included one individual investment for which the fair market value was less than amortized cost. No securities had an other than temporary impairment.
The amortized cost and fair value of investment securities at December 31, 2009, by contractual maturity, are shown in the following schedule. Expected maturities will differ from contractual maturities because borrowers may have the right to call or prepay obligations with or without call or prepayment penalties.
| (Dollars are in thousands) Securities Available for Sale |
Amortized Cost |
Fair Value |
Weighted Average Yield |
||||||
| Due in one year or less |
$ | 1,500 | $ | 1,534 | 3.18 | % | |||
| Due after one year through five years |
748 | 760 | 3.20 | % | |||||
| Due after five years through fifteen years |
317 | 312 | 5.34 | % | |||||
| Total |
$ | 2,565 | $ | 2,606 | 3.44 | % | |||
Investment securities with a carrying value of $920 thousand and $414 thousand at December 31, 2009 and 2008, were pledged to secure public deposits and for other purposes required by law.
The Bank, as a member of the Federal Reserve Bank and the Federal Home Loan Bank, is required to hold stock in each. These equity securities are restricted from trading and are recorded at a cost of $4.0 million and $3.9 million as of December 31, 2009 and 2008, respectively.
47
Table of Contents
NEW PEOPLES BANKSHARES, INC.
NOTES TO CONSOLIDATED FINANCIAL STATEMENTS (CONTINUED)
NOTE 5 LOANS:
Loans receivable outstanding at December 31, are summarized as follows:
| (Dollars are in thousands) |
2009 | 2008 | ||||
| Commercial, financial and agricultural |
$ | 118,844 | $ | 110,060 | ||
| Real estate-construction |
71,854 | 64,595 | ||||
| Real estate-mortgages |
504,071 | 483,471 | ||||
| Installment loans to individuals |
68,801 | 63,048 | ||||
| Total loans |
$ | 763,570 | $ | 721,174 | ||
The following is a summary of information at December 31, pertaining to nonperforming loans:
| (Dollars are in thousands) |
2009 | 2008 | ||||
| Nonaccrual Loans |
$ | 24,713 | $ | 6,414 | ||
| Loans past due 90 days or more still accruing interest |
3,875 | 33 | ||||
| Total Non-performing Loans |
$ | 28,588 | $ | 6,447 | ||
The following table presents the Company’s investment in loans considered to be impaired and related information on those impaired loans:
| (Dollars are in thousands) |
2009 | 2008 | 2007 | ||||||
| Recorded investments in loans considered to be impaired |
$ | 30,138 | $ | 6,844 | $ | 9,627 | |||
| Loans considered to be impaired that were on a non-accrual basis |
24,713 | 6,414 | 2,946 | ||||||
| Recorded investment in impaired loans with related allowance |
26,063 | 642 | 7,450 | ||||||
| Allowance for loan losses related to loans considered to be impaired |
8,836 | 218 | 1,273 | ||||||
| Average recorded investment in impaired loans |
22,145 | 6,239 | 6,130 | ||||||
| Total interest income not recognized on impaired loans |
1,355 | 221 | 227 | ||||||
| Recorded investment in impaired loans with no related allowance |
4,075 | 6,202 | 2,177 | ||||||
NOTE 6 ALLOWANCE FOR LOAN LOSSES:
A summary of transactions in the allowance for loan losses is as follows:
| (Dollar are in thousands) |
2009 | 2008 | 2007 | |||||||||
| Balance, beginning of year |
$ | 6,904 | $ | 6,620 | $ | 4,870 | ||||||
| Provision for loan losses |
12,841 | 1,500 | 3,840 | |||||||||
| Recoveries of loans charged off |
119 | 95 | 76 | |||||||||
| Loans charged off |
(1,276 | ) | (1,311 | ) | (2,166 | ) | ||||||
| Balance, End of Year |
$ | 18,588 | $ | 6,904 | $ | 6,620 | ||||||
| Percentage of Loans |
2.43 | % | 0.96 | % | 0.97 | % | ||||||
NOTE 7 BANK PREMISES AND EQUIPMENT:
Bank premises and equipment at December 31, are summarized as follows:
| (Dollars are in thousands) |
2009 | 2008 | ||||||
| Land |
$ | 10,480 | $ | 10,423 | ||||
| Buildings and improvements |
22,184 | 22,113 | ||||||
| Furniture and equipment |
12,235 | 15,971 | ||||||
| Vehicles |
706 | 668 | ||||||
| Construction in progress |
1,423 | 1,999 | ||||||
| 47,029 | 51,174 | |||||||
| Less accumulated depreciation |
(12,071 | ) | (14,345 | ) | ||||
| Bank Premises and Equipment |
$ | 34,958 | $ | 36,829 | ||||
48
Table of Contents
NEW PEOPLES BANKSHARES, INC.
NOTES TO CONSOLIDATED FINANCIAL STATEMENTS (CONTINUED)
NOTE 7 BANK PREMISES AND EQUIPMENT (CONTINUED):
Depreciation expense for 2009, 2008, and 2007 was $2.8 million, $3.0 million, and $2.6 million, respectively.
At December 31, 2009, construction in progress included the costs of buildings and land purchased for a new branch in Princeton, West Virginia. The Princeton location is anticipated to operate as a full service branch location in 2010 or 2011 at no additional cost to complete. At December 31, 2008, construction in progress included the costs of building and land purchased for new branches in Duffield, Virginia and Princeton, West Virginia. In December 2008, the Board of Directors resolved to sell the Duffield location. It is being marketed at a projected net sales price greater than book value; however, the length of time it will take to find a qualified buyer is not known. The Duffield property is not being depreciated. At December 31, 2009, the Duffield facility was transferred to other real estate owned until sold.
Furniture and equipment and accumulated depreciation were reduced by $3.2 million, respectively, at December 31, 2009 to dispose of fully depreciated assets.
NOTE 8 OTHER TIME DEPOSITS:
The aggregate amount of time deposits with a minimum denomination of $100,000 was $188.4 million and $165.6 million at December 31, 2009 and 2008, respectively. At December 31, 2009, the scheduled maturities of certificates of deposit are as follows (dollars are in thousands):
| 2010 |
$ | 471,024 | |
| 2011 |
34,934 | ||
| 2012 |
19,094 | ||
| 2013 |
5,301 | ||
| 2014 |
4,868 | ||
| After five years |
3,939 | ||
| Total |
$ | 539,160 | |
NOTE 9 INCOME TAX EXPENSE:
The components of income tax expense for the years ended December 31, are as follows:
| (Dollars are in thousands) |
2009 | 2008 | 2007 | ||||||||
| Current expense |
$ | 2,089 | $ | 1,804 | $ | 1,512 | |||||
| Deferred expense (benefits) |
(3,827 | ) | 112 | (1,536 | ) | ||||||
| Net income tax (benefits) |
$ | (1,738 | ) | $ | 1,916 | $ | (24 | ) | |||
The deferred tax expense (benefit) resulting from temporary differences for the years ended December 31 is as follows:
| (Dollar are in thousands) |
2009 | 2008 | 2007 | |||||||||
| Organization and start-up cost |
$ | 1 | $ | 2 | $ | 2 | ||||||
| Provision for loan losses |
(3,911 | ) | (127 | ) | (642 | ) | ||||||
| Depreciation |
(21 | ) | 143 | (74 | ) | |||||||
| Deferred compensation expense |
(48 | ) | (39 | ) | (34 | ) | ||||||
| Accrued employee benefits |
(140 | ) | 81 | (172 | ) | |||||||
| Other tax adjustment |
292 | 52 | 22 | |||||||||
| Earnings on bank owned life insurance |
— | — | (638 | ) | ||||||||
| Deferred Income Tax Expenses (Benefit) |
$ | (3,827 | ) | $ | 112 | $ | (1,536 | ) | ||||
49
Table of Contents
NEW PEOPLES BANKSHARES, INC.
NOTES TO CONSOLIDATED FINANCIAL STATEMENTS (CONTINUED)
NOTE 9 INCOME TAX EXPENSE (CONTINUED):
The net deferred tax assets and liabilities resulting from temporary differences as of December 31 are summarized as follows:
| (Dollars are in thousands |
2009 | 2008 | 2007 | ||||||
| Deferred Tax Assets: |
|||||||||
| Organization and start-up cost |
$ | — | $ | 1 | $ | 3 | |||
| Allowance for loan losses |
6,217 | 2,306 | 2,179 | ||||||
| Deferred compensation |
263 | 215 | 176 | ||||||
| Accrued employee benefits |
231 | 91 | 172 | ||||||
| Nonaccrual loan interest |
172 | — | — | ||||||
| Amortization of core deposits |
109 | 26 | 26 | ||||||
| Capitalized interest and repair expense |
16 | 12 | 18 | ||||||
| Total Assets |
7,008 | 2,651 | 2,574 | ||||||
| Deferred Tax Liabilities |
|||||||||
| Accelerated depreciation |
1,360 | 1,381 | 1,238 | ||||||
| Amortization of goodwill |
234 | 93 | 47 | ||||||
| Unrealized gain on securities available for sale |
14 | 24 | 4 | ||||||
| Total Liabilities |
1,608 | 1,498 | 1,289 | ||||||
| Net deferred Tax Asset |
$ | 5,400 | $ | 1,153 | $ | 1,285 | |||
The following table summarizes the differences between the actual income tax expense and the amounts computed using the federal statutory tax rates:
| (Dollars are in thousands) |
2009 | 2008 | 2007 | |||||||||
| Income tax expense at the applicable federal rate |
$ | (1,844 | ) | $ | 2,262 | $ | 968 | |||||
| Permanent differences resulting from: |
||||||||||||
| Nondeductible expenses |
14 | 15 | 40 | |||||||||
| Tax exempt interest income |
(63 | ) | (160 | ) | (190 | ) | ||||||
| State income taxes less federal tax effect |
58 | 51 | 40 | |||||||||
| Bank owned life insurance |
(149 | ) | (139 | ) | (125 | ) | ||||||
| Change of accounting estimate |
— | — | (638 | ) | ||||||||
| Other adjustments |
246 | (113 | ) | (119 | ) | |||||||
| Income Tax Expense (benefit) |
$ | (1,738 | ) | $ | 1,916 | $ | (24 | ) | ||||
NOTE 10 RELATED PARTY TRANSACTIONS:
During the year, officers and directors (and companies controlled by them) were customers of and had loan transactions with the Bank in the normal course of business which amounted to $7.3 million at December 31, 2009 and $12.4 million at December 31, 2008. During the year ended December 31, 2009, total principal additions were $6.3 million and principal payments were $5.2 million, including renewals and advances on revolving lines of credit. During the year ended December 31, 2008, total principal additions were $11.7 million and principal payments were $10.6 million, including renewals and advances on revolving lines of credit. These transactions were made on substantially the same terms as those prevailing for other customers and did not involve any abnormal risk. Total related party deposits held at the Bank were $15.6 million and $16.9 million at the end of years 2009 and 2008, respectively.
NOTE 11 SIGNIFICANT ACQUISITION:
On June 29, 2007, the Bank finalized the purchase of assets and assumption of liabilities of two branches of FNB Southeast. The acquisition of the branches was accounted for as a business combination and, as the purchase price exceeded the value of the net identified tangible and intangible assets acquired, resulted in $4.1 million of goodwill being recorded as an intangible asset on the accompanying balance sheet. The acquisition provided, in addition to other factors, a strategic opportunity to expand into these markets without the delay normally experienced in building a branch and future growth.
50
Table of Contents
NEW PEOPLES BANKSHARES, INC.
NOTES TO CONSOLIDATED FINANCIAL STATEMENTS (CONTINUED)
NOTE 11 SIGNIFICANT ACQUISITION (CONTINUED):
The acquisition transaction resulted in an estimated fair value of $13.7 million in loans acquired and $60.4 million in deposits assumed. The estimated core deposit premium is $810 thousand and is being amortized over 6.84 years.
In October 2007, the Bank agreed to purchase the $6.5 million remaining loan portfolio and interest receivable from FNB Southeast at a 28.42% discount. In addition, the Bank also obtained the right to collect on previously charged-off credits of FNB Southeast in the market area totaling $658 thousand. At the time of settlement, November 2, 2007, the outstanding balance of the notes purchased was $6.2 million and the discount recorded was $2.2 million.
The outstanding balance of the notes purchased was $2.2 million and $3.2 million at December 31, 2009 and 2008, respectively. The discount balance was $626 thousand and $1.2 million at December 31, 2009 and 2008, respectively.
NOTE 12 INTANGIBLE ASSETS:
In 2007, the Bank completed the acquisition of two branches in which certain intangible assets were identified related to the value of core deposits. The estimated fair value of the core deposits was determined based on the present value of future cash flow related to those deposits considering the industry standard “financial instrument” type present value methodology. All-in costs and runoff balances by year are discounted by term specific Federal Home Loan Bank advance rates used as a measure of the best available approximate alternative costs of funds. The estimated economic advantage embedded in the acquired deposits as compared to alternative values is the core deposit intangible.
| (Dollars are in thousands) |
Gross Carrying Value |
Accumulated Amortization |
Net Carrying Value | ||||||
| December 31, 2009 |
|||||||||
| Amortizable core deposit intangibles |
$ | 810 | $ | 418 | $ | 392 | |||
| Unamortizable goodwill |
$ | 4,122 | $ | — | $ | 4,122 | |||
| December 31, 2008 |
|||||||||
| Amortizable core deposit intangibles |
$ | 810 | $ | 299 | $ | 511 | |||
| Unamortizable goodwill |
$ | 4,122 | $ | — | $ | 4,122 | |||
Amortization expense related to these intangibles is based upon the average economic life of the core deposits. The estimates of expense for the periods are as indicated below using the sum of the years’ digits method of amortization.
| (Dollars are in thousands) |
|||
| Estimated amortization expense |
|||
| For year ended December 31, 2010 |
$ | 131 | |
| For year ended December 31, 2011 |
101 | ||
| For year ended December 31, 2012 |
70 | ||
| For year ended December 31, 2013 |
45 | ||
| For year ended December 31, 2014 |
8 | ||
| Total |
$ | 355 | |
Goodwill is tested at least annually to determine if there is any impairment. The test conducted in accordance with ASC 350 occurred as of November 30, 2009 and on an annual basis on this date unless it is deemed necessary to test for impairment on a more frequent basis. No impairment was recognized in 2009.
51
Table of Contents
NEW PEOPLES BANKSHARES, INC.
NOTES TO CONSOLIDATED FINANCIAL STATEMENTS (CONTINUED)
NOTE 13 CHANGE OF ACCOUNTING ESTIMATE:
During the third quarter of 2007, the Company changed its intention related to its ownership of bank owned life insurance on members of management. When the life insurance was purchased, the determination was made that the insurance policies may be cashed in before the death of an insured employee creating a potential taxable event at that time. During September 2007, the Board of Directors restructured the life insurance program and decided that the policies in existence at that time as well as any additional policies to be purchased would be held to the death of the insured at which time the Company will receive the proceeds in a tax free transaction. Therefore, as a result deferred taxes were adjusted by $638 thousand which had been previously provided and income tax expense was reduced by the same amount during the third quarter of 2007. The adjustment was reflected as a change of accounting estimate in accordance with ASC 250 Accounting Changes and Error Corrections.
NOTE 14 RETIREMENT PLANS:
The Company has established a qualified defined contribution plan that covers all full time employees. Under the plan, the Company matches employee contributions up to a maximum of 5% of their salary. The Company contributed $443 thousand, $479 thousand, and $393 thousand to the defined contribution plan for 2009, 2008 and 2007, respectively.
In addition, in 2002, the Bank established a salary continuation plan for key executives, which is funded by single premium life insurance policies. Expenses related to the plan were $143 thousand, $113 thousand, and $101 thousand, for 2009, 2008 and 2007, respectively.
NOTE 15 STOCK OPTION PLAN:
New Peoples’ Stock Option Plan (“the Plan”) was adopted on September 27, 2001. The purpose of the Plan is to reward employees and directors for services rendered and investment risks undertaken to date and to promote the success of the Company by providing incentives to employees and directors that will promote the identification of their personal interest with the long-term financial success of the Company and with growth in shareholder value. The Plan provides that options for up to 1,287,000 shares of the Company’s common stock may be issued to employees and directors. The exercise price may not be less than 100% of the fair market value of the shares on the award date. Each award becomes exercisable in the event of a change in control of the Company. All options are subject to exercise or forfeiture if the Company’s capital falls below minimum requirements, as determined by its primary state or federal regulator. The Plan will expire on May 31, 2011, unless terminated earlier by the board of directors. At December 31, 2009, there were 235,176 additional shares available for grant under the Plan. All options granted and outstanding are fully vested. The Company did not grant any options in 2009, 2008 and 2007. The intrinsic values of stock options exercised were $1 thousand, $343 thousand, and $31 thousand for 2009, 2008 and 2007.
Information about stock options outstanding at December 31, 2009 follows:
| Exercise Price |
Number Outstanding and Exercisable |
Weighted Average Remaining Contractual Life |
Weighted Average Exercise | ||||
| $ 5.25 |
224,446 | 2.00 years | $ | 5.25 | |||
| $ 6.99 |
192,385 | 3.51 years | $ | 6.99 | |||
| $ 9.44 |
125,710 | 4.93 years | $ | 9.44 | |||
| $ 11.54 |
377,715 | 5.97 years | $ | 11.54 | |||
| Totals |
920,256 | 4.35 years | $ | 8.77 | |||
52
Table of Contents
NEW PEOPLES BANKSHARES, INC.
NOTES TO CONSOLIDATED FINANCIAL STATEMENTS (CONTINUED)
NOTE 15 STOCK OPTION PLAN (CONTINUED):
A summary of the status of the Company’s stock option plan is presented below:
| 2009 | 2008 | 2007 | |||||||||||||||||
| Number of Shares |
Weighted Average Exercise Price |
Number of Shares |
Weighted Average Exercise Price |
Number of Shares |
Weighted Average Exercise Price |
||||||||||||||
| Outstanding and exercisable, Beginning of year |
962,791 | $ | 8.80 | 1,036,721 | $ | 8.68 | 809,062 | $ | 11.28 | ||||||||||
| Effect of 13 for 10 stock split effected in the form of a stock dividend |
239,389 | (2.60 | ) | ||||||||||||||||
| Exercised |
(135 | ) | 5.25 | (49,425 | ) | 6.03 | (4,380 | ) | 6.93 | ||||||||||
| Forfeited |
(42,400 | ) | 9.50 | (24,505 | ) | 9.55 | (7,350 | ) | 13.03 | ||||||||||
| Outstanding and exercisable, end of year |
920,256 | $ | 8.77 | 962,791 | $ | 8.80 | 1,036,721 | $ | 8.68 | ||||||||||
NOTE 16 DIVIDEND LIMITATIONS ON SUBSIDIARY BANK:
The principal source of funds of the Company is dividends paid by the Bank. The Federal Reserve Act restricts the amount of dividends the Bank may pay. Approval by the Board of Governors of the Federal Reserve System is required if the dividends declared by a state member bank, in any year, exceed the sum of (1) net income of the current year and (2) income net of dividends for the preceding two years. In October 2009, a restriction prohibiting the payment of dividends from the Bank to the Company was imposed by the Federal Reserve Bank of Richmond. Therefore, no dividends will be available to the Company from the Bank until such restriction is removed.
NOTE 17 LEASING ACTIVITIES:
The Company’s leasing activities consist of the leasing of land and buildings under agreements in which the Bank is lessee. These leases have been classified as operating leases.
The following is a schedule by years of future minimum rental payments in thousands, required under non-cancelable operating leases that have initial or remaining non-cancelable lease terms in excess of one year as of December 31, 2009:
| Year ending December 31: |
|||
| 2010 |
$ | 33 | |
| 2011 |
33 | ||
| 2012 |
33 | ||
| 2013 |
33 | ||
| 2014 |
34 | ||
| Thereafter |
79 | ||
| Total minimum payments required |
$ | 245 | |
Rental commitments of less than one year are not included in the above schedule. Rentals charged to operations under operating leases were $33 thousand, $34 thousand, and $60 thousand, for the years ended 2009, 2008, and 2007, respectively.
NOTE 18 AVAILABLE LINES OF CREDIT AND FEDERAL HOME LOAN BANK ADVANCES:
The Bank has federal funds lines of credit with correspondent banks totaling $27.4 million as of December 31, 2009. In addition, the Bank may borrow up to an additional $86.8 million from the Federal Home Loan Bank under a line of credit which is secured by a blanket lien on residential real estate loans. In 2009, the Bank obtained approval to
53
Table of Contents
NEW PEOPLES BANKSHARES, INC.
NOTES TO CONSOLIDATED FINANCIAL STATEMENTS (CONTINUED)
NOTE 18 AVAILABLE LINES OF CREDIT AND FEDERAL HOME LOAN BANK ADVANCES (C0NTINUED):
borrow funds from the Federal Reserve Bank discount window. The amount available for contingent funding purposes is $68.9 million. This line is secured by a blanket lien on commercial real estate loans receivable.
In January 2010, the Bank temporarily suspended the Federal Reserve Bank discount window line of credit due to more stringent collateral requirements. Funding is still available upon our election to participate and to provide specific investments or commercial loans as collateral.
The Bank had no overnight borrowings subject to daily rate changes from the Federal Home Loan Bank at December 31, 2009. The Bank had no borrowings subject to daily rate changes as of December 31, 2008. All other borrowings are at fixed rates.
The Bank had $25.4 million in term borrowings with the Federal Home Loan Bank at December 31, 2009 and $26.6 million at December 31, 2008. The borrowings consist of convertible notes totaling $15.2 million at December 31, 2009 and 2008, respectively with a weighted average interest rate of 3.76%. The convertible notes have a quarterly Bermudan call feature beginning in 2008 and mature in 2012. Two additional borrowings totaling $10.2 million and $11.4 million were outstanding at December 31, 2009 and 2008 respectively. These borrowings were obtained in 2008 to fund various real estate loans. These borrowings have fixed rates with an average weighted interest rate of 4.07%, with principal reducing to $0 at the maturity in 2018. A letter of credit for $7.0 million was issued in 2008 to the Treasury Board of Virginia for collateral on public funds. No draws on the letter of credit have been issued.
NOTE 19 LEGAL CONTINGENCIES:
Various legal claims arise from time to time in the normal course of business which, in the opinion of management, will have no material effect on the Company’s consolidated financial statements.
NOTE 20 FINANCIAL INSTRUMENTS WITH OFF-BALANCE SHEET RISK:
In the normal course of business, the Bank has outstanding commitments and contingent liabilities, such as commitments to extend credit and standby letters of credit, which are not included in the accompanying consolidated financial statements. The Bank’s exposure to credit loss in the event of nonperformance by the other party to the financial instruments for commitments to extend credit and standby letters of credit is represented by the contractual or notional amount of those instruments. The Bank uses the same credit policies in making such commitments as it does for instruments that are included in the balance sheet.
Financial instruments whose contract amount represents credit risk were as follows:
| (Dollars are in thousands) |
2009 | 2008 | ||||
| Commitments to extend credit |
$ | 48,022 | $ | 51,190 | ||
| Standby letters of credit |
5,159 | 4,022 | ||||
Commitments to extend credit are agreements to lend to a customer at either a fixed or variable interest rate as long as there is no violation of any condition established in the contract. Commitments generally have fixed expiration dates or other termination clauses and may require payment of a fee. Since many of the commitments are expected to expire without being drawn upon, the total commitment amounts do not necessarily represent future cash requirements. The Bank evaluates each customer’s creditworthiness on a case-by-case basis. The amount of collateral obtained, if deemed necessary by the Bank upon extension of credit, is based on management’s credit evaluation. Collateral held varies but may include accounts receivable, inventory, property and equipment, and income-producing commercial properties.
Standby letters of credit are conditional commitments issued by the Bank to guarantee the performance of a customer to a third party. Standby letters of credit generally have fixed expiration dates or other termination clauses and may require payment of a fee. The credit risk involved in issuing letters of credit is essentially the same as that involved in extending loan facilities to customers. The Bank’s policy for obtaining collateral, and the nature of such collateral, is essentially the same as that involved in making commitments to extend credit.
54
Table of Contents
NEW PEOPLES BANKSHARES, INC.
NOTES TO CONSOLIDATED FINANCIAL STATEMENTS (CONTINUED)
NOTE 21 LINE OF CREDIT:
In June 2008, the Company obtained a three year revolving line of credit totaling $6.5 million from Silverton Bank. The interest rate is priced at Wall Street Journal Prime and will change as the Wall Street Journal Prime rate changes, subject to a floor rate of 5.00%. The interest rate at December 31, 2009 was 5.00%. Collateral for the line of credit is the subsidiary, New Peoples Bank, Inc. common stock. Due to the failure of Silverton Bank in May 2009, the remaining $1.6 million no longer remains available for future use. The balance at December 31, 2009 and 2008 was $4.9 million. The purpose of the line of credit was for general operations and capital injections to the subsidiaries. Management is seeking financing to replace the line of credit in 2010. The revolving line of credit contains certain covenants related to debt coverage ratios and nonperforming assets of the Bank. At December 31, 2009, the Company was in violation of the debt covenants regarding both debt coverage and asset quality. Failure to meet the financial covenants represents an event of default under the loan agreement which provides Silverton Bank, or the FDIC as its receiver in bankruptcy with a number of remedies including those generally available to a lender under law or equity.
NOTE 22 TRUST PREFERRED SECURITIES AND DEFERRAL OF INTEREST PAYMENTS:
On September 27, 2006, the Company completed the issuance of $5.2 million in floating rate trust preferred securities offered by its wholly owned subsidiary, NPB Capital Trust 2. The proceeds of the funds were used for general corporate purposes, which Include capital management for affiliates and the acquisition of two branch banks. The securities have a floating rate of 3 month LIBOR plus 177 basis points, which resets quarterly, with a current rate at December 31, 2009 of 2.05%.
On July 7, 2004, the Company completed the issuance of $11.3 million in floating rate trust preferred securities offered by its wholly owned subsidiary, NPB Capital Trust I. The proceeds of the funds were used for general corporate purposes which included capital management for affiliates, retirement of indebtedness and other investments. The securities have a floating rate of 3 month LIBOR plus 260 basis points, which resets quarterly, with a current rate at December 31, 2009 of 2.88%.
Under the terms of the subordinated debt transactions, the securities mature in 30 years and are redeemable, in whole or in part, without penalty, at the option of the Company after five years. Due to the ability to defer interest and principal payments for 60 months without being considered in default, the regulatory agencies consider the trust preferred securities as Tier 1 capital up to certain limits.
In October 2009, a restriction to pay dividends from the Bank to the Company was issued by the Federal Reserve Bank of Richmond. As a result, dividends on trust preferred securities issued by the Company shall be deferred until such restriction is removed.
NOTE 23 REGULATORY MATTERS:
The Company and the Bank are subject to various capital requirements administered by federal banking agencies. Failure to meet minimum capital requirements can initiate certain mandatory and, possibly, additional discretionary actions by regulators that, if undertaken, could have a direct material effect on the Company’s and the Bank’s financial statements. Under capital adequacy guidelines and the regulatory framework for prompt corrective action, the Company and the Bank must meet specific capital guidelines that involve quantitative measures of assets, liabilities, and certain off-balance sheet items as calculated under regulatory accounting practices. The capital amounts and classification are also subject to qualitative judgments by the regulators about components, risk weightings, and other factors. Prompt corrective action provisions are not applicable to bank holding companies.
Quantitative measures established by regulation to ensure capital adequacy require the Company and the Bank to maintain minimum amounts and ratios (set forth in the following table) of total and Tier 1 capital (as defined) to risk-weighted assets (as defined) and of Tier 1 capital (as defined) to average assets (as defined). Management believes that, as of December 31, 2009, the Company and the Bank meet all capital adequacy requirements to which they are subject.
As of December 31, 2009 the Bank was well capitalized under the regulatory framework for prompt corrective action. To be categorized as well capitalized, an institution must maintain minimum total risk-based, Tier 1 risk-based and Tier 1 leverage ratios as set forth in the following tables. There are no conditions or events since the notification that management believes have changed the Bank’s category.
55
Table of Contents
NEW PEOPLES BANKSHARES, INC.
NOTES TO CONSOLIDATED FINANCIAL STATEMENTS (CONTINUED)
NOTE 23 REGULATORY MATTERS (CONTINUED):
The Company’s and the Bank’s actual capital amounts and ratios are presented in the table as of December 31, 2009 and 2008, respectively.
| Actual | Minimum Capital Requirement |
Minimum to Be Well Capitalized Under Prompt Corrective Action Provisions |
|||||||||||||||
| (Dollars are in thousands) |
Amount | Ratio | Amount | Ratio | Amount | Ratio | |||||||||||
| December 31, 2009: |
|||||||||||||||||
| Total Capital to Risk Weighted Assets |
|||||||||||||||||
| The Company |
$ | 63,499 | 9.83 | % | 51,652 | 8 | % | $ | N/A | N/A | |||||||
| The Bank |
68,409 | 10.59 | % | 51,664 | 8 | % | 64,581 | 10 | % | ||||||||
| Tier 1 Capital Risk Weighted Assets: |
|||||||||||||||||
| The Company |
52,396 | 8.12 | % | 25,826 | 4 | % | N/A | N/A | |||||||||
| The Bank |
63,024 | 9.76 | % | 25,832 | 4 | % | 38,748 | 6 | % | ||||||||
| Tier 1 Capital to Average Assets: |
|||||||||||||||||
| The Company |
52,396 | 6.14 | % | 34,107 | 4 | % | N/A | N/A | |||||||||
| The Bank |
63,024 | 7.40 | % | 34,066 | 4 | % | 42,582 | 5 | % | ||||||||
| December 31,2008: |
|||||||||||||||||
| Total Capital to Risk Weighted Assets |
|||||||||||||||||
| The Company |
$ | 69,043 | 10.78 | % | 51,234 | 8 | % | $ | N/A | N/A | |||||||
| The Bank |
72,696 | 11.36 | % | 51,181 | 8 | % | 63,976 | 10 | % | ||||||||
| Tier 1 Capital to Risk Weighted Assets: |
|||||||||||||||||
| The Company |
60,857 | 9.50 | % | 25,617 | 4 | % | N/A | N/A | |||||||||
| The Bank |
65,792 | 10.28 | % | 25,590 | 4 | % | 38,386 | 6 | % | ||||||||
| Tier 1 Capital to Average Assets: |
|||||||||||||||||
| The Company |
60,857 | 7.72 | % | 31,519 | 4 | % | N/A | N/A | |||||||||
| The Bank |
65,792 | 8.35 | % | 31,519 | 4 | % | 39,399 | 5 | % | ||||||||
NOTE 24 FAIR VALUES:
ASC 820, “Fair Value Measurements and Disclosures” provides a framework for measuring fair value under generally accepted accounting principles and requires disclosures about the fair value of assets and liabilities recognized in the balance sheet in periods subsequent to initial recognition, whether the measurements are made on a recurring basis (for example, available for sale investment securities) or on a nonrecurring basis (for example, impaired loans and other real estate acquired through foreclosure).
Fair value is the exchange price that would be received for an asset or paid to transfer a liability (an exit price) in the principal or most advantageous market for the asset or liability in an orderly transaction between market participants on the measurement date. Fair Value Measurements and Disclosures also establishes fair value hierarchy which requires an entity to maximize the use of observable inputs and minimize the use of unobservable inputs when measuring fair value. The standard describes three levels of inputs that may be used to measure fair value:
Level 1: Quoted prices in active markets for identical assets or liabilities. Level 1 assets and liabilities include debt and equity securities and derivative contracts that are traded in an exchange market, as well as U. S. Treasury, other U. S. Government and agency mortgage-backed debt securities that are highly liquid and are actively traded in over-the-counter markets.
Level 2: Observable inputs other than Level 1 prices such as quoted prices for similar assets or liabilities; quoted prices in markets that are not active; or other inputs that are observable or can be corroborated by observable market data for substantially the full term of the assets or liabilities. Level 2 assets and liabilities include debt securities with quoted prices that are traded less frequently than exchange-traded instruments and derivative contracts whose value is determined using a pricing model with inputs that are observable in the market or can be derived principally from or corroborated by observable market data. This category generally includes certain derivative contracts and impaired loans.
56
Table of Contents
NEW PEOPLES BANKSHARES, INC.
NOTES TO CONSOLIDATED FINANCIAL STATEMENTS (CONTINUED)
NOTE 24 FAIR VALUES (CONTINUED):
Level 3: Unobservable inputs that are supported by little or no market activity and that are significant to the fair value of the assets and liabilities. Level 3 assets and liabilities include financial instruments whose value is determined using pricing models, discounted cash flow methodologies, or similar techniques, as well as instruments for which the determination of fair value requires significant management judgment or estimation. For example, this category generally includes certain private equity investments, retained residual interests in securitizations, residential mortgage servicing rights, and highly structured or long-term derivative contracts.
Investment Securities Available for Sale – Investment securities available for sale are recorded at fair value on a recurring basis. Fair value measurement is based upon quoted prices. The Company’s available for sale securities, totaling $2.6 million at December 31, 2009, are the only assets whose fair values are measured on a recurring basis using Level 2 inputs from an independent pricing service.
Loans – The Company does not record loans at fair value on a recurring basis. The Company is predominantly an asset based lender with real estate serving as collateral on a substantial majority of loans. From time to time a loan is considered impaired and an allowance for loan losses is established. Loans which are deemed to be impaired are primarily valued on a non-recurring basis at the fair values of the underlying real estate collateral. Such fair values are obtained using independent appraisals, which the Company considers to be Level 2 inputs. The aggregate carrying amount of impaired loans at December 31, 2009 was $30.1 million.
Foreclosed Assets – Foreclosed assets are adjusted to fair value upon transfer of the loans to foreclosed assets. Foreclosed assets are carried at the lower of the carrying value or fair value. Fair value is based upon independent observable market prices or appraised values of the collateral, which the Company considers to be level 2 inputs. When the appraised value is not available or management determines the fair value of the collateral is further impaired below the appraised value and there is no observable market price, the Company records the foreclosed asset as nonrecurring Level 3.
Assets and liabilities measured at fair value are as follows as of December 31, 2009:
| (Dollars are in thousands) |
Quoted market price in active markets (Level 1) |
Significant other observable inputs (Level 2) |
Significant unobservable inputs (Level 3) | ||||||
| (On a recurring basis) Available for sale investments |
$ | — | $ | 2,606 | $ | — | |||
| (On a non-recurring basis) Other real estate owned |
— | 1,968 | 3,675 | ||||||
| Impaired loans |
— | 30,139 | — | ||||||
| Total |
$ | — | $ | 38,388 | $ | 3,675 | |||
Assets and liabilities measured at fair value are as follows as of December 31, 2008:
| (Dollars are in thousands) |
Quoted market price in active markets (Level 1) |
Significant other observable inputs (Level 2) |
Significant unobservable inputs (Level 3) | ||||||
| (On a recurring basis) |
|||||||||
| Available for sale investments |
$ | — | $ | 3,449 | $ | — | |||
| (On a non-recurring basis) |
|||||||||
| Other real estate owned |
— | 2,496 | — | ||||||
| Impaired loans |
— | 6,844 | — | ||||||
| Total |
$ | — | $ | 12,789 | $ | — | |||
57
Table of Contents
NEW PEOPLES BANKSHARES, INC.
NOTES TO CONSOLIDATED FINANCIAL STATEMENTS (CONTINUED)
NOTE 24 FAIR VALUES (CONTINUED):
Transfers into Level 3 during the quarter ended December 31, 2009 were related to management adjustments to third party appraisals. Management estimated the fair value of other real estate owned to be further impaired and thereby below the appraised value, resulting in no observable market price. For the year ended December 31, 2009, the changes in Level 3 assets measured at fair value on a nonrecurring basis are summarized as follows (dollars in thousands):
| (Dollars are in thousands) |
Year- Ended December 31, 2009 Other Real Estate Owned |
|||
| Balance, January 1, 2009 |
$ | — | ||
| Transfers into Level 3 |
4,252 | |||
| Included in earnings |
(577 | ) | ||
| Sales and other reductions |
— | |||
| Balance, December 31, 2009 |
$ | 3,675 | ||
Fair Value of Financial Instruments
Fair value information about financial instruments, whether or not recognized in the balance sheet, for which it is practical to estimate the value is based upon the characteristics of the instruments and relevant market information. Financial instruments include cash, evidence of ownership in an entity, or contracts that convey or impose on an entity that contractual right or obligation to either receive or deliver cash for another financial instrument.
The following summary presents the methodologies and assumptions used to estimate the fair value of the Company’s financial instruments presented below. The information used to determine fair value is highly subjective and judgmental in nature and, therefore, the results may not be precise. Subjective factors include, among other things, estimates of cash flows, risk characteristics, credit quality, and interest rates, all of which are subject to change. Since the fair value is estimated as of the balance sheet date, the amounts that will actually be realized or paid upon settlement or maturity on these various instruments could be significantly different.
The carrying value of cash and due from banks, federal funds sold, interest-bearing deposits, deposits with no stated maturities, trust preferred securities and accrued interest approximates fair value. The estimated fair value of investment securities was based on closing market prices. The remaining financial instruments were valued based on the present value of estimated future cash flows, discounted at various rates in effect for similar instruments during the months of December 2009 and 2008.
| December 31, 2009 | December 31, 2008 | |||||||||||
| (Dollars are in thousands) |
Estimated Fair Value |
Carrying Value |
Estimated Fair Value |
Carrying Value | ||||||||
| Financial Assets |
||||||||||||
| Cash and due from bank |
$ | 29,978 | $ | 29,978 | $ | 22,099 | $ | 22,099 | ||||
| Federal funds sold |
9,582 | 9,582 | 1,813 | 1,813 | ||||||||
| Investment securities |
2,606 | 2,606 | 3,449 | 3,449 | ||||||||
| Equity securities (restricted) |
3,996 | 3,996 | 3,903 | 3,903 | ||||||||
| Loans |
770,087 | 763,570 | 728,940 | 721,174 | ||||||||
| Accrued Interest receivable |
4,292 | 4,292 | 4,537 | 4,537 | ||||||||
| Life insurance investments |
10,549 | 10,549 | 10,153 | 10,153 | ||||||||
58
Table of Contents
NEW PEOPLES BANKSHARES, INC.
NOTES TO CONSOLIDATED FINANCIAL STATEMENTS (CONTINUED)
NOTE 24 FAIR VALUES (CONTINUED):
| December 31, 2009 | December 31, 2008 | |||||||
| (Dollars are in thousands) |
Estimated Fair Value |
Carrying Value |
Estimated Fair Value |
Carrying Value | ||||
| Financial Liabilities |
||||||||
| Demand Deposits |
||||||||
| Non-interest bearing |
88,318 | 88,318 | 95,448 | 95,448 | ||||
| Interest-bearing |
42,769 | 42,769 | 34,498 | 34,498 | ||||
| Savings deposits |
90,467 | 90,467 | 89,787 | 89,787 | ||||
| Time deposits |
541,793 | 539,160 | 487,638 | 485,955 | ||||
| FHLB advances |
24,612 | 25,383 | 25,851 | 26,582 | ||||
| Accrued interest payable |
1,617 | 1,617 | 2,155 | 2,155 | ||||
| Line of credit borrowing |
4,900 | 4,900 | 4,913 | 4,913 | ||||
| Trust preferred securities |
16,496 | 16,496 | 16,496 | 16,496 | ||||
NOTE 25 RECENT ACCOUNTING DEVELOPMENTS:
In June 2009, the FASB issued a new codification entitled “Generally Accepted Accounting Principles.” Generally Accepted Accounting Principles establishes the Codification as the source of authoritative U.S. accounting and reporting standards recognized by the FASB for use in the preparation of financial statements of nongovernmental entities that are presented in conformity with GAAP. Rules and interpretive releases of the SEC under authority of federal securities law are also sources of authoritative GAAP for SEC registrants. Generally Accepted Accounting Principles is effective for interim and annual reporting periods after September 15, 2009. The Company adopted Generally Accepted Accounting Principles, during the quarter ended September 30, 2009. The adoption had no impact on its financial position, results of operations or cash flows.
The FASB has issued several Accounting Standards Updates, “ASU,” during the year ended December 31, 2009. The ASU is the means which the FASB issues new codification and updates existing codification. The applicable ASU’s that pertain to the Company that have been issued during this time period have been adopted by the Company for the year ending December 31, 2009. These ASU’s are technical in nature and are an additional resource as the FASB transitions to the new Codification. The Company expects these updates will have no impact on its financial position, results of operations or cash flows.
The FASB issued ASU 2010-06, “Fair Value Measurements and Disclosures (Topic 820) – Improving Disclosures about Fair Value Measurements” in January 2010 to require new disclosures related to transfers in and out of Levels 1 and 2, and to require separate information about purchases, sales, issuances, and settlements in the Level 3 reconciliation. The ASU is effective for interim and annual reporting periods beginning after December 15, 2009, except for disclosures about purchases, sales, issuances, and settlements in the roll forward activity in Level 3 fair value measurements. The disclosures for Level 3 measurements are effective for fiscal years beginning after December 15, 2010, and for interim periods within those fiscal years. The Company expects that the ASU will have no impact on its financial position, results of operations or cash flows.
The FASB issued ASU 2009-05, “Fair Value Measurements and Disclosures (Topic 820) – Measuring Liabilities at Fair Value” in August, 2009 to provide guidance when estimating the fair value of a liability. When a quoted price in an active market for the identical liability is not available, fair value should be measured using (a) the quoted price of an identical liability when traded as an asset; (b) quoted prices for similar liabilities or similar liabilities when traded as assets; or (c) another valuation technique consistent with the principles of Topic 820 such as an income approach or a market approach. If a restriction exists that prevents the transfer of the liability, a separate adjustment related to the restriction is not required when estimating fair value. The ASU was effective October 1, 2009 for the Company and will have no impact on financial position or operations.
59
Table of Contents
NEW PEOPLES BANKSHARES, INC.
NOTES TO CONSOLIDATED FINANCIAL STATEMENTS (CONTINUED)
NOTE 25 RECENT ACCOUNTING DEVELOPMENTS (CONTINUED):
The FASB issued SFAS 166 (not yet reflected in FASB ASC), “Accounting for Transfers of Financial Assets – an amendment of FASB Statement No. 140,” (“SFAS 166”) in June 2009. SFAS 166 limits the circumstances in which a financial asset should be derecognized when the transferor has not transferred the entire financial asset by taking into consideration the transferor’s continuing involvement. The standard requires that a transferor recognize and initially measure at fair value all assets obtained (including a transferor’s beneficial interest) and liabilities incurred as a result of a transfer of financial assets accounted for as a sale. The concept of a qualifying special-purpose entity is removed from SFAS 140 along with the exception from applying FIN 46(R). The standard is effective for the first annual reporting period that begins after November 15, 2009, for interim periods within the first annual reporting period, and for interim and annual reporting periods thereafter. Earlier application is prohibited. The Company does not expect the standard to have any impact on the Company’s financial position.
In May 2009, the FASB issued, “Subsequent Events.” Subsequent Events establishes general standards of accounting for and disclosure of events that occur subsequent to the balance sheet date but before financial statements are issued. In addition, Subsequent Events requires the disclosure of the date through which an entity has evaluated subsequent events and the basis for that date. The Company adopted Subsequent Events for the quarter ended June 30, 2009. The adoption did not impact the financial position, results of operations or cash flows. The Company evaluated subsequent events through the date of which the financial statements were issued.
On April 9, 2009, the FASB issued three staff positions related to fair value which are discussed below.
“Investments—Debt and Equity Securities,” categorizes losses on debt securities available-for-sale or held-to-maturity determined by management to be other-than-temporarily impaired into losses due to credit issues and losses related to all other factors. Other-than-temporary impairment (OTTI) exists when it is more likely than not that the security will mature or be sold before its amortized cost basis can be recovered. An OTTI related to credit losses should be recognized through earnings. An OTTI related to other factors should be recognized in other comprehensive income. Investments—Debt and Equity Securities does not amend existing recognition and measurement guidance related to other-than-temporary impairments of equity securities. Annual disclosures required in Investments—Debt and Equity Securities will be required for interim periods (including the aging of securities with unrealized losses).
“Fair Value Measurements and Disclosures” (ASC 820) codifies FSP SFAS 157-4, “Determining Fair Value When the Volume and Level of Activity for the Asset or Liability Have Significantly Decreased and Identifying Transactions That are Not Orderly”, recognizes that quoted prices may not be determinative of fair value when the volume and level of trading activity has significantly decreased. The evaluation of certain factors may necessitate that fair value be determined using a different valuation technique. Fair value should be the price that would be received to sell an asset or paid to transfer a liability in an orderly transaction, not a forced liquidation or distressed sale. If a transaction is considered to not be orderly, little, if any, weight should be placed on the transaction price. If there is not sufficient information to conclude as to whether or not the transaction is orderly, the transaction price should be considered when estimating fair value. An entity’s intention to hold an asset or liability is not relevant in determining fair value. Quoted prices provided by pricing services may still be used when estimating fair value in accordance with Fair Value Measurements and Disclosures; however, the entity should evaluate whether the quoted prices are based on current information and orderly transactions. Inputs and valuation techniques are required to be disclosed in addition to any changes in valuation techniques. “Financial Instruments” codifies FSP SFAS 107-1 and APB 28-1, “Interim Disclosures about Fair Value of Financial Instruments”, and requires disclosures about the fair value of financial instruments for interim reporting periods of publicly traded companies as well as in annual financial statements and also requires those disclosures in summarized financial information at interim reporting periods. The three staff positions were effective for periods ending after June 15, 2009. The Company adopted the staff positions for the quarter ended June 30, 2009 and the staff positions did not have a material impact on the consolidated financial statements although additional disclosures were required.
The Securities and Exchange Commission (“SEC”) issued Staff Accounting Bulletin (“SAB”) No. 111 on April 9, 2009 to amend Topic 5.M., “Other Than Temporary Impairment of Certain Investments in Debt and Equity Securities.” SAB 111 maintains the staff’s previous views related to equity securities; however debt securities are excluded from its scope. The SAB provides that “other-than-temporary” impairment is not necessarily the same as “permanent” impairment and unless evidence exists to support a value equal to or greater than the carrying value of the equity security investment, a write-down to fair value should be recorded and accounted for as a realized loss. The SAB was effective upon issuance and had no impact on the Company’s financial position.
60
Table of Contents
NEW PEOPLES BANKSHARES, INC.
NOTES TO CONSOLIDATED FINANCIAL STATEMENTS (CONTINUED)
NOTE 25 RECENT ACCOUNTING DEVELOPMENTS (CONTINUED):
Other accounting standards that have been issued or proposed by the FASB or other standards-setting bodies are not expected to have a material impact on the Company’s financial position, results of operations or cash flows.
NOTE 26 PARENT CORPORATION ONLY FINANCIAL STATEMENTS:
CONDENSED BALANCE SHEETS
AS OF DECEMBER 31, 2009 AND 2008
(Dollars in Thousands)
| 2009 | 2008 | |||||
| ASSETS |
||||||
| Due from banks |
$ | 104 | $ | 615 | ||
| Investment in subsidiaries |
68,025 | 71,415 | ||||
| Other assets |
837 | 89 | ||||
| Total Assets |
$ | 68,966 | $ | 72,119 | ||
| LIABILITIES |
||||||
| Accrued interest payable |
$ | 105 | $ | 341 | ||
| Accrued expenses and other liabilities |
846 | 46 | ||||
| Other borrowed money |
4,900 | 4,913 | ||||
| Trust preferred securities |
16,496 | 16,496 | ||||
| Total Liabilities |
22,347 | 21,796 | ||||
| STOCKHOLDERS’ EQUITY |
||||||
| Common stock-$2.00 par value, 50,000,000 shares authorized; 10,009,037 and 10,008,902 shares issued and outstanding for 2009 and 2008, respectively |
20,018 | 20,017 | ||||
| Additional paid capital |
21,683 | 21,683 | ||||
| Retained earnings |
4,890 | 8,576 | ||||
| Accumulated other comprehensive income |
28 | 47 | ||||
| Total Stockholders’ Equity |
46,619 | 50,323 | ||||
| Total Liabilities and Stockholders’ Equity |
$ | 68,966 | $ | 72,119 | ||
CONDENSED STATEMENTS OF INCOME
FOR THE YEARS ENDED DECEMBER 31, 2009, 2008, AND 2007
| (Dollars in Thousands) |
2009 | 2008 | 2007 | |||||||
| Income |
||||||||||
| Miscellaneous income |
$ | 177 | $ | 30 | $ | 38 | ||||
| Undistributed income (loss) of subsidiaries |
(2,424 | ) | 5,669 | 3,853 | ||||||
| Total Income (loss) |
(2,247 | ) | 5,699 | 3,891 | ||||||
| Expenses |
||||||||||
| Other borrowed money interest expense |
251 | 134 | — | |||||||
| Trust preferred securities interest expense |
532 | 1,005 | 1,283 | |||||||
| Legal fees |
319 | 211 | 47 | |||||||
| Accounting fees |
192 | 32 | 104 | |||||||
| Other operating expenses |
292 | 102 | 101 | |||||||
| Total Expenses |
1,586 | 1,484 | 1,535 | |||||||
| Income before Income Taxes |
(3,833 | ) | 4,215 | 2,356 | ||||||
| Income Tax Benefit |
147 | 522 | 514 | |||||||
| Net Income (Loss) |
$ | (3,686 | ) | $ | 4,737 | $ | 2,870 | |||
61
Table of Contents
NEW PEOPLES BANKSHARES, INC.
NOTES TO CONSOLIDATED FINANCIAL STATEMENTS (CONTINUED)
NOTE 26 PARENT CORPORATION ONLY FINANCIAL STATEMENTS (CONTINUED):
CONDENSED STATEMENTS OF CASH FLOWS
FOR THE YEARS ENDED DECEMBER 31, 2009, 2008, AND 2007
| (Dollars and Shares in Thousands) |
2009 | 2008 | 2007 | |||||||||
| Cash Flows From Operating Activities |
||||||||||||
| Net Income (Loss) |
$ | (3,686 | ) | $ | 4,737 | $ | 2,870 | |||||
| Adjustments to reconcile net income to net cash provided by (used) in operating activities: |
||||||||||||
| Income of subsidiaries |
2,424 | (5,669 | ) | (3,853 | ) | |||||||
| Net change in: |
||||||||||||
| Other assets |
(665 | ) | 969 | (453 | ) | |||||||
| Other liabilities |
560 | (789 | ) | 774 | ||||||||
| Net Cash Used in Operating Activities |
(1,367 | ) | (752 | ) | (662 | ) | ||||||
| Cash Flows From Investing Activities |
||||||||||||
| Investment in subsidiary |
368 | (3,950 | ) | (4,300 | ) | |||||||
| Net Cash Used (Provided) Investing Activities |
368 | (3,950 | ) | (4,300 | ) | |||||||
| Cash Flows From Financing Activities |
||||||||||||
| Proceeds from (repayments on) line of credit |
(12 | ) | 4,913 | — | ||||||||
| Dividends received from subsidiary |
500 | — | — | |||||||||
| Exercise of stock options |
— | 297 | 28 | |||||||||
| Net Cash Provided by Financing Activities |
488 | 5,210 | 28 | |||||||||
| Net Increase in Cash and Cash Equivalents |
(511 | ) | 508 | (4,934 | ) | |||||||
| Cash and Cash Equivalents, Beginning of year |
615 | 107 | 5,041 | |||||||||
| Cash and Cash Equivalents, End of Year |
$ | 104 | $ | 615 | $ | 107 | ||||||
NOTE 27 SELECTED QUARTERLY INFORMATION (UNAUDITED)
| 2009 Quarters | |||||||||||||
| (Dollars in thousands except per share data) |
Fourth | Third | Second | First | |||||||||
| Income statement |
|||||||||||||
| Net interest income |
$ | 8,518 | $ | 7,976 | $ | 7,940 | $ | 7,383 | |||||
| Noninterest income |
1,535 | 1,354 | 1,382 | 1,177 | |||||||||
| Provision for credit losses |
73 | 11,800 | 550 | 418 | |||||||||
| Noninterest expense |
7,861 | 7,130 | 8,006 | 6,849 | |||||||||
| Net income (loss) |
1,150 | (6,290 | ) | 551 | 906 | ||||||||
| Earnings (loss) per share, basic |
0.11 | (0.63 | ) | 0.05 | 0.09 | ||||||||
| Earnings (loss) per share, fully diluted |
0.11 | (0.63 | ) | 0.05 | 0.09 | ||||||||
| Period end balance sheet |
|||||||||||||
| Total loans and leases |
763,570 | $ | 764,130 | $ | 747,746 | $ | 735,259 | ||||||
| Total assets |
857,910 | 846,717 | 840,223 | 821,051 | |||||||||
| Total deposits |
760,714 | 749,502 | 736,395 | 718,601 | |||||||||
| Total shareholders’ equity |
46,619 | 45,484 | 51,767 | 51,217 | |||||||||
62
Table of Contents
NEW PEOPLES BANKSHARES, INC.
NOTES TO CONSOLIDATED FINANCIAL STATEMENTS (CONTINUED)
NOTE 27 SELECTED QUARTERLY INFORMATION (UNAUDITED) (CONTINUED)
| 2008 Quarters | ||||||||||||
| (Dollars in thousands except per share data) |
Fourth | Third | Second | First | ||||||||
| Income statement |
||||||||||||
| Net interest income |
$ | 7,410 | $ | 7,951 | $ | 7,139 | $ | 6,721 | ||||
| Noninterest income |
2,046 | 1,387 | 1,429 | 1,384 | ||||||||
| Provision for credit losses |
600 | 350 | 300 | 250 | ||||||||
| Noninterest expense |
7,051 | 6,886 | 6,590 | 6,790 | ||||||||
| Net income |
1,414 | 1,395 | 1,162 | 766 | ||||||||
| Earnings per share, basic |
0.14 | 0.14 | 0.12 | 0.08 | ||||||||
| Earnings per share, fully diluted |
0.14 | 0.14 | 0.11 | 0.07 | ||||||||
| Period end balance sheet |
||||||||||||
| Total loans and leases |
$ | 721,174 | $ | 708,556 | $ | 702,425 | $ | 680,350 | ||||
| Total assets |
807,898 | 792,314 | 793,050 | 766,589 | ||||||||
| Total deposits |
705,688 | 685,534 | 659,752 | 677,430 | ||||||||
| Total shareholders’ equity |
50,323 | 48,871 | 47,385 | 46,061 | ||||||||
63
Table of Contents
| Item 9. | Changes in and Disagreements with Accountants on Accounting and Financial Disclosure |
None.
| Item 9A. | Controls and Procedures |
Management’s Report on Internal Control over Financial Reporting
Management is responsible for establishing and maintaining adequate internal control over financial reporting of New Peoples Bankshares, Inc. New Peoples’ internal control system was designed to provide reasonable assurance to management and the Board of Directors regarding the reliability of financial reporting and the preparation of financial statements for external purposes in accordance with generally accepted accounting practices.
All internal control systems, no matter how well designed, have inherent limitations. Because of these inherent limitations, internal control over financial reporting can provide only reasonable assurance with respect to financial statement preparation and presentation, and may not prevent or detect misstatements. Projections of any evaluation of effectiveness to future periods are subject to the risk that controls may become inadequate because of changes in conditions, or that the degree of compliance with the policies or procedures may deteriorate.
Management assessed the effectiveness of New Peoples’ internal control over financial reporting as of December 31, 2009. In making this assessment, management used the criteria set forth by the Committee of Sponsoring Organizations of the Treadway Commission (COSO) in “Internal Control – Integrated Framework.”
A material weakness is a control deficiency, or combination of control deficiencies, that results in more than a remote likelihood that a material misstatement of the annual or interim financial statements will not be prevented or detected. Based on management’s assessment, management has identified the following material weaknesses in New Peoples’ internal control over financial reporting as of December 31, 2008:
(i) New Peoples’ did not effectively update loan classification codes for certain real estate and construction loans to reflect new guidance from the Federal Deposit Insurance Corporation (the “FDIC”); and
(ii) New Peoples’ did not maintain an effective control environment, including the design and operating effectiveness of New Peoples’ Code of Ethics.
Each of the aforementioned material weaknesses in internal control over financial reporting individually resulted in more than a remote likelihood that a material misstatement of New Peoples’ interim or annual financial statements would not have been prevented or detected.
Remediation of Material Weaknesses
In response to the identified material weaknesses, management and the Board of Directors have undertaken a number of remedial actions. Specific remedial actions taken by management regarding the improper loan classifications include:
| • | hiring a loan operations specialist; |
| • | developing new listing codes based on the FDIC’s revised classification guidance and new coding procedures; |
| • | training all loan operations personnel on the new coding system and procedures; |
| • | reorganizing all loan files; |
| • | reviewing and correcting loan classifications, as necessary, of all loans for greater than $500,000; and |
| • | expanding internal audit procedures to assess compliance of the new coding procedures. |
Specific remedial actions taken or to be taken by New Peoples’ new President and Chief Executive Officer and other management personnel and the Board of Directors regarding New Peoples’ ineffective control environment include:
| • | adopting a revised employee handbook, with specific policies on business ethics, whistleblower procedures, fraud, conflicts of interest, bribery, trading in New Peoples’ common stock and other topics; |
| • | all employees’ receipt and acknowledgement of the revised handbook and the policies contained therein; |
| • | expanding internal audit procedures to increase compliance testing; and |
64
Table of Contents
| • | expanding and strengthening of internal audit and financial reporting departments by hiring an additional internal audit staff member, with compliance experience, and an additional financial reporting staff member. |
The effectiveness of internal control over financial reporting as of December 31, 2009, has been audited by Brown, Edwards & Company, L.L.P., the independent registered public accounting firm which also audited the Company’s consolidated financial statements. Brown, Edwards & Company’s attestation report of internal control over financial reporting is included elsewhere in this annual report.
At December 31, 2009, we have determined that we have fully remediated both material weaknesses.
Changes in Internal Control Over Financial Reporting
There have been no changes in our internal control over financial reporting during the last fiscal quarter that materially affected, or are reasonably likely to materially affect, internal control over financial reporting.
Disclosure Controls and Procedures
We maintain a system of disclosure controls and procedures that is designed to ensure that material information is accumulated and communicated to management, including our Chief Executive Officer and Chief Financial Officer, as appropriate to allow timely decisions regarding required disclosure. As of the end of the period covered by this report, we carried out an evaluation, under the supervision and with the participation of our management, including the Chief Executive Officer and Chief Financial Officer, of the effectiveness of the design and operation of the disclosure controls and procedures pursuant to Rule 13a-15 under the Securities Exchange Act of 1934, as amended. Based on that evaluation, our Chief Executive Officer and Chief Financial Officer concluded that our disclosure controls and procedures were operating effectively as of December 31, 2009
| Item 9B. | Other Information |
None
PART III
Except as otherwise indicated, information called for by the following items under Part III is contained in the Proxy Statement for New Peoples’ 2010 Annual Meeting of Shareholders (2010 Proxy Statement) to be held on May 20, 2010.
| Item 10. | Directors, Executive Officers and Corporate Governance |
The information contained under the captions “Election of Directors,” “Executive Officers Who Are Not Directors,” “Corporate Governance and the Board of Directors” and “Section 16(a) Beneficial Ownership Reporting Compliance” in the 2010 Proxy Statement that is required to be disclosed in this Item 10 is incorporated herein by reference.
| Item 11. | Executive Compensation |
The information contained under the captions “Director Compensation” and “Executive Compensation and Related Party Transactions” in the 2010 Proxy Statement that is required to be disclosed in this Item 11 is incorporated herein by reference.
| Item 12. | Security Ownership of Certain Beneficial Owners and Management and Related Stockholder Matters |
The information contained under the captions “Security Ownership of Management,” “Security Ownership of Certain Beneficial Owners” and “Equity Compensation Plan Information” in the 2010 Proxy Statement that is required to be disclosed in this Item 12 is incorporated herein by reference.
| Item 13. | Certain Relationships, Related Transactions and Director Independence |
The information contained under the caption “Transactions with Management” and “Corporate Governance and the Board of Directors” in the 2010 Proxy Statement that is required to be disclosed in this Item 13 is incorporated herein by reference.
| Item 14. | Principal Accountant Fees and Services |
The information contained under the caption “Audit Information” in the 2010 Proxy Statement that is required to be disclosed in this Item 14 is incorporated herein by reference.
65
Table of Contents
| Item 15. | Exhibits and Financial Statement Schedules |
| (a)(1) | The response to this portion of Item 15 is included in Item 8 above. |
| (a)(2) | The response to this portion of Item 15 is included in Item 8 above. |
| (a)(3) | The following exhibits are filed as part of this Form 10-K: |
Exhibits
The following exhibits are filed as part of this Form 10-K, and this list includes the exhibit index:
| 2 |
Agreement and Plan of Share Exchange dated August 15, 2001 (incorporated by reference to Exhibit 2 to Form 8-K filed December 17, 2001) | |
| 3.1 |
Articles of Incorporation of Registrant (incorporated by reference to Exhibit 3.1 to Quarterly Report on Form 10-Q for the quarterly period ended June 30, 2004) | |
| 3.2 |
Bylaws of Registrant (incorporated by reference to Exhibit 3.1 to Form 8-K filed April 15, 2004) | |
| 10.1* |
New Peoples Bank, Inc. 2001 Stock Option Plan (incorporated by reference to Exhibit 10.1 to Annual Report on Form 10-KSB for the fiscal year ended December 31, 2001) | |
| 10.2* |
Form of Non-Employee Director Non-Qualified Stock Option Agreement (incorporated by reference to Exhibit 10.2 to Form 8-K filed November 30, 2004) | |
| 10.3* |
Form of Incentive Stock Option Agreement (incorporated by reference to Exhibit 10.3 to Form 8-K filed November 30, 2004) | |
| 10.4* |
Salary Continuation Agreement dated December 18, 2002 between New Peoples Bank, Inc. and Kenneth D. Hart (incorporated by reference to Exhibit 10.2 to Annual Report on Form 10-K for the fiscal year ended December 31, 2002) | |
| 10.5* |
First Amendment dated June 30, 2003 to Salary Continuation Agreement between New Peoples Bank, Inc. and Kenneth D. Hart (incorporated by reference to Exhibit 10.5 to Annual Report on Form 10-K for the fiscal year ended December 31, 2004) | |
| 10.6* |
Salary Continuation Agreement dated December 18, 2002 between New Peoples Bank, Inc. and Frank Sexton, Jr. (incorporated by reference to Exhibit 10.6 to Annual Report on Form 10-K for the fiscal year ended December 31, 2004) | |
| 10.7* |
First Amendment dated June 30, 2003 to Salary Continuation Agreement between New Peoples Bank, Inc. and Frank Sexton, Jr. (incorporated by reference to Exhibit 10.7 to Annual Report on Form 10-K for the fiscal year ended December 31, 2004) | |
| 10.8* |
Letter Agreement, dated as of June 29, 2009, between the Company and Kenneth D. Hart (incorporated by reference to Exhibit 10.1 to Quarterly Report on From 10-Q for the quarter ended June 30, 2009) | |
| 14 |
Code of Ethics (incorporated by reference to Exhibit 14 to Annual Report on Form 10-K for the fiscal year ended December 31, 2003) | |
| 21 |
Subsidiaries of the Registrant | |
| 23.1 |
Consent of Brown, Edwards and Company, L.L.P. | |
| 24 |
Powers of Attorney (contained on signature page) | |
| 31.1 |
Certification by Chief Executive Officer pursuant to Rule 13a-14(a) | |
| 31.2 |
Certification by Chief Financial Officer pursuant to Rule 13a-14(a) | |
| 32 |
Certification by Chief Executive Officer and Chief Financial Officer pursuant to 18 U.S.C. Section 1350 | |
| * | Denotes management contract. |
| (b) | See Item 15(a)(3) above. |
| (c) | See Items 15(a)(1) and (2) above. |
66
Table of Contents
Pursuant to the requirements of Section 13 or 15(d) of the Securities Exchange Act of 1934, the registrant has duly caused this report to be signed on its behalf by the undersigned, thereunto duly authorized.
| NEW PEOPLES BANKSHARES, INC. | ||
| By: | /s/ JONATHAN H. MULLINS | |
| Jonathan H. Mullins | ||
| President and Chief Executive Officer | ||
| Date: | March 15, 2010 | |
| By: | /s/ C. TODD ASBURY | |
| C. Todd Asbury | ||
| Executive Vice President and Chief Financial Officer | ||
| Date: | March 15, 2010 | |
POWER OF ATTORNEY
Each of the undersigned hereby appoints Jonathan H. Mullins and C. Todd Asbury, and each of them, as attorneys and agents for the undersigned, with full power of substitution, in his name and on his behalf as a director of New Peoples Bankshares, Inc. (the “Registrant”), to act and to execute any and all instruments as such attorneys or attorney deem necessary or advisable to enable the Registrant to comply with the Securities Exchange Act of 1934, and any rules, regulations, policies or requirements of the Securities and Exchange Commission (the “Commission”) in respect thereof, in connection with the preparation and filing with the Commission of the Registrant’s Annual Report on Form 10-K for the fiscal year ended December 31, 2009 (the “Report”), and any and all amendments to such Report, together with such other supplements, statements, instruments and documents as such attorneys or attorney deem necessary or appropriate.
Pursuant to the requirements of the Securities Exchange Act of 1934, this report has been signed below by the following persons on behalf of the registrant in the capacities and on the dates indicated.
| Signature |
Capacity |
Date | ||
| /s/ JONATHAN H. MULLINS Jonathan H. Mullins |
President and Chief Executive Officer (Principal Executive Officer) |
March 15, 2010 | ||
| /s/ C. TODD ASBURY C. Todd Asbury |
Executive Vice President and Chief Financial Officer (Principal Financial and Accounting Officer) |
March 15, 2010 | ||
| /s/ TIM BALL Tim Ball |
Director | March 15, 2010 | ||
| /s/ JOE CARTER Joe Carter |
Director | March 15, 2010 | ||
| /s/ JOHN D. COX John D. Cox |
Director | March 15, 2010 | ||
| /s/ CHARLES H. GENT Charles H. Gent |
Director | March 15, 2010 | ||
| /s/ HAROLD LYNNE KEENE Harold Lynne Keene |
Director | March 15, 2010 | ||
| /s/ FRANK KILGORE Frank Kilgore |
Director | March 15, 2010 | ||
67
Table of Contents
| /s/ MICHAEL G. MCGLOTHLIN Michael G. McGlothlin |
Director | March 15, 2010 | ||
| /s/ FRED MEADE Fred Meade |
Director | March 15, 2010 | ||
| /s/ BILL ED SAMPLE Bill Ed Sample |
Director, Secretary | March 15, 2010 | ||
| /s/ B. SCOTT WHITE B. Scott White |
Chairman, Director | March 15, 2010 | ||
68