Attached files
| file | filename |
|---|---|
| 8-K - Good Times Restaurants Inc. | s611508k.htm |
Exhibit 99.1
Good Times Restaurants Inc.(Nasdaq Capital Market: GTIM)Investor PresentationJune 2015
Disclaimer The information in this presentation does not contain all of the information that a potential investor should review before investing in our common stock. Potential investors should carefully review in its entirety the Prospectus in the Registration Statement on Form S-3 and the prospectus supplement filed with the SEC on May 7, 2015 provided to you in connection with this presentation. The descriptions of the Company and offering of our common stock in this presentation are qualified in their entirety by reference to the prospectus and the prospectus supplement.Certain information in this presentation has been obtained from outside sources. While such information is believed to be reliable for the purposes used herein, no representations are made as to the accuracy or completeness thereof and we take no responsibility for such information. The information in this presentation is current only as of its date and may have changed. We undertake no obligation to update this information in light of new information, future events or otherwise.Forward-Looking InformationThis presentation contains forward-looking statements. All statements other than statements of historical facts contained in this presentation may be forward-looking statements. The words “may,” “will,” “should,” “expects,” “plans,” “anticipates,” “could,” “intend,” “targets,” “projects,” “contemplates,” “believes,” “estimates”, “predicts,” “potential” or “continue” and other expressions that are predictions of or indicate future events and trends and that do not relate to historical matters identify forward-looking statements. Forward-looking statements involve known and unknown risks, uncertainties and other important factors that may cause our actual results, performance or achievements to be materially different from any future results, performance or achievements expressed or implied by the forward-looking statements. Important factors that could cause actual results to differ materially from expectation are disclosed under the “Risk Factors” and ”Cautionary Note Regarding Forward-Looking Statements” sections of the prospectus and the prospectus supplement.All written and oral forward-looking statements attributable to us, or persons acting on our behalf, are expressly qualified in their entirety by the cautionary statements. You should evaluate all forward-looking statements made in this presentation in the context of these risks and uncertainties. Because forward-looking statements are inherently subject to risks and uncertainties, some of which cannot be predicted or qualified, you should not rely on these forward-looking statements as predictions of future events. The events and circumstances reflected in our forward-looking statements may not be achieved or occur and actual results could differ materially from those projected in the forward-looking statements.Non-GAAP Financial InformationThe non-GAAP financial measures contained in this presentation (including, without limitation, EBITDA, Adjusted EBITDA, Restaurant Operating Profit and Cash on Cash Return on Investment) are not GAAP measures of financial performance or liquidity and should not be considered as alternatives to net income (loss) as a measure of financial performance or cash flows from operations as measures of liquidity, or any other performance measure derived in accordance with GAAP. Adjusted EBITDA should not be construed as an inference that our future results will be unaffected by unusual or non-recurring items. Additionally, EBITDA and Adjusted EBITDA are not intended to be measures of free cash flow for management’s discretionary use, as they do not reflect tax payments, debt service requirements, capital expenditures, new restaurant openings and certain other cash costs that may recur in the future, including among other things, cash requirements for working capital needs and cash costs to replace assets being depreciated and amortized. Management compensates for these limitations by relying on our GAAP results in addition to using EBITDA and Adjusted EBITDA supplementally. EBITDA, Adjusted EBITDA, Restaurant Operating Profit and Cash on Cash Return on Investment are included in this presentation because they are key metrics used by management and our board of directors to assess our financial performances. EBITDA and Adjusted EBITDA are frequently used by analysts, investors and other interested parties to evaluate companies in our industry. Our measures of EBITDA, Adjusted EBITDA, Restaurant Operating Profit and Cash on Cash Return on Investment are not necessarily comparable to similarly titled captions of other companies due to different methods of calculation. Good Times Restaurants Inc. 2

Company Highlights Recent acquisition of high growth platform companyTwo differentiated and complementary concepts Successful refresh and updating of Good Times yielding improved financial resultsStrong momentum Excellent cash-on-cash return modelsSubstantial growth potentialExperienced senior leadership team and systems in place Good Times Restaurants Inc. 3

Two Complementary & Differentiated Concepts 4 Good Times Restaurants Inc. Only QSR with steroid-free, hormone-free, vegetarian fed, humanely raised beef, chicken and bacon“Fresh, Handcrafted, All Natural” positionOperates and franchises 38 restaurants located primarily in the front-range communities of Colorado Full service, upscale, chef-inspired restaurant conceptFounded by an award-winning entrepreneur founder of numerous successful conceptsOperates, licenses and franchises 13 restaurants in North Carolina (8), South Carolina (1), Tennessee (1) and Colorado (3)
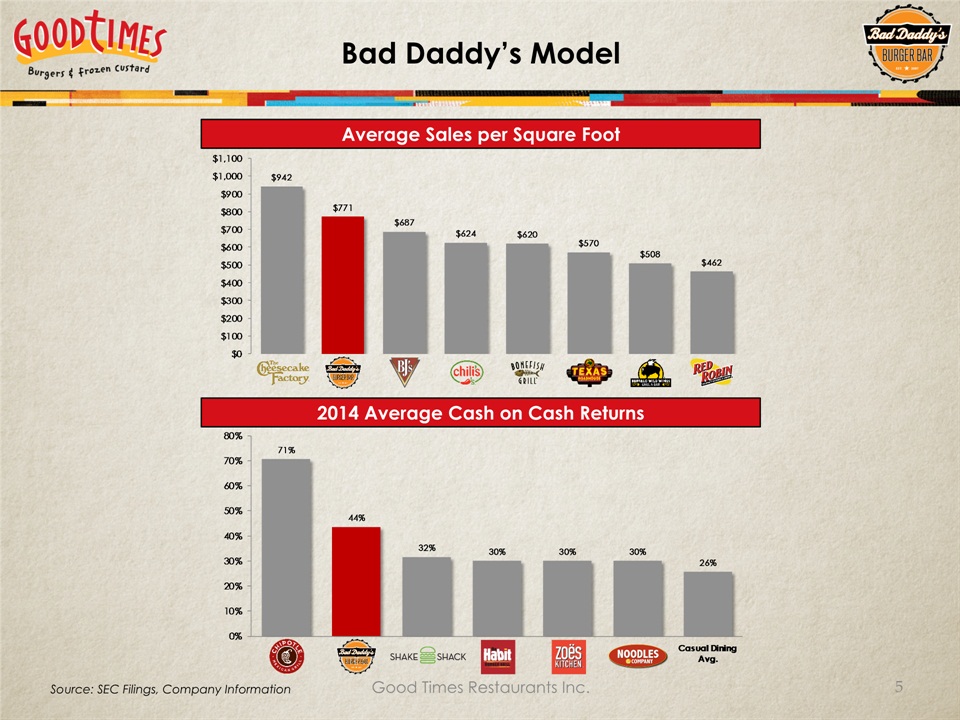
Bad Daddy’s Model 5 Source: SEC Filings, Company Information Good Times Restaurants Inc. Average Sales per Square Foot 2014 Average Cash on Cash Returns
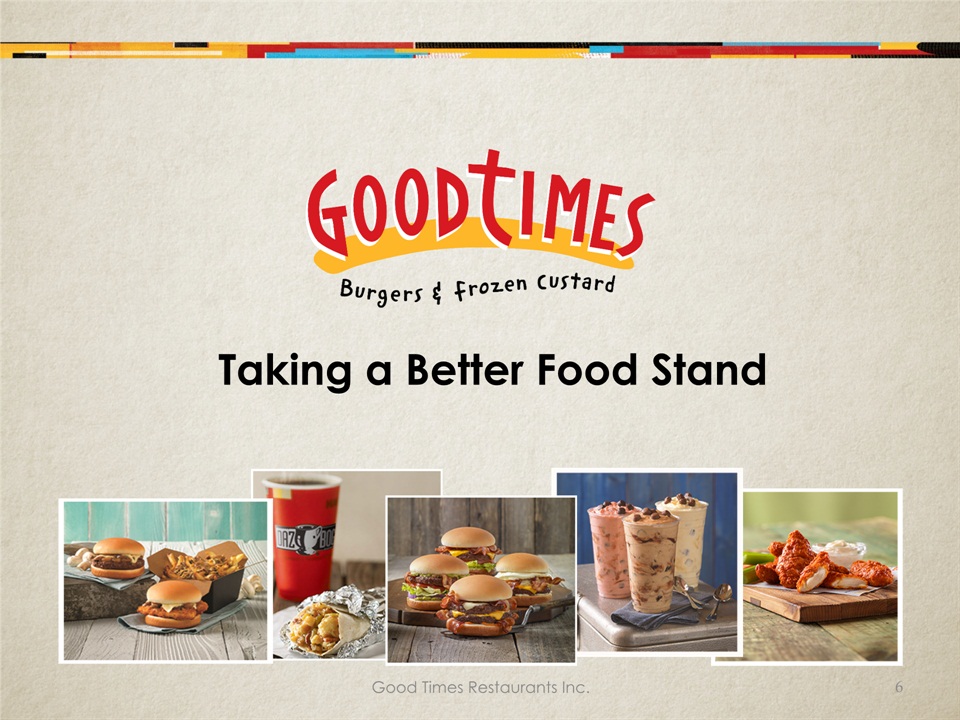
Good Times Restaurants Inc. 6 Taking a Better Food Stand
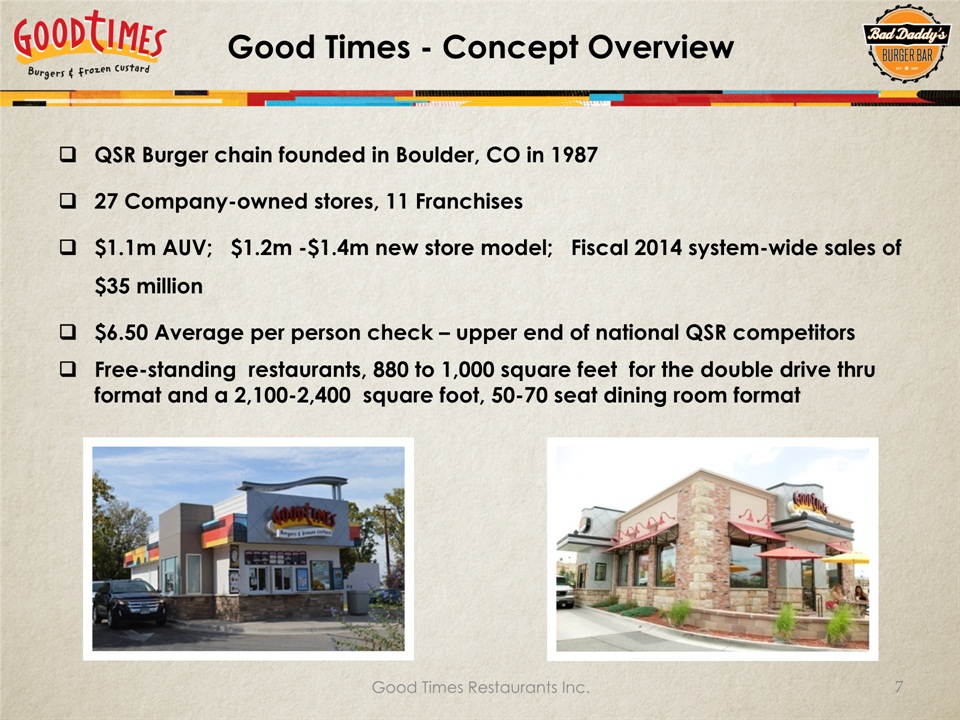
Good Times - Concept Overview QSR Burger chain founded in Boulder, CO in 198727 Company-owned stores, 11 Franchises$1.1m AUV; $1.2m -$1.4m new store model; Fiscal 2014 system-wide sales of $35 million$6.50 Average per person check – upper end of national QSR competitorsFree-standing restaurants, 880 to 1,000 square feet for the double drive thru format and a 2,100-2,400 square foot, 50-70 seat dining room format Good Times Restaurants Inc. 7

A Highly Differentiated Concept in QSR Multi-dimensional brand refresh initiated 5 years agoThe only “Fresh, All Natural, Handcrafted” brand story at a QSR price pointMade to order quality with QSR speed of serviceRemodeling and reimaging program to upgrade facilitiesNew store model with upscale, fast casual level finishesCable TV and social media advertising campaign in illustrated, handcrafted styleWe Take a Better Food Stand: Fresh, All Natural, Hand CraftedAll Natural: No hormones, steroids or antibiotics; humanely raisedMeyer natural Angus beefHand breaded Springer Mountain all natural Chicken TendersAll natural, nitrate free bacon (Spring 2015 Intro)Fresh, Hand Crafted: Only at Good TimesFrozen custard made fresh every few hours with all natural cream & eggsFresh cut fries cooked to orderHatch Valley New Mexico green chile breakfast burritos Good Times Restaurants Inc. 8

Brand Refresh Producing Sales Momentum Good Times Restaurants Inc. 9 Adjusted due to construction disruption at two restaurants. 5 Years of Same Store Sales Growth at Good Times Annual SSSG FY 2014 14.6% FY 2013 11.9% FY 2012 3.1% FY 2011 6.2%

Increasing Sales Has Increased Profits Good Times Restaurants Inc. 10 Average Unit Sales Volumes Average Restaurant Level Operating Profit Note: Average unit sales volumes are of all restaurants included in the comparable sales base that have been open at least fifteen months.Restaurant Level Operating Profit is defined as Net Sales less all restaurant level operating, occupancy and advertising expenses but does not include depreciation, preopening expenses or allocation of any non-restaurant level expenses. Our independent accountants have not examined the projections and do not express any assurance with respect thereto. Good Times Restaurant Level Sales and Operating Profit

Good Times – Projected New Unit Economics Assumptions:2,100 sq ft dining room, 50 seat designSale/Leaseback with rent @ 7.5% cap rate on total soft costs, land, site and buildingFF&E Investment = $325,000; Preopening Costs = $60,000 expensed in Year 1 Year 2 Estimate Sales $1,300,000 Restaurant Operating Profit of 16% $ 208,000 FF&E Operating Asset Investment $ 325,000 Store Level Cash on Cash ROI (Sale Leaseback) 64% Total Cash Investment if on Leased Land $1,250,000 Restaurant Operating Profit of 20% (after land rent) $ 260,000 Store Level Cash on Cash ROI (Land Lease) 20.8% 11 Assumptions: All statements of Good Times’ financial information are based on management’s estimates based on its current restaurants with dining rooms on what management considers to be prime real estate locations, on management’s estimates of operating expense margins as of 12/31/14 and estimates of rental rates currently available in the sale leaseback market. Restaurant Operating Profit is defined as Net Sales less all restaurant level operating, occupancy and advertising expenses but does not include depreciation, preopening expenses or allocation of any non-restaurant level expenses. Store Level Cash on Cash ROI is the Restaurant Operating Profit divided by the total cash investment. Our independent accountants have not examined the projections and do not express any assurance with respect thereto. Good Times Restaurants Inc.

Good Times Restaurants Inc. 12 “You brought Cool to the suburbs”

13 Good Times Restaurants Inc.

Bad Daddy’s Burger Bar Full Service, Full Bar Gourmet Burger Concept founded in Charlotte, NC in 2008Thirteen (13) restaurants currently open in NC (8), SC (1), TN (1) and CO (3) in 6 Separate Metropolitan MarketsTTM sales for the 4 NC Bad Daddy’s open > than 15 months = $2.7m 14 Good Times Restaurants Inc. All statements of Bad Daddy’s financial information are based on management’s review of unaudited financial statements, operating data & point of sale reports from existing Bad Daddy’s restaurants In-line and end-cap restaurants; 3,500-4,000 sf.$16 Per Person Average Check60% Dinner / 40% LunchUSA Today Top 25 Burgers in US, Zagat rated

Bad Daddy’s Burger Bar – Concept Overview Upscale restaurant concept featuring a chef driven menu of gourmet signature burgers, chopped salads, appetizers and sandwiches Simple, high quality ingredients executed at a high levelHousemade sauces and dressings“Create Your Own” burgers and saladsBiweekly Chef SpecialsBeef, chicken, turkey, buffalo, tunaBar sales from 15% to 20% mix17 local microbrews on tapFresh squeezed cocktails, Bad Ass MargaritaAmbience is a high energy, pop culture oriented atmosphere Service is personal, informal and ultra-friendly to support the brand’s irreverent personality 15 Good Times Restaurants Inc.

Bad Daddy’s Strong Momentum Sales at the two most recent Colorado openings well ahead of the system average Sales at the first Colorado restaurant +30% in latest comparable quarterNorth Carolina restaurants with positive same store sales growth4 additional restaurants in Colorado planned in 20151 new Charlotte restaurant opened January 2015 + new lease signedKnoxville, TN restaurant opened March 2015 16 Good Times Restaurants Inc.
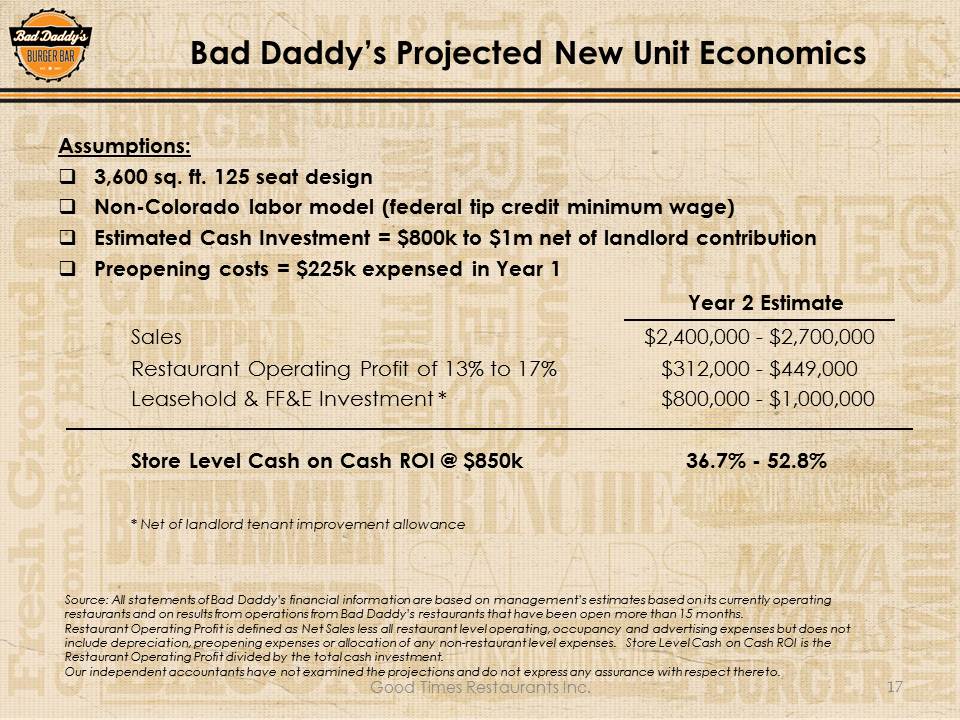
Bad Daddy’s Projected New Unit Economics Assumptions:3,600 sq. ft. 125 seat designNon-Colorado labor model (federal tip credit minimum wage)Estimated Cash Investment = $800k to $1m net of landlord contribution Preopening costs = $225k expensed in Year 1 Year 2 Estimate Sales $2,400,000 - $2,700,000 Restaurant Operating Profit of 13% to 17% $312,000 - $449,000 Leasehold & FF&E Investment * $800,000 - $1,000,000 Store Level Cash on Cash ROI @ $850k 36.7% - 52.8% * Net of landlord tenant improvement allowance Good Times Restaurants Inc. 17 Source: All statements of Bad Daddy’s financial information are based on management’s estimates based on its currently operating restaurants and on results from operations from Bad Daddy’s restaurants that have been open more than 15 months. Restaurant Operating Profit is defined as Net Sales less all restaurant level operating, occupancy and advertising expenses but does not include depreciation, preopening expenses or allocation of any non-restaurant level expenses. Store Level Cash on Cash ROI is the Restaurant Operating Profit divided by the total cash investment. Our independent accountants have not examined the projections and do not express any assurance with respect thereto.

Strong Growth Platform Good Times growth in Colorado with company-owned storesSeed new market in 2016 to test for larger franchise platformContinued same store sales growth through menu innovation, remodels and deepening the all natural positioning at Good TimesBad Daddy’s company-owned growth off of a base of 14 company-operated stores at end of 201540-50% planned Bad Daddy’s unit growth for each of the next 3 years2 markets with infrastructure to support concentric growth Good Times Restaurants Inc. 18

Highly Experienced Management Team Boyd Hoback – President, CEO40 years in the restaurant business; with Good Times since inceptionImplemented sophisticated operating and management systems across all functional areasScott Lefever – Chief Operating Officer, Good Times35 years in the restaurant businessLed Good Times to top ranking in quality, friendliness, cleanliness (based on Sandelman Quicktrak study)Jim Zielke – Chief Financial OfficerOver 20 years in restaurant financeFormer CFO of public growth companySue Knutson – Controller, Treasurer30 years in restaurant accounting; implemented top notch systems and reportingOversees public accounting, SEC filings, internal controls Good Times Restaurants Inc. 19 Platform infrastructure with functional expertise Good Times Restaurants Inc.

Highly Experienced Management Team Scott Somes – Chief Operating OfficerFormer COO of Lonestar Steakhouses from inception (grown to over 200 restaurants)Former Regional VP of large Pizza Hut franchisee managing over 100 restaurantsMike Maloney – Director of Operations, Bad Daddy’s of Colorado Former VP Ops Paragon Steakhouses, Regional VP Lonestar Steakhouse Executive & operational positions with Jimmy John’sTimothy Kast– Executive Chef, Bad Daddy’s InternationalFormer Executive Chef Partner – Seasons 52 (Darden)Culinary Arts graduate Good Times Restaurants Inc. 20 Bad Daddy’s

The Investment Opportunity Financial Highlights 20 quarters of SSS growth in Good Times3 year compound SSS growth of 35% in Good TimesTwo proven economic models with attractive returnsBad Daddy’s top tier sales per sq. ft., economic modelStrong balance sheet with limited debt Long Term Growth Relatively small base of restaurants with large growth platformProjected consolidated annualized revenue run rate of $65m-$70m by Q1 fiscal 2016 (a)40-50% growth rate in new Bad Daddy’s restaurantsAttractive valuation vs small cap restaurant growth companies Good Times Restaurants Inc. 21 (a) The projected revenues by Q1 fiscal 2016 are based upon opening 4 additional Bad Daddy’s in Colorado by 12/31/2015, projected annualized revenues from the BDI acquisition and revenues from existing Good Times and Bad Daddy’s in ColoradoOur independent accountants have not examined the projections and do not express any assurance with respect thereto.