Attached files
| file | filename |
|---|---|
| 8-K - 8-K - Nuverra Environmental Solutions, Inc. | d937327d8k.htm |
| Exhibit 99.1
|
Exhibit 99.1
June 2015
Investor Presentation
|
|
Legal Disclaimer
FORWARD-LOOKING STATEMENTS:
This information contained herein includes certain forward-looking statements within the meaning of Section 27A of the Securities Act of 1933 and Section 21E of the Securities Exchange Act of 1934. These forward-looking statements may include forecasts of growth, revenues, business activity, adjusted EBITDA, pipeline and solids treatment initiatives, and landfill and treatment facility activities, as well as statements regarding possible acquisitions, divestitures, financings, business growth and expansion opportunities, availability of capital, ability to access capital markets, cost-saving initiatives, expected outcome of litigation and other statements that are not historical facts. Actual results may differ materially from results expressed or implied by these forward-looking statements. All forward-looking statements involve risks and uncertainties, including, difficulties encountered in acquiring and integrating businesses; uncertainties in evaluating goodwill and long-lived assets for potential impairment; potential impact of litigation; risks of successfully consummating expected transactions within the timeframes or on the terms contemplated; uncertainty relating to successful negotiation, execution and consummation of all necessary definitive agreements in connection with our strategic initiatives; whether certain markets grow as anticipated; pricing pressures; risks associated with our indebtedness; current and projected future uncertainties in commodities markets, including low oil and/or natural gas prices; changes in customer drilling and completion activities and capital expenditure plans; shifts in production in shale areas where we operate and/or shale areas where we currently do not have operations; control of costs and expenses; and the competitive and regulatory environment. Additional risks and uncertainties are disclosed from time to time in the Company’s filings with the SEC, including the Annual Report on Form 10-K for the fiscal year ended December 31, 2014, as well as Quarterly Reports on Form 10-Q and Current Reports on Form 8-K.
NON-GAAP FINANCIAL MEASURES:
This presentation contains non-GAAP financial measures as defined by the rules and regulations of the United States Securities and Exchange Commission. A non-GAAP financial measure is a numerical measure of a company’s historical or future financial performance, financial position or cash flows that excludes amounts, or is subject to adjustments that have the effect of excluding amounts, that are included in the most directly comparable measure calculated and presented in accordance with GAAP in the statements of operations or balance sheets of the Company; or includes amounts, or is subject to adjustments that have the effect of including amounts, that are excluded from the most directly comparable measure so calculated and presented. Reconciliations of these non-GAAP financial measures to their comparable GAAP financial measures are included in the attached financial tables.
These non-GAAP financial measures are provided because management of the Company uses these financial measures in maintaining and evaluating the Company’s ongoing financial results and trends. Management uses this non-GAAP information as an indicator of business performance, and evaluates overall management with respect to such indicators. Management believes that excluding items such as acquisition expenses, amortization of intangible assets, stock-based compensation, asset impairments, restructuring charges, expenses related to litigation and resolution of lawsuits, and other charges, which may or may not be non-recurring, among other items that are inconsistent in amount and frequency (as with acquisition expenses), or determined pursuant to complex formulas that incorporate factors, such as market volatility, that are beyond our control (as with stock-based compensation), for purposes of calculating these non-GAAP financial measures facilitates a more meaningful evaluation of the Company’s current operating performance and comparisons to the past and future operating performance. The Company believes that providing non-GAAP financial measures such as EBITDA, adjusted EBITDA, adjusted net income (loss), adjusted net income (loss) per share, and operating working capital, in addition to related GAAP financial measures, provides investors with greater transparency to the information used by the Company’s management.
|
|
Agenda
About Nuverra
Macro Environment
Q1 Update
Long-Term Strategy
|
|
About Nuverra (NYSE: NES)
|
|
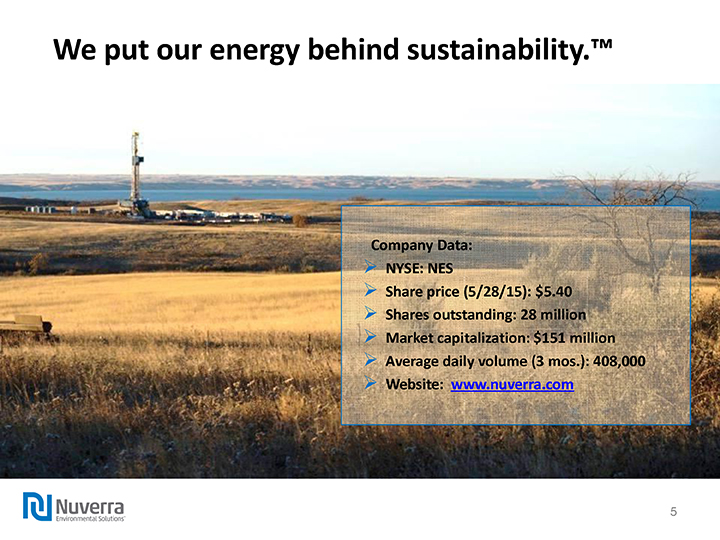
We put our energy behind sustainability.™
Company Data:
NYSE: NES
Share price (5/28/15): $5.40
Shares outstanding: 28 million
Market capitalization: $151 million
Average daily volume (3 mos.): 408,000
Website: www.nuverra.com
|
|
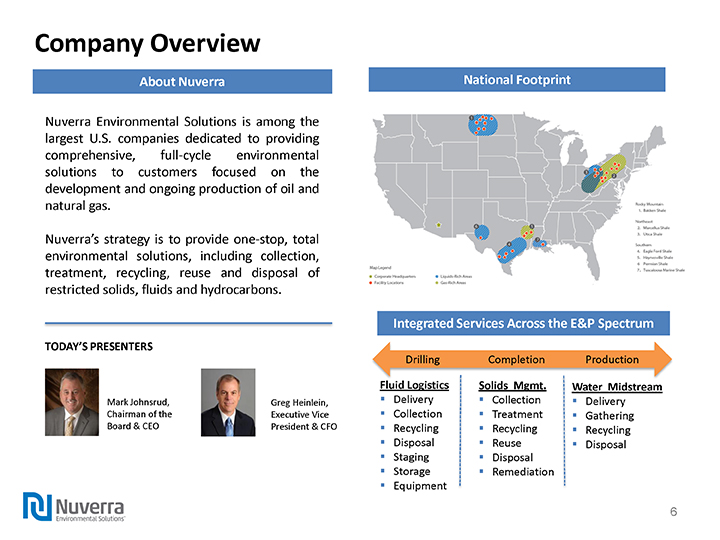
Company Overview
About Nuverra
Nuverra Environmental Solutions is among the largest U.S. companies dedicated to providing comprehensive, full-cycle environmental solutions to customers focused on the development and ongoing production of oil and natural gas.
Nuverra’s strategy is to provide one-stop, total environmental solutions, including collection, treatment, recycling, reuse and disposal of restricted solids, fluids and hydrocarbons.
National Footprint
TODAY’S PRESENTERS
Mark Johnsrud, Chairman of the Board & CEO
Greg Heinlein, Executive Vice President & CFO
Integrated Services Across the E&P Spectrum
Drilling Completion Production
Fluid Logistics
Delivery
Collection
Recycling
Disposal
Staging
Storage
Equipment
Solids Mgmt.
Collection
Treatment
Recycling
Reuse
Disposal
Remediation
Water Midstream
Delivery
Gathering
Recycling
Disposal
|
|
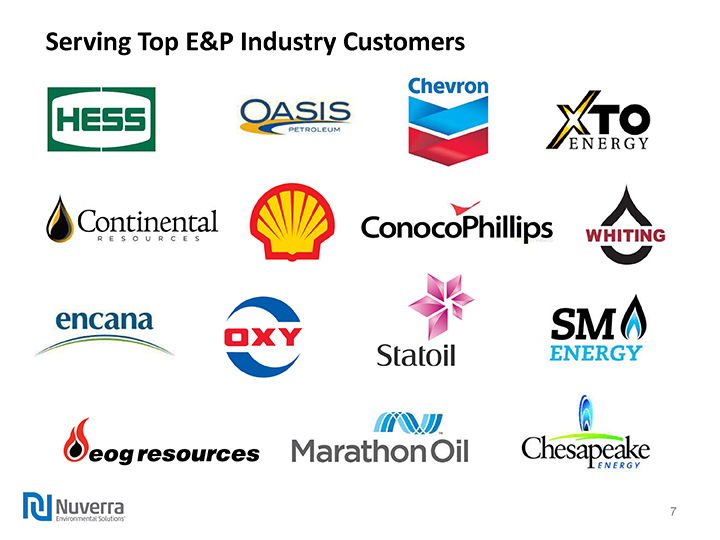
Serving Top E&P Industry Customers
|
|
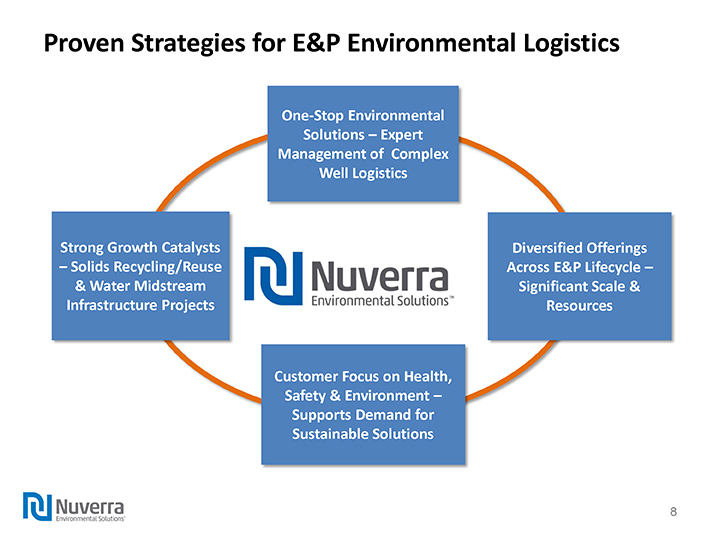
Proven Strategies for E&P Environmental Logistics
|
|
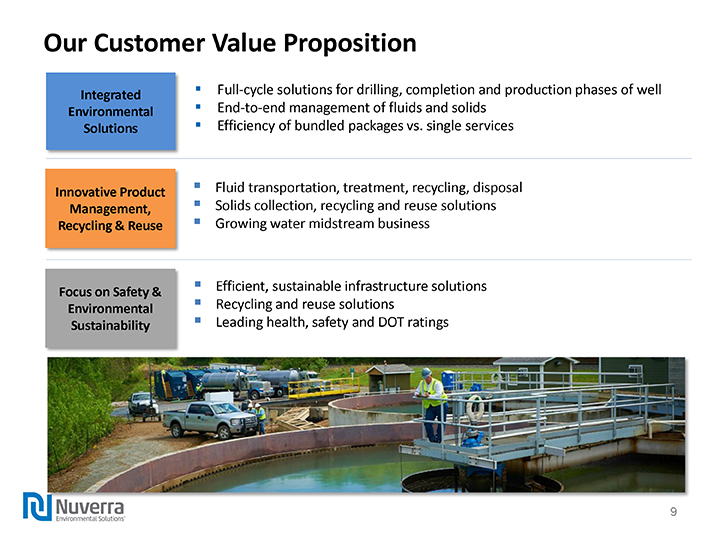
Our Customer Value Proposition
Full-cycle solutions for drilling, completion and production phases of well
End-to-end management of fluids and solids
Efficiency of bundled packages vs. single services
Fluid transportation, treatment, recycling, disposal
Solids collection, recycling and reuse solutions
Growing water midstream business
Efficient, sustainable infrastructure solutions
Recycling and reuse solutions
Leading health, safety and DOT ratings
|
|
Macro Environment
|
|
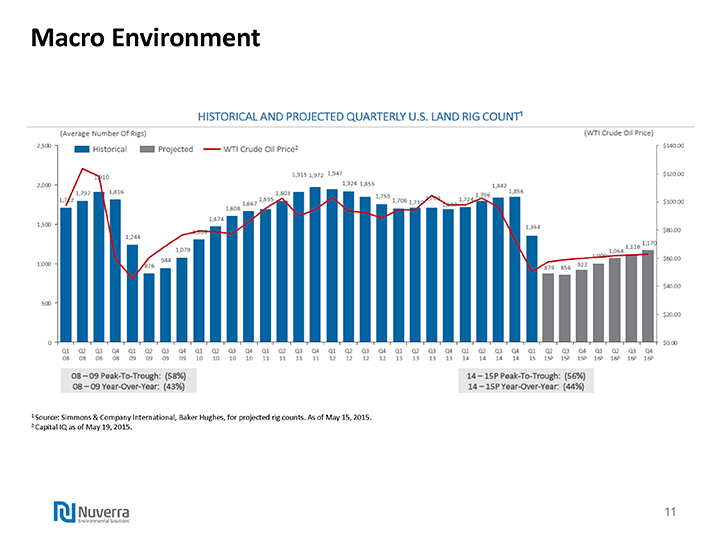
Macro Environment
| 1 |
|
Source: Simmons & Company International, Baker Hughes, for projected rig counts. As of May 15, 2015. |
| 2 |
|
Capital IQ as of May 19, 2015. |
|
|
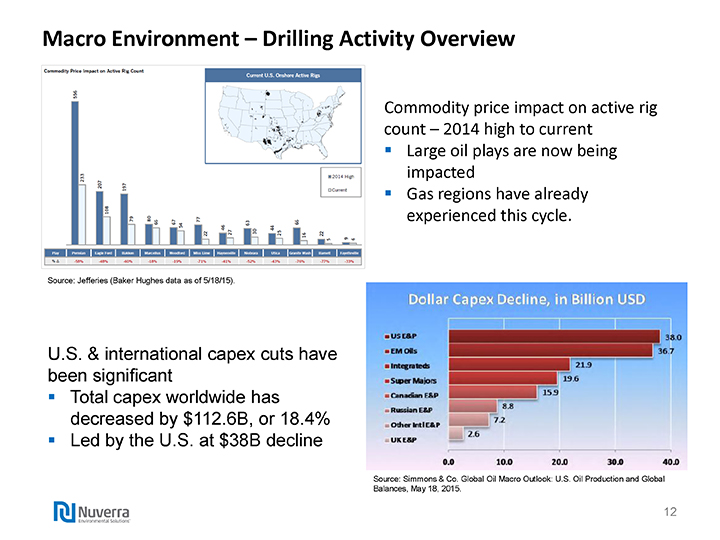
Macro Environment – Drilling Activity Overview
Source: Jefferies (Baker Hughes data as of 5/18/15).
U.S. & international capex cuts have been significant
Total capex worldwide has decreased by $112.6B, or 18.4%
Led by the U.S. at $38B decline
Commodity price impact on active rig count – 2014 high to current
Large oil plays are now being impacted
Gas regions have already experienced this cycle.
Source: Simmons & Co. Global Oil Macro Outlook: U.S. Oil Production and Global Balances, May 18, 2015.
|
|
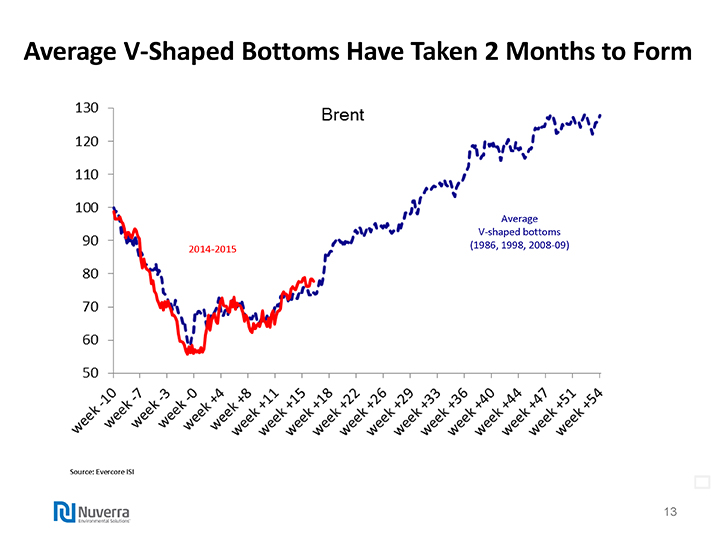
Average V-Shaped Bottoms Have Taken 2 Months to Form
Average
Source: Evercore ISI
|
|
Q1 Update
|
|
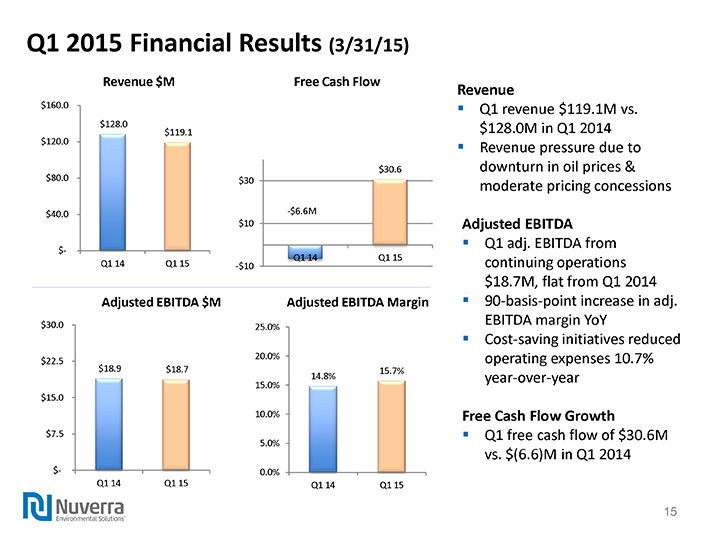
Q1 2015 Financial Results (3/31/15)
Revenue $M
Free Cash Flow
Adjusted EBITDA $M
Adjusted EBITDA Margin
Revenue
Q1 revenue $119.1M vs. $128.0M in Q1 2014
Revenue pressure due to downturn in oil prices & moderate pricing concessions
Adjusted EBITDA
Q1 adj. EBITDA from continuing operations $18.7M, flat from Q1 2014
90-basis-point increase in adj. EBITDA margin YoY
Cost-saving initiatives reduced operating expenses 10.7% year-over-year
Free Cash Flow Growth
Q1 free cash flow of $30.6M vs. $(6.6)M in Q1 2014
|
|
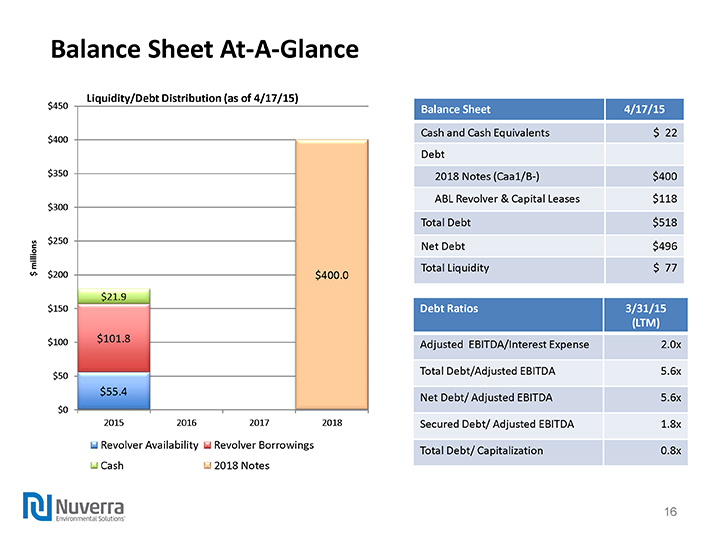
Balance Sheet At-A-Glance
Balance Sheet 4/17/15
Cash and Cash Equivalents $ 22
Debt
2018 Notes (Caa1/B-) $400
ABL Revolver & Capital Leases $118
Total Debt $518
Net Debt $496
Total Liquidity $ 77
Debt Ratios 3/31/15 (LTM)
Adjusted EBITDA/Interest Expense 2.0x
Total Debt/Adjusted EBITDA 5.6x
Net Debt/ Adjusted EBITDA 5.6x
Secured Debt/ Adjusted EBITDA 1.8x
Total Debt/ Capitalization 0.8x
|
|
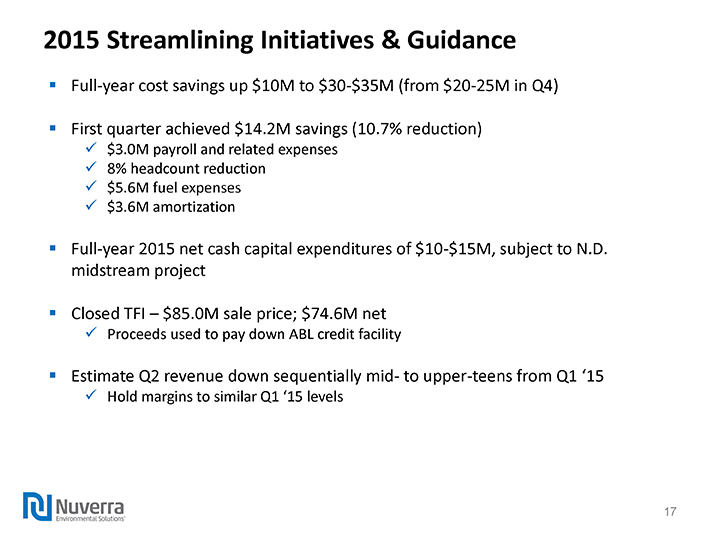
2015 Streamlining Initiatives & Guidance
Full-year cost savings up $10M to $30-$35M (from $20-25M in Q4)
First quarter achieved $14.2M savings (10.7% reduction)
$3.0M payroll and related expenses
8% headcount reduction
$5.6M fuel expenses
$3.6M amortization
Full-year 2015 net cash capital expenditures of $10-$15M, subject to N.D. midstream project
Closed TFI – $85.0M sale price; $74.6M net
Proceeds used to pay down ABL credit facility
Estimate Q2 revenue down sequentially mid- to upper-teens from Q1 ‘15
Hold margins to similar Q1 ‘15 levels
|
|
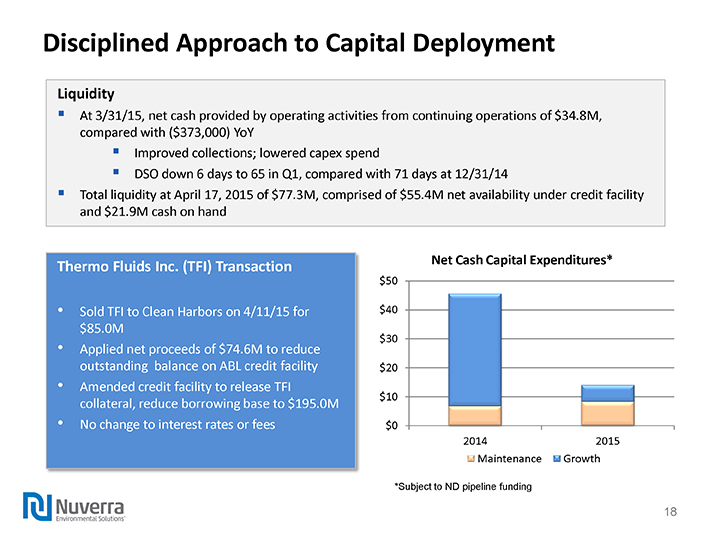
Disciplined Approach to Capital Deployment
Liquidity
At 3/31/15, net cash provided by operating activities from continuing operations of $34.8M, compared with ($373,000) YoY
Improved collections; lowered capex spend
DSO down 6 days to 65 in Q1, compared with 71 days at 12/31/14
Total liquidity at April 17, 2015 of $77.3M, comprised of $55.4M net availability under credit facility and $21.9M cash on hand
Thermo Fluids Inc. (TFI) Transaction
Sold TFI to Clean Harbors on 4/11/15 for $85.0M
Applied net proceeds of $74.6M to reduce outstanding balance on ABL credit facility
Amended credit facility to release TFI collateral, reduce borrowing base to $195.0M
No change to interest rates or fees
Net Cash Capital Expenditures*
Maintenance Growth
*Subject to ND pipeline funding
|
|
Long-Term Strategy
|
|
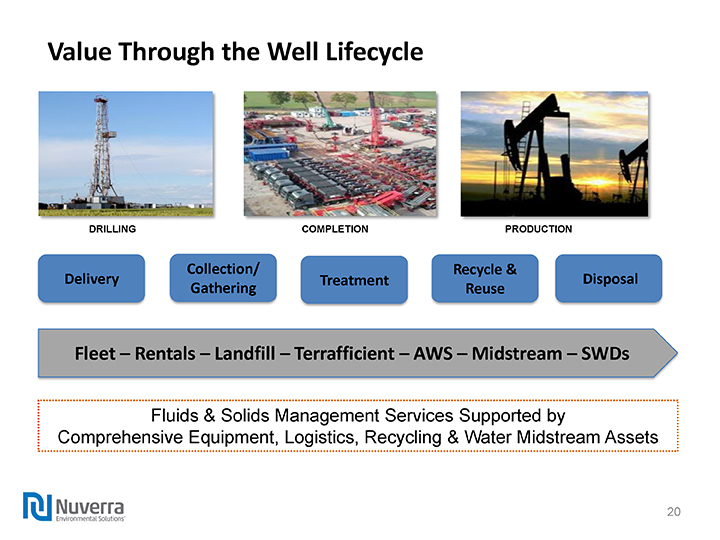
Value Through the Well Lifecycle
DRILLING
COMPLETION
PRODUCTION
Fluids & Solids Management Services Supported by
Comprehensive Equipment, Logistics, Recycling & Water Midstream Assets
|
|
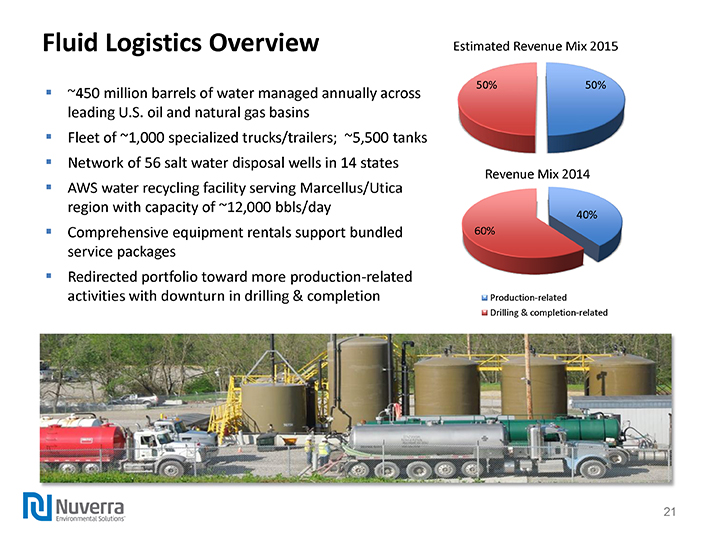
Fluid Logistics Overview
~450 million barrels of water managed annually across leading U.S. oil and natural gas basins
Fleet of ~1,000 specialized trucks/trailers; ~5,500 tanks
Network of 56 salt water disposal wells in 14 states
AWS water recycling facility serving Marcellus/Utica region with capacity of ~12,000 bbls/day
Comprehensive equipment rentals support bundled service packages
Redirected portfolio toward more production-related activities with downturn in drilling & completion
Estimated Revenue Mix 2015
Revenue Mix 2014
|
|
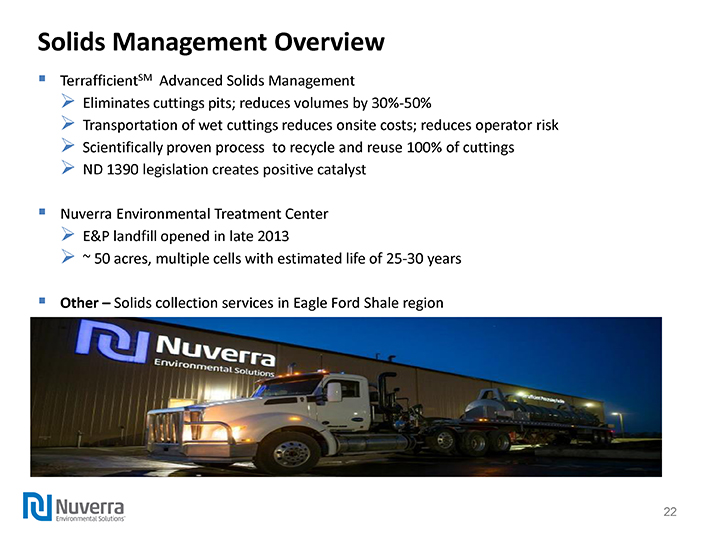
Solids Management Overview
TerrafficientSM Advanced Solids Management
Eliminates cuttings pits; reduces volumes by 30%-50%
Transportation of wet cuttings reduces onsite costs; reduces operator risk
Scientifically proven process to recycle and reuse 100% of cuttings
ND 1390 legislation creates positive catalyst
Nuverra Environmental Treatment Center
E&P landfill opened in late 2013
~ 50 acres, multiple cells with estimated life of 25-30 years
Other – Solids collection services in Eagle Ford Shale region
|
|
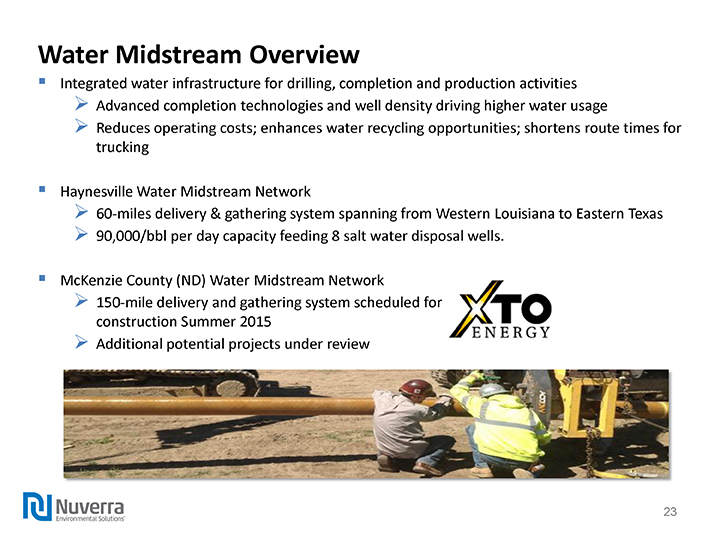
Water Midstream Overview
Integrated water infrastructure for drilling, completion and production activities
Advanced completion technologies and well density driving higher water usage
Reduces operating costs; enhances water recycling opportunities; shortens route times for trucking
Haynesville Water Midstream Network
60-miles delivery & gathering system spanning from Western Louisiana to Eastern Texas
90,000/bbl per day capacity feeding 8 salt water disposal wells.
McKenzie County (ND) Water Midstream Network
150-mile delivery and gathering system scheduled for construction Summer 2015
Additional potential projects under review
|
|
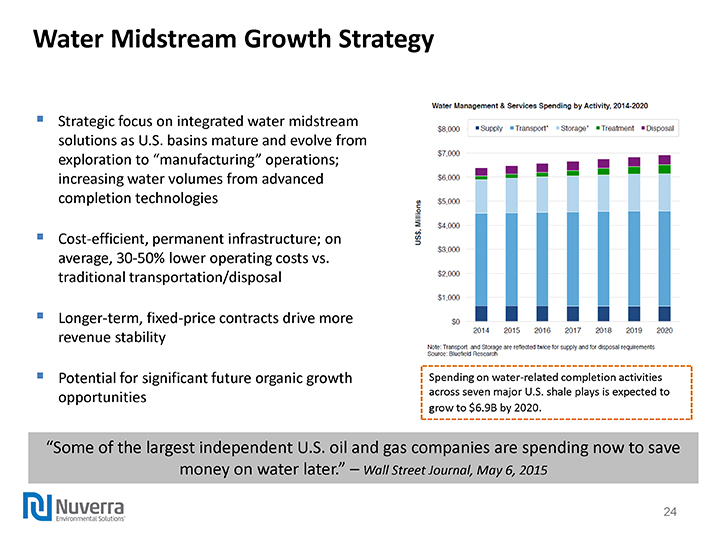
Water Midstream Growth Strategy
Strategic focus on integrated water midstream solutions as U.S. basins mature and evolve from exploration to “manufacturing” operations; increasing water volumes from advanced completion technologies
Cost-efficient, permanent infrastructure; on average, 30-50% lower operating costs vs. traditional transportation/disposal
Longer-term, fixed-price contracts drive more revenue stability
Potential for significant future organic growth opportunities
Spending on water-related completion activities across seven major U.S. shale plays is expected to grow to $6.9B by 2020.
“Some of the largest independent U.S. oil and gas companies are spending now to save money on water later.” – Wall Street Journal, May 6, 2015
|
|
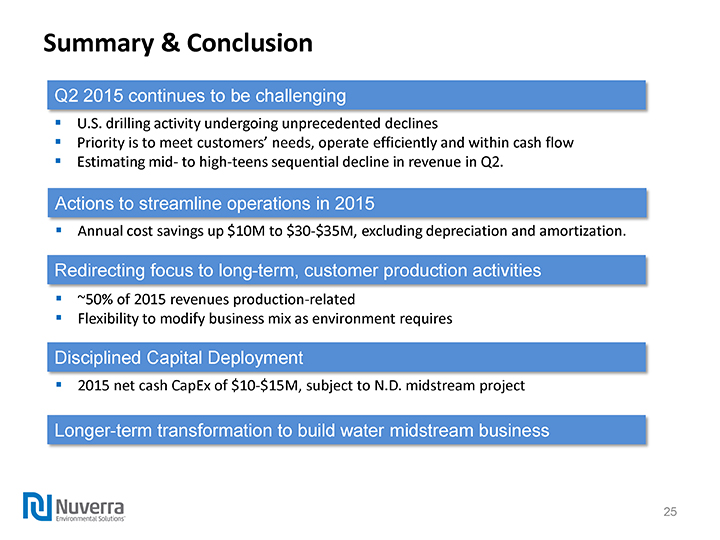
Summary & Conclusion
Q2 2015 continues to be challenging
U.S. drilling activity undergoing unprecedented declines
Priority is to meet customers’ needs, operate efficiently and within cash flow
Estimating mid- to high-teens sequential decline in revenue in Q2.
Actions to streamline operations in 2015
Annual cost savings up $10M to $30-$35M, excluding depreciation and amortization.
Redirecting focus to long-term, customer production activities
~50% of 2015 revenues production-related
Flexibility to modify business mix as environment requires
Disciplined Capital Deployment
2015 net cash CapEx of $10-$15M, subject to N.D. midstream project
Longer-term transformation to build water midstream business
|
|

Q&A
|
|
We put our energy behind sustainability.™
Appendix
|
|
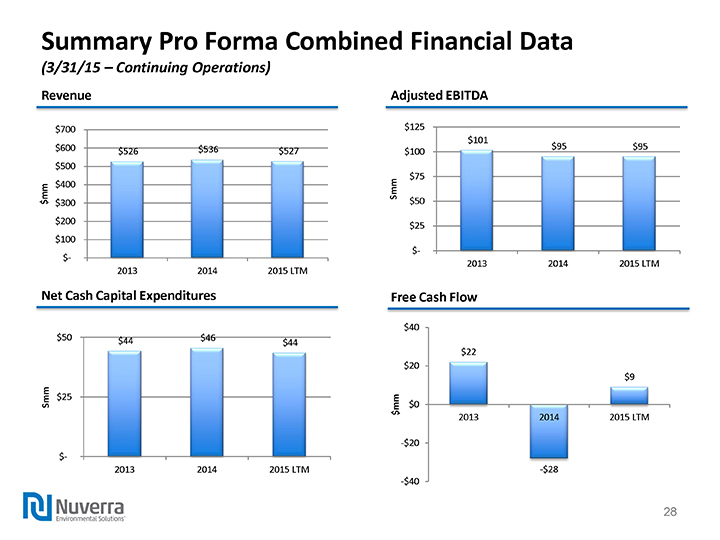
Summary Pro Forma Combined Financial Data (3/31/15 – Continuing Operations)
Revenue
Adjusted EBITDA
Net Cash Capital Expenditures
Free Cash Flow
|
|
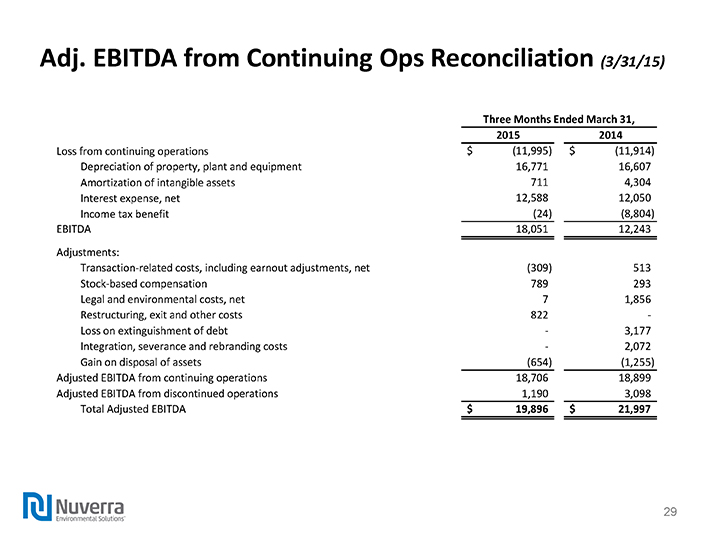
Adj. EBITDA from Continuing Ops Reconciliation (3/31/15)
Three Months Ended March 31,
2015 2014
Loss from continuing operations $(11,995) $(11,914)
Depreciation of property, plant and equipment 16,771 16,607
Amortization of intangible assets 711 4,304
Interest expense, net 12,588 12,050
Income tax benefit(24)(8,804)
EBITDA 18,051 12,243
Adjustments:
Transaction-related costs, including earnout adjustments, net(309) 513
Stock-based compensation 789 293
Legal and environmental costs, net 7 1,856
Restructuring, exit and other costs 822 -
Loss on extinguishment of debt –3,177
Integration, severance and rebranding costs –2,072
Gain on disposal of assets(654)(1,255)
Adjusted EBITDA from continuing operations 18,706 18,899
Adjusted EBITDA from discontinued operations 1,190 3,098
Total Adjusted EBITDA $ 19,896 $ 21,997
|
|
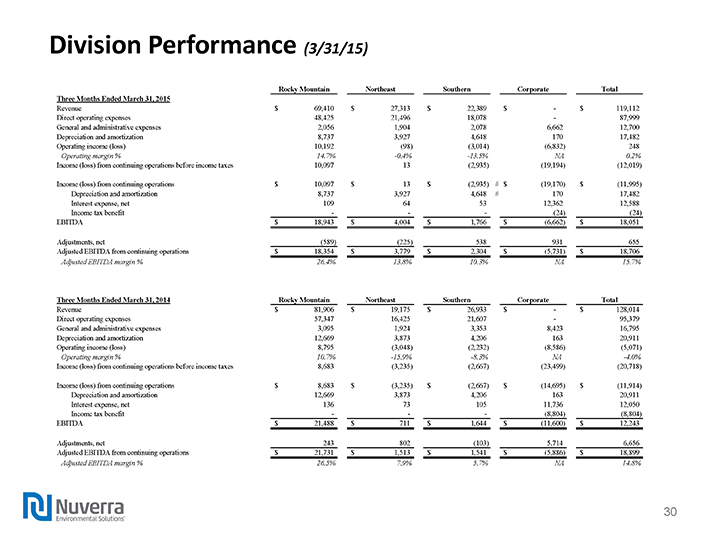
Division Performance(3/31/15)
Rocky Mountain Northeast Southern Corporate Total
Three Months Ended March 31, 2015
Revenue $ 69,410 $ 27,313 $ 22,389 $ –$ 119,112
Direct operating expenses 48,425 21,496 18,078 –87,999
General and administrative expenses 2,056 1,904 2,078 6,662 12,700
Depreciation and amortization 8,737 3,927 4,648 170 17,482
Operating income (loss) 10,192(98)(3,014)(6,832) 248
Operating margin % 14.7% -0.4% -13.5% NA 0.2%
Income (loss) from continuing operations before income taxes 10,097 13(2,935)(19,194)(12,019)
Income (loss) from continuing operations $ 10,097 $ 13 $(2,935) # $(19,170) $(11,995)
Depreciation and amortization 8,737 3,927 4,648 # 170 17,482
Interest expense, net 109 64 53 12,362 12,588
Income tax benefit – (24)(24)
EBITDA $ 18,943 $ 4,004 $ 1,766 $(6,662) $ 18,051
Adjustments, net(589)(225) 538 931 655
Adjusted EBITDA from continuing operations $ 18,354 $ 3,779 $ 2,304 $(5,731) $ 18,706
Adjusted EBITDA margin % 26.4% 13.8% 10.3% NA 15.7%
Three Months Ended March 31, 2014 Rocky Mountain Northeast Southern Corporate Total
Revenue $ 81,906 $ 19,175 $ 26,933 $ –$ 128,014
Direct operating expenses 57,347 16,425 21,607 –95,379
General and administrative expenses 3,095 1,924 3,353 8,423 16,795
Depreciation and amortization 12,669 3,873 4,206 163 20,911
Operating income (loss) 8,795(3,048)(2,232)(8,586)(5,071)
Operating margin % 10.7% -15.9% -8.3% NA -4.0%
Income (loss) from continuing operations before income taxes 8,683(3,235)(2,667)(23,499)(20,718)
Income (loss) from continuing operations $ 8,683 $(3,235) $(2,667) $(14,695) $(11,914)
Depreciation and amortization 12,669 3,873 4,206 163 20,911
Interest expense, net 136 73 105 11,736 12,050
Income tax benefit – (8,804)(8,804)
EBITDA $ 21,488 $ 711 $ 1,644 $(11,600) $ 12,243
Adjustments, net 243 802(103) 5,714 6,656
Adjusted EBITDA from continuing operations $ 21,731 $ 1,513 $ 1,541 $(5,886) $ 18,899
Adjusted EBITDA margin % 26.5% 7.9% 5.7% NA 14.8%