Attached files
| file | filename |
|---|---|
| 8-K - 8-K - CAMDEN NATIONAL CORP | a8-kitem7016115_investorco.htm |

June 1-2, 2015 NASDAQ: CAC 1
Forward Looking Statements Certain statements contained in this presentation that are not statements of historical fact constitute forward-looking statements within the meaning of the Private Securities Litigation Reform Act of 1995 about the proposed merger of Camden National Corporation (“Camden National”) and SBM Financial, Inc (“SBM”). These statements include statements regarding the anticipated closing date of the transaction, estimated cost savings of SBM’s pre-tax non- interest expenses, the amount of accretion of the transaction to Camden National’s earnings, and Camden National’s pro forma tangible equity to tangible assets ratio. Forward-looking statements can be identified by the fact that they do not relate strictly to historical or current facts. They often include words like “believe,” “expect,” “anticipate,” “estimate,” and “intend” or future or conditional verbs such as “will,” “would,” “should,” “could” or “may.” Certain factors that could cause actual results to differ materially from expected results include delays in completing the proposed merger, difficulties in achieving cost savings from the proposed merger or in achieving such cost savings within the expected time frame, difficulties in integrating Camden National and SBM, increased competitive pressures, changes in the interest rate environment, changes in general economic conditions, legislative and regulatory changes that adversely affect the business in which Camden National and SBM are engaged, changes in the securities markets and other risks and uncertainties disclosed from time to time in in Camden National’s Annual Report on Form 10-K for the year ended December 31, 2014, as updated by our Quarterly Reports on Form 10-Q and other filings with the SEC. Camden National does not have any obligation to update forward-looking statements. 2 This presentation references non-GAAP financial measures incorporating core operating earnings and related measures tangible equity and related measures, as well as core deposits and efficiency ratio. These measures are commonly used by investors in evaluating business combinations and financial condition. Non-GAAP Financial Measures
Additional Information and Where to Find It In connection with the proposed merger, Camden National filed with the Securities and Exchange Commission (“SEC”) a Registration Statement on Form S-4 on May 15, 2015 that included a Proxy Statement of SBM and Camden National and a Prospectus of Camden, as well as other relevant documents concerning the proposed merger. Investors and stockholders are urged to read the Registration Statement and the Proxy Statement/Prospectus regarding the proposed merger and any other relevant documents filed with the SEC, as well as any amendments or supplements to those documents, because they will contain important information. A free copy of the Registration Statement and Proxy Statement/Prospectus, as well as other filings containing information about Camden National and SBM, when they become available, may be obtained at the SEC’s Internet site (http://www.sec.gov). Copies of the Registration Statement and Proxy Statement/Prospectus and the filings that will be incorporated by reference therein may also be obtained, free of charge, from Camden National’s website at camdennational.com or by contacting Camden National Investor Relations at (207) 236-8821 or by contacting SBM Investor Relations at (207) 518-5607. 3 Camden National and certain of its directors and executive officers may be deemed to be participants in the solicitation of proxies from the stockholders of Camden National in connection with the proposed merger. Information about the directors and executive officers of Camden National is set forth in the proxy statement for Camden National’s 2015 annual meeting of stockholders, as filed with the SEC on a Schedule 14A on March 12, 2015. Additional information regarding the interests of those participants and other persons who may be deemed participants in the transaction and a description of their direct and indirect interests, by security holdings or otherwise, may be obtained by reading the Proxy Statement/Prospectus and other relevant documents regarding the proposed merger to be filed with the SEC (when they become available). Free copies of these documents may be obtained as described in the preceding paragraph. Participants in Solicitation
Camden National Corporation Camden National Corporation is a Maine-based community bank focused on delivering long- term shareholder value through banking, brokerage and wealth management services in Maine, New Hampshire and select markets of New England. The recently announced merger transaction with SBM Financial will result in one of the strongest banking franchises in New England. 4

Camden National Corporation Founded 1875 Headquartered in Camden, Maine 44 locations in Maine and New Hampshire LPO Acadia Trust, N.A. (wealth management) NASDAQ: CAC Market Cap (5/15/15) : $284.6 MM Shares Outstanding: 7,442,559 Institutional/Mutual Fund ownership: 47% Insider Ownership: 2% Current stock price (5/15/15): $38.24 Tangible book value: $27.41 Price/TBV: 140% 52 week trading range: $34.75 to $41.83 Average Daily Volume: 11,886 Total Assets: $2.8B Total Loans: $1.8B Total Deposits: $2.0B TCE/TA: 7.38% Regulatory Leverage: 9.31% Camden National Corporation 5

(1) Based on CAC closing price of $38.60 on March 27, 2015 (subject to change). Source: SNL Financial. Deposit data as of June 2014. • Assets: $3.6 billion • Loans: $2.4 billion • Deposits: $2.6 billion • Annualized revenue: $150 million • Branches: 64 plus lending offices • Market capitalization: approximately $390 million (1) • NASDAQ: CAC 6 33,142,198 255,231,107 66,182,173 206,223,247 123,134,132 207,145,144 Creating Maine’s strongest banking franchise Augusta Bangor Camden Kennebunk Portland Brunswick Camden National – Post-SBM Merger

Seasoned Management Team Age Years of Banking Experience Year joined Camden Greg Dufour, President and CEO 55 25+ 2001 Debbie Jordan, CPA, COO and CFO 49 20+ 2008 Joanne Campbell, EVP Risk Management 52 30+ 1996 Peter Greene, EVP Operations/Technology 55 30+ 2008 Tim Nightingale, EVP Senior Loan Officer 57 30+ 2000 June Parent, EVP Retail Banking 51 25+ 1995 Steven Tall, President and CEO Acadia Trust 53 15+ 2011 SBM senior management anticipated to join upon merger: Edmund Hayden, EVP Chief Credit Officer, Renée Smyth, SVP Chief Marketing and Virtual Banking and Raymond Doherty, President of Healthcare Professional Funding Corporation 7

$0 $500 $1,000 $1,500 $2,000 $2,500 $3,000 $3,500 1994 1996 1998 2000 2002 2004 2006 2008 2010 2012 2014 United Corp. $54 million KSB Bancorp $179 million Union Bankshares $565 million Bank of America 14 Branches $287 million Branch Sale 5 Branches $46 million The Bank of Maine $806 million Key Bank 4 Branches $54 million Through 12/31/14 Organic Growth: $1,194 million Acquired Growth: $1,140 million Total Growth CAGR: 9.5% Asset Growth and M&A History 8 33,142,198 255,231,107 66,182,173 206,223,247 123,134,132 207,145,144

$8.57 $26.52 $0.00 $5.00 $10.00 $15.00 $20.00 $25.00 $30.00 '99 '00 '01 '02 '03 '04 '05 '06 '07 '08 '09 '10 '11 '12 '13 '14 Long-term Shareholder Value 9 33,142,198 255,231,107 66,182,173 206,223,247 123,134,132 207,145,144 Earnings Per Share TBV Per Share $0 $10 $20 $30 $40 $50 $60 $70 $80 $90 '99 '00 '01 '02 '03 '04 '05 '06 (b) '07 '08 '09 '10 '11 '12 '13 '14 0% 10% 20% 30% 40% 50% 60% '99 '00 '01 '02 '03 '04 '05 (a) '06 '07 '08 '09 '10 '11 (a) '12 '13 '14 Dividends as % of Net Income Cumulative Stock Repurchases ($ in millions) $1.27 $3.28 $0.00 $1.00 $2.00 $3.00 $4.00 '99 '00 '01 '02 '03 '04 '05 '06 '07 '08 '09 '10 '11 '12 '13 '14 a) 2005 and 2011, special $.50 dividend b) 2006 issuance of trust preferred and share buyback

(in million’s) 3/31/15 3/31/14 12/31/14 12/31/13 Loans (a) $1,792 $1,620 $1,773 $1,580 Investment Securities 814 825 804 828 Total Assets 2,811 2,641 2,790 2,604 Deposits (b) 1,966 1,837 1,932 1,814 Borrowings 548 541 577 530 Shareholders’ Equity 252 231 245 231 Leverage Ratio 9.31% 9.27% 9.26% 9.43% (a) Loans: 11% growth - Q1 2015 over Q1 2014 12% growth - 12/31/14 over 12/31/13 (b) Deposits: 7% growth for both periods Financial Highlights Balance Sheet 10
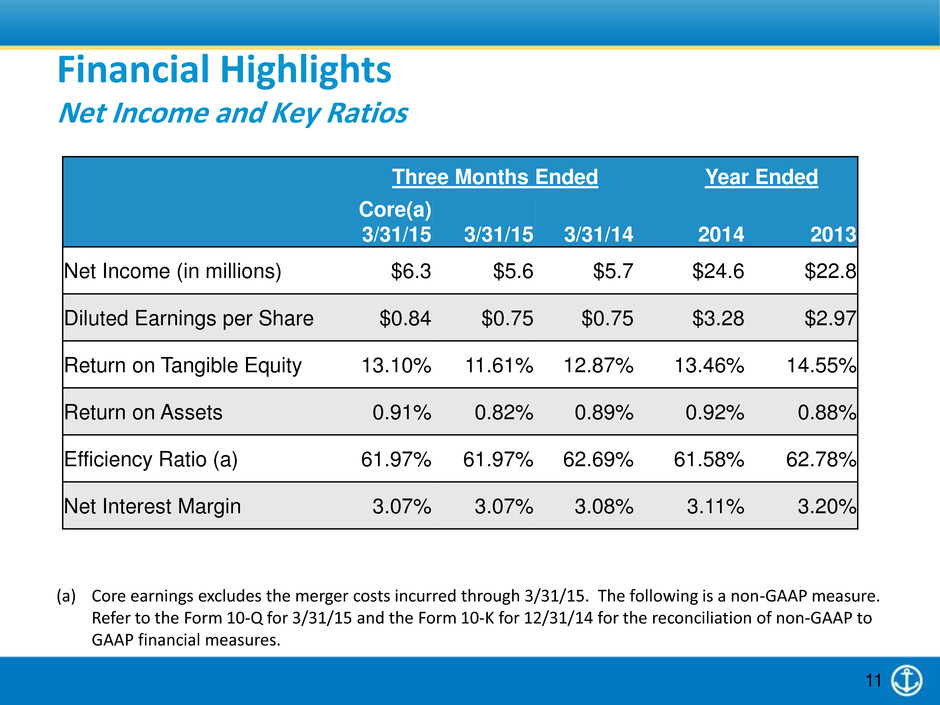
Financial Highlights Net Income and Key Ratios 11 Three Months Ended Year Ended Core(a) 3/31/15 3/31/15 3/31/14 2014 2013 Net Income (in millions) $6.3 $5.6 $5.7 $24.6 $22.8 Diluted Earnings per Share $0.84 $0.75 $0.75 $3.28 $2.97 Return on Tangible Equity 13.10% 11.61% 12.87% 13.46% 14.55% Return on Assets 0.91% 0.82% 0.89% 0.92% 0.88% Efficiency Ratio (a) 61.97% 61.97% 62.69% 61.58% 62.78% Net Interest Margin 3.07% 3.07% 3.08% 3.11% 3.20% (a) Core earnings excludes the merger costs incurred through 3/31/15. The following is a non-GAAP measure. Refer to the Form 10-Q for 3/31/15 and the Form 10-K for 12/31/14 for the reconciliation of non-GAAP to GAAP financial measures.

Total Loans: $1.79 billion Yield: 4.10% Loan Profile As of 3/31/15 Change in Portfolio Mix (Average Balances) 12 Commercial 14% Commercial Real Estate 37% Residential Mortgages 33% Home Equity/Consumer 16% Total Loans: $2.43 billion Yield: 4.15% CNC Pro Forma Commercial 16% Commercial Real Estate 35% Residential Mortgages 34% Home Equity/Consumer 15% $- $150 $300 $450 $600 $750 $900 $1,050 $1,200 $1,350 2009 2010 2011 2012 2013 2014 2015Q1 Pro Forma M ill io n s Commercial Retail
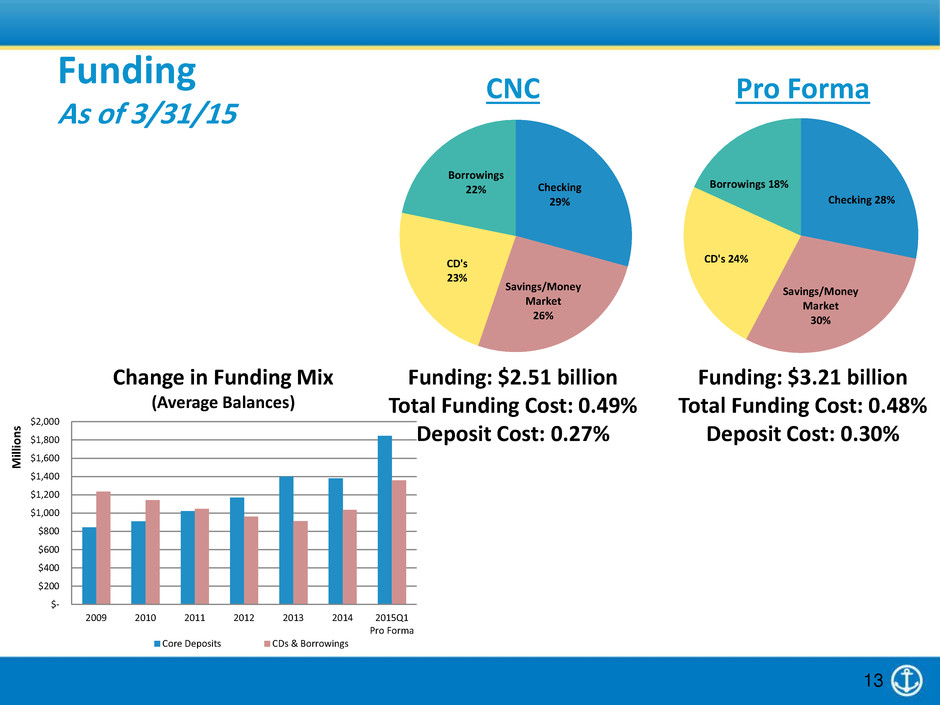
Funding: $2.51 billion Total Funding Cost: 0.49% Deposit Cost: 0.27% Funding As of 3/31/15 Change in Funding Mix (Average Balances) 13 Checking 29% Savings/Money Market 26% CD's 23% Borrowings 22% Checking 28% Savings/Money Market 30% CD's 24% Borrowings 18% CNC Pro Forma Funding: $3.21 billion Total Funding Cost: 0.48% Deposit Cost: 0.30% $- $200 $400 $600 $800 $1,000 $1,200 $1,400 $1,600 $1,800 $2,000 2009 2010 2011 2012 2013 2014 2015Q1 Pro Forma M ill io n s Core Deposits CDs & Borrowings

Asset/Liability Management As of 3/31/15 Interest Rate Risk 14 Estimated Changes In Net Interest Income Year 1 +200bp -5.7% -100bp -0.9% Year 2 +200bp -6.1% -100bp -6.2% (Assumes flat balance sheet and no change in asset/funding mix) • Investment portfolio: Duration of 3.7 years with strong cash flows over two year horizon (cumulative cash flow of $198 million in up 200 bp scenario) • Loan portfolio: Sell current production of 30 year residential mortgages and provide customer loan swaps for long-term fixed rate commercial real estate transactions • Funding: Extension of borrowings and forward interest swaps and lag increase in core deposit rates in rising rate environment Strategies for Rising Rates: Estimated Changes In Net Interest Income Year 1 +200bp -4.5% -100bp -0.8% Year 2 +200bp -4.3% -100bp -6.8% (Assumes flat balance sheet and no change in asset/funding mix) CNC Pro Forma Interest Rate Risk

Strategic Decisions to Reposition for Future Build market share Create efficiencies Expand markets and businesses • Acquired 14 branches and $287 million of deposits from Bank of America (2012) • Talent Expansion -10 new lenders -Deepen credit “bench” -Internal training • Divested 5 rural branches and consolidated two branches (2013) • Outsourced core processing (Jack Henry) • Expanded digital technologies • Leveraged mortgage loan platform and AML/BSA system • Opened Manchester, New Hampshire loan production office with seasoned lender • Build out corporate services and cash management capabilities • Number one Finance Authority of Maine lender (five of the last six years) 15
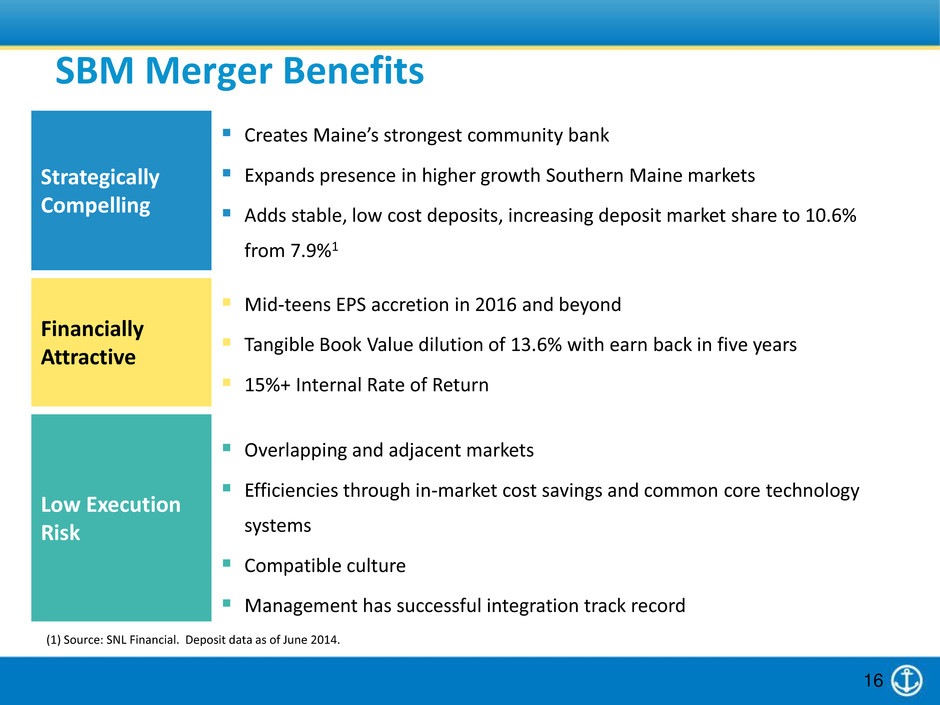
16 Strategically Compelling Creates Maine’s strongest community bank Expands presence in higher growth Southern Maine markets Adds stable, low cost deposits, increasing deposit market share to 10.6% from 7.9%1 Financially Attractive Mid-teens EPS accretion in 2016 and beyond Tangible Book Value dilution of 13.6% with earn back in five years 15%+ Internal Rate of Return Low Execution Risk Overlapping and adjacent markets Efficiencies through in-market cost savings and common core technology systems Compatible culture Management has successful integration track record 33,142,198 255,231,107 66,182,173 206,223,247 123,134,132 207,145,144 SBM Merger Benefits (1) Source: SNL Financial. Deposit data as of June 2014.

SBM Merger Strategic Rationale • Continuation of Camden’s strategy to reposition itself • Leverage existing areas of expertise; banking, wealth management/brokerage and mortgage banking • Cost savings • Reduced execution risk resulting from several common core technology systems • SBM was the last stock-based banking franchise in Southern Maine 17
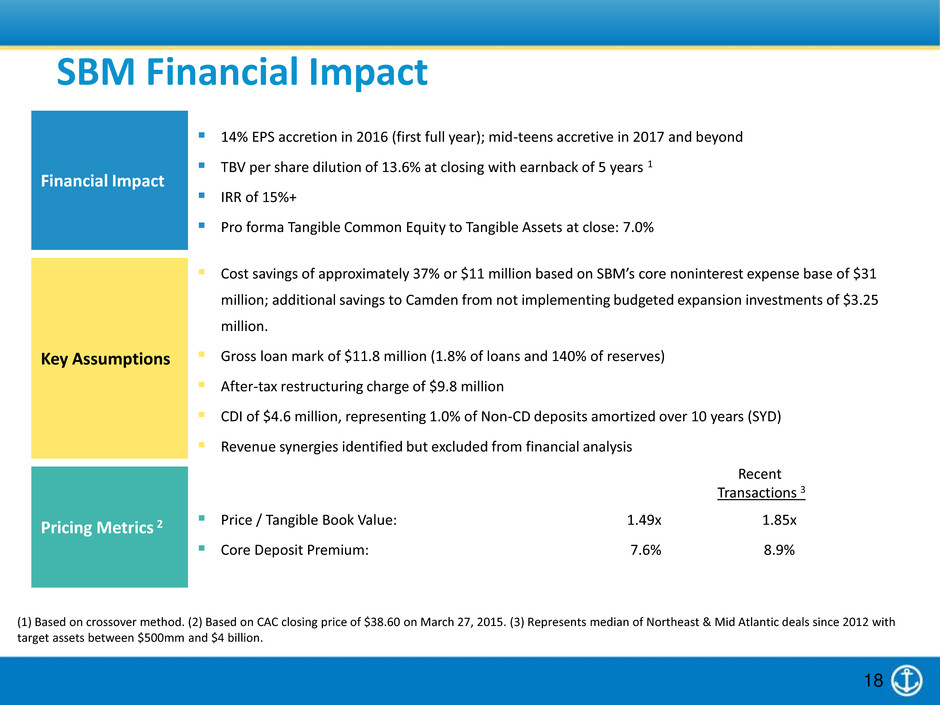
18 Financial Impact 14% EPS accretion in 2016 (first full year); mid-teens accretive in 2017 and beyond TBV per share dilution of 13.6% at closing with earnback of 5 years 1 IRR of 15%+ Pro forma Tangible Common Equity to Tangible Assets at close: 7.0% Key Assumptions Cost savings of approximately 37% or $11 million based on SBM’s core noninterest expense base of $31 million; additional savings to Camden from not implementing budgeted expansion investments of $3.25 million. Gross loan mark of $11.8 million (1.8% of loans and 140% of reserves) After-tax restructuring charge of $9.8 million CDI of $4.6 million, representing 1.0% of Non-CD deposits amortized over 10 years (SYD) Revenue synergies identified but excluded from financial analysis Pricing Metrics 2 Recent Transactions 3 Price / Tangible Book Value: 1.49x 1.85x Core Deposit Premium: 7.6% 8.9% (1) Based on crossover method. (2) Based on CAC closing price of $38.60 on March 27, 2015. (3) Represents median of Northeast & Mid Atlantic deals since 2012 with target assets between $500mm and $4 billion. 33,142,198 255,231,107 66,182,173 206,223,247 123,134,132 207,145,144 SBM Financial Impact
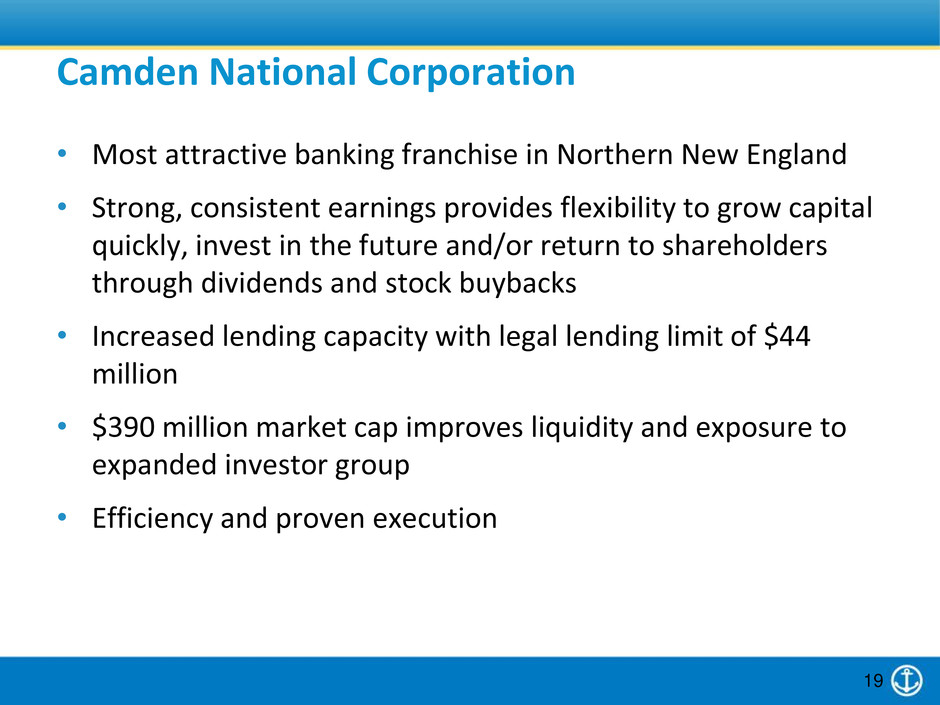
Camden National Corporation • Most attractive banking franchise in Northern New England • Strong, consistent earnings provides flexibility to grow capital quickly, invest in the future and/or return to shareholders through dividends and stock buybacks • Increased lending capacity with legal lending limit of $44 million • $390 million market cap improves liquidity and exposure to expanded investor group • Efficiency and proven execution 19 33,142,198 255,231,107 66,182,173 206,223,247 123,134,132 207,145,144

20 33,142,198 255,231,107 66,182,173 206,223,247 123,134,132 207,145,144 Appendix

21 ($ in millions) Balance Sheet 1 Assets Loans Deposits Loans / Assets Loans / Deposits $2,790 $1,773 $1,932 64% 92% $806 $638 $658 78% 97% $3,596 $2,411 $2,590 67% 93% Profitability Ratios 2 Return on Assets Return on Tang. Equity Net Interest Margin Efficiency Ratio Fee Income / Revenue 0.92% 13.5% 3.11% 62% 24% 0.22% 2.0% 3.59% 89% 25% 1.0% 3 15% 3 3.22% 60% 4 24% Capital & Asset Quality Tangible Common Ratio Leverage Ratio NPAs / Assets 7.2% 9.3% 0.82% 10.7% 9.9% 1.61% 7.0% 5 8.0% 5 0.99% Combined Source: Company reports and SNL Financial. (1) Pro forma excludes impact of merger adjustments. (2) For the full year 2014. (3) Based on estimates for 2016 with full realization of cost savings. (4) Based on 2014, adjusted for full realization of cost savings. (5) Estimate at closing. 33,142,198 255,231,107 66,182,173 206,223,247 123,134,132 207,145,144 Combined franchise will have scale, strong financial metrics, and an attractive valuation

Source: SNL Financial. Deposit data as of June 2014. 22 33,142,198 255,231,107 66,182,173 206,223,247 123,134,132 Camden National (44 branches) SBM Financial (24 branches) 1-mi overlap: 8 branches | 33% 207,145,144 ($ in millions) Rank Insti tution Depos its Branches Market Share % 1 Toronto-Dominion Bank $3,170 50 13.3 2 KeyCorp 2,998 53 12.6 Camden + SBM 2,521 68 10.6 3 Bangor Bancorp MHC 2,116 59 8.9 4 Camden National Corp. 1,876 44 7.9 5 Bank of America Corp. 1,660 18 7.0 6 Firs t Bancorp Inc. 1,034 16 4.3 7 Machias Bancorp MHC 908 17 3.8 8 People's United Financia l 890 26 3.7 9 Bar Harbor Bankshares 838 16 3.5 10 Norway Bancorp MHC 810 24 3.4 11 Kennebunk SB 750 13 3.1 12 Gorham Bancorp MHC 689 11 2.9 13 SBM Financial Inc. 645 24 2.7 14 Androscoggin Bancorp 602 12 2.5 15 Northeast Bancorp 596 12 2.5 Branch Network and Deposit Market Share Augusta Brunswick Portland Kennebunk Bangor Camden

Market Demographics Current Southern Southern Footprint ME NH Market Segments & Growth Total Households 291,602 202,605 453,657 Projected Growth, 2014 to 2019 0.2% 1.9% 1.3% Mass Affluent Households 78,216 102,179 259,169 % of Total Households 26.8% 50.4% 57.1% Number of Businesses 41,767 32,627 65,959 Data Source: Nielsen, Inc. 23

24
