Attached files
| file | filename |
|---|---|
| 8-K - 8-K - DYNEX CAPITAL INC | form8-kitem701item901.htm |

Keefe, Bruyette & Woods 2015 Mortgage Finance Conference June 2, 2015

2 Safe Harbor Statement NOTE: This presentation contains certain statements that are not historical facts and that constitute “forward-looking statements” within the meaning of the Private Securities Litigation Reform Act of 1995. Statements in this presentation addressing expectations, assumptions, beliefs, projections, future plans, strategies, and events, developments that we expect or anticipate will occur in the future, and future operating results or financial condition are forward-looking statements. Forward-looking statements in this presentation may include, but are not limited to, statements about projected future investment strategies, investment opportunities, future government or central bank actions and the impact of such actions, financial performance, dividends, leverage ratios, capital raising activities, share issuances and repurchases, the use or impact of NOL carryforwards, and interest rates. The words “will,” “believe,” “expect,” “forecast,” “anticipate,” “intend,” “estimate,” “assume,” “project,” “plan,” “continue,” and similar expressions also identify forward-looking statements. These forward-looking statements reflect our current beliefs, assumptions and expectations based on information currently available to us, and are applicable only as of the date of this presentation. Forward-looking statements are inherently subject to risks, uncertainties, and other factors, some of which cannot be predicted or quantified and any of which could cause the Company’s actual results and timing of certain events to differ materially from those projected in or contemplated by these forward-looking statements. Not all of these risks, uncertainties and other factors are known to us. New risks and uncertainties arise over time, and it is not possible to predict those risks or uncertainties or how they may affect us. The projections, assumptions, expectations or beliefs upon which the forward-looking statements are based can also change as a result of these risks and uncertainties or other factors. If such a risk, uncertainty, or other factor materializes in future periods, our business, financial condition, liquidity and results of operations may differ materially from those expressed or implied in our forward-looking statements. While it is not possible to identify all factors, some of the factors that may cause actual results to differ from historical results or from any results expressed or implied by our forward-looking statements, or that may cause our projections, assumptions, expectations or beliefs to change, include the risks and uncertainties referenced in our Annual Report on Form 10-K for the year ended December 31, 2014 and subsequent filings with the Securities and Exchange Commission, particularly those set forth under the caption “Risk Factors”.

3 Guiding Principles Our Core Values 3 •Generate dividends for shareholders •Manage leverage conservatively • Remain owner-operators • Maintain a culture of integrity and employ the highest ethical standards • Provide a strong risk management culture • Focus on preserving capital, while building long-term shareholder value

4 Market Snapshot

5 Delivering Total Return Source: SNL Financial (January 1, 2008 – April 30, 2015)

6 Generating Attractive Returns Source: KBW, Bloomberg, Bankrate.com DX Above Average Dividend Yield as of April 27, 2015 Long-Term Book Value & Dividends per Common Share

7 Recent Financial Highlights Financial Measures per Common Share (1) Adjusted Net Interest Spread (1) 1.96% • Adjusted net interest spread(1) is the difference between the effective yield earned on our investments and the effective borrowing cost(1) of financing our investments. • Effective borrowing cost(1) includes net periodic interest expense related to our interest rate swaps which we use to economically hedge interest rate risk arising from our repurchase agreement borrowings used to finance our investments. • Differences in comprehensive income and core net operating income(1) result primarily from changes in the fair value of MBS and derivative instruments which are included in comprehensive income but excluded from core net operating income. (1) Core net operating income per common share, effective borrowing cost, and adjusted net interest spread are non-GAAP financial measures and are reconciled to their corresponding GAAP measures on slides 31-32.

8 • Divergence in trajectory of growth, inflation and central bank actions across the globe • Factors could cause changes in the data that make the timing and pace of Federal Reserve actions still highly uncertain. • Low overall yields: Global yields continue to remain low given macroeconomic and policy factors in place today. • Spreads still tight across many risk assets: Global risk premiums have declined further since early 2014, as an increasing level of cash seeks higher returns. • Surprises are likely: An environment with divergent growth and central bank actions could create volatility and opportunity. • Federal Reserve in action: If U.S. economic data unfolds with no negative surprises, Federal Reserve will likely act to raise rates · Potential risk to U.S. economic performance due to exogenous factors · Flatter yield curve possible in the U.S. Macroeconomic and Policy Factors Influence the Investment Environment

9 Asset and Equity Allocations Quarterly Comparison $673.0 $217.2 $152.4 $105.9 $62.0 $217.2 $152.4 $62.0 RMBS CMBS RMBS RMBS (89% Agency) CMBS CMBS (64% Agency) CMBS IO CMBS IO CMBS IO CMBS IO (55% Agency) Net Other (1) Cash Loans (1) Net other for asset allocation includes fair value of derivative instruments, restricted cash, receivables, and other assets. Net other for equity allocation includes fair value of derivative instruments, restricted cash, receivables, payables, and other assets and liabilities. Asset Allocation Equity Allocation RMBS (96% Agency) CMBS (78% Agency) CMBS IO (56%Agency) • The majority of assets added during 1Q15 were multifamily Agency CMBS. Fair Value ($ in millions) Fair Value ($ in millions) • Though the bulk of our investments remain in Agency RMBS, the majority of our capital is invested in CMBS and CMBS IO.
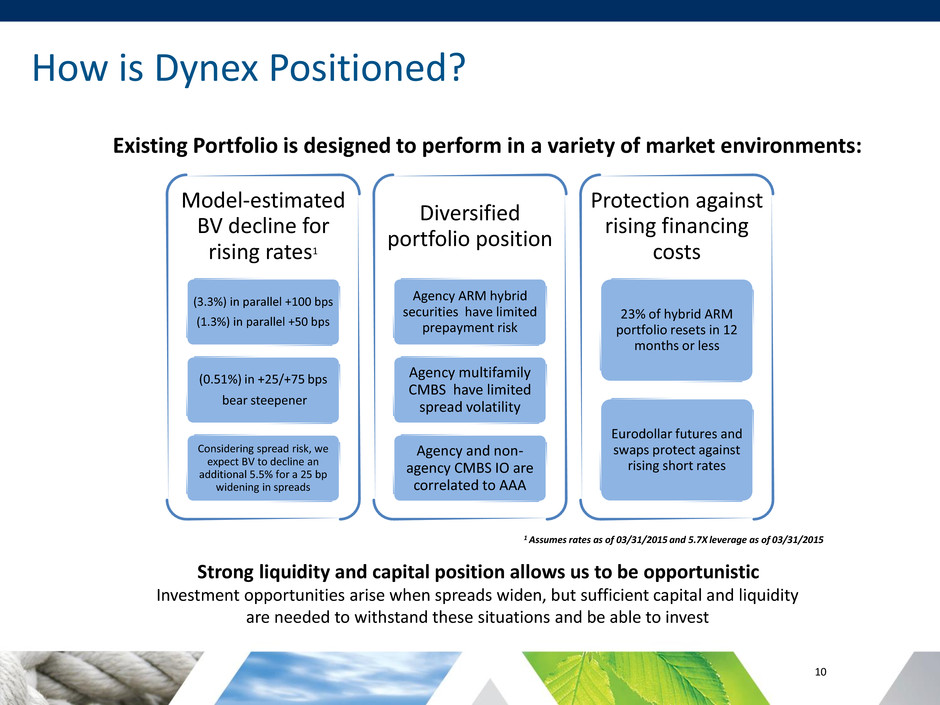
10 How is Dynex Positioned? Existing Portfolio is designed to perform in a variety of market environments: Model-estimated BV decline for rising rates1 (3.3%) in parallel +100 bps (1.3%) in parallel +50 bps (0.51%) in +25/+75 bps bear steepener Considering spread risk, we expect BV to decline an additional 5.5% for a 25 bp widening in spreads Diversified portfolio position Agency ARM hybrid securities have limited prepayment risk Agency multifamily CMBS have limited spread volatility Agency and non- agency CMBS IO are correlated to AAA Protection against rising financing costs 23% of hybrid ARM portfolio resets in 12 months or less Eurodollar futures and swaps protect against rising short rates 1 Assumes rates as of 03/31/2015 and 5.7X leverage as of 03/31/2015 Strong liquidity and capital position allows us to be opportunistic Investment opportunities arise when spreads widen, but sufficient capital and liquidity are needed to withstand these situations and be able to invest
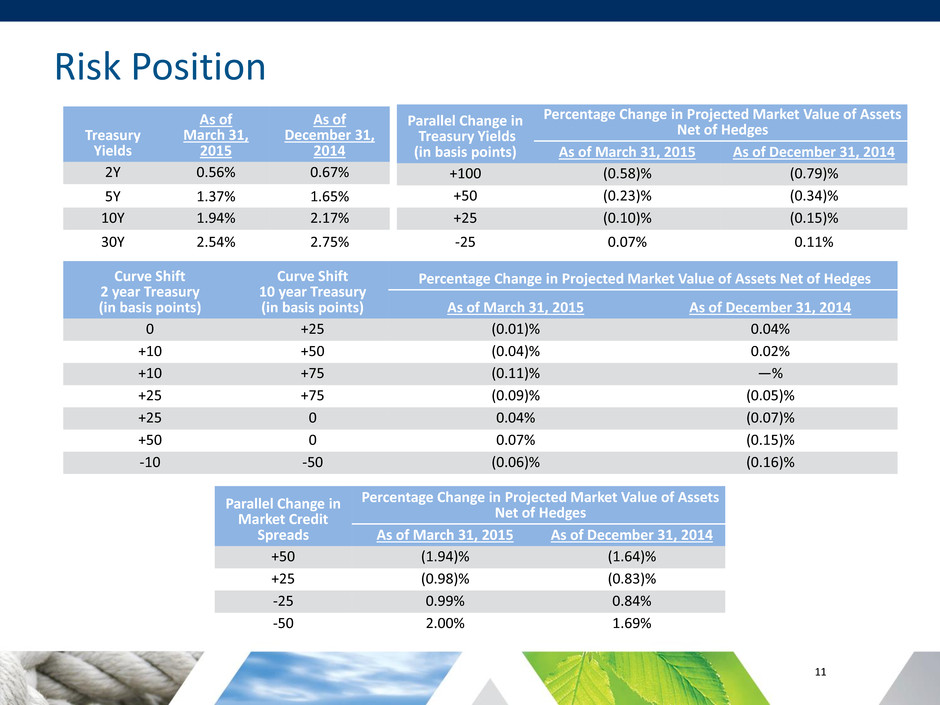
11 Risk Position Treasury Yields As of March 31, 2015 As of December 31, 2014 2Y 0.56% 0.67% 5Y 1.37% 1.65% 10Y 1.94% 2.17% 30Y 2.54% 2.75% Parallel Change in Treasury Yields (in basis points) Percentage Change in Projected Market Value of Assets Net of Hedges As of March 31, 2015 As of December 31, 2014 +100 (0.58)% (0.79)% +50 (0.23)% (0.34)% +25 (0.10)% (0.15)% -25 0.07% 0.11% Curve Shift 2 year Treasury (in basis points) Curve Shift 10 year Treasury (in basis points) Percentage Change in Projected Market Value of Assets Net of Hedges As of March 31, 2015 As of December 31, 2014 0 +25 (0.01)% 0.04% +10 +50 (0.04)% 0.02% +10 +75 (0.11)% —% +25 +75 (0.09)% (0.05)% +25 0 0.04% (0.07)% +50 0 0.07% (0.15)% -10 -50 (0.06)% (0.16)% Parallel Change in Market Credit Spreads Percentage Change in Projected Market Value of Assets Net of Hedges As of March 31, 2015 As of December 31, 2014 +50 (1.94)% (1.64)% +25 (0.98)% (0.83)% -25 0.99% 0.84% -50 2.00% 1.69%

12 Financing: Admission of DX Subsidiary to FHLB Membership of wholly-owned subsidiary has been accepted by the FHLB Indianapolis (FHLBI) on May 19, 2015 Most Dynex product types can be funded with FHLBI financing Economics will depend on collateral financed Potential Significant Benefits: ‒ Access to reliable, low-cost, same day funding ‒ Enhances liquidity management ‒ Diversifies counterparty risk ‒ Increases financial flexibility ‒ Provides hedging flexibility

13 Financing: Repo vs. FHLBI Funding Repo FHLBI Type of Borrowings Secured Secured Collateral types Treasuries, Agencies, MBS, and CMBS Treasuries, Agencies, MBS, CMBS, and whole loans Stock purchase or equity stake? No Yes, stock purchase is required for membership and stock must be maintained for activity Collateral Substitution No, loan is tied to specific collateral Yes, loan is based on lendable value of a pool of collateral Availability and rates sensitive to borrower credit? Yes No Terms Generally fixed rate bullets less than 1 year Fixed rates, floating rates, amortizing structures, and embedded options are available out to 30 years Rates Most attractive rates <90 days Most attractive rates >90 days Rates differ based on collateral types? Yes No Availability during the 2007-2009 financial crisis? Volume peaked at $2.8 trillion in early 2008 and fell to $1.7 trillion during the crisis Volumes increased to a record $1.1 trillion in late 2008 to accommodate member liquidity needs Source: FHLB Indianapolis

14 Dynex Strategy Going Forward • Expect to make opportunistic investments and continue to grow balance sheet · Investment opportunities continue to be focused on CMBS • Agency multifamily CMBS, Agency CMBS IO, non-Agency CMBS IO, single family rental · Selective RMBS investing • Non-performing loan and re-performing loan securitizations • Agency hybrid ARMs · Opportunistically buy back shares of common stock if discount to book widens above our threshold • Maintain disciplined focus on risk position · Focus on liquidity and capital · Maintain flexibility to react to dynamic environment
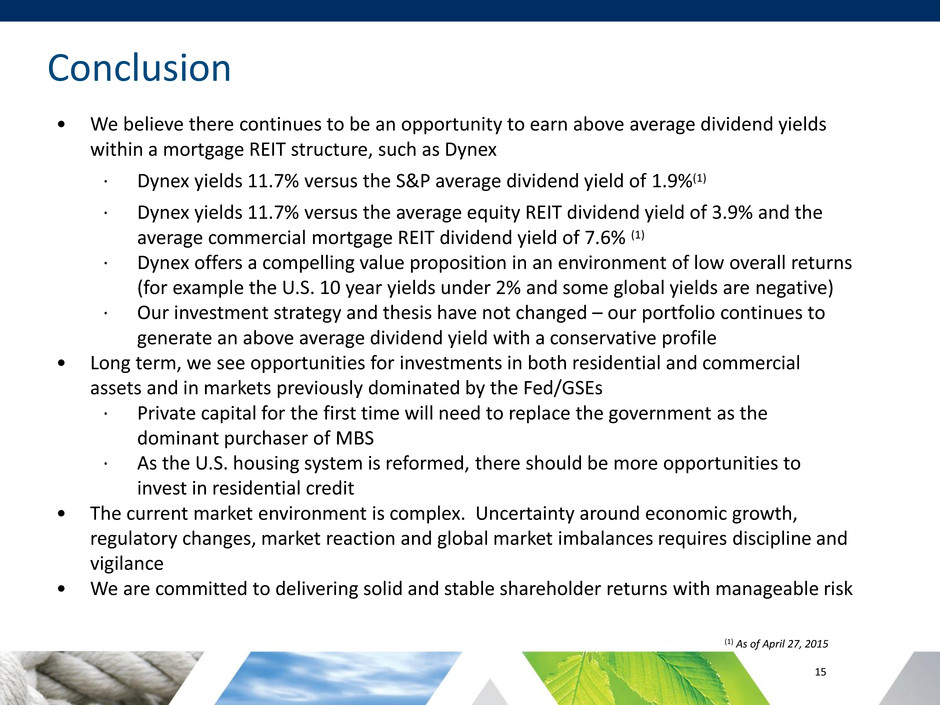
15 • We believe there continues to be an opportunity to earn above average dividend yields within a mortgage REIT structure, such as Dynex · Dynex yields 11.7% versus the S&P average dividend yield of 1.9%(1) · Dynex yields 11.7% versus the average equity REIT dividend yield of 3.9% and the average commercial mortgage REIT dividend yield of 7.6% (1) · Dynex offers a compelling value proposition in an environment of low overall returns (for example the U.S. 10 year yields under 2% and some global yields are negative) · Our investment strategy and thesis have not changed – our portfolio continues to generate an above average dividend yield with a conservative profile • Long term, we see opportunities for investments in both residential and commercial assets and in markets previously dominated by the Fed/GSEs · Private capital for the first time will need to replace the government as the dominant purchaser of MBS · As the U.S. housing system is reformed, there should be more opportunities to invest in residential credit • The current market environment is complex. Uncertainty around economic growth, regulatory changes, market reaction and global market imbalances requires discipline and vigilance • We are committed to delivering solid and stable shareholder returns with manageable risk Conclusion (1) As of April 27, 2015

16 Solid Track-Record Source: SNL Financial (January 1, 2004 – April 30, 2015)

17 APPENDIX

18 Portfolio Update* (as of March 31, 2015) Credit Quality Portfolio Expected Maturity/Reset Distribution Net Premium by Asset Type * AFS investments only, excludes loans held for investment. Agency MBS are considered AAA-rated for purposes of this chart. 12.7% 15.0% 15.1% 14.5% 12.5% 30.1% $742.0 $104.3

19 Financing Details • Our weighted average contractual maturity was 116 days at March 31, 2015 compared to 144 days at December 31, 2014. • Our repurchase agreement balance was $3.2 billion at March 31, 2015 with 20 counterparties compared to $3.0 billion with 20 counterparties at December 31, 2014. We currently have repurchase agreements available to us with 33 counterparties. Repurchase Agreement and Effective Borrowing Cost (1) (for the quarterly periods indicated) Repurchase Agreement Amounts by Original Term to Maturity (as of March 31, 2015) (1) Reconciliations for non-GAAP measures are presented on slides 31-32.
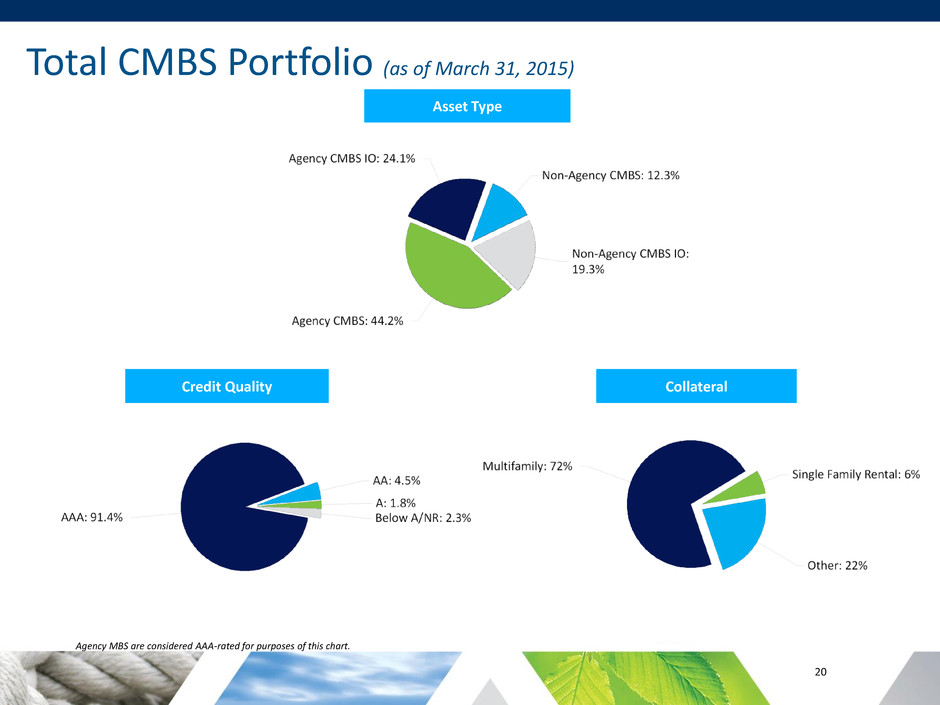
20 Total CMBS Portfolio (as of March 31, 2015) Asset Type Agency MBS are considered AAA-rated for purposes of this chart. Credit Quality Collateral Asset Type
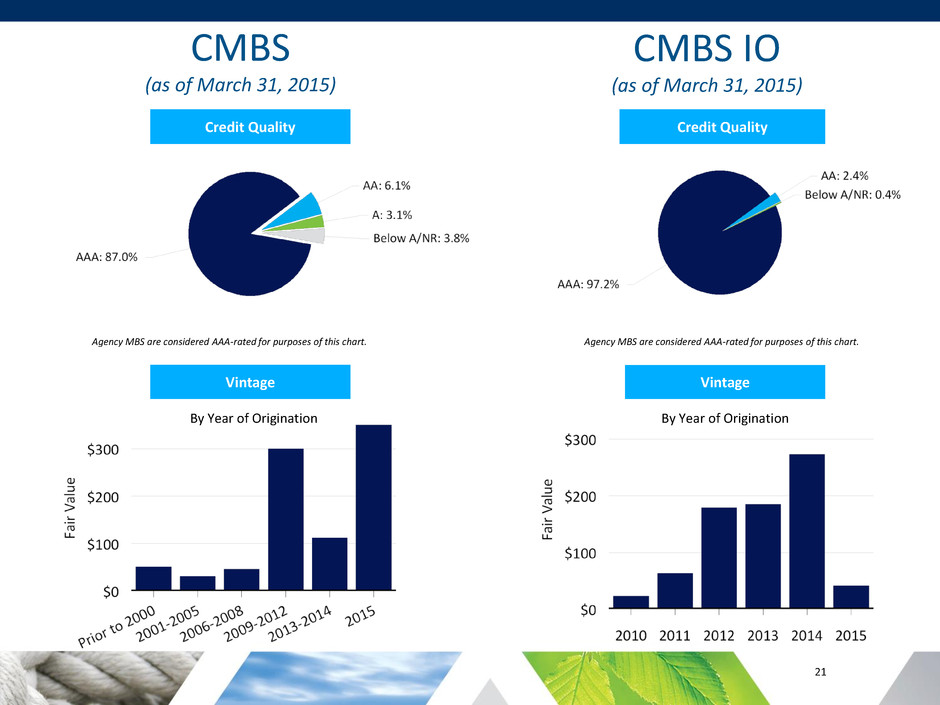
21 CMBS (as of March 31, 2015) Vintage (by year of origination) Asset Type Credit Quality Vintage By Year of Origination CMBS IO (as of March 31, 2015) Credit Quality Vintage By Year of Origination Agency MBS are considered AAA-rated for purposes of this chart. Agency MBS are considered AAA-rated for purposes of this chart.

22 Asset Type ($ in millions) RMBS Portfolio (as of March 31, 2015) Credit Quality Months to Maturity/Reset For ARMs/Hybrids 5% 9% 50% 16% 6% 15% Weighted Average Loan Age 22.5% 17.5% 16.9% 16.6% 26.5%
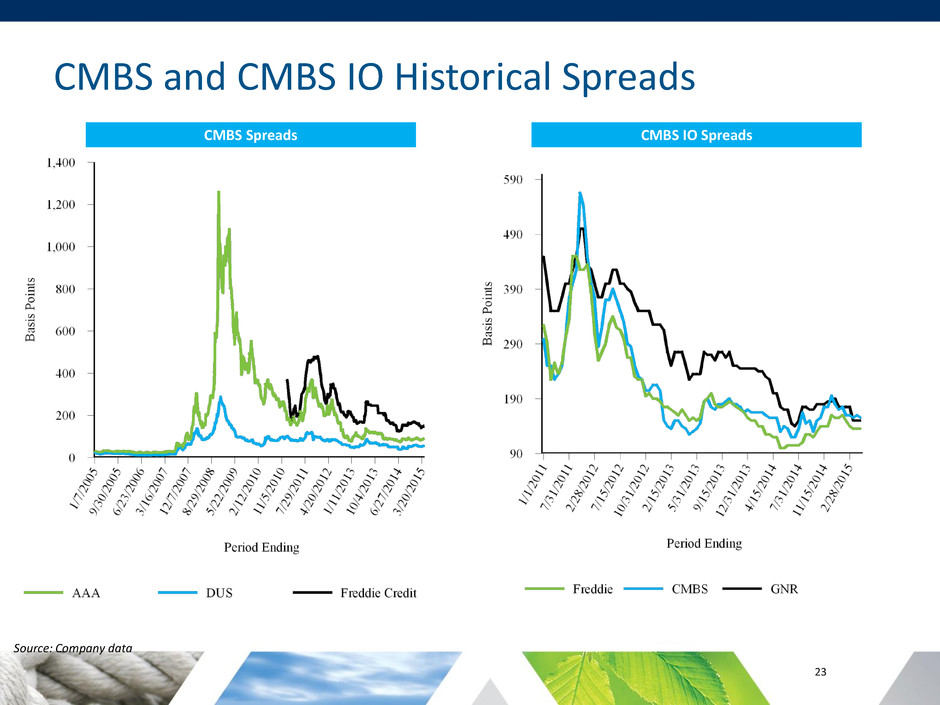
23 CMBS and CMBS IO Historical Spreads Source: Company data CMBS IO Spreads CMBS Spreads
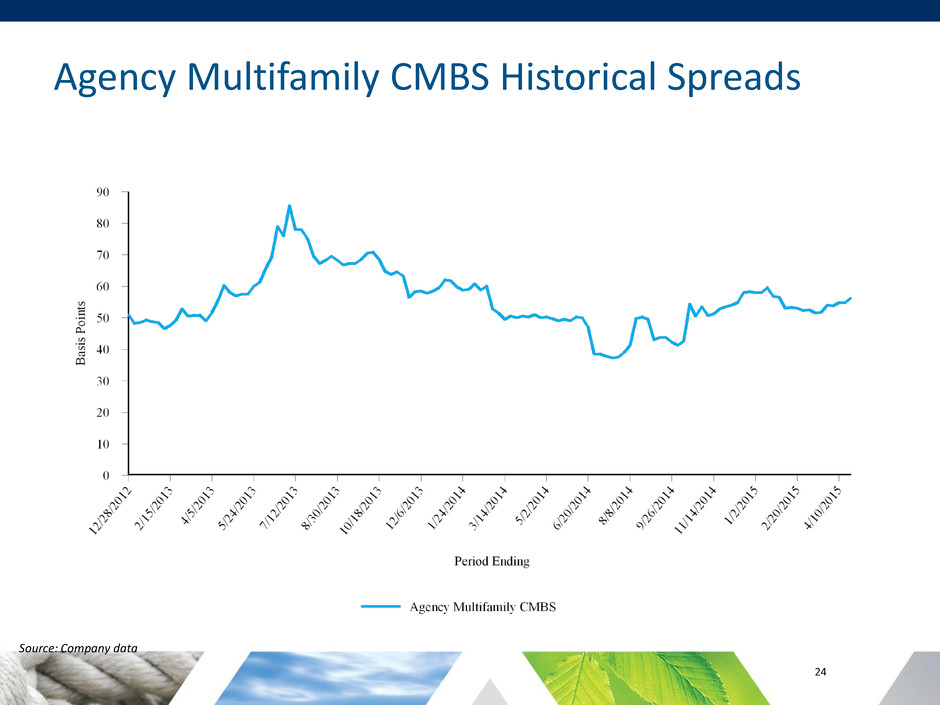
24 Agency Multifamily CMBS Historical Spreads Source: Company data

25 Drivers of Book Value Agency RMBS Historical Spreads Source: Company data

26 Drivers of Book Value Spread Risk • An asset’s “spread” is the market premium above a benchmark rate that reflects the relative riskiness of the asset versus the benchmark. • Spread risk is the uncertainty in pricing resulting from the expansion and contraction of the risk premium over the benchmark. • Spreads (and therefore prices) are impacted by the following factors: • Fundamentals: Probability of default, cash flow uncertainty • Technicals: Supply and demand for various assets • Psychology: Reflects the risk appetite of the market and the perceived riskiness of specific assets • Most mortgage REIT business models are inherently exposed to spread risk. At Dynex, we focus on all three aspects of spread risk. However, changes in pricing due to technicals and psychology are difficult to predict. We manage spread risk over the long-term through portfolio construction.

27 Hedging Details (Quarterly Comparison) As of March 31, 2015 As of December 31, 2014
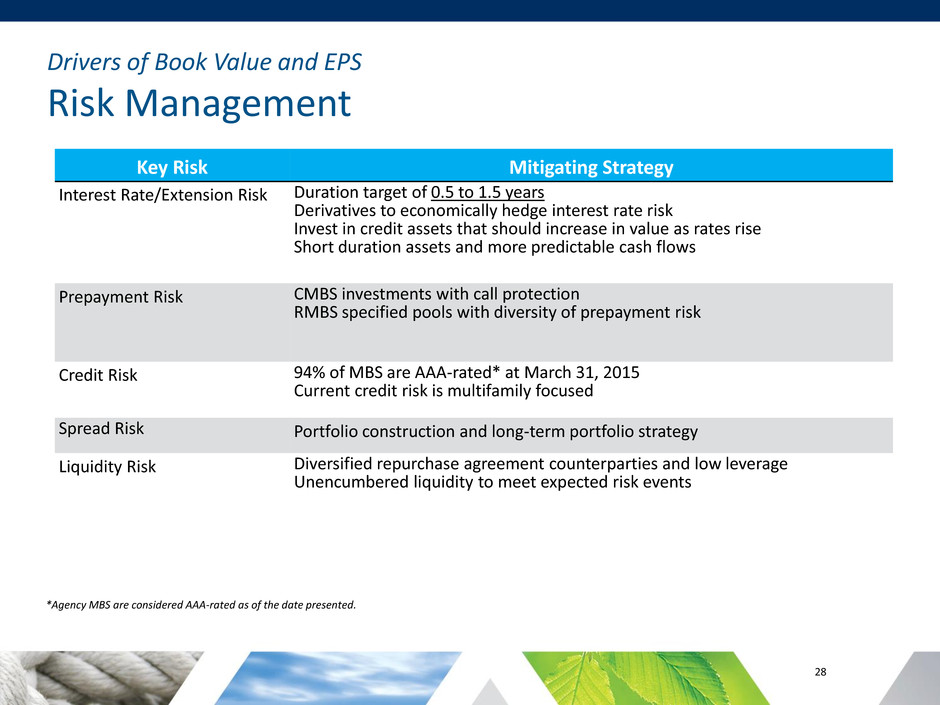
28 Drivers of Book Value and EPS Risk Management Key Risk Mitigating Strategy Interest Rate/Extension Risk Duration target of 0.5 to 1.5 years Derivatives to economically hedge interest rate risk Invest in credit assets that should increase in value as rates rise Short duration assets and more predictable cash flows Prepayment Risk CMBS investments with call protection RMBS specified pools with diversity of prepayment risk Credit Risk 94% of MBS are AAA-rated* at March 31, 2015 Current credit risk is multifamily focused Spread Risk Portfolio construction and long-term portfolio strategy Liquidity Risk Diversified repurchase agreement counterparties and low leverage Unencumbered liquidity to meet expected risk events *Agency MBS are considered AAA-rated as of the date presented.

29 Drivers of EPS Investment Premium Allocation (as of end of period)
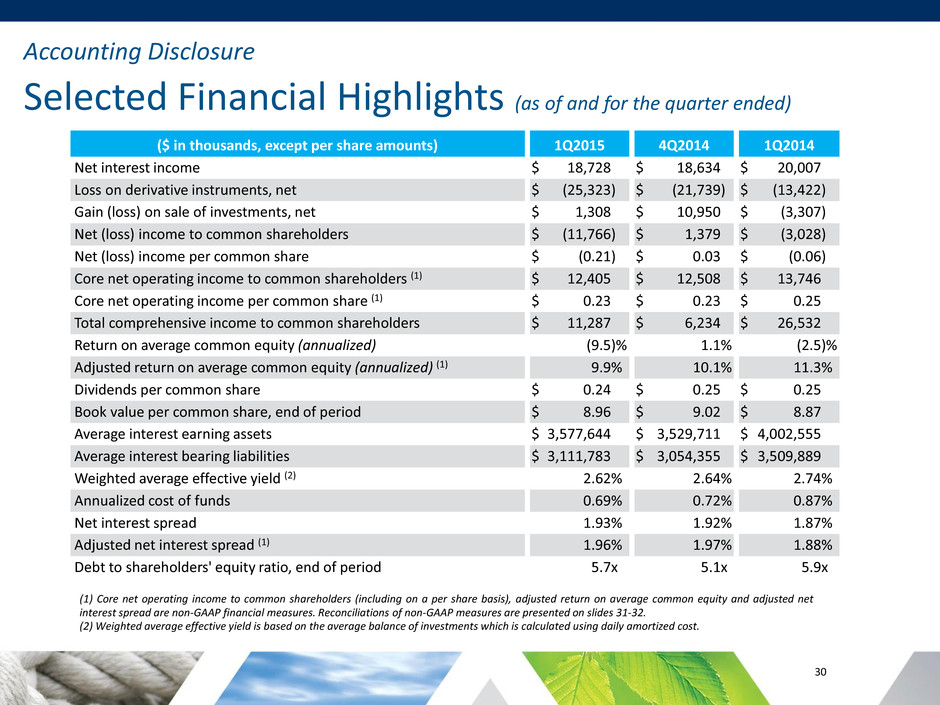
30 Accounting Disclosure Selected Financial Highlights (as of and for the quarter ended) (1) Core net operating income to common shareholders (including on a per share basis), adjusted return on average common equity and adjusted net interest spread are non-GAAP financial measures. Reconciliations of non-GAAP measures are presented on slides 31-32. (2) Weighted average effective yield is based on the average balance of investments which is calculated using daily amortized cost. ($ in thousands, except per share amounts) 1Q2015 4Q2014 1Q2014 Net interest income $ 18,728 $ 18,634 $ 20,007 Loss on derivative instruments, net $ (25,323 ) $ (21,739 ) $ (13,422 ) Gain (loss) on sale of investments, net $ 1,308 $ 10,950 $ (3,307 ) Net (loss) income to common shareholders $ (11,766 ) $ 1,379 $ (3,028 ) Net (loss) income per common share $ (0.21 ) $ 0.03 $ (0.06 ) Core net operating income to common shareholders (1) $ 12,405 $ 12,508 $ 13,746 Core net operating income per common share (1) $ 0.23 $ 0.23 $ 0.25 Total comprehensive income to common shareholders $ 11,287 $ 6,234 $ 26,532 Return on average common equity (annualized) (9.5 )% 1.1 % (2.5 )% Adjusted return on average common equity (annualized) (1) 9.9 % 10.1 % 11.3 % Dividends per common share $ 0.24 $ 0.25 $ 0.25 Book value per common share, end of period $ 8.96 $ 9.02 $ 8.87 Average interest earning assets $ 3,577,644 $ 3,529,711 $ 4,002,555 Average interest bearing liabilities $ 3,111,783 $ 3,054,355 $ 3,509,889 Weighted average effective yield (2) 2.62 % 2.64 % 2.74 % Annualized cost of funds 0.69 % 0.72 % 0.87 % Net interest spread 1.93 % 1.92 % 1.87 % Adjusted net interest spread (1) 1.96 % 1.97 % 1.88 % Debt to shareholders' equity ratio, end of period 5.7 x 5.1 x 5.9 x

31 ($ in thousands except per share data) Quarter Ended 3/31/2015 12/31/2014 9/30/2014 6/30/2014 3/31/2014 Net (loss) income to common shareholders ($11,766 ) $1,379 $28,572 ($8,293 ) ($3,028 ) Adjustments: Amortization of de-designated cash flow hedges (1) 1,057 1,449 1,442 1,608 2,288 Change in fair value on derivatives instruments, net 24,461 20,675 (7,113 ) 20,402 11,211 (Gain) loss on sale of investments, net (1,308 ) (10,950 ) (9,057 ) 477 3,307 Fair value adjustments, net (39 ) (45 ) (42 ) (88 ) (32 ) Core net operating income to common shareholders $12,405 $12,508 $13,802 $14,106 $13,746 Core net operating income per share $0.23 $0.23 $0.26 $0.25 $0.29 ROAE based on annualized GAAP net (loss) income to common shareholders (9.5 )% 1.1 % 22.7 % (6.7 )% (2.5 )% Adjustments: Amortization of de-designated cash flow hedges (1) 0.8 % 1.2 % 1.1 % 1.3 % 1.9 % Change in fair value on derivatives instruments, net 19.7 % 16.5 % (5.6 )% 16.4 % 9.2 % (Gain) loss on sale of investments, net (1.1 )% (8.7 )% (7.2 )% 0.4 % 2.7 % Fair value adjustments, net — % — % — % (0.1 )% — % Adjusted ROAE, based on annualized core net operating income 9.9 % 10.1 % 11.0 % 11.3 % 11.3 % Average common equity during the period $497,626 $501,553 $503,861 $497,864 $485,044 (1) Amount recorded as a portion of "interest expense" in accordance with GAAP related to the amortization of the balance remaining in accumulated other comprehensive loss as of June 30, 2013 as a result of the Company's discontinuation of cash flow hedge accounting. Accounting Disclosure Reconciliation of GAAP Measures to Non-GAAP Measures

32 Accounting Disclosure Reconciliation of GAAP Measures to Non-GAAP Measures (1) Rates shown are based on annualized interest expense amounts divided by average interest bearing liabilities. Recalculation of annualized cost of funds using total interest expense shown in the table may not be possible because certain expense items use a 360-day year for the calculation while others use actual number of days in the year. (2) Amount recorded as a portion of "interest expense" in accordance with GAAP related to the amortization of the balance remaining in accumulated other comprehensive loss as of June 30, 2013 as a result of the Company's discontinuation of hedge accounting. Quarter Ended 3/31/2015 12/31/2014 9/30/2014 6/30/2014 3/31/2014 GAAP interest income/ annualized yield $24,099 2.62 % $24,286 2.64 % $26,000 2.73 % $27,718 2.79 % $27,640 2.74 % GAAP interest expense/ annualized cost of funds (1) 5,371 0.69 % 5,652 0.72 % 6,058 0.70 % 6,572 0.75 % 7,633 0.87 % GAAP net interest income/spread $18,728 1.93 % $18,634 1.92 % $19,942 2.03 % $21,146 2.04 % $20,007 1.87 % GAAP interest expense/ annualized cost of funds (1) $5,371 0.69 % $5,652 0.72 % $6,058 0.70 % $6,572 0.75 % $7,633 0.87 % Amortization of de-designated cash flow hedges (2) (1,057 ) (0.14 )% (1,449 ) (0.19 )% (1,442 ) (0.17 )% (1,608 ) (0.18 )% (2,288 ) (0.26 )% Net periodic interest costs on derivatives 862 0.11 % 1,064 0.14 % 2,271 0.27 % 2,672 0.30 % 2,211 0.25 % Effective borrowing costs $5,176 0.66 % $5,267 0.67 % $6,887 0.80 % $7,636 0.87 % $7,556 0.86 % Adjusted net interest income/spread $18,923 1.96 % $19,019 1.97 % $19,113 1.93 % $20,082 1.92 % $20,084 1.88 % ($ in thousands)
