Attached files
UNITED STATES
SECURITIES AND EXCHANGE COMMISSION
Washington, D.C. 20549
FORM 10-K
(Mark One)
| þ |
ANNUAL REPORT PURSUANT TO SECTION 13 OR 15(d) OF THE SECURITIES EXCHANGE ACT OF 1934
|
For the fiscal year ended December 31, 2010
or
| o |
TRANSITION REPORT PURSUANT TO SECTION 13 OR 15(d) OF THE SECURITIES EXCHANGE ACT OF 1934
|
For the transition period from _______________ to _______________
Commission file number 1-9819
DYNEX CAPITAL, INC.
(Exact name of registrant as specified in its charter)
|
Virginia
|
52-1549373
|
|
(State or other jurisdiction of
|
(I.R.S. Employer
|
|
incorporation or organization)
|
Identification No.)
|
|
4991 Lake Brook Drive, Suite 100, Glen Allen, Virginia
|
23060
|
|
(Address of principal executive offices)
|
(Zip Code)
|
|
(804) 217-5800
(Registrant’s telephone number, including area code)
|
|
|
Securities registered pursuant to Section 12(b) of the Act:
|
|
|
Title of each class
|
Name of each exchange on which registered
|
|
Common Stock, $.01 par value
|
New York Stock Exchange
|
|
Securities registered pursuant to Section 12(g) of the Act: None
|
|
Indicate by check mark if the registrant is a well-known seasoned issuer, as defined in Rule 405 of the Securities Act.
Yes o No þ
Indicate by check mark if the registrant is not required to file reports pursuant to Section 13 or 15(d) of the Act.
Yes o No þ
Indicate by check mark whether the registrant (1) has filed all reports required to be filed by Section 13 or 15(d) of the Securities Exchange Act of 1934 during the preceding 12 months (or for such shorter period that the registrant was required to file such reports), and (2) has been subject to such filing requirements for the past 90 days.
Yes þ No o
Indicate by check mark whether the registrant has submitted electronically and posted on its corporate Web site, if any, every Interactive Data File required to be submitted and posted pursuant to Rule 405 of Regulation S-T (§232.405 of this chapter) during the preceding 12 months (or for such shorter period that the registrant was required to submit and post such files).
Yes o No o
Indicate by check mark if disclosure of delinquent filers pursuant to Item 405 of Regulation S-K (§229.405 of this chapter) is not contained herein, and will not be contained, to the best of registrant’s knowledge, in definitive proxy or information statements incorporated by reference in Part III of this Form 10-K or any amendment to this Form 10-K.o
Indicate by check mark whether the registrant is a large accelerated filer, an accelerated filer, a non-accelerated filer, or a smaller reporting company. See the definitions of “large accelerated filer,” “accelerated filer” and “smaller reporting company” in Rule 12b-2 of the Exchange Act.
|
Large accelerated filer
|
o
|
Accelerated filer
|
þ
|
|
Non-accelerated filer
|
o (Do not check if a smaller reporting company)
|
Smaller reporting company
|
o
|
Indicate by check mark whether the registrant is a shell company (as defined in Rule 12b-2 of the Act).
Yes o No þ
As of June 30, 2010, the aggregate market value of the voting stock held by non-affiliates of the registrant was approximately $120,354,899 based on the closing sales price on the New York Stock Exchange of $9.23.
Common stock outstanding as of March 14, 2011 was 40,265,134 shares.
DOCUMENTS INCORPORATED BY REFERENCE
Portions of the Definitive Proxy Statement for the registrant’s 2011 annual meeting of shareholders, expected to be filed pursuant to Regulation 14A within 120 days from December 31, 2010, are incorporated by reference into Part III.
TABLE OF CONTENTS
|
Page Number
|
|||
|
PART I.
|
|||
|
Item 1.
|
Business
|
1
|
|
|
Item 1A.
|
Risk Factors
|
6
|
|
|
Item 1B.
|
Unresolved Staff Comments
|
23
|
|
|
Item 2.
|
Properties
|
23
|
|
|
Item 3.
|
Legal Proceedings
|
23
|
|
|
Item 4.
|
Reserved
|
24
|
|
|
PART II.
|
|||
|
Item 5.
|
Market for Registrant’s Common Equity, Related Stockholder Matters and Issuer Purchases of Equity Securities
|
25
|
|
|
Item 6.
|
Selected Financial Data
|
27
|
|
|
Item 7.
|
Management’s Discussion and Analysis of Financial Condition and Results of Operations
|
28
|
|
|
Item 7A.
|
Quantitative and Qualitative Disclosures About Market Risk
|
48
|
|
|
Item 8.
|
Financial Statements and Supplementary Data
|
54
|
|
|
Item 9.
|
Changes in and Disagreements with Accountants on Accounting and Financial Disclosure
|
54
|
|
|
Item 9A.
|
Controls and Procedures
|
54
|
|
|
Item 9B.
|
Other Information
|
54
|
|
|
PART III.
|
|||
|
Item 10.
|
Directors, Executive Officers and Corporate Governance
|
55
|
|
|
Item 11.
|
Executive Compensation
|
55
|
|
|
Item 12.
|
Security Ownership of Certain Beneficial Owners and Management and Related Stockholder Matters
|
55
|
|
|
Item 13.
|
Certain Relationships and Related Transactions, and Director Independence
|
55
|
|
|
Item 14.
|
Principal Accountant Fees and Services
|
56
|
|
|
PART IV.
|
|||
|
Item 15.
|
Exhibits, Financial Statement Schedules
|
57
|
|
|
SIGNATURES
|
60
|
||
i
CAUTIONARY STATEMENT – This Annual Report on Form 10-K may contain “forward-looking” statements within the meaning of Section 27A of the Securities Act of 1933, as amended (or “1933 Act”), and Section 21E of the Securities Exchange Act of 1934, as amended (or “Exchange Act”). We caution that any such forward-looking statements made by us are not guarantees of future performance, and actual results may differ materially from those expressed or implied in such forward-looking statements. Some of the factors that could cause actual results to differ materially from estimates expressed or implied in our forward-looking statements are set forth in this Annual Report on Form 10-K for the year ended December 31, 2010. See Item 1A. “Risk Factors” as well as “Forward-Looking Statements” set forth in Item 7. “Management’s Discussion and Analysis of Financial Condition and Results of Operations” of this Annual Report on Form 10-K.
In this Annual Report on Form 10-K, we refer to Dynex Capital, Inc. and its subsidiaries as “the Company,” “we,” “us,” or “our,” unless we specifically state otherwise or the context indicates otherwise.
|
PART I
|
|
ITEM 1.
|
BUSINESS
|
We are an internally-managed real estate investment trust, or REIT, which invests in mortgage assets on a leveraged basis. Our objective is to provide attractive risk-adjusted returns to our shareholders over the long term that are reflective of a leveraged, high quality fixed income portfolio with a focus on capital preservation. We seek to provide returns to our shareholders through regular quarterly dividends and through capital appreciation.
We were formed in 1987 and commenced operations in 1988. Beginning with our inception through 2000, our operations largely consisted of originating and securitizing various types of loans, principally single-family and commercial mortgage loans and manufactured housing loans. Since 2000, we have been an investor in MBS (“MBS”), and we are no longer originating or securitizing mortgage loans.
Our primary source of income is net interest income, which is the excess of the interest income earned on our investments over the cost of financing these investments. Our investment strategy as approved by our Board of Directors is a hybrid-investment strategy that targets higher credit quality, shorter duration investments in Agency MBS and non-Agency MBS. Investments considered to be of higher credit quality have less or limited exposure to loss of principal while investments which have shorter durations have less exposure to changes in interest rates.
Agency MBS consist of residential MBS (“RMBS”) and commercial MBS (“CMBS”), which come with a guaranty of payment by the U.S. government or a U.S. government-sponsored entity such as Fannie Mae and Freddie Mac. Non-Agency MBS (also consisting of RMBS and CMBS) have no such guaranty of payment. We currently target an overall investment portfolio composition of 50%-70% in Agency MBS with the balance in non-Agency MBS and securitized mortgage loans. Securitized mortgage loans are loans which were originated and securitized by us during the 1990s.
Agency MBS. Our Agency RMBS investments consist predominantly of variable rate securities collateralized by adjustable-rate mortgage loans (“ARMs”) and hybrid ARMs. ARMs have interest rates that generally will adjust at least annually to an increment over a specified interest rate index, such as the London Interbank Offered Rate (“LIBOR”). Hybrid ARMs are adjustable-rate mortgage loans which have a fixed rate of interest for a specified period (typically three to ten years) and which then reset their interest rates at least annually to an increment over a specified interest rate index identical to ARMs. Hybrid ARMs within twelve months of the end of their fixed rate periods are considered ARMs. Mortgage loans underlying ARMs and hybrid ARMs will typically have initial, interim and lifetime caps on interest rate adjustments (interest rate caps), limiting the amount that the rates on these loans may reset in any given period. Our investment policy allows us to invest in fixed-rate Agency RMBS, such as RMBS collateralized by 15, 20, and 30-year mortgage loans, though we have not invested in these securities in recent years.
Our Agency CMBS are comprised of fixed-rate securities issued primarily by Fannie Mae. These securities are collateralized by first mortgage loans on multifamily properties that are usually either locked out of prepayment options or have yield maintenance provisions which provide the Company protection against prepayment of the investments. The prepayment protection is typically for a period of 9.5 years from the origination date of the underlying loan.
1
Non-Agency MBS. Non-Agency MBS consist of CMBS collateralized by fixed rate commercial and multifamily first mortgage loans as well as RMBS collateralized by fixed rate and variable rate single-family first mortgage loans. Most of our investments in non-Agency MBS are in investment-grade rated tranches (i.e., rated at least ‘BBB’ by one of the national recognized statistical ratings organizations).
Other Types of Investments. We have investments in securitized mortgage loans which consist of loans we originated or purchased principally from the period from 1994 through 1998. We have financed these loans through the issuance of non-recourse bonds pursuant to indentures through wholly-owned limited purpose finance subsidiaries. Payments received on securitized mortgage loans and reinvestment income earned thereon is used to make payments on the securitization financing bonds.
Operating Policies and Restrictions
Our Board of Directors has approved an Investment and Risk Management Policy which set forth investment and risk limitations for the Company. This policy is reviewed and changed as necessary on an annual basis. We also manage our operations and investments to comply with various REIT limitations (as discussed further below in “Federal Income Tax Considerations”) and to avoid qualifying as an investment company as such term is defined in the Investment Company Act of 1940.
Currently, our Investment and Risk Management Policy permits the investment of new capital in Agency MBS and high-quality non-Agency MBS. In implementing this Policy with respect to non-Agency MBS, we generally limit our purchases to MBS which are rated investment-grade by at least one nationally recognized statistical ratings organization. We also conduct our own independent evaluation of the credit risk on any non-Agency MBS, such that we do not rely solely on the security’s credit rating. Since 2008 we have purchased predominantly investments rated ‘A’ or better. In the year ended December 31, 2010, we have added $183.0 million and $11.9 million in non-Agency CMBS and RMBS, respectively, that are rated ‘A’ or higher as of December 31, 2010. We added these investments as part of our overall investment strategy of maintaining our targeted Agency versus non-Agency investment mix. The Company will continue to add to its investment positions in non-Agency MBS as part of this investment strategy as it identifies suitable investments with attractive risk-adjusted returns.
The Policy also currently limits the overall leverage of the Company to six times our shareholders’ equity capital and up to ten times our equity capital invested in Agency and non-Agency MBS. Finally, the Policy provides for limitations on our earnings at risk and our shareholders’ equity at risk due to changes in interest rates, prepayment rates, investment prices and spreads.
Investment Philosophy and Strategy
Our investment philosophy is based on a top-down approach and forms the foundation of our investment strategy. Our focus is always on the expected risk-adjusted outcome of any investment which, given our use of leverage, must include the terms of financing and the expected liquidity of the investment. Key points of our investment philosophy and strategy include the following:
|
·
|
understanding macroeconomic conditions including the current state of the U.S. and global economies, the regulatory environment, competition for assets, and the availability of financing;
|
|
·
|
sector analysis including understanding absolute returns, relative returns and risk-adjusted returns;
|
|
·
|
security and financing analyses including sensitivity analysis on credit, interest rate volatility, and market value risk; and
|
|
·
|
managing performance and portfolio risks, including interest rate, prepayment, credit, and liquidity.
|
In executing our investment strategy, we seek to balance the various risks of owning mortgage assets, such as interest rate, credit, prepayment, and liquidity risks, with the earnings opportunity on the investment. We believe our strategy of investing in Agency and non-Agency mortgage assets provides superior diversification of these risks across our investment portfolio and therefore provides ample opportunities to generate attractive risk-adjusted returns while preserving our shareholders’ capital.
2
The performance of our investment portfolio will depend on many factors including interest rates, trends of interest rates, the steepness of interest rate curves, prepayment rates on our investments, competition for investments, economic conditions and their impact on the credit performance of our investments, and actions taken by the U.S. government, including the U.S. Federal Reserve and/or the Treasury (the “Treasury”). In addition, our business model may be impacted by other factors such as the state of the overall credit markets, which could impact the availability and costs of financing. See “Factors that Affect Our Results of Operations and Financial Condition” in Item 7 of this Annual Report on Form 10-K for further discussion.
Financing and Hedging Strategy
We finance our investments through a combination of repurchase agreements and non-recourse collateralized financing such as securitization financing and financing provided by the Federal Reserve Bank of New York under its Term Asset-Backed Securities Loan Facility (“TALF” financing).
Repurchase Agreements. Repurchase agreement financing is uncommitted short-term financing in which we pledge our MBS as collateral to secure loans made by the repurchase agreement counterparty. Repurchase agreements generally have terms of 30-90 days, though in some instances longer terms may be available. The amount borrowed under a repurchase agreement is usually limited by the lender to a percentage of the estimated market value of the pledged collateral, which is currently up to 95% of the estimated market value for Agency MBS and up to 90% for non-Agency MBS. The difference between the market value of the pledged MBS collateral and the amount of the repurchase agreement is the amount of equity we have in the position and is intended to provide the lender some protection against fluctuations of value in the collateral and/or the failure by us to repay the borrowing.
Repurchase agreements carry a rate of interest which is usually based on a spread to LIBOR. Interest rates are fixed for the term of the agreement. If the fair value of the MBS pledged as collateral declines, lenders may require that we pledge additional assets by initiating a margin call. Our pledged collateral fluctuates in value primarily due to principal payments and changes in market interest rates and spreads, prevailing market yields, actual or anticipated prepayment speeds and other market conditions. Lenders may also initiate margin calls during periods of market stress. If we fail to meet any margin call, our lenders have the right to terminate the repurchase agreement and sell the collateral pledged. We will set aside securities and/or cash in order to lower our overall debt to equity ratio and to maintain financial flexibility to meet margin calls from our lenders.
Repurchase agreement financing is provided principally by major financial institutions and major broker-dealers. A significant source of liquidity for the repurchase agreement market is money market funds which provide collateral-based lending to the financial institutions and broker-dealer community that, in turn, is provided to the repurchase agreement market. In order to reduce our exposure to counterparty-related risk, we generally seek to diversify our exposure by entering into repurchase agreements with multiple lenders. We currently have repurchase agreements with 20 lenders, 14 of which we have borrowings outstanding as of December 31, 2010.
Securitization and TALF Financing. We have utilized securitization and TALF financing to finance securitized mortgage loans and certain MBS. As noted above, securitization financing is term financing collateralized by securitized mortgage loans and is non-recourse to us. Each series of securitization financing may consist of various classes of bonds at either fixed or variable rates of interest and having varying repayment terms. Payments received on securitized mortgage loans and reinvestment income earned thereon is used to make payments on the securitization financing bonds. TALF financing was issued by the Federal Reserve Bank of New York and is non-recourse to us. It provides for a fixed rate of interest to finance non-Agency CMBS for a period of up to 3 years.
Hedging Strategy. Our hedging strategy is designed to reduce the impact on our income and shareholders’ equity caused by the adverse effects of changes in interest rates. Generally in a period of rising rates our net income may be negatively impacted from our borrowing costs increasing faster than income on our assets, and our shareholders’ equity may decline as a result of declining market values of our MBS. In hedging the risk to changes in interest rates, we will principally utilize interest rate swap agreements, but may also utilize interest rate cap or floor agreements, futures contracts, put and call options on securities or securities underlying futures contracts, or forward rate agreements.
3
As of December 31, 2010 we have only interest rate swap agreements outstanding. Typically in an interest rate swap transaction, we will pay an agreed upon fixed rate of interest determined at the time of entering into the agreement for a period typically between two and five years while receiving interest based on a floating rate such as LIBOR. We intend to comply with REIT and tax limitations on our hedging instruments and also intend to limit our use of hedging instruments to only those described above. We also intend to enter into hedging transactions only with counterparties that we believe have a strong credit rating to help mitigate the risk of counterparty default or insolvency.
Competition
The financial services industry is a highly competitive market in which we compete with a number of institutions. In purchasing investments and obtaining financing, we compete with other mortgage REITs, investment banking firms, mutual funds, banks, hedge funds, mortgage bankers, insurance companies, federal agencies and other entities, many of which have greater financial resources and a lower cost of capital than we do. Increased competition in the market may reduce the available supply of investments and may drive prices of investments to unacceptable levels. In addition, competition could reduce the availability of borrowing capacity at our repurchase agreement counterparties.
FEDERAL INCOME TAX CONSIDERATIONS
As a REIT, we are required to abide by certain requirements for qualification as a REIT under the Internal Revenue Code of 1986, as amended (the “Code”). The REIT rules generally require that a REIT invest primarily in real estate-related assets, that our activities be passive rather than active and that we distribute annually to our shareholders substantially all of our taxable income, after certain deductions, including deductions for NOL (“NOL”) carryforward. We could be subject to income tax if we failed to satisfy those requirements. We use the calendar year for both tax and financial reporting purposes.
There may be differences between taxable income and income computed in accordance with U.S. generally accepted accounting principles (“GAAP”). These differences primarily arise from timing differences in the recognition of revenue and expense for tax and GAAP purposes. We had an NOL carryforward of approximately $147.1 million as of December 31, 2009, which expire principally in 2020.
Failure to satisfy certain Code requirements could cause us to lose our status as a REIT. If we failed to qualify as a REIT for any taxable year, we may be subject to federal income tax (including any applicable alternative minimum tax) at regular corporate rates and would not receive deductions for dividends paid to shareholders. We could, however, utilize our NOL carryforward to offset any taxable income. In addition, given the size of our NOL carryforward, we could pursue a business plan in the future in which we would voluntarily forego our REIT status. If we lost or otherwise surrendered our status as a REIT, we could not elect REIT status again for five years. Several of our investments in securitized mortgage loans have ownership restrictions limiting their ownership to REITs. Therefore, if we chose to forego our REIT status, we would have to sell these investments or otherwise provide for REIT ownership of these investments. In addition, many of our repurchase agreement lenders require us to maintain our REIT status. If we lost our REIT status these lenders have the right to terminate any repurchase agreement borrowings at that time.
We also have a taxable REIT subsidiary (“TRS”), which had a NOL carryforward of approximately $4.2 million as of December 31, 2009. As we have not yet completed our 2010 tax return, we do not know the balance of this NOL carryforward as of December 31, 2010. The TRS has limited operations, and, accordingly, we have established a full valuation allowance for the related deferred tax asset.
Qualification as a REIT
Qualification as a REIT requires that we satisfy a variety of tests relating to our income, assets, distributions and ownership. The significant tests are summarized below.
Sources of Income. To continue qualifying as a REIT, we must satisfy two distinct tests with respect to the sources of our income: the “75% income test” and the “95% income test.” The 75% income test requires that we derive at least 75% of our gross income (excluding gross income from prohibited transactions) from certain real estate-related sources. In order to satisfy the 95% income test, 95% of our gross income for the taxable year must consist of either income that qualifies under the 75% income test or certain other types of passive income.
4
If we fail to meet either the 75% income test or the 95% income test, or both, in a taxable year, we might nonetheless continue to qualify as a REIT, if our failure was due to reasonable cause and not willful neglect and the nature and amounts of our items of gross income were properly disclosed to the Internal Revenue Service. However, in such a case we would be required to pay a tax equal to 100% of any excess non-qualifying income.
Nature and Diversification of Assets. At the end of each calendar quarter, we must meet multiple asset tests. Under the “75% asset test”, at least 75% of the value of our total assets must represent cash or cash items (including receivables), government securities or real estate assets. Under the “10% asset test,” we may not own more than 10% of the outstanding voting power or value of securities of any single non-governmental issuer, provided such securities do not qualify under the 75% asset test or relate to taxable REIT subsidiaries. Under the “5% asset test,” ownership of any stocks or securities that do not qualify under the 75% asset test must be limited, in respect of any single non-governmental issuer, to an amount not greater than 5% of the value of our total assets (excluding ownership of any taxable REIT subsidiaries).
If we inadvertently fail to satisfy one or more of the asset tests at the end of a calendar quarter, such failure would not cause us to lose our REIT status, provided that (i) we satisfied all of the asset tests at the close of the preceding calendar quarter and (ii) the discrepancy between the values of our assets and the standards imposed by the asset tests either did not exist immediately after the acquisition of any particular asset or was not wholly or partially caused by such an acquisition. If the condition described in clause (ii) of the preceding sentence was not satisfied, we still could avoid disqualification by eliminating any discrepancy within 30 days after the close of the calendar quarter in which it arose.
Ownership. In order to maintain our REIT status, we must not be deemed to be closely held and must have more than 100 shareholders. The closely held prohibition requires that not more than 50% of the value of our outstanding shares be owned by five or fewer persons at anytime during the last half of our taxable year. The more than 100 shareholders rule requires that we have at least 100 shareholders for 335 days of a twelve-month taxable year. In the event that we failed to satisfy the ownership requirements we would be subject to fines and be required to take curative action to meet the ownership requirements in order to maintain our REIT status.
EMPLOYEES
As of December 31, 2010, we have 15 employees and one corporate office in Glen Allen, Virginia. We believe our relationship with our employees is good. None of our employees are covered by any collective bargaining agreements, and we are not aware of any union organizing activity relating to our employees.
Executive Officers of the Registrant
|
Name (Age)
|
Current Title
|
Business Experience
|
|
Thomas B. Akin (58)
|
Chairman of the Board and Chief Executive Officer
|
Chief Executive Officer since February 2008; Chairman of the Board since 2003; managing general partner of Talkot Capital, LLC since 1995.
|
|
Stephen J. Benedetti (48)
|
Executive Vice President, Chief Operating Officer and Chief Financial Officer
|
Executive Vice President and Chief Operating Officer since November 2005; Executive Vice President and Chief Financial Officer from September 2001 to November 2005 and beginning again in February 2008.
|
|
Byron L. Boston (52)
|
Chief Investment Officer
|
Chief Investment Officer since April 2008; President of Boston Consulting Group from November 2006 to April 2008; Vice Chairman and Executive Vice President of Sunset Financial Resources, Inc. from January 2004 to October 2006.
|
5
AVAILABLE INFORMATION
We are subject to the reporting requirements of the Exchange Act and its rules and regulations. The Exchange Act requires us to file reports, proxy statements, and other information with the Securities and Exchange Commission (the “SEC”). Copies of these reports, proxy statements, and other information can be read and copied at:
SEC Public Reference Room
100 F Street, N.E.
Washington, D.C. 20549
Information on the operation of the Public Reference Room may be obtained by calling the SEC at 1-800-SEC-0330. The SEC maintains a website that contains reports, proxy statements, and other information regarding issuers that file electronically with the SEC. These materials may be obtained electronically by accessing the SEC’s home page at http://www.sec.gov.
Our website can be found at www.dynexcapital.com. Our annual reports on Form 10-K, our quarterly reports on Form 10-Q and our current reports on Form 8-K, and amendments to those reports, filed or furnished pursuant to Section 13(a) or 15(d) of the Exchange Act, are made available free of charge through our website as soon as reasonably practicable after such material is electronically filed with or furnished to the SEC.
We have adopted a Code of Business Conduct and Ethics (“Code of Conduct”) that applies to all of our employees, officers and directors. Our Code of Conduct is also available free of charge on our website, along with our Audit Committee Charter, our Nominating and Corporate Governance Committee Charter, and our Compensation Committee Charter. We will post on our website amendments to the Code of Conduct or waivers from its provisions, if any, which are applicable to any of our directors or executive officers in accordance with SEC or NYSE requirements.
|
ITEM 1A.
|
RISK FACTORS
|
Our business is subject to various risks, including those described below. Our business, operating results, and financial condition could be materially and adversely affected by any of these risks. Please note that additional risks not presently known to us or that we currently deem immaterial could also impair our business, operating results, and financial condition.
|
Page Number
|
|
|
Risks Related to Our Business
|
6
|
|
Risks Related to Regulatory and Legal Requirements
|
18
|
|
Risks Related to Owning Our Stock
|
22
|
Risks Related to Our Business
The success of our business model depends on our ability to access to the credit markets to finance our investments. Failure to access credit markets on reasonable terms, or at all, could adversely affect our profitability and may, in turn, negatively affect the market price of shares of our common stock.
We depend heavily upon the availability of adequate funding for our investment activities. Our access to financing depends upon a number of factors, over which we have little or no control, including:
|
-
|
general market and economic conditions;
|
|
-
|
the actual or perceived financial condition of credit market participants including banks, broker-dealers, hedge funds, and money-market funds, among others;
|
|
-
|
the impact of governmental policies and/or regulations on institutions with respect to activities in the credit markets;
|
6
|
-
|
market perception of quality and liquidity of the type of assets in which we invest; and
|
|
-
|
market perception of our financial strength, our growth potential and the quality of assets specific to our portfolio.
|
The credit markets in 2008 and 2009 experienced extreme volatility, resulting in diminished financing capacity for mortgage securities. This period of volatility demonstrated that general market conditions and the perceived effect on market participants can severely restrict the flow of capital to the credit markets. Many participants in the credit markets were negatively impacted (such as Bear Stearns and Lehman Brothers), resulting in a meaningful reduction in the amount of liquidity available for participants. These events led to adverse impacts on the values of fixed income securities. If such an event were to occur again, lenders may be unwilling or unable to provide financing for our investments or may be willing to provide financing only at much higher rates. This may impact our profitability by increasing our borrowing costs or by forcing us to sell assets.
We invest in securities where the timely receipt of principal and interest is guaranteed by Fannie Mae and Freddie Mac. Both Fannie Mae and Freddie Mac are currently under federal conservatorship, and the Treasury has committed to purchasing preferred stock from each of these entities in order to ensure their adequate capitalization. The conservatorship of Fannie Mae and Freddie Mac, their reliance upon the U.S. government for solvency, and related efforts that may significantly affect Fannie Mae and Freddie Mac and their relationship with the U.S. government may adversely affect our business, operations and financial condition.
Due to increased market concerns about Fannie Mae and Freddie Mac’s ability, without the direct support of the U.S. government, to withstand future credit losses associated with securities held in their investment portfolios or with respect to which they provide guarantees, Congress passed the Housing and Economic Recovery Act of 2008, or the HERA. Among other things, the HERA established the Federal Housing Finance Agency, or FHFA, which has broad regulatory powers over Fannie Mae and Freddie Mac. On September 6, 2008, the FHFA placed Fannie Mae and Freddie Mac into conservatorship and, together with the Treasury, established a program designed to boost investor confidence in Fannie Mae’s and Freddie Mac’s debt and Agency MBS. As the conservator of Fannie Mae and Freddie Mac, the FHFA controls and directs their operations and may (1) take over the assets of and operate Fannie Mae and Freddie Mac with all the powers of their shareholders, directors, and officers and conduct all business of Fannie Mae and Freddie Mac; (2) collect all obligations and money due to Fannie Mae and Freddie Mac; (3) perform all functions of Fannie Mae and Freddie Mac which are consistent with the conservator’s appointment; (4) preserve and conserve the assets and property of Fannie Mae and Freddie Mac; and (5) contract for assistance in fulfilling any function, activity, action or duty of the conservator.
In addition to FHFA becoming the conservator of Fannie Mae and Freddie Mac, the Treasury and Fannie Mae and Freddie Mac have entered into Preferred Stock Purchase Agreements (“PSPAs”) pursuant to which the Treasury has ensured that each of Fannie Mae and Freddie Mac maintains a positive net worth. On December 24, 2009, the Treasury amended the terms of the PSPAs to remove the $200 billion per institution limit established under the PSPAs until the end of 2012. The Treasury also amended the PSPAs with respect to the requirements for Fannie Mae and Freddie Mac to reduce their portfolios.
In addition, in 2008 the Federal Reserve established a program to purchase $100 billion in direct obligations of Fannie Mae, Freddie Mac and the Federal Home Loan Bank and $500 billion in Agency MBS. The Federal Reserve stated that its actions were intended to reduce the cost and increase the availability of credit for the purchase of houses, and were meant to support housing markets and foster improved conditions in financial markets more generally. While the Federal Reserve terminated this program in 2010, the FHFA reported that through January 2010, the Federal Reserve had purchased $1.03 trillion net of Agency MBS.
The problems faced by Fannie Mae and Freddie Mac resulting in their placement into federal conservatorship and receipt of significant U.S. government support have sparked debate among some federal policy makers regarding the continued role of the U.S. government in providing liquidity for mortgage loans and Agency MBS. With Fannie Mae’s and Freddie Mac’s future under debate, the nature of their guarantee obligations could be considerably limited relative to historical measurements. Any changes to the nature of their guarantee obligations could redefine what constitutes an Agency
7
MBS and could have broad adverse implications for the market and our business, operations and financial condition. If Fannie Mae or Freddie Mac are eliminated, or their structures change radically (i.e., limitation or removal of the guarantee obligation), we may be unable to acquire additional Agency MBS. A reduction in the supply of Agency MBS could negatively affect the pricing of these securities by reducing the spread between the interest we earn on our portfolio of Agency MBS and our cost of financing that portfolio.
Although the Treasury has committed capital to Fannie Mae and Freddie Mac through 2012, there can be no assurance that these actions will be adequate for their needs. If these actions are inadequate, Fannie Mae and Freddie Mac could continue to suffer losses and could fail to honor their guarantees and other obligations. Furthermore, the current credit support provided by the Treasury to Fannie Mae and Freddie Mac, and any additional credit support it may provide in the future, could have the effect of lowering the interest rates we expect to receive from Agency MBS, and tightening the spread between the interest we earn on our Agency MBS and the cost of financing those assets.
In addition, our existing Agency MBS could be materially and adversely impacted. We rely on our Agency MBS as collateral for our financings under our repurchase agreements. Any decline in their value, or perceived market uncertainty about their value, would make it more difficult for us to obtain financing on acceptable terms or at all, or to maintain our compliance with the terms of any financing transactions.
Future policies that change the relationship between Fannie Mae and Freddie Mac and the U.S. government, including those that result in their winding down, nationalization, privatization, or elimination, may create market uncertainty and have the effect of reducing the actual or perceived credit quality of securities issued or guaranteed by Fannie Mae or Freddie Mac. As a result, such policies could increase the risk of loss on investments in Agency MBS guaranteed by Fannie Mae and/or Freddie Mac. It also is possible that such policies could adversely impact the market for such securities and spreads at which they trade. All of the foregoing could materially and adversely affect our business, operations and financial condition.
The potential limitation or wind-down of the role Fannie Mae and Freddie Mac play in the MBS market may adversely affect our business, operations and financial condition.
On February 11, 2011, the Treasury issued a White Paper titled “Reforming America's Housing Finance Market” (or the White Paper) that lays out, among other things, proposals to limit or potentially wind down the role that Fannie Mae and Freddie Mac play in the mortgage market. Any such proposals, if enacted, may have broad adverse implications for the MBS market and our business, operations and financial condition. We expect such proposals to be the subject of significant discussion and it is not yet possible to determine whether such proposals will be enacted and, if so, when, what form any final legislation or policies might take or how proposals, legislation or policies emanating from the White Paper may impact the MBS market and our business, operations and financial condition. We are evaluating, and will continue to evaluate, the potential impact of the proposals set forth in the White Paper on our business and our financial position and results of operations.
The Treasury and the Federal Reserve Bank of New York own substantial amounts of fixed-rate Agency MBS as a result of their efforts to stabilize the financial system and the housing market after the credit crisis of 2008. As of February 16, 2011, the Federal Reserve Bank of New York owns $958 billion in Agency MBS. If the Treasury or Federal Reserve Bank of New York were to sell these assets into the market in material amounts, the prices of all Agency MBS could be materially impacted.
In an effort to support the U.S. housing market, the Treasury and Federal Reserve have become substantial buyers of fixed-rate Agency MBS, primarily 15- and 30-year Agency RMBS. The ultimate disposition of these Agency MBS by the Treasury and the Federal Reserve is not yet known, but if either of these entities began to sell Agency MBS in material amounts, price volatility in all Agency MBS could occur. In such a case, it is likely that prices could decline which would cause our shareholders’ equity to decline and could result in margin calls by our lenders for Agency MBS that are pledged as collateral for repurchase agreements. If declines in prices are substantial, this could force us to sell assets at a loss or at an otherwise inopportune time in order to meet margin calls or repay lenders.
8
Mortgage loan modification programs and future legislative action may adversely affect the value of and the return on the single-family loans and securities in which we invest.
The U.S. government, through the Federal Reserve, the Federal Housing Administration (or the FHA) and the Federal Deposit Insurance Corporation, has implemented a number of federal programs designed to assist homeowners, including the Home Affordable Modification Program (or HAMP), which provides homeowners with assistance in avoiding residential mortgage loan foreclosures, the Hope for Homeowners Program (or H4H Program), which allows certain distressed borrowers to refinance their mortgages into FHA-insured loans in order to avoid residential mortgage loan foreclosures, and the Home Affordable Refinance Program, which allows borrowers who are current on their mortgage payments to refinance and reduce their monthly mortgage payments at loan-to-value ratios up to 125 percent without new mortgage insurance. HAMP, the H4H Program and other loss mitigation programs may involve, among other things, the modification of mortgage loans to reduce the principal amount of the loans (through forbearance and/or forgiveness) and/or the rate of interest payable on the loans, or to extend the payment terms of the loans. Loan modifications such as these could result in our ultimately receiving less than we are contractually due in the case of our securitized single-family mortgage loans and could cause the fair value of our non-Agency RMBS to decline. Additionally, a significant number of loan modifications with respect to a given security, including, but not limited to, those related to principal forgiveness and coupon reduction, could negatively impact the realized yields and cash flows on our non-Agency RMBS. These loan modification programs, future legislative or regulatory actions, including possible amendments to the bankruptcy laws, which result in the modification of outstanding residential mortgage loans, as well as changes in the requirements necessary to qualify for refinancing mortgage loans with Fannie Mae, Freddie Mac or Ginnie Mae, may adversely affect the value of, and the returns on, our securitized single-family mortgage loans and non-Agency RMBS.
Changes in prepayment rates on the mortgage loans underlying our investments may adversely affect our profitability and subject us to reinvestment risk.
Our investments subject us to prepayment risk to the extent that we own these investments at premiums to their par value. In the case of Agency RMBS, we own these assets at a weighted average premium to par of 5.1% and in the case of Agency CMBS, we own these securities at a weighted average premium to par of 9.8%. Prepayments by borrowers of principal on the loans underlying our investments impact the amortization of premiums under the effective yield method of accounting in accordance with GAAP. Under the effective yield method of accounting, we recognize yields on our assets based on assumptions regarding future cash flows. Variations in actual cash flows from those assumed as a result of prepayments and subsequent changes in future cash flow expectations will cause adjustments in yields on assets which could contribute to volatility in our future results. For example, if we experience actual prepayments in excess of forecasts or increase our expectations of future prepayment activity, we will amortize premiums on investments on an accelerated basis which may adversely affect our profitability. We use a third-party prepayment modeling service to help us estimate future prepayments on our investments.
Prepayments occur on both a voluntary or involuntary basis. Voluntary prepayments tend to increase when interest rates are declining or, in the case of hybrid ARMs or ARMs, based on the shape of the yield curve as discussed further below. However, the actual level of prepayments will be impacted by economic and market conditions, including loan-to-value and income documentation requirements. Involuntary prepayments tend to increase when the yield curve is steep, evidencing economic stress and increasing delinquencies on the underlying loans. Involuntary prepayments occur for all of our investment types, including Agency RMBS and CMBS and non-Agency RMBS and CMBS.
If we receive increased prepayments of our principal in a declining interest rate environment, we may earn a lower return on our new investments as compared to the MBS that prepay given the declining interest rate environment. If we reinvest our capital in lower yielding investments, we will likely have lower net interest income and reduced profitability unless the cost of financing these investments declines faster than the rate at which we may reinvest.
Fannie Mae and Freddie Mac are actively purchasing delinquent single-family mortgage loans from Agency MBS pools which may impact the prepayments on our Agency MBS.
9
Under current policies, Fannie Mae and Freddie Mac are obligated to buy out seriously delinquent loans from an Agency MBS pool if the loan has been seriously delinquent for 24 months, if the loan has been permanently modified, or if a foreclosure or short sale has occurred on the property. Otherwise, Fannie Mae and Freddie Mac have the right, but not the obligation, to buy out delinquent loans in Agency MBS pools before the 24 month period. Fannie Mae and Freddie Mac have an obligation to advance principal and interest on delinquent loans to the holders of the Agency RMBS if such loans have not been bought out of the Agency RMBS pool. In the past, despite the requirement to continue to advance principal and interest, Fannie Mae and Freddie Mac have not exercised their right to actively buy out delinquent loans from Agency MBS pools because such buy-outs required an immediate write-down in the balance of the loans in their GAAP financial statements (and therefore a capital charge). However, beginning in 2010, in response to changes in GAAP, Fannie Mae and Freddie Mac began purchasing loans that are currently past due 120 days or more from Agency RMBS pools. These delinquent loan buy-outs have caused accelerated amortization of premiums on our Agency RMBS and may continue to do so in the future. Further, Fannie Mae or Freddie Mac could change their delinquent loan purchase activity in the future, which could impact prepayments on our Agency RMBS.
The Treasury and Congress continue to seek ways to support the U.S. housing market, including seeking ways to make it easier to refinance delinquent single-family mortgage loans and loans where the borrower may have negative equity. Since we own our Agency RMBS at premiums to their par balance, if such an event were to occur, we could incur substantial losses on our Agency RMBS.
Though no actions have been taken to date, the Treasury and U.S. Congress continue to explore ways to further support the U.S. housing market including a mass refinance of loans which are included in securities guaranteed by Fannie Mae and Freddie Mac. Many of our Agency RMBS which we own at premiums to their par balance are collateralized by mortgage loans whose coupons exceed current market interest rates. Despite being economically incented to, the borrowers have not refinanced their loans most likely because they have limited or negative equity in their homes or they have impaired credit (e.g., their current FICO score would not qualify for a new loan or they are unemployed). If the Treasury or U.S. Congress were successful in creating a program where these borrowers could refinance their loans, it is likely that many of these borrowers would do so, resulting in the prepayment of the loans. In such an event, we would incur losses on those Agency RMBS that we own at a premium (equal to the excess of the premium paid on the RMBS versus its principal balance) and could experience significant volatility in Agency RMBS fair values. Such volatility could lead to margin calls from our repurchase agreement lenders and could force us to sell these securities at a loss.
A flat or inverted yield curve may adversely affect prepayment rates and supply of hybrid ARMs and ARMs.
When the differential between short-term and long-term benchmark interest rates narrows, the yield curve is said to be “flattening.” When short-term interest rates increase and exceed long-term interest rates, the yield curve is said to be “inverted”. When this flattening or inversion occurs, borrowers have an incentive to refinance into fixed-rate mortgages, or hybrid ARMs with longer initial fixed rate periods, which could cause our investments to experience faster levels of prepayments than expected. As noted above, increases in prepayments on our investments would cause our premium amortization to accelerate, lowering the yield on such assets and decreasing our net interest income. In addition, a decrease in the supply of hybrid ARMs and ARMs will decrease the supply of securities collateralized by these types of loans, which could force us to change our investment strategy.
A decrease or lack of liquidity in our investments may adversely affect our business, including our ability to value and sell our assets.
We invest in securities that are not publicly traded in liquid markets. Though Agency MBS are generally deemed to be a very liquid security, turbulent market conditions in the past have at times significantly and negatively impacted the liquidity of these assets. This has resulted in periods of reduced pricing for the Agency MBS from our repurchase agreement lenders. In some extreme cases, financing might not be available for certain Agency MBS. Generally our lenders will value Agency MBS based on liquidation value in periods of significant market volatility.
With respect to non-Agency securities, such securities typically experience greater price volatility than Agency MBS as there is no guaranty of payment by Fannie Mae and Freddie Mac, and they generally can be more difficult to value. In addition, third-party pricing for non-Agency securities and CMBS may be more subjective than for Agency MBS. As such, non-Agency securities and CMBS are typically less liquid than Agency MBS and are subject to a greater risk of repurchase agreement financing not being available, market value reductions, and/or lower advance rates and higher costs from lenders.
10
The illiquidity of our investment securities may make it difficult for us to sell any such investments if the need or desire arises. In addition, if we are required to liquidate all or a portion of our portfolio quickly, we may realize significantly less than the value at which we have previously recorded certain of our investment securities. As a result, our ability to vary our portfolio in response to changes in economic and other conditions may be relatively limited, which could adversely affect our results of operations and financial condition.
Repurchase agreements are uncommitted financings and changes to the availability and terms of such financing may adversely affect our profitability and result in losses and/or reduced cash available for distribution to our shareholders.
Repurchase agreements are uncommitted financings from lenders with an average term of ninety days or less. We use repurchase agreements to finance a substantial portion of our investment portfolio and our earnings are heavily influenced by the cost of our repurchase agreements. Since we rely heavily on borrowings under repurchase agreements to finance certain of our investments, our ability to achieve our investment and profitability objectives depends on our ability to borrow in sufficient amounts and on favorable terms and to renew or replace maturing borrowings on a continuous basis. Our ability to access repurchase agreement financing could be impacted in times of market stress or if we or our lenders suffer financial stress or if the liquidity of securities pledged as collateral is reduced in any meaningful way. If we are not able to renew or replace maturing borrowings, we could be forced to sell some of our assets, potentially under adverse circumstances, which would adversely affect our profitability. In addition, if the terms on which we borrow change in a meaningful way, our profitability may be impacted which could reduce distributions to our shareholders.
In addition, if repurchase agreement financing were not available or if it were not available on reasonable terms, we could implement a strategy of reducing our leverage by selling assets or not replacing MBS as they amortize and/or prepay, thereby decreasing the outstanding amount of our related borrowings. Such an action would likely reduce interest income, interest expense and net income, the extent of which would depend on the level of reduction in assets and liabilities as well as the sale prices for which the assets were sold.
Adverse developments involving major financial institutions or one of our lenders could also result in a rapid reduction in our ability to borrow and adversely affect our business and profitability.
Recent turmoil in the financial markets relating to major financial institutions has raised concerns that a material adverse development involving one or more major financial institutions could result in our lenders reducing our access to funds available under our repurchase agreements. Such a disruption could cause our lenders to reduce or terminate our access to future borrowings. In such a scenario, we may be forced to sell investments under adverse market conditions. We may also be unable to purchase additional investments without access to additional financing. Either of these events could adversely affect our business and profitability.
If a lender to us in a repurchase transaction defaults on its obligation to resell the underlying security back to us at the end of the transaction term, or if we default on our obligations under a repurchase agreement, we will incur losses.
Repurchase agreement transactions are legally structured as the sale of a security to a lender in return for cash from the lender. These transactions are accounted for as financing agreements because the lenders are obligated to resell the same securities back to us at the end of the transaction term. Because the cash we receive from the lender when we initially sell the securities to the lender is less than the value of those securities, if the lender defaults on its obligation to resell the same securities back to us, we would incur a loss on the transaction equal to the difference between the value of the securities sold and the amount borrowed from the lender. Further, if we default on one of our obligations under a repurchase agreement, the lender can terminate the transaction, sell the underlying collateral and cease entering into any other repurchase transactions with us. Any losses we incur on our repurchase transactions could adversely affect our earnings and reduce our ability to pay dividends to our shareholders.
A decline in the market value of our assets may cause our book value to decline and may result in margin calls that may force us to sell assets under adverse market conditions.
11
The market value of our assets is generally determined by the marketplace on a spread to the Treasury and or LIBOR swap interest rate curves and generally will move inversely to changes in interest rates (i.e., as Treasury and/or LIBOR rates increase, the value of our investments will decrease). The movement of the Treasury and LIBOR swap curves can result from a variety of factors, including but not limited to factors such as Federal Reserve policy, market inflation expectations, and market perceptions of risk. In particular, in periods of high volatility, spreads on our investments to the respective interest rate curve may increase which would have the same consequence for the value of our assets as if the underlying interest rate curve had increased. As most of our investments are considered available for sale under GAAP and are therefore carried at fair value in our financial statements, the decline in value would cause our shareholders’ equity to correspondingly decline.
In addition, since we utilize recourse collateralized financing such as repurchase agreements, a decline in the market value of our investments may limit our ability to borrow against these assets or result in our lenders initiating margin calls and requiring a pledge of additional collateral or cash. Posting additional collateral or cash to support our borrowings would reduce our liquidity and limit our ability to leverage our assets, which could adversely affect our business. As a result, we could be forced to sell some of our assets in order to maintain liquidity. Forced sales typically result in lower sales prices than do market sales made in the normal course of business. If our investments were liquidated at prices below the amortized cost basis of such investments, we would incur losses, which could result in a rapid deterioration of our financial condition.
Our ownership of securitized mortgage loans subjects us to credit risk and, although we provide for an allowance for loan losses on these loans as required under GAAP, the loss reserves are based on estimates. As a result, actual losses incurred may be larger than our reserves, requiring us to provide additional reserves, which would impact our financial position and results of operations.
We are subject to credit risk as a result of our ownership of securitized mortgage loans. Credit risk is the risk of loss to us from the failure by a borrower (or the proceeds from the liquidation of the underlying collateral) to fully repay the principal balance and interest due on a mortgage loan. A borrower’s ability to repay the loan and the value of the underlying collateral could be negatively impacted by economic and market conditions. These conditions could be global, national, regional or local in nature.
We attempt to mitigate this risk by pledging loans to a securitization trust and issuing non-recourse securitization financing bonds (referred to as a “securitization”), and by obtaining certain insurance policies or other loss reimbursement agreements when available. Upon securitization of a pool of mortgage loans, the credit risk retained by us from an economic point of view is generally limited to the overcollateralization tranche of the securitization trust, inclusive of any subordinated bonds of the trust that we may own. The overcollateralization tranche is generally the excess value of the mortgage loans pledged over the securitization financing bonds issued. However, GAAP does not recognize the transfer of credit risk through the securitization process. Instead, GAAP requires that we provide reserves for estimated losses on the entire pool of loans regardless of the securitization process.
We provide reserves for losses on securitized mortgage loans based on the current performance of the respective pool or on an individual loan basis. If losses are experienced more rapidly due to declining property performance, market conditions or other factors, than we have provided for in our reserves, we may be required to provide additional reserves for these losses. In addition, our allowance for loan losses is based on estimates and to the extent that proceeds from the liquidation of the underlying collateral are less than our estimates, we will record a reduction in our profitability for that period equal to the shortfall.
Our efforts to manage credit risk may not be successful in limiting delinquencies and defaults in underlying loans or losses on our investments. If we experience higher than anticipated delinquencies and defaults, our earnings and our cash flow may be negatively impacted.
There are many aspects of credit performance for our investments that we cannot control. Third party servicers provide for the primary and special servicing of our single-family and commercial mortgage loans and non-Agency securities and CMBS. In that capacity these service providers control all aspects of loan collection, loss mitigation, default management and ultimate resolution of a defaulted loan. We have a risk management function which oversees the performance of these servicers and provides limited asset management services. Loan servicing companies may not cooperate with our risk management efforts, or such efforts may be ineffective. We have no contractual rights with respect to
12
these servicers and our risk management operations may not be successful in limiting future delinquencies, defaults, and losses.
The securitizations in which we have invested may not receive funds that we believe are due from mortgage insurance companies and other counter-parties. Service providers to securitizations, such as trustees, bond insurance providers, guarantors and custodians, may not perform in a manner that promotes our interests or may default on their obligation to the securitization trust. The value of the properties collateralizing the loans may decline causing higher losses than anticipated on the liquidation of the property. The frequency of default and the loss severity on loans that do default may be greater than we anticipated. If loans become “real estate owned” (“REO”), servicing companies will have to manage these properties and may not be able to sell them. Changes in consumer behavior, bankruptcy laws, tax laws, and other laws may exacerbate loan losses. In some states and circumstances, the securitizations in which we invest have recourse, as the owner of the loan, against the borrower’s other assets and income in the event of loan default; however, in most cases, the value of the underlying property will be the sole source of funds for any recoveries.
We invest in commercial mortgage loans and CMBS collateralized by commercial mortgage loans which are secured by income producing properties. Such loans are typically made to single-asset entities and the repayment of the loan is dependent principally on the performance and value of the underlying property. The volatility of certain mortgaged property values may adversely affect our commercial mortgage loans and CMBS.
Our commercial mortgage loans and CMBS are secured by multifamily and commercial property and are subject to risks of delinquency, foreclosure, and loss that are greater than similar risks associated with loans secured by single-family residential property. The ability of a borrower to repay a loan secured by an income-producing property typically is dependent upon the successful operation of the property rather than upon the existence of independent income or assets of the borrower. If the net operating income of the property is reduced, the borrower's ability to repay the loan may be impaired. Net operating income of an income-producing property can be affected by, among other things: tenant mix, success of tenant businesses, property management decisions, property location and condition, competition from comparable types of properties, changes in laws that increase operating expenses or limit rents that may be charged, any need to address environmental contamination at the property, changes in national, regional or local economic conditions and/or specific industry segments, declines in regional or local real estate values and declines in regional or local rental or occupancy rates, increases in interest rates, real estate tax rates and other operating expenses, changes in governmental rules, regulations and fiscal policies, including environmental legislation, and acts of God, terrorism, social unrest and civil disturbances.
Commercial and multifamily property values and net operating income derived from them are subject to volatility and may be affected adversely by a number of factors, including, but not limited to, national, regional and local economic conditions (which may be adversely affected by plant closings, industry slowdowns and other factors); local real estate conditions (such as an oversupply of housing, retail, industrial, office or other commercial space); changes or continued weakness in specific industry segments; perceptions by prospective tenants, retailers and shoppers of the safety, convenience, services and attractiveness of the property; the willingness and ability of the property's owner to provide capable management and adequate maintenance; construction quality, age and design; demographic factors; retroactive changes to building or similar codes; and increases in operating expenses (such as energy costs).
Certain investments employ internal structural leverage as a result of the securitization process and are in the most subordinate position in the capital structure, which magnifies the potential impact of adverse events on our cash flows.
As discussed above, securitized mortgage loans have been pledged to securitization trusts which have issued securitization financing bonds collateralized by the loans pledged. By their design, securitization trusts employ a high degree of internal structural leverage (i.e., the securitization financing bonds issued), which results in concentrated credit, interest rate, prepayment, or other risks to our investment in the trust. Generally in a securitization, we will receive the excess of the interest income and principal received on the loans pledged over the interest expense and principal paid on the securitization financing bonds according to the terms of the respective indenture. Our cash flow received is generally subordinate to payments due on the securitization bonds. As a result, our net interest income and related cash flows will vary based on the performance of the assets pledged to the securitization trust. In particular, should assets significantly underperform as to defaults and credit losses, it is possible that net interest income and cash flows which may have otherwise been paid to us as a result of our ownership of the securitization trust may be retained within the trust and payments of principal amounts on our
13
ownership position in the trust may be delayed or permanently reduced. To date, none of our existing trusts have reached or are near the levels of underperformance that would trigger delays or reductions in income or cash flows, but such levels could be reached in the future.
Guarantors may fail to perform on their obligations to our securitization trusts, which could result in additional losses to us.
In certain instances we have guaranty of payment on commercial and single-family mortgage loans pledged to securitization trusts (See Item 7A. “Quantitative and Qualitative Disclosures About Market Risk”). These guarantors have reported substantial losses since 2007, eroding their respective capital base and potentially impacting their ability to make payments where required. Generally the guarantors will only make payment in the event of the default and liquidation of the collateral supporting the loan. If these guarantors fail to make payment, we may experience losses on the loans that we otherwise would not have experienced.
We may be subject to the risks associated with inadequate or untimely services from third-party service providers, which may harm our results of operations. We also rely on corporate trustees to act on behalf of us and other holders of securities in enforcing our rights.
Our loans and loans underlying non-Agency securities we own are serviced by third-party service providers. Should a servicer experience financial difficulties, it may not be able to perform these obligations. Servicers who have sought bankruptcy protection may, due to application of provisions of bankruptcy law, not be required to make advance payments to us of amounts due from loan obligors. Even if a servicer were able to advance amounts in respect of delinquent loans, its obligation to make the advances may be limited to the extent that is does not expect to recover the advances due to the deteriorating credit of the delinquent loans. In addition, as with any external service provider, we are subject to the risks associated with inadequate or untimely services for other reasons. Servicers may not advance funds to us that would ordinarily be due because of errors, miscalculations, or other reasons. Many borrowers require notices and reminders to keep their loans current and to prevent delinquencies and foreclosures, which our servicers may fail to provide. In the current economic environment, many servicers are experiencing higher volumes of delinquent loans than they have in the past and, as a result, there is a risk that their operational infrastructures cannot properly process this increased volume. A substantial increase in our delinquency rate resulting from improper servicing or loan performance in general may result in credit losses.
We also rely on corporate trustees to act on behalf of us and other holders of securities in enforcing our rights. Under the terms of most securities we hold we do not have the right to directly enforce remedies against the issuer of the security, but instead must rely on a trustee to act on behalf of us and other security holders. Should a trustee not be required to take action under the terms of the securities, or fail to take action, we could experience losses.
Credit ratings assigned to debt securities by the credit rating agencies may not accurately reflect the risks associated with those securities. Changes in credit ratings for securities we own or for similar securities might negatively impact the market value of these securities.
Rating agencies rate securities based upon their assessment of the safety of the receipt of principal and interest payments on the securities. Rating agencies do not consider the risks of fluctuations in fair value or other factors that may influence the value of securities and, therefore, the assigned credit rating may not fully reflect the true risks of an investment in securities. Also, rating agencies may fail to make timely adjustments to credit ratings based on available data or changes in economic outlook or may otherwise fail to make changes in credit ratings in response to subsequent events, so that our investments may be better or worse than the ratings indicate. We attempt to reduce the impact of the risk that a credit rating may not accurately reflect the risks associated with a particular debt security by not relying solely on credit ratings as the indicator of the quality of an investment. We make our acquisition decisions after factoring in other information that we have obtained about the loans underlying the security and the credit subordination structure of the security. Despite these efforts, our assessment of the quality of an investment may also prove to be inaccurate and we may incur credit losses in excess of our initial expectations.
Credit rating agencies may change their methods of evaluating credit risk and determining ratings on securities backed by real estate loans and securities. These changes may occur quickly and often. The market’s ability to understand and absorb these changes, and the impact to the securitization market in general, are difficult to predict. Such changes may have a negative impact on the value of securities that we own.
14
Fluctuations in interest rates may have various negative effects on us and could lead to reduced profitability and a lower book value.
Fluctuations in interest rates impact us in a number of ways. For example, as more fully explained below, in a period of rising rates, we may experience a decline in our profitability from borrowing rates increasing faster than our assets reset or from our investments adjusting less frequently or relative to a different index (e.g., one-year LIBOR) from our borrowings (which are typically based on one-month LIBOR). We may also experience a reduction in the market value of our Agency MBS and non-Agency MBS as a result of higher yield requirements for these types of securities by the market. In a period of declining interest rates, we may experience increasing prepayments resulting in reduced profitability and returns of our capital in lower yielding investments as discussed elsewhere.
Many of our investments are financed with borrowings which have shorter maturity or interest-reset terms than the associated investment. In addition, both our Agency and non-Agency CMBS are fixed-rate, and a significant portion of our Agency RMBS have a fixed rate of interest for a certain period of time and then reset semi-annually or annually based on an index such as the six-month or one-year LIBOR or one-year CMT. These securities are financed with repurchase agreements which bear interest based predominantly on one-month LIBOR, and generally have initial maturities between 30 and 90 days. In a period of rising rates our borrowings will typically increase in rate faster than our assets may reset resulting in a reduction in our net interest income. The severity of any such decline would depend on our asset/liability composition at the time as well as the magnitude and period over which interest rates increase.
Additionally, increases in interest rates may negatively affect the market value of our securities. In some instances increases in short-term rates are rapid enough that short-term rates equal or exceed medium/long-term rates resulting in a flat or inverted yield curve. Any fixed-rate or hybrid ARM investments will generally be more negatively affected by these increases than securities whose interest-rate periodically adjusts. For those securities that we carry at estimated market value in our financial statements, we are required to reduce our shareholders’ equity, or book value, by the amount of any decrease in the market value of these securities. In addition, as mentioned elsewhere in these Risk Factors, reductions in market value of our securities could result in margin calls from our lenders and could result in our being forced to sell securities at a loss.
Interest rate caps on the adjustable-rate mortgage loans collateralizing our investments may adversely affect our profitability if interest rates increase.
The coupons earned on ARMs adjust over time as interest rates change. The level of adjustment on the interest rates on ARMs is limited by contract and is based on the limitations of the underlying adjustable- rate mortgage loans. Such loans typically have interim and lifetime interest rate caps which limit the amount by which the interest rates on such assets can adjust. Interim interest rate caps limit the amount interest rates can adjust during any given period. Lifetime interest rate caps limit the amount interest rates can increase from inception through maturity of a particular loan. The financial markets primarily determine the interest rates that we pay on the repurchase transactions used to finance the acquisition of our ARMs. These repurchase transactions are not subject to interim and lifetime interest rate caps. Accordingly, in a sustained period of rising interest rates or a period in which interest rates rise rapidly, we could experience a decrease in net income or a net loss because the interest rates paid by us on our borrowings could increase without limitation (as new repurchase transactions are entered into upon the maturity of existing repurchase transactions) while increases in the interest rates earned on the adjustable-rate mortgage loans collateralizing our ARMs could be limited due to interim or lifetime interest rate caps.
Our use of hedging strategies to mitigate our interest rate exposure may not be effective, may adversely affect our income, may expose us to counterparty risks, and may increase our contingent liabilities.
We may pursue various types of hedging strategies, including interest rate swap agreements, interest rate caps and other derivative transactions (collectively, “hedging instruments”). We expect hedging to assist us in mitigating and reducing our exposure to higher interest expenses, and to a lesser extent, losses in book value, from adverse changes in interest rates. Our hedging activity will vary in scope based on the level and volatility of interest rates, the type of assets in our investment portfolio and financing sources used. No hedging strategy, however, can completely insulate us from the interest rate risks to which we are exposed, and there is no assurance that the implementation of any hedging strategy will have the desired impact
15
on our results of operations or financial condition. Certain of the U.S. federal income tax requirements that we must satisfy in order to qualify as a REIT may limit our ability to hedge against such risks. In addition, these hedging strategies may adversely affect us because hedging activities involve an expense that we will incur regardless of the effectiveness of the hedging activity.
Interest rate hedging may fail to protect or could adversely affect us because, among other things:
|
·
|
interest rate hedging can be expensive, particularly during periods of rising and volatile interest rates;
|
|
·
|
available interest rate hedges may not correspond directly with the interest rate risk for which we seek protection;
|
|
·
|
the duration of the hedge may not match the duration of the related liability;
|
|
·
|
the amount of income that a REIT may earn from hedging transactions (other than through taxable REIT subsidiaries) to offset interest rate losses may be limited by U.S. federal income tax provisions governing REITs;
|
|
·
|
the credit quality of the party owing money on the hedge may be downgraded to such an extent that it impairs our ability to sell or assign our side of the hedging transaction;
|
|
·
|
the party owing money in the hedging transaction may default on its obligation to pay;
|
|
·
|
the value of derivatives used for hedging may be adjusted from time to time in accordance with GAAP to reflect changes in fair value, and downward adjustments, or “mark-to-market losses,” would reduce our shareholders’ equity and book value; and
|
|
·
|
hedge accounting under GAAP is extremely complex and any ineffectiveness of our hedges under GAAP will impact our statement of operations.
|
We expect to primarily use interest rate swap agreements to hedge against anticipated future increases in interest rates on our repurchase agreements. Should an interest rate swap agreement counterparty be unable to make required payments pursuant to the agreement, the hedged liability would cease to be hedged for the remaining term of the interest rate swap agreement. In addition, we may be at risk for any collateral held by a hedging counterparty to an interest rate swap agreement, should the counterparty become insolvent or file for bankruptcy. Our hedging transactions, which are intended to limit losses, may actually adversely affect our earnings, which could reduce our ability to pay dividends to our shareholders.
Hedging instruments involve risk since they often are not traded on regulated exchanges, guaranteed by an exchange or its clearing house, or regulated by any U.S. or foreign governmental authorities. Consequently, there are no requirements with respect to record keeping, financial responsibility or segregation of customer funds and positions. Furthermore, the enforceability of hedging instruments may depend on compliance with applicable statutory, commodity and other regulatory requirements and, depending on the identity of the counterparty, applicable international requirements. The business failure of a hedging counterparty with whom we enter into a hedging transaction will most likely result in its default. Default by a party with whom we enter into a hedging transaction may result in the loss of unrealized profits and force us to cover our commitments, if any, at the then current market price. Although generally we will seek to reserve the right to terminate our hedging positions, it may not always be possible to dispose of or close out a hedging position without the consent of the hedging counterparty, and we may not be able to enter into an offsetting contract in order to cover our risk. In certain circumstances a liquid secondary market may not exist for hedging instruments purchased or sold, and we may be required to maintain a position until exercise or expiration, which could result in losses.
Hedging instruments could also require us to fund cash payments in certain circumstances (such as the early termination of a hedging instrument caused by an event of default or other voluntary or involuntary termination event or the decision by a hedging counterparty to request the posting of collateral it is contractually owed under the terms of the hedging
16
instrument). With respect to the termination of an existing interest rate swap agreement, the amount due would generally be equal to the unrealized loss of the open interest rate swap agreement position with the hedging counterparty and could also include other fees and charges. These economic losses would be reflected in our results of operations, and our ability to fund these obligations will depend on the liquidity of our assets and access to capital at the time. Any losses we incur on our hedging instruments could adversely affect our earnings and reduce our ability to pay dividends to our shareholders.
We may change our investment strategy, operating policies, dividend policy and/or asset allocations without shareholder consent.
We may change our investment strategy, operating policies, dividend policy and/or asset allocation with respect to investments, acquisitions, leverage, growth, operations, indebtedness, capitalization and distributions at any time without the consent of our shareholders. A change in our investment strategy may increase our exposure to interest rate and/or credit risk, default risk and real estate market fluctuations. Furthermore, a change in our asset allocation could result in our making investments in asset categories different from our historical investments. These changes could adversely affect our financial condition, results of operations, the market price of our common stock or our ability to pay dividends to our shareholders.
During 2010 we declared $0.98 per common share in dividends to our common shareholders. Given our ability to offset most of our taxable income with our NOL carryforward, we may not be required to distribute any of our taxable income to common shareholders in order to maintain our REIT status. Our Board of Directors reviews the status of our common dividend on a quarterly basis. We may change our dividend strategy in the future and elect to retain all or a greater portion of our earnings by using our NOL carryforward.
Competition may prevent us from acquiring new investments at favorable yields, and we may not be able to achieve our investment objectives which may potentially have a negative impact on our profitability.
Our net income will largely depend on our ability to acquire mortgage-related assets at favorable spreads over our borrowing costs. The availability of mortgage-related assets meeting our investment criteria depends upon, among other things, the level of activity in the real estate market and the quality of and demand for securities in the mortgage securitization and secondary markets. The size and level of activity in the residential real estate lending market depends on various factors, including interest rates, regional and national economic conditions and real estate values. In acquiring investments, we may compete with other purchasers of these types of investments, including but not limited to other mortgage REITs, broker-dealers, hedge funds, banks, savings and loans, insurance companies, mutual funds, and other entities that purchase assets similar to ours, many of which have greater financial resources than we do. As a result of all of these factors, we may not be able to acquire sufficient assets at acceptable spreads to our borrowing costs, which would adversely affect our profitability.
New assets we acquire may not generate yields as attractive as yields on our current assets, resulting in a decline in our earnings per share over time.
We believe the assets we acquire have the potential to generate attractive economic returns and GAAP yields, but acquiring new assets poses risks. Potential cash flow and mark-to-market returns from new asset acquisitions could be negative, including both new assets that are backed by newly-originated loans, as well as new acquisitions that are backed by more seasoned assets that may experience higher than expected levels of delinquency and default.
In order to maintain our portfolio size and our earnings, we must reinvest in new assets a portion of the cash flows we receive from principal, interest, calls, and sales. We receive monthly payments from many of our assets, consisting of principal and interest. In addition, occasionally some of our securities can be called by the issuer (which means it is effectively sold by us). Principal payments and calls reduce the size of our portfolio and generate cash for us. We may also sell assets from time to time as part of our portfolio management and capital recycling strategies.
If the assets we acquire in the future earn lower GAAP yields than the assets we currently own, our reported earnings per share will likely decline over time as the older assets pay down, are called, or are sold.
17
We are dependent on information systems and systems’ failures could significantly disrupt our business.
Our business is highly dependent on our communications and information systems. Any failure or interruption of our systems could cause delays or other problems in our securities trading activities, which could have a material adverse effect on our operation and performance.
Loss of key management could result in material adverse effects on our business.
We are dependent to a significant extent on the continued services of our executive management team. Our executive officers consist of Thomas Akin, our Chairman and Chief Executive Officer, Byron Boston, our Chief Investment Officer, and Stephen Benedetti, our Chief Operating Officer and Chief Financial Officer. The loss of one or more of Messrs. Akin, Boston or Benedetti could have an adverse effect on our business, financial condition, liquidity, and results of operations regardless of the existence of any current or future key man insurance policies.
Our Chairman and Chief Executive Officer devotes a portion of his time to another company in a capacity that could create conflicts of interest that may harm our investment opportunities; this lack of a full-time commitment could also harm our operating results.
Our Chairman and Chief Executive Officer, Thomas Akin, is the managing general partner of Talkot Capital, LLC, where he devotes a portion of his time. Talkot Capital invests in both private and public companies, including investments in common and preferred stocks of other public mortgage REITs. Mr. Akin’s activities with respect to Talkot Capital results in his spending only a portion of his time and effort on managing our activities, as he is under no contractual obligation which mandates that he devote a minimum amount of time to our company. Since he is not fully focused on us at all times, this may harm our overall management and operating results. In addition, though the investment strategy and activities of Talkot Capital are not directly related to us, Mr. Akin’s activities with respect to Talkot Capital may create conflicts. Our corporate governance policies include formal notification policies with respect to potential issues of conflict of interest for competing business opportunities. Compliance by Mr. Akin, and all employees, is closely monitored by our Chief Financial Officer and Board of Directors. Nonetheless, Mr. Akin’s activities with respect to Talkot Capital could create conflicts of interest.
Risks Related to Regulatory and Legal Requirements
Risks Specific to Our REIT Status
Qualifying as a REIT involves highly technical and complex provisions of the Code, and a technical or inadvertent violation could jeopardize our REIT qualification. Maintaining our REIT status may reduce our flexibility to manage our operations.
Qualification as a REIT involves the application of highly technical and complex Code provisions for which only limited judicial and administrative authorities exist. Even a technical or inadvertent violation could jeopardize our REIT qualification. Our qualification as a REIT will depend on our satisfaction of certain asset, income, organizational, distribution, stockholder ownership and other requirements on a continuing basis. Our operations and use of leverage also subjects us to interpretations of the Code, and technical or inadvertent violations of the Code could cause us to lose our REIT status or to pay significant penalties and interest. In addition, our ability to satisfy the requirements to qualify as a REIT depends in part on the actions of third parties over which we have no control or only limited influence, including in cases where we own an equity interest in an entity that is classified as a partnership for U.S. federal income tax purposes.
Maintaining our REIT status may limit flexibility in managing our operations. For instance:
|
·
|
If we make frequent asset sales from our REIT entities to persons deemed customers, we could be viewed as a “dealer,” and thus subject to 100% prohibited transaction taxes or other entity level taxes on income from such transactions.
|
|
·
|
Compliance with the REIT income and asset requirements may limit the type or extent of hedging that we can undertake.
|
18
|
·
|
Our ability to own non-real estate related assets and earn non-real estate related income is limited. Our ability to own equity interests in other entities is limited. If we fail to comply with these limits, we may be forced to liquidate attractive assets on short notice on unfavorable terms in order to maintain our REIT status.
|
|
·
|
Our ability to invest in taxable subsidiaries is limited under the REIT rules. Maintaining compliance with this limitation could require us to constrain the growth of future taxable REIT affiliates.
|
|
·
|
Notwithstanding our NOL carryforward, meeting minimum REIT dividend distribution requirements could reduce our liquidity. Earning non-cash REIT taxable income could necessitate our selling assets, incurring debt, or raising new equity in order to fund dividend distributions.
|
|
·
|
Stock ownership tests may limit our ability to raise significant amounts of equity capital from one source.
|
If we do not qualify as a REIT or fail to remain qualified as a REIT, we may be subject to tax as a regular corporation and could face a tax liability, which would reduce the amount of cash available for distribution to our shareholders.
We intend to operate in a manner that will allow us to qualify as a REIT for federal income tax purposes. Our qualification as a REIT will depend on our satisfaction of certain asset, income, organizational, distribution, stockholder ownership and other requirements on a continuing basis. Our ability to satisfy the asset tests depends upon our analysis of the characterization and fair market values of our assets, some of which are not susceptible to a precise determination, and for which we will not obtain independent appraisals. Our compliance with the REIT income and quarterly asset requirements also depends upon our ability to successfully manage the composition of our income and assets on an ongoing basis.
If we were to fail to qualify as a REIT in any taxable year, we would be subject to federal income tax, after consideration of our NOL carryforward but not considering any dividends paid to our shareholders during the respective tax year. If we could not otherwise offset this taxable income with our NOL carryforward, the resulting corporate tax liability could be material to our results and would reduce the amount of cash available for distribution to our shareholders, which in turn could have an adverse impact on the value of our common stock. Unless we were entitled to relief under certain Code provisions, we also would be disqualified from taxation as a REIT for the four taxable years following the year in which we failed to qualify as a REIT.
We have a tax NOL carryforward that we have used to partially offset our REIT distribution requirements. If we incur an ownership shift pursuant to Section 382 of the Code our use of the tax NOL carryforward would be limited in the future. Further, if we had previously inadvertently incurred an ownership shift pursuant to Section 382 and continued to utilize the NOL on an unlimited basis, we may have failed to meet the distribution requirements of a REIT and therefore we could lose our REIT status.
Our tax NOL carryforward allows us to offset the distribution requirements of a REIT and retain some or all of our tax earnings. Section 382 of the Code limits the amount of NOL that could be used to offset this distribution requirement, after an “ownership shift” occurs. A Section 382 ownership shift generally occurs if one or more shareholders who own at least 5% of our stock, or certain groups of shareholders, increase their aggregate ownership by more than 50 percentage points over their lowest ownership percentage within a rolling three-year period. While we believe we have complied with Section 382, if we inadvertently incurred an ownership shift under Section 382, the use of the NOL could have been limited and we may have utilized more of the NOL than we otherwise may have been allowed. In such an instance we may be required to pay taxes, penalties and interest on the excess amount of NOL used, or we may be required to declare a deficiency dividend to our shareholders for the excess amount. In addition as a result of our failure to comply with the REIT distribution requirements, we may fail to qualify as a REIT.
Even if we have complied with Section 382 in the past, we may incur an ownership shift under Section 382 in the future, in which case the use of our NOL could be limited. Future issuances or sales of our common stock (including transactions involving our common stock that are out of our control) could result in an ownership shift under Section 382. If an ownership shift occurs, Section 382 would impose an annual limit on the amount of pre-ownership shift NOLs and other losses we could use to reduce our taxable income.
19
Because NOLs generally may be carried forward for up to 20 years, if the annual limitation were to be triggered, it may effectively limit the cumulative amount of pre-ownership shift losses, including certain recognized built-in losses that we may utilize. This would result in higher taxable income and greater distribution requirements in order to maintain REIT qualification than if such limitation were not in effect.
The failure of investments subject to repurchase agreements to qualify as real estate assets could adversely affect our ability to qualify as a REIT.
Repurchase agreement financing arrangements are structured as a sale and repurchase whereby we sell certain of our investments to a counterparty and simultaneously enter into an agreement to repurchase these securities at a later date in exchange for a purchase price. Economically, these agreements are financings which are secured by the investments sold pursuant thereto. We believe that we would be treated for REIT asset and income test purposes as the owner of the securities that are the subject of any such sale and repurchase agreement, notwithstanding that such agreements may legally transfer record ownership of the securities to the counterparty during the term of the agreement. It is possible, however, that the IRS could assert that we did not own the securities during the term of the sale and repurchase agreement, in which case we could fail to qualify as a REIT.
Even if we remain qualified as a REIT, we may face other tax liabilities that reduce our cash flow and our profitability.
Even if we remain qualified for taxation as a REIT, we may be subject to certain federal, state and local taxes on our income and assets, including taxes on any undistributed income, tax on income from some activities conducted as a result of a foreclosure or considered prohibited transactions under the Code, and state or local income taxes. Any of these taxes would decrease cash available for distribution to our shareholders. In addition, in order to meet the REIT qualification requirements, or to avert the imposition of a 100% tax that applies to certain gains derived by a REIT from prohibited transactions (i.e., dealer property or inventory), we may hold some of our assets through a taxable REIT subsidiary (“TRS”) or other subsidiary corporations that will be subject to corporate-level income tax at regular rates to the extent that such TRS does not have an NOL carryforward. Any of these taxes would decrease cash available for distribution to our shareholders.
If we fail to maintain our REIT status, our ability to utilize repurchase agreements as a source of financing and to enter into interest rate swap agreements may be impacted.
Most of our repurchase agreements and the agreements governing our interest rate swaps require that we maintain our REIT status as a condition to engaging in a transaction with us. Even though repurchase agreements are not committed facilities with our lenders, if we failed to maintain our REIT status our ability to enter into new repurchase agreement transactions or renew existing, maturing repurchase agreements will likely be limited. Most of our repurchase agreements and swap agreements have cross-default provisions which provide for lenders to terminate these agreements if we default under any of our repurchase agreements or swap agreements. As such, we may be required to sell investments, potentially under adverse circumstances, that were previously financed with repurchase agreements and we may be forced to terminate our interest rate swap agreements.
Certain of our securitization trusts, which qualify as “taxable mortgage pools,” require us to maintain equity interests in the securitization trusts. If we do not, our profitability and cash flow may be reduced.
Certain of our commercial mortgage and single-family mortgage securitization trusts are considered taxable mortgage pools for federal income tax purposes. These securitization trusts are exempt from taxes so long as we, or another REIT, own 100% of the equity interests in the trusts. If we fail to maintain sufficient equity interest in these securitization trusts or if we fail to maintain our REIT status, then the trusts may be considered separate taxable entities. If the trusts are considered separate taxable entities, they will be required to compute taxable income and pay tax on such income. Our profitability and cash flow will be impacted by the amount of taxes paid. Moreover, we may be precluded from selling equity interests, including debt securities issued in connection with these trusts that might be considered to be equity interests for tax purposes, to certain outside investors.
Risks Related to Accounting and Reporting Requirements
20
Our reported income depends on GAAP and conventions in applying GAAP which are subject to change in the future and which may not have a favorable impact on our reported income.
Accounting rules for our assets and for the various aspects of our current and future business change from time to time. Changes in GAAP, or the accepted interpretation of these accounting principles, can affect our reported income and shareholders’ equity.
Estimates are inherent in the process of applying GAAP, and management may not always be able to make estimates which accurately reflect actual results, which may lead to adverse changes in our reported GAAP results.
Interest income on our assets and interest expense on our liabilities may be partially based on estimates of future events. These estimates can change in a manner that negatively impacts our results or can demonstrate, in retrospect, that revenue recognition in prior periods was too high or too low. For example, we use the effective yield method of accounting for many of our investments which involves calculating projected cash flows for each of our assets. Calculating projected cash flows involves making assumptions about the amount and timing of credit losses, loan prepayment rates, and other factors. The yield we recognize for GAAP purposes generally equals the discount rate that produces a net present value for actual and projected cash flows that equals our GAAP basis in that asset. We update the yield recognized on these assets based on actual performance and as we change our estimates of future cash flows. The assumptions that underlie our projected cash flows and effective yield analysis may prove to be overly optimistic, or conversely, overly conservative. In these cases, our GAAP yield on the asset or cost of the liability may change, leading to changes in our reported GAAP results.
Other Regulatory Risks
In the event of bankruptcy either by ourselves or one or more of our third party lenders, assets pledged as collateral under repurchase agreements may not be recoverable by us. We may incur losses equal to the excess of the collateral pledged over the amount of the associated repurchase agreement borrowing.
Borrowings made under repurchase agreements may qualify for special treatment under the U.S. Bankruptcy Code. In the event that a lender under our repurchase agreements files for bankruptcy, it may be difficult for us to recover our assets pledged as collateral to such lender. In addition, if we ever file for bankruptcy, lenders under our repurchase agreements may be able to avoid the automatic stay provisions of the U.S. Bankruptcy Code and take possession of and liquidate our collateral under our repurchase agreements without delay. In the event of a bankruptcy, we may incur losses equal to the excess of our collateral pledged over the amount of repurchase agreement borrowing due to the lender.
If we fail to properly conduct our operations we could become subject to regulation under the Investment Company Act of 1940. Conducting our business in a manner so that we are exempt from registration under and compliance with the Investment Company Act of 1940 may reduce our flexibility and could limit our ability to pursue certain opportunities.
We seek to conduct our operations so as to avoid falling under the definition of an investment company pursuant to the Investment Company Act of 1940 (the “1940 Act”). Specifically, we currently seek to conduct our operations under one of the exemptions afforded under the 1940 Act. We primarily expect to use the exemption provided under Section 3(c)(5)(C) of the 1940 Act, a provision available to companies primarily engaged in the business of purchasing and otherwise acquiring mortgages and other liens on and interests in real estate. According to SEC no-action letters, companies relying on this exemption must ensure that at least 55% of their assets are mortgage loans and other qualifying assets, and at least 80% of their assets are real estate-related. The 1940 Act requires that we and each of our subsidiaries evaluate our qualification for exemption under the Act. Our subsidiaries will rely either on Section 3(c)(5)(C) or other sections that provide exemptions from registering under the 1940 Act, including Sections 3(a)(1)(C) and 3(c)(7).
Under the 1940 Act, an investment company is required to register with the SEC and is subject to extensive restrictive and potentially adverse regulations relating to, among other things, operating methods, management, capital structure, dividends, and transactions with affiliates. If we were determined to be an investment company, our ability to use leverage and conduct business as we do today would be impaired.
21
Risks Related to Owning Our Stock
The stock ownership limit imposed by the Code for REITs and our Articles of Incorporation may restrict our business combination opportunities. The stock ownership limitation may also result in reduced liquidity in our stock and may result in losses to an acquiring shareholder.
To qualify as a REIT under the Code, not more than 50% in value of our outstanding stock may be owned, directly or indirectly, by five or fewer individuals (as defined in the Code to include certain entities) at any time during the last half of each taxable year after our first year in which we qualify as a REIT. Our Articles of Incorporation, with certain exceptions, authorize our Board of Directors to take the actions that are necessary and desirable to qualify as a REIT. Pursuant to our Articles of Incorporation, no person may beneficially or constructively own more than 9.8% of our common stock. Our Board of Directors may grant an exemption from this 9.8% stock ownership limitation, in its sole discretion, subject to such conditions, representations and undertakings as it may determine are reasonably necessary. Our Board of Directors has waived this ownership limitation with respect to Talkot Capital, LLC, of which Thomas Akin, our Chairman and Chief Executive Officer, is managing general partner. Per the terms of the waiver, Talkot Capital may own up to 15% of our outstanding common stock on a fully diluted basis, provided, however, that no single beneficial owner has a greater than two-thirds ownership stake in Talkot Capital.
The ownership limits imposed by the tax law are based upon direct or indirect ownership by “individuals,” but only during the last half of a tax year. The ownership limits contained in our Articles of Incorporation apply to the ownership at any time by any “person,” which includes entities, and are intended to assist us in complying with the tax law requirements and to minimize administrative burdens. However, these ownership limits might also delay or prevent a transaction or a change in our control that might involve a premium price for our common stock or otherwise be in the best interest of our shareholders.
Whether we would waive the ownership limitation for any other shareholder will be determined by our Board of Directors on a case by case basis. Our Articles of Incorporation’s constructive ownership rules are complex and may cause the outstanding stock owned by a group of related individuals or entities to be deemed to be constructively owned by one individual or entity. As a result, the acquisition of less than these percentages of the outstanding stock by an individual or entity could cause that individual or entity to own constructively in excess of these percentages of the outstanding stock and thus be subject to the ownership limit. The Board of Directors has the right to refuse to transfer any shares of our common stock in a transaction that would result in ownership in excess of the ownership limit. In addition, we have the right to redeem shares of our common stock held in excess of the ownership limit.
Dividends payable by REITs do not qualify for the reduced tax rates available for some dividends.
The maximum tax rate applicable to income from “qualified dividends” payable to domestic shareholders that are individuals, trusts and estates has been reduced by legislation to 15% through the end of 2010. Dividends payable by REITs, however, generally are not eligible for the reduced rates. Although this legislation does not adversely affect the taxation of REITs or dividends payable by REITs, the more favorable rates applicable to regular corporate qualified dividends could cause investors who are individuals, trusts and estates to perceive investments in REITs to be relatively less attractive than investments in the stocks of non-REIT corporations that pay dividends, which could adversely affect the value of the stock of REITs, including our common stock.
Recognition of excess inclusion income by us could have adverse consequences to us or our shareholders.
Certain of our securities have historically generated excess inclusion income and may continue to do so in the future. Certain categories of shareholders, such as foreign shareholders eligible for treaty or other benefits, shareholders with NOLs, and certain tax-exempt shareholders that are subject to unrelated business income tax, could be subject to increased taxes on a portion of their dividend income from us that is attributable to excess inclusion income. In addition, to the extent that our stock is owned by tax-exempt “disqualified organizations,” such as certain government-related entities and charitable remainder trusts that are not subject to tax on unrelated business income, we may incur a corporate level tax on a portion of our income. In that case, we may reduce the amount of our distributions to any disqualified organization whose stock ownership gave rise to the tax.
22
|
ITEM 1B.
|
UNRESOLVED STAFF COMMENTS
|
There are no unresolved comments from the SEC Staff.
|
ITEM 2.
|
PROPERTIES
|
We lease one facility located at 4991 Lake Brook Drive, Suite 100, Glen Allen, Virginia 23060 which provides office space for our executive officers and administrative staff. As of December 31, 2010, we leased 7,068 square feet. The term of the lease runs to December 2013, but may be renewed at our option for one additional five-year period at a rental rate 3% greater than the rate in effect during the preceding 12-month period. We believe that our property is maintained in good operating condition and is suitable and adequate for our purposes.
|
ITEM 3.
|
LEGAL PROCEEDINGS
|
The Company and its subsidiaries are parties to various legal proceedings, including those described below. Although the ultimate outcome of any of these legal proceedings cannot be ascertained at this time, and the results of legal proceedings cannot be predicted with certainty, the Company believes, based on current knowledge, that the resolution of any of these proceedings, including those described below, will not have a material adverse effect on the Company’s consolidated financial condition or liquidity. However, the resolution of any of these proceedings could have a material impact on results of operations in a given reporting period as the proceedings are resolved.
One of the Company’s subsidiaries, GLS Capital, Inc. (“GLS”), and the County of Allegheny, Pennsylvania are defendants in a class action lawsuit (“Pentlong”) filed in 1997 in the Court of Common Pleas of Allegheny County, Pennsylvania (the “Court”). Between 1995 and 1997, GLS purchased from Allegheny County delinquent county property tax receivables for properties located in the County. In their initial pleadings, the Pentlong plaintiffs (“Pentlong Plaintiffs”) alleged that GLS did not have the right to recover from delinquent taxpayers certain attorney fees, lien docketing, revival, assignment and satisfaction costs, and expenses associated with the original purchase transaction, and interest, in the collection of the property tax receivables pursuant to the Pennsylvania Municipal Claims and Tax Lien Act (the “Act”). During the course of the litigation, the Pennsylvania State Legislature enacted Act 20 of 2003, which cured many deficiencies in the Act at issue in the Pentlong case, including confirming GLS’ right to collect attorney fees from delinquent taxpayers retroactive back to the date when GLS first purchased the delinquent tax receivables.
Subsequent to the enactment of Act 20, GLS has filed various motions with the Court seeking dismissal of the Pentlong Plaintiffs’ remaining claims regarding GLS’ right to collect reasonable attorneys fees from the named plaintiffs and purported class members; its right to collect lien docketing, revival, assignment and satisfaction costs from delinquent taxpayers; and its practice of charging interest on the first of each month for the entire month. Subsequently, the plaintiffs abandoned their claims with respect to lien docketing, satisfaction costs, and the issue of interest. On April 2, 2010, the Court granted GLS’ motion for summary judgment with respect to its right to charge attorney fees and interest in the collection of the receivables, and on August 25, 2010, the Court granted GLS’s motion for summary judgment with respect to lien costs, removing these claims from the Pentlong Plaintiffs’ case. The Court has indicated that it will undertake arguments over the reasonableness of attorney fees at a later date. GLS intends to seek decertification of the class at that time as well.
The Pentlong Plaintiffs have not enumerated their damages in this matter.
Dynex Capital, Inc. and Dynex Commercial, Inc. (“DCI”), a former affiliate of the Company and now known as DCI Commercial, Inc., are appellees (or respondents) in the Supreme Court of Texas related to the matter of Basic Capital Management, Inc. et al. (collectively, “BCM” or the “Plaintiffs”) versus DCI et al. The appeal seeks to overturn the trial court’s judgment, and subsequent affirmation by the Fifth Court of Appeals at Dallas, in our and DCI’s favor which denied recovery to Plaintiffs. Specifically, Plaintiffs are seeking reversal of the trial court’s judgment and sought rendition of judgment against us for alleged breach of loan agreements for tenant improvements in the amount of $253,000. They also seek reversal of the trial court’s judgment and rendition of judgment against DCI in favor of BCM under two mutually
23
exclusive damage models, for $2,200 and $25,600, respectively, related to the alleged breach by DCI of a $160,000 “master” loan commitment. Plaintiffs also seek reversal and rendition of a judgment in their favor for attorneys’ fees in the amount of $2,100. Alternatively, Plaintiffs seek a new trial. Even if Plaintiffs were to be successful on appeal, DCI is a former affiliate of the Company, and therefore management does not believe that it would be obligated for any amounts awarded to the Plaintiffs as a result of the actions of DCI.
Dynex Capital, Inc., MERIT Securities Corporation, a subsidiary ("MERIT"), and the former president and current Chief Operating Officer/Chief Financial Officer of Dynex Capital, Inc., (together, "Defendants") are defendants in a putative class action brought by the Teamsters Local 445 Freight Division Pension Fund ("Teamsters") in the United States District Court for the Southern District of New York ("District Court"). The original complaint, which was filed on February 7, 2005 alleged violations of the federal securities laws and was purportedly filed on behalf of purchasers between February 2000 and May 2004 of MERIT Series 12 and MERIT Series 13 securitization financing bonds ("Bonds"), which are collateralized by manufactured housing loans. After a series of rulings by the District Court and an appeal by the Company and MERIT, on February 22, 2008 the United States Court of Appeals for the Second Circuit dismissed the litigation against the Company and MERIT. Teamsters filed an amended complaint on August 6, 2008, which essentially restated the same allegations as the original complaint and added the Company’s former president and current Chief Operating Officer/Chief Financial Officer as defendants. The District Court denied Defendants’ motion to dismiss the amended complaint. Teamster’s seeks unspecified damages and alleges, among other things, fraud and misrepresentations in connection with the issuance of and subsequent reporting related to the Bonds. On March 7, 2011, the District Court granted Teamsters’ motion to certify the class for this action. The Company has evaluated the allegations made in the complaint, and continues to believe them to be without merit and intends to defend itself against them vigorously, including appealing the District Court’s decision certifying the class for this action.
ITEM 4. RESERVED
24
|
ITEM 5.
|
MARKET FOR REGISTRANT’S COMMON EQUITY, RELATED STOCKHOLDER MATTERS AND ISSUER PURCHASES OF EQUITY SECURITIES
|
Our common stock is traded on the New York Stock Exchange under the trading symbol “DX”. The common stock was held by approximately 12,434 holders of record as of March 1, 2011. On that date, the closing price of our common stock on the New York Stock Exchange was $10.65 per share. During the last two years, the high and low stock prices and cash dividends declared on common stock were as follows:
|
High
|
Low
|
Dividends Declared
|
||||||||||
|
2010:
|
||||||||||||
|
First quarter
|
$ | 9.36 | $ | 8.57 | $ | 0.23 | ||||||
|
Second quarter
|
$ | 9.85 | $ | 8.70 | $ | 0.23 | ||||||
|
Third quarter
|
$ | 10.92 | $ | 9.04 | $ | 0.25 | ||||||
|
Fourth quarter
|
$ | 11.00 | $ | 10.42 | $ | 0.27 | ||||||
|
2009:
|
||||||||||||
|
First quarter
|
$ | 7.47 | $ | 6.30 | $ | 0.23 | ||||||
|
Second quarter
|
$ | 8.70 | $ | 6.75 | $ | 0.23 | ||||||
|
Third quarter
|
$ | 8.92 | $ | 7.82 | $ | 0.23 | ||||||
|
Fourth quarter
|
$ | 9.33 | $ | 7.80 | $ | 0.23 | ||||||
During the year ended December 31, 2010, the Company declared common dividends totaling $0.98 per share. Any dividends declared by the Board of Directors have generally been for the purpose of maintaining our REIT status and maintaining compliance with dividend requirements of the Series D Preferred Stock. During October 2010, the Company converted all 4,221,539 shares of its Series D 9.50% Cumulative Convertible Preferred Stock (the “Series D Preferred Stock”) into an equivalent number of common shares, pursuant to provisions of the Company’s articles of incorporation. The stated quarterly dividend on Series D Preferred Stock was $0.2375 per share, which was declared and paid in full for the first two quarters of the 2010 fiscal period. Due to its participation feature, the quarterly dividend on the Series D Preferred Stock in the third quarter of 2010 was $0.25 per share. No dividend was declared on the Series D Preferred Stock in the fourth quarter of 2010 due to its redemption.
The following graph is a five year comparison of cumulative total returns for the shares of our common stock, the Standard & Poor’s 500 Stock Index (“S&P 500”), and the Bloomberg Mortgage REIT Index. The table below assumes $100 was invested at the close of trading on December 31, 2005 in each of our common stock, the S&P 500, and the Bloomberg Mortgage REIT Index.
25
Comparative Five-Year Total Returns (1)
Dynex Capital, Inc., S&P 500, Bloomberg Mortgage REIT Index and SNL Finance REIT Index
(Performance Results through December 31, 2010)
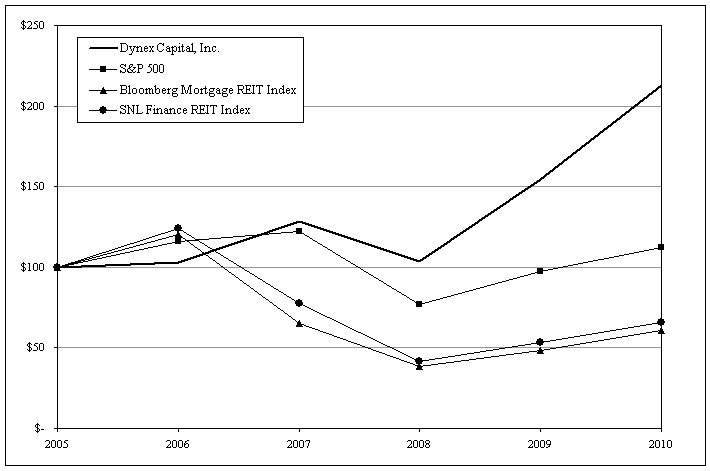
|
Cumulative Total Stockholder Returns as of December 31,
|
||||||||||||||||||||||||
|
Index
|
2005
|
2006
|
2007
|
2008
|
2009
|
2010
|
||||||||||||||||||
|
Dynex Capital, Inc.
|
$ | 100.00 | $ | 102.75 | $ | 128.55 | $ | 103.61 | $ | 154.55 | $ | 212.99 | ||||||||||||
|
S&P 500 (2)
|
$ | 100.00 | $ | 115.79 | $ | 122.15 | $ | 76.95 | $ | 97.32 | $ | 111.98 | ||||||||||||
|
Bloomberg Mortgage REIT Index (2)
|
$ | 100.00 | $ | 120.11 | $ | 65.12 | $ | 38.26 | $ | 48.63 | $ | 60.68 | ||||||||||||
|
SNL U.S. Finance REIT Index (2)
|
$ | 100.00 | $ | 123.87 | $ | 77.25 | $ | 41.67 | $ | 53.33 | $ | 65.92 | ||||||||||||
|
(1)
|
Cumulative total return assumes reinvestment of dividends.
|
|
(2)
|
The source of this information is Bloomberg, SNL, and Standard & Poor’s, which management believes to be reliable sources.
|
26
ITEM 6. SELECTED FINANCIAL DATA
The following selected financial information should be read in conjunction with the audited consolidated financial statements of the Company and notes thereto contained in Item 8 of this Annual Report on Form 10-K.
|
Years Ended December 31,
|
2010
|
2009
|
2008
|
2007
|
2006
|
|||||||||||||||
|
(amounts in thousands except share and per share data)
|
||||||||||||||||||||
|
Net interest income
|
$ | 34,425 | $ | 24,565 | $ | 10,547 | $ | 10,683 | $ | 11,087 | ||||||||||
|
Net interest income after provision for loan losses
|
33,046 | 23,783 | 9,556 | 11,964 | 11,102 | |||||||||||||||
|
Gain (loss) on sale of investments
|
2,891 | 171 | 2,316 | 755 | (183 | ) | ||||||||||||||
|
Fair value adjustments, net
|
294 | 205 | 7,147 | – | – | |||||||||||||||
|
Other income (expense), net
|
2,058 | 138 | 1,734 | 176 | (1,489 | ) | ||||||||||||||
|
General and administrative expenses
|
(8,817 | ) | (6,716 | ) | (5,632 | ) | (3,996 | ) | (4,521 | ) | ||||||||||
|
Net income
|
$ | 29,472 | $ | 17,581 | $ | 15,121 | $ | 8,899 | $ | 4,909 | ||||||||||
|
Net income to common shareholders
|
$ | 26,411 | $ | 13,571 | $ | 11,111 | $ | 4,889 | $ | 865 | ||||||||||
|
Net income per common share:
|
||||||||||||||||||||
|
Basic
|
$ | 1.50 | $ | 1.04 | $ | 0.91 | $ | 0.40 | $ | 0.07 | ||||||||||
|
Diluted
|
$ | 1.41 | $ | 1.02 | $ | 0.91 | $ | 0.40 | $ | 0.07 | ||||||||||
|
Dividends declared per share:
|
||||||||||||||||||||
|
Common
|
$ | 0.98 | $ | 0.92 | $ | 0.71 | $ | – | $ | – | ||||||||||
|
Series D Preferred
|
$ | 0.71 | $ | 0.95 | $ | 0.95 | $ | 0.95 | $ | 0.95 | ||||||||||
|
Average balance interest earning assets (1)
|
$ | 1,012,520 | $ | 740,640 | $ | 421,796 | $ | 333,084 | $ | 609,936 | ||||||||||
|
Average balance interest bearing liabilities (1)
|
$ | (865,919 | ) | $ | (627,848 | ) | $ | (327,687 | ) | $ | (265,379 | ) | $ | (515,302 | ) | |||||
|
Average effective yield earned on assets (2) (3)
|
4.81 | % | 5.29 | % | 6.79 | % | 8.45 | % | 7.92 | % | ||||||||||
|
Average effective rate on liabilities (2) (3)
|
(1.64 | %) | (2.06 | %) | (5.28 | %) | (6.77 | %) | (7.42 | %) | ||||||||||
|
Net interest spread (2) (3)
|
3.17 | % | 3.23 | % | 1.51 | % | 1.68 | % | 0.50 | % | ||||||||||
|
(1)
|
Average balances are calculated as a simple average of the daily balances and exclude unrealized gains and losses on available-for-sale securities. Average balances also exclude funds held by trustees except proceeds from defeased loans held by trustees.
|
|
(2)
|
Certain income and expense items of a one-time nature are not annualized for the calculation of effective yields or rates. Examples of such one-time items include retrospective adjustments of discount and premium amortization arising from adjustments of effective interest rates.
|
|
(3)
|
Cash and cash equivalents are excluded from the effective yield and rate calculations for each period presented.
|
|
As of December 31,
|
2010
|
2009
|
2008
|
2007
|
2006
|
|||||||||||||||
|
Investments
|
$ | 1,617,865 | $ | 917,981 | $ | 572,255 | $ | 331,795 | $ | 401,186 | ||||||||||
|
Total assets
|
1,649,584 | 958,062 | 607,191 | 374,758 | 466,557 | |||||||||||||||
|
Repurchase agreements
|
1,234,183 | 638,329 | 274,217 | 4,612 | 95,978 | |||||||||||||||
|
Non-recourse collateralized financing
|
107,105 | 143,081 | 177,157 | 203,199 | 210,135 | |||||||||||||||
|
Total liabilities
|
1,357,227 | 789,309 | 466,782 | 232,822 | 330,019 | |||||||||||||||
|
Shareholders’ equity
|
292,357 | 168,753 | 140,409 | 141,936 | 136,538 | |||||||||||||||
|
Common shares outstanding
|
30,342,897 | 13,931,512 | 12,169,762 | 12,136,262 | 12,131,262 | |||||||||||||||
|
Book value per common share
|
$ | 9.64 | $ | 9.08 | $ | 8.07 | $ | 8.22 | $ | 7.78 | ||||||||||
27
ITEM 7. MANAGEMENT’S DISCUSSION AND ANALYSIS OF FINANCIAL CONDITION AND RESULTS OF OPERATIONS
The following discussion should be read in conjunction with our financial statements and the related notes included in Item 8. “Financial Statements and Supplementary Data” in this Annual Report on Form 10-K. This discussion contains forward-looking statements that involve risks and uncertainties. Our actual results could differ materially from those anticipated in these forward-looking statements as a result of various factors including, but not limited to, those disclosed in Item 1A. “Risk Factors” elsewhere in this Annual Report on Form 10-K and in other documents filed with the SEC and otherwise publicly disclosed. Please refer to “Forward-Looking Statements” contained within this Item 7 for additional information.
Company Overview
As discussed in Item 1, “Business”, we are an internally-managed real estate investment trust, or REIT, which invests in mortgage assets on a leveraged basis. We were formed in 1987 and began our operations in 1988. Our primary source of income is net interest income, which is the excess of the interest income earned on our investments over the cost of financing these investments. Our investment strategy is a hybrid-investment strategy that targets higher credit quality, shorter duration investments primarily in Agency and non-Agency MBS. Investments considered to be of higher credit quality have less or limited exposure to loss of principal while investments which have shorter durations have less exposure to changes in interest rates. Over the last several years we have purchased primarily Agency MBS, including RMBS and CMBS, and highly-rated non-Agency CMBS. We also have investments in non-Agency RMBS and securitized mortgage loans.
In executing our investment strategy, we seek to balance the various risks of owning mortgage assets, such as interest rate, credit, prepayment, and liquidity risk with the earnings opportunity on the investment. We believe our strategy of investing in Agency and non-Agency mortgage assets provides superior diversification of these risks across our investment portfolio and therefore provides plentiful opportunities to generate attractive risk-adjusted returns while preserving our shareholders’ capital.
Factors that Affect Our Results of Operations and Financial Condition
Our financial condition and results of operations are affected by a variety of factors, many of which are beyond our control. The success of our investment strategy and our results of operations and financial condition are impacted by a variety of industry and economic factors including the interest rates, trends of interest rates, the steepness of interest rate curves, prepayment rates on our investments, competition for investments, economic conditions and their impact on the credit performance of our investments, and actions taken by the U.S. government, including the U.S. Federal Reserve and/or the Treasury.
Our investment strategy may be impacted by other factors such as the state of the overall credit markets, which could impact the availability and costs of financing. Reductions in the availability of financing for our investments could significantly impact our business and force us to sell assets.
Investing in mortgage-related securities on a leveraged basis subjects us to interest rate risk from the change in the absolute level of rates (e.g., the level of one-month LIBOR), the changes in relationships between rate indices (e.g., LIBOR versus U.S. Treasury rates), and changes in the relationships between short-term and long-term rates (e.g., the 2-year Treasury rate versus the 10-year Treasury rate). Interest rate risk also arises from changes in market spreads reflecting the perceived riskiness of assets (e.g., swap rates and mortgage rates relative to the U.S. Treasury rates). We attempt to manage our exposure to changes in interest rates by investing in shorter duration instruments and managing our investment portfolio within risk tolerances set by our Board of Directors. Our current goal is to maintain a portfolio duration target (a measure of interest rate risk) within a range of 0.5 to 1.5 years. Our portfolio duration could drift outside of our target range due to changes in market conditions and activity in our investment portfolio. We will use interest rate swaps to help manage our interest rate risk and, where practical, we will attempt to fund our assets with financings that have similar terms as the related investments. In general, mortgage portfolios with positive duration that use repurchase agreement financing will underperform in a period of rising interest rates and outperform in a period of declining interest rates.
28
The interest rates on our assets will generally reset less frequently than the interest rates on our liabilities, particularly our repurchase agreement financing. As such, during periods of rising interest rates, we will generally experience a reduction in our net interest income, notwithstanding our efforts to manage interest rate risk. This reduction in net interest income will be larger when short-term interest rates are rising rapidly. With the maturities of our assets generally of longer term than those of our liabilities, interest rate increases will also tend to decrease the market value of our assets (and therefore our book value).
Many of our investments are purchased at premiums to their par balance. Because we amortize premiums based on contractual payments as well as actual and expected future principal prepayments on the investments, changes in actual and expected prepayment rates will impact our yield on these investments. Principal prepayments on our investments are influenced by changes in market interest rates and a variety of economic, geographic, and other factors beyond our control. In addition, actions taken by the U.S. government could increase prepayments as discussed further below under “Trends and Recent Market Impacts”. Increasing prepayments on premium assets will reduce their overall yield negatively impacting our results. We attempt to manage the risks of purchasing assets at a premium by purchasing assets with protection from prepayments (e.g., Agency CMBS) and by purchasing assets which we believe will have less susceptibility to prepayments (e.g., hybrid Agency ARMs collateralized by interest-only loans).
Trends and Recent Market Impacts
The following marketplace conditions and prospective trends have impacted and may continue to impact our future results of operations:
Credit Markets and Liquidity Risk
Our business model requires that we have access to leverage, principally the repurchase agreement market. Repurchase agreement financing is uncommitted financing and as such, there can be no guarantee that we will always have access to such financing. During periods of sustained volatility in the credit markets, such as was experienced in 2008, access to repurchase agreement financing may be limited as liquidity providers reduce their exposure to the repurchase agreement markets. In an attempt to manage this risk, we seek to diversify our exposure to repurchase agreement counterparties and seek to extend the maturity dates of our repurchase agreements where practicable. We believe the diversification of counterparties reduces, but does not eliminate, our liquidity risk resulting from the exit or failure of one or more of our repurchase agreement counterparties. For additional information regarding liquidity risk, please refer to “Risk Factors” within Part I, Item 1A as well as “Quantitative and Qualitative Disclosures about Market Risk” within Part II, Item 7A of this Annual Report on Form 10-K.
Interest Rates
In response to recent volatility and lack of liquidity in the credit markets, the Federal Reserve lowered the targeted Federal Funds rate (the rate at which U.S. banks may borrow from each other) from 4.25% at the beginning of 2008 to its current targeted rate of 0.25%, and began purchasing Agency MBS and Treasury securities. While the credit markets are functioning more normally and liquidity has generally returned, economic activity in the U.S. has remained muted, as measured by gross domestic product, low rates of capacity utilization and high rates of unemployment. As a result, the U.S. Federal Reserve has pledged to keep the Federal Funds rate at the historically low target rate of 0.25% for an extended period. As economic activity improves, the Federal Reserve may decide to increase the targeted Federal Funds rate. Such an increase would likely increase our funding costs because, as discussed above, our repurchase agreement financing is based on LIBOR, which typically closely tracks the Federal Funds rate.
Yield Curve
During 2010, Treasury yields fell while LIBOR and the U.S. Federal Funds Target Rate remained steady as noted above, resulting in a flattening yield curve relative to short rates. However, the yield curve continues to remain historically steep as the spread between two-year Treasuries and ten-year Treasuries as of December 31, 2010 was 2.70%. Our borrowing costs are based on short-term market rates such as LIBOR and the Federal Funds Target Rate while our asset yields more closely correlate with longer term Treasury rates. In addition, the market prices of our Agency and non-Agency MBS also correlate more closely with the longer term Treasury rates, particularly our Agency and non-Agency CMBS which
29
typically will have longer durations than RMBS. With the yield curve remaining steep, our MBS continue to produce high yields relative to our financing costs and enjoy strong liquidity and favorable pricing. A change in the shape of the yield curve could impact our net interest income and the market value of our MBS. Please refer to our discussion contained within Item 7A. “Quantitative and Qualitative Disclosures About Market Risk” contained within this Annual Report on Form 10-K for more detailed information. As discussed previously, we may hedge our exposure to changes in rates by entering into pay-fixed interest rate swaps. Subsequent to December 31, 2010, we have entered into an additional $220 million in interest rate swaps with a weighted average pay-fixed rate of 1.86%.
Prepayments and Agency MBS
We have continued to experience favorable prepayment activity on our Agency RMBS due in large part to the inability of borrowers to refinance their mortgages. Our average constant prepayment rate, or CPR, for our Agency RMBS during the fourth quarter of 2010 was 24.0% versus expectations of 26.9%. Our CPR was 26.3% for the third quarter of 2010 and 25.8% for all of 2010. As of December 31, 2010, the weighted average coupon on the mortgage loans underlying our Agency RMBS was 4.99%, while the annual average 30-year fixed mortgage rate and the 5-year hybrid ARM mortgage rate were 4.69% and 3.82%, respectively, as published by Freddie Mac. Generally, this type of interest rate environment encourages the average borrower to refinance their mortgage loans at lower rates. However, in many cases, obstacles exist to refinancing, including but not limited to, the lack of borrower’s equity in the underlying real estate and the lack of an acceptable level of income. These obstacles are currently contributing to the limited refinancing of loans in our Agency RMBS portfolio and are keeping prepayment speeds relatively low. If mortgage rates remain low and the obstacles to refinancing are removed either through changes in government or Agency policies, through more housing price appreciation or other reasons, we may experience increased prepayments. As discussed above, increased prepayments may impact our net interest income by increasing the amortization expense on any investments which we own at premiums to their par balance.
Financial Regulatory Reform Bill and Other Government Activity
In July 2010 the Dodd-Frank Wall Street Reform and Consumer Protection Act (the “Dodd-Frank Act”) was enacted into law. This legislation aims to restore responsibility and accountability to the financial system. It is unclear how this legislation may impact the borrowing environment, the investing environment for Agency and non-Agency MBS, or interest rate swaps and other derivatives because much of the Dodd-Frank Act’s implementation has not yet been defined by regulators.
The U.S. government is providing homeowners with assistance in avoiding residential mortgage loan foreclosures. The programs may involve, among other things, the modification of mortgage loans to reduce the principal amount of the loans, the rate of interest payable on the loans, or to extend the payment terms of the loans. While the effect of these programs has not been as extensive as originally expected, the government may change them or add new programs in the future. The impact of these programs may have the effect of increasing prepayment rates and reducing the principal or interest payments on residential mortgage loans held by certain types of borrowers. The effect of such programs for holders of Agency RMBS could be that such holders would experience changes in the anticipated yields of their Agency RMBS due to increased prepayment rates and lower interest and principal payments.
GSE Reform
On February 11, 2011, the U.S Treasury released proposals to limit or potentially wind down the role that Fannie Mae and Freddie Mac play in the mortgage market. Any such proposals, if enacted, may have broad adverse implications for the MBS market and our business, operations and financial condition. We expect such proposals to be the subject of significant discussion, and it is not yet possible to determine whether such proposals will be enacted. We do not believe the ultimate reform of Fannie Mae and Freddie Mac will occur in 2011. Please refer to the “Risk Factors” contained within Item 1A of Part I of this Annual Report on Form 10-K for additional discussion.
30
RECENT ACCOUNTING PRONOUNCEMENTS
In January 2010, the Financial Accounting Standards Board (“FASB”) issued Accounting Standards Update (“ASU” or “Update”) No. 2010-01 which amends the accounting guidance specified in ASC Topic 505. Specifically, the amendment clarifies that the stock portion of a distribution to shareholders that allows them to elect to receive cash or stock with a potential limitation on the total amount of cash that all shareholders can elect to receive in the aggregate is considered a share issuance that is reflected in earnings per share prospectively and is not a stock dividend. This Update is effective for interim and annual reporting periods ending on or after December 15, 2009, and should be applied retrospectively. The Company has only distributed cash dividends to its shareholders, and does not currently intend to change this policy. As such, this amendment to ASC Topic 505 did not have and is not expected to have a material impact on the Company’s financial condition or results of operations.
In January 2010, FASB issued Update No. 2010-06, which amends ASC Topic 820 to require additional disclosures and to clarify existing disclosures. Specifically, entities will be required to disclose reasons for and amounts of transfers in and out of levels 1 and 2 as well as a reconciliation of level 3 measurements to include separate information about purchases, sales, issuances, and settlements. Additionally, this amendment clarifies that a “class” of assets or liabilities is often a subset of assets or liabilities within a line item on the entity’s balance sheet, and that a reporting entity should provide fair value measurement disclosures for each class. This amendment also clarifies that disclosures about valuation techniques and inputs used to measure fair value for both recurring and nonrecurring fair value measurements is required for those measurements that fall in either level 2 or 3. The effective date for the new disclosure requirements relating to the rollforward of activity in level 3 fair value measurements is for fiscal years beginning after December 15, 2010, and for interim periods within those fiscal years. All other new disclosures and clarifications of existing disclosures issued in this Update are effective for interim and annual reporting periods beginning after December 15, 2009. The Company has not had any transfers into or out of levels 1 or 2, but will provide these disclosures in the future when such a change occurs. Because these amendments to ASC Topic 820 relate only to disclosures and do not alter GAAP, they do not impact the Company’s financial condition or results of operations.
In February 2010, ASU No. 2010-10 was issued which allows certain reporting entities to defer the consolidation requirements amended in ASC Topic 810 by ASU No. 2009-17. The Company is not eligible for this deferral. As such, the amendments provided in ASU No. 2009-17 were adopted by the Company effective January 1, 2010.
In April 2010, FASB issued ASU No. 2010-18, which amends ASC Topic 310 to provide that modifications of loans that are accounted for within a pool under Subtopic 310-30 do not result in the removal of those loans from the pool even if the modification of those loans would otherwise be considered a troubled debt restructuring. An entity will continue to be required to consider whether the pool of assets in which the loan is included is impaired if expected cash flows for the pool change. ASU 2010-18 does not affect the accounting for loans under the scope of Subtopic 310-30 that are not accounted for within pools. Loans accounted for individually under Subtopic 310-30 continue to be subject to the troubled debt restructuring accounting provisions within Subtopic 310-40. ASU 2010-18 is effective prospectively for modifications of loans accounted for within pools under Subtopic 310-30 occurring in the first interim or annual period ending on or after July 15, 2010. Early application is permitted. Management has evaluated these amendments and has determined that they do not have a material impact on the Company’s financial condition or results of operations.
In July 2010, FASB issued ASU No. 2010-20, which amends ASC Topic 310 to require additional disclosures regarding an entity’s long-term financing receivables that are measured at amortized cost. Specifically, entities are to provide disclosures on a disaggregated basis on two defined levels: (1) portfolio segment; and (2) class of financing receivable. The ASU makes changes to existing disclosure requirements and includes additional disclosure requirements about financing receivables, including credit quality indicators of financing receivables at the end of the reporting period by class; the aging of past due financing receivables at the end of the reporting period by class; and the nature and extent of troubled debt restructurings that occurred during the period by class and their effect on the allowance for credit losses. For public entities, the disclosure requirements of ASC Topic 310 regarding financing receivables as of the end of a reporting period are effective for interim and annual reporting periods ending on or after December 15, 2010. In January 2011, FASB issued ASU No. 2011-01 which temporarily delays the effective date of the disclosures about troubled debt restructurings in ASU No. 2010-20. This delay is intended to allow the FASB time to complete its deliberations on what constitutes a troubled debt restructuring. Because these amendments to ASC Topic 310 relate only to disclosures and do not alter GAAP, they do not impact the Company’s financial condition or results of operations.
31
FINANCIAL CONDITION
During 2010, we identified opportunities to implement our hybrid-investment strategy and grew our total assets to $1.6 billion as of December 31, 2010 from $958.1 million as of December 31, 2009, including significant increases to our Agency MBS and non-Agency MBS investment portfolios. The discussion that follows provides information about these balance sheet changes, as well as changes to the financings we use to support our investment portfolio and should be read in conjunction with the “Notes to the Consolidated Financial Statements” contained within Item 8 of Part II of this Annual Report on Form 10-K.
Agency MBS
Our Agency MBS are classified as available-for-sale and carried at fair value on our consolidated balance sheet. Activity for the years ended December 31, 2010 and December 31, 2009 is as follows:
|
2010
|
2009
|
|||||||||||||||||||||||
|
(amounts in thousands)
|
RMBS
|
CMBS
|
Total
|
RMBS
|
CMBS
|
Total
|
||||||||||||||||||
|
Beginning balance
|
$ | 594,120 | $ | – | $ | 594,120 | $ | 311,576 | $ | – | $ | 311,576 | ||||||||||||
|
Purchases
|
696,514 | 211,893 | 908,407 | 389,220 | – | 389,220 | ||||||||||||||||||
|
Principal payments
|
(272,271 | ) | (1,805 | ) | (274,076 | ) | (116,705 | ) | – | (116,705 | ) | |||||||||||||
|
Sales
|
(18,762 | ) | – | (18,762 | ) | – | – | – | ||||||||||||||||
|
Net unrealized gain (loss)
|
(6,063 | ) | (2,700 | ) | (8,763 | ) | 10,457 | – | 10,457 | |||||||||||||||
|
Net amortization and other
|
(3,795 | ) | (820 | ) | (4,615 | ) | (428 | ) | – | (428 | ) | |||||||||||||
|
Ending balance
|
$ | 989,743 | $ | 206,568 | $ | 1,196,311 | $ | 594,120 | $ | – | $ | 594,120 | ||||||||||||
The following table presents the fair value of our Agency MBS portfolio as of December 31, 2010 and December 31, 2009 by government issuer and type of interest rate on the underlying mortgage loans:
|
December 31, 2010
|
December 31, 2009
|
|||||||||||||||||||||||
|
(amounts in thousands)
|
Fannie Mae
|
Freddie Mac
|
Total
|
Fannie Mae
|
Freddie Mac
|
Total
|
||||||||||||||||||
|
Hybrid ARMs
|
$ | 496,601 | $ | 266,449 | $ | 763,050 | $ | 165,893 | $ | 129,837 | $ | 295,730 | ||||||||||||
|
ARMs
|
198,638 | 27,982 | 226,620 | 246,823 | 51,436 | 298,259 | ||||||||||||||||||
|
Fixed rate
|
206,641 |
─
|
206,641 | 131 |
─
|
131 | ||||||||||||||||||
| $ | 901,880 | $ | 294,431 | $ | 1,196,311 | $ | 412,847 | $ | 181,273 | $ | 594,120 | |||||||||||||
The following table presents the weighted average coupon (“WAC”) based on the par value of our Agency MBS portfolio as of December 31, 2010 and December 31, 2009 by weighted average months-to-reset (“MTR”):
|
December 31, 2010(1)
|
December 31, 2009(2)
|
|||||||||||||||||||||||
|
MTR
|
Par Value
|
Fair Value
|
WAC
|
Par Value
|
Fair Value
|
WAC
|
||||||||||||||||||
|
(amounts in thousands)
|
||||||||||||||||||||||||
|
0-12 months
|
$ | 216,420 | $ | 226,620 | 3.35 | % | $ | 286,192 | 298,259 | 4.41 | % | |||||||||||||
|
13-24 months
|
189,841 | 203,093 | 5.50 | % | 63,533 | 66,726 | 5.42 | % | ||||||||||||||||
|
25-36 months
|
304,713 | 323,988 | 5.10 | % | 140,708 | 149,098 | 5.33 | % | ||||||||||||||||
|
Over 36 months
|
226,329 | 235,969 | 3.81 | % | 76,108 | 79,906 | 4.44 | % | ||||||||||||||||
|
Fixed rate
|
190,584 | 206,641 | 5.41 | % | 115 | 131 | 11.29 | % | ||||||||||||||||
| $ | 1,127,887 | $ | 1,196,311 | 4.62 | % | $ | 566,656 | $ | 594,120 | 4.75 | % | |||||||||||||
|
(1)
|
As of December 31, 2010, approximately 5% of our Agency ARMs and hybrid ARMs reset based upon the level of six month LIBOR, 92% reset based on the level of one-year LIBOR and 3% reset based on the level of one-year CMT.
|
|
(2)
|
As of December 31, 2009, approximately 8% of our Agency ARMs and hybrid ARMs reset based upon the level of six month LIBOR, 82% reset based on the level of one-year LIBOR and 10% reset based on the level of one-year CMT.
|
32
Please also refer to “Net Interest Income – Agency MBS” contained within “Results of Operations” of this Item 7 as well as Note 3 of the “Notes to the Consolidated Financial Statements” contained within Item 8 of this Annual Report on Form 10-K for additional information relating to our Agency MBS.
Non-Agency MBS
Our non-Agency MBS portfolio is comprised of approximately 98% fixed-rate securities which have a combined weighted-average coupon of 6.47%. Activity related to our non-Agency MBS, which are also classified as available-for-sale and carried at fair value, is as follows:
|
2010
|
2009
|
|||||||||||||||||||||||
|
(amounts in thousands)
|
RMBS
|
CMBS(1)
|
Total
|
RMBS
|
CMBS
|
Total
|
||||||||||||||||||
|
Beginning balance
|
$ | 5,907 | $ | 118,127 | $ | 124,034 | $ | 6,259 | $ |
─
|
$ | 6,259 | ||||||||||||
|
Purchases/redemptions
|
11,893 | 183,045 | 194,938 |
─
|
114,836 | 114,836 | ||||||||||||||||||
|
Principal payments
|
(3,276 | ) | (27,669 | ) | (30,945 | ) | (511 | ) |
─
|
(511 | ) | |||||||||||||
|
Sales
|
─
|
(31,328 | ) | (31,328 | ) |
─
|
(15,047 | ) | (15,047 | ) | ||||||||||||||
|
Net unrealized gain (loss)
|
840 | 11,178 | 12,018 | 144 | (1,349 | ) | (1,205 | ) | ||||||||||||||||
|
Net (accretion) amortization and other
|
44 | (1,398 | ) | (1,354 | ) | 15 | 4,763 | 4,778 | ||||||||||||||||
|
Ending balance
|
$ | 15,408 | $ | 251,955 | $ | 267,363 | $ | 5,907 | $ | 103,203 | $ | 109,110 | ||||||||||||
|
(1)
|
Included within the CMBS beginning balance for the period ending December 31, 2010 is $14.9 million of CMBS resulting from the adoption of amendments to ASC Topic 860, effective January 1, 2010, which required us to consolidate the assets and liabilities of a securitization trust in order to remain in compliance with ASC Topic 810.
|
The following table presents our non-Agency MBS portfolio grouped by investment rating as of December 31, 2010:
|
(amounts in thousands)
|
RMBS
|
CMBS
|
Total
|
||||||||||
|
AAA
|
$ | 4,007 | $ | 201,608 | $ | 205,615 | |||||||
|
AA
|
5,101 |
─
|
5,101 | ||||||||||
| A | 6,101 | 45,340 | 51,441 | ||||||||||
|
Below A/Not Rated
|
199 | 5,007 | 5,206 | ||||||||||
| $ | 15,408 | $ | 251,955 | $ | 267,363 | ||||||||
Please also refer to “Net Interest Income – Non-Agency MBS” contained within “Results of Operations” of this Item 7 as well as Note 4 of the “Notes to the Consolidated Financial Statements” contained within Item 8 of this Annual Report on Form 10-K for additional information relating to our non-Agency MBS.
Securitized Mortgage Loans, Net
Securitized mortgage loans are comprised of loans secured by first deeds of trust on single-family residential and commercial properties. Our net basis in these loans at amortized cost, which includes discounts, premiums, deferred costs, and allowance for loan losses, is presented in the following table by the type of property collateralizing the loan.
|
(amounts in thousands)
|
December 31, 2010
|
December 31, 2009
|
||||||
|
Commercial
|
$ | 98,167 | $ | 150,371 | ||||
|
Single-family
|
54,795 | 62,100 | ||||||
| $ | 152,962 | $ | 212,471 | |||||
33
Our securitized commercial mortgage loans have decreased $52.2 million since December 31, 2009 primarily due to principal payments, net of amounts received on defeased loans, of $47.8 million. The unpaid principal balance of our securitized commercial mortgage loans as of December 31, 2010 is $99.4 million, and $14.1 million are considered seriously delinquent (60 or more days past due). We have provided approximately $4.2 million in allowance for loan losses on these commercial mortgage loans.
Our securitized single-family mortgage loans have decreased $7.3 million since December 31, 2009, primarily due to principal payments on the loans of $7.2 million, of which 51.4% were unscheduled. The unpaid principal balance of our securitized single-family mortgage loans as of December 31, 2010 is $54.2 million, and $3.7 million are considered seriously delinquent. We have provided approximately $0.3 million in allowance for loan losses on these single-family mortgage loans.
Please refer to Notes 1, 5 and 6 of the “Notes to the Consolidated Financial Statements” contained within Item 8 of this Annual Report on Form 10-K for additional information relating to our securitized mortgage loans and allowance for loan losses.
Repurchase Agreements
Repurchase agreements increased a net $595.9 million from December 31, 2009 to December 31, 2010 primarily due to additional borrowings to finance our purchases of Agency MBS and the redemption of a portion of our securitization financing bonds. Please refer to Note 8 of the “Notes to the Consolidated Financial Statements” contained within Item 8 as well as “Liquidity and Capital Resources” contained within Item 7 of this Annual report on Form 10-K for additional information relating to our repurchase agreements.
Non-Recourse Collateralized Financing
Non-recourse collateralized financing consists of securitization financing and TALF. The balances in the table below include unpaid principal, premiums, discounts, and deferred costs.
|
(amounts in thousands)
|
December 31, 2010
|
December 31, 2009
|
||||||
|
TALF:
|
||||||||
|
Fixed, secured by CMBS
|
$ | 50,639 | $ |
─
|
||||
|
Securitization financing bonds:
|
||||||||
|
Fixed, secured by commercial mortgage loans
|
35,673 | 119,713 | ||||||
|
Variable, secured by single-family mortgage loans
|
20,793 | 23,368 | ||||||
| $ | 107,105 | $ | 143,081 | |||||
The following table presents the activity related to our securitization financing secured by commercial mortgage loans for the periods indicated:
|
(amounts in thousands)
|
December 31, 2010
|
December 31, 2009
|
||||||
|
Beginning balance for the fiscal year (1)
|
$ | 134,259 | $ | 149,584 | ||||
|
Redemption of securitization financing bonds
|
(57,003 | ) |
─
|
|||||
|
Principal payments
|
(41,094 | ) | (28,430 | ) | ||||
|
Net amortization and other
|
(489 | ) | (1,441 | ) | ||||
|
Ending balance for the fiscal year
|
$ | 35,673 | $ | 119,713 | ||||
(1) Included within the beginning balance for the fiscal year ended December 31, 2010 is $14.5 million resulting from the adoption of amendments to ASC Topic 860 effective January 1, 2010, which required us to consolidate the assets and liabilities of a securitization trust in order to remain in compliance with ASC Topic 810.
In August 2010, we redeemed $56.4 million of securitization financing that we issued in 1997 collateralized by commercial mortgage loans and replaced it with repurchase agreement financing. The coupon on the redeemed securitization financing of 8.76% was replaced with repurchase agreement financing which bears interest as of December 31, 2010 at a rate of 1.36%. Please refer to Note 9 of the “Notes to the Consolidated Financial Statements” contained within this Annual
34
Report on Form 10-K for additional information relating to our non-recourse collateralized financing.
Shareholders’ Equity
Shareholders’ equity increased $123.6 million during the fiscal year ended December 31, 2010 primarily because of our issuance of 12.1 million shares of our common stock at a weighted average price of $9.93, which resulted in proceeds of $116.4 million, net of issuance costs. Additionally, increases resulted from net income of $29.5 million, but were partially offset by dividends declared on our common and preferred stock of $22.9 million.
Supplemental Investment Information
The tables below summarize the financial condition and net interest income of our investment portfolio by major category for the periods presented:
|
As of December 31, 2010
|
||||||||||||||||
|
(amounts in thousands)
|
Asset
Carrying
Basis
|
Associated
Financing(1)/ Liability Carrying Basis
|
Allocated
Shareholders’
Equity
|
% of
Shareholders’
Equity
|
||||||||||||
|
Agency RMBS
|
$ | 989,743 | $ | (869,537 | ) | $ | 120,206 | 41.1 | % | |||||||
|
Agency CMBS
|
206,568 | (150,178 | ) | 56,390 | 19.3 | % | ||||||||||
|
Non-Agency RMBS
|
15,408 | (12,126 | ) | 3,282 | 1.1 | % | ||||||||||
|
Non-Agency CMBS
|
251,955 | (200,328 | ) | 51,627 | 17.7 | % | ||||||||||
|
Securitized mortgage loans
|
152,962 | (109,119 | ) | 43,843 | 15.0 | % | ||||||||||
|
Other investments
|
1,229 | – | 1,229 | 0.4 | % | |||||||||||
|
Derivative assets (liabilities)
|
692 | (3,532 | ) | (2,840 | ) | (1.0 | )% | |||||||||
|
Cash and cash equivalents
|
18,836 | – | 18,836 | 6.4 | % | |||||||||||
|
Other assets/other liabilities
|
12,191 | (12,407 | ) | (216 | ) | – | ||||||||||
| $ | 1,649,584 | $ | (1,357,227 | ) | $ | 292,357 | 100.0 | % | ||||||||
|
As of December 31, 2009
|
||||||||||||||||
|
(amounts in thousands)
|
Asset
Carrying
Basis
|
Associated
Financing(1)/ Liability Carrying Basis
|
Allocated
Shareholders’
Equity
|
% of
Shareholders’
Equity
|
||||||||||||
|
Agency RMBS
|
$ | 594,120 | $ | (540,586 | ) | $ | 53,534 | 31.7 | % | |||||||
|
Agency CMBS
|
– | – | – | – | ||||||||||||
|
Non-Agency RMBS
|
5,907 | – | 5,907 | 3.5 | % | |||||||||||
|
Non-Agency CMBS
|
103,203 | (73,338 | ) | 29,865 | 17.7 | % | ||||||||||
|
Securitized mortgage loans
|
212,471 | (167,486 | ) | 44,985 | 26.7 | % | ||||||||||
|
Other investments
|
2,280 | – | 2,280 | 1.3 | % | |||||||||||
|
Derivative assets (liabilities)
|
1,008 | – | 1,008 | 0.6 | % | |||||||||||
|
Cash and cash equivalents
|
30,173 | – | 30,173 | 17.9 | % | |||||||||||
|
Other assets/other liabilities
|
8,900 | (7,899 | ) | 1,001 | 0.6 | % | ||||||||||
| $ | 958,062 | $ | (789,309 | ) | $ | 168,753 | 100.0 | % | ||||||||
|
(1)
|
Associated financing related to investments includes repurchase agreements, securitization financing issued to third parties, and TALF financing (the latter two of which are presented on the Company’s balance sheet as “non-recourse collateralized financing”). Associated financing for derivative instruments represents the fair value of the interest rate swap agreements in a liability position.
|
35
RESULTS OF OPERATIONS
Year Ended December 31, 2010 Compared to Year Ended December 31, 2009
Net Interest Income - Agency MBS
The following table provides a summary of the results of our Agency MBS investments and related financings by type of collateral for the periods indicated:
|
For the Year Ended December 31, 2010
|
For the Year Ended December 31, 2009
|
|||||||||||||||||||||||
|
(amounts in thousands)
|
Income (Expense) (1)
|
Average
Balance(2)
|
Effective
Yield/Rate(3)
|
Income (Expense) (1)
|
Average
Balance(2)
|
Effective
Yield/Rate(3)
|
||||||||||||||||||
|
Agency RMBS
|
$ | 20,403 | $ | 566,288 | 3.60 | % | $ | 20,962 | $ | 492,900 | 4.25 | % | ||||||||||||
|
Financing
|
(3,613 | ) | (523,260 | ) | (0.69 | %) | (2,847 | ) | (448,279 | ) | (0.64 | %) | ||||||||||||
|
Net interest income/spread
|
$ | 16,790 | 2.91 | % | $ | 18,115 | 3.61 | % | ||||||||||||||||
|
Agency CMBS
|
$ | 2,516 | $ | 65,188 | 3.84 | % | – | – | – | |||||||||||||||
|
Financing
|
(144 | ) | (47,861 | ) | (0.30 | %) | – | – | – | |||||||||||||||
|
Net interest income/spread
|
$ | 2,372 | 3.54 | % | – | – | ||||||||||||||||||
|
(1)
|
Expense amount and financing rate for Agency RMBS include interest rate swap expense.
|
|
(2)
|
Average balances are calculated as a simple average of the daily balances and exclude unrealized gains and losses.
|
|
(3)
|
Certain income and expense items of a one-time nature are not annualized for the calculation of effective yields or rates. Examples of such one-time items include retrospective adjustments of discount and premium amortization arising from adjustments of effective interest rates.
|
Although our average balance of Agency RMBS increased during the year ended December 31, 2010 compared to the year ended December 31, 2009, we experienced a decrease in our net interest income on Agency RMBS due to a decline in the effective interest yield earned during the year ended December 31, 2010. The average yield on Agency RMBS decreased due to decreases in the average coupon to 4.37% for the year ended December 31, 2010 from 4.97% for the year ended December 31, 2009. The lower average coupon reflects our acquisition of newer Agency securities with lower interest rates on the underlying collateral as well as the resetting to lower interest rates on the loans underlying our existing Agency MBS. Additionally, although our total Agency RMBS purchases for the year ended December 31, 2010 were $696.5 million, approximately 74% of those purchases were during the fourth quarter of 2010.
Our net premium amortization, which decreases interest income and the effective rate earned on the securities owned, increased 46.7% to $4.4 million for the year ended December 31, 2010 compared to $3.0 million for the year ended December 31, 2009. This increase in net premium amortization is related to our acquisition of Agency MBS at higher prices since December 31, 2009. In addition, the rate at which we amortized our premiums increased for the first and second quarters of 2010 as a result of the buyouts of delinquent mortgage loans by Fannie Mae and Freddie Mac.
During the year ended December 31, 2010, we began investing in Agency CMBS in addition to Agency RMBS. Agency CMBS offer diversification to our Agency MBS portfolio in that these investments are typically fixed rate and offer more prepayment protection in the form of lock-outs or yield maintenance than Agency RMBS. The majority of these purchases were in the last two quarters of 2010. Since they are fixed rate, Agency CMBS can increase our interest rate risk, and the premiums we pay to purchase them can increase our prepayment risk. For further discussion, please refer to Item 7A. “Quantitative and Qualitative Disclosures About Market Risk” contained within this Annual Report on Form 10-K.
Excluding interest rate swap expense, the average rate on the repurchase agreements decreased 32 basis points to 0.29% for the year ended December 31, 2010 from 0.61% for the year ended December 31, 2009. The benefit from the decrease in the average rate of borrowing costs was offset in part by an increase in the average balance of repurchase agreements because we financed our Agency MBS purchases in 2010 using repurchase agreement borrowings.
36
Net Interest Income – Non-Agency MBS
The following table provides a summary of the results of our non-Agency MBS investments and related financings by type of collateral for the periods indicated:
|
For the Year Ended December 31, 2010
|
For the Year Ended December 31, 2009
|
|||||||||||||||||||||||
|
(amounts in thousands)
|
Income (Expense) (1)
|
Average
Balance(2)
|
Effective
Yield/Rate(3)
|
Income (Expense) (1)
|
Average
Balance(2)
|
Effective
Yield/Rate(3)
|
||||||||||||||||||
|
Non-Agency RMBS
|
$ | 645 | $ | 9,635 | 6.70 | % | $ | 623 | $ | 6,724 | 9.26 | % | ||||||||||||
|
Financing
|
(94 | ) | (6,295 | ) | (1.49 | %) | – | – | – | |||||||||||||||
|
Net interest income/spread
|
$ | 551 | 5.21 | % | $ | 623 | 9.26 | % | ||||||||||||||||
|
Non-Agency CMBS
|
$ | 12,846 | $ | 183,900 | 6.99 | % | $ | 240 | $ | 5,465 | 4.40 | % | ||||||||||||
|
Financing
|
(4,130 | ) | (152,452 | ) | (2.70 | %) | (32 | ) | (1,808 | ) | (1.75 | %) | ||||||||||||
|
Net interest income/spread
|
$ | 8,716 | 4.29 | % | $ | 208 | 2.65 | % | ||||||||||||||||
|
(1)
|
Expense amount and rate for non-Agency CMBS include interest rate swap expense.
|
|
(2)
|
Average balances are calculated as a simple average of the daily balances and exclude unrealized gains and losses.
|
|
(3)
|
Certain income and expense items of a one-time nature are not annualized for the calculation of effective yields or rates. Examples of such one-time items include retrospective adjustments of discount and premium amortization arising from adjustments of effective interest rates.
|
During the year ended December 31, 2010, we substantially increased our investments in non-agency MBS to an average balance of $193.5 million compared to an average balance of $12.2 million for the year ended December 31, 2009, which resulted in an increase in interest income of $12.6 million during 2010. The majority of the additions to our non-Agency MBS portfolio for 2010 were ‘AAA’-rated CMBS which generated a higher effective yield.
Shifting our focus away from non-Agency RMBS into non-Agency CMBS during 2010 lessened the impact that the decrease in the effective yield of non-Agency RMBS had on our interest income for the year ended December 31, 2010. Our non-Agency RMBS experienced a decrease in effective yield because the loans underlying these securities reset at lower interest rates during 2010. The average coupon on our non-Agency RMBS for the year ended December 31, 2010 was 5.84% compared to 7.60% for the year ended December 31, 2009.
Non-Agency MBS is financed using recourse repurchase agreements and non-recourse securitization and TALF financings. Interest expense from recourse financing collateralized by non-Agency MBS increased to $1.6 million (excluding interest rate swap expense) for the year ended December 31, 2010 because we financed these security purchases in 2010 using repurchase agreements. The average rate on these repurchase agreements (excluding interest rate swap expense) was 1.53% for the year ended December 31, 2010.
In December 2009, we exercised certain redemption rights and redeemed ‘AAA’ rated non-Agency CMBS that we refinanced through a securitization transaction. As of December 31, 2010, the fair value of these non-Agency CMBS is $16.8 million, and the related financing balance is $14.5 million. In addition, we also purchased ‘AAA’ rated non-Agency CMBS during 2010 using non-recourse TALF financing which is fixed at a weighted average interest rate of 2.73%. The fair value of these non-Agency CMBS is $64.1 million with a financing balance of $50.6 million as of December 31, 2010.
Net Interest Income – Securitized Mortgage Loans
The following table provides a summary of the results of our securitized mortgage loans and related financing for the periods indicated:
37
|
For the Year Ended December 31, 2010
|
For the Year Ended December 31, 2009
|
|||||||||||||||||||||||
|
(amounts in thousands)
|
Income (Expense)
|
Average
Balance(1)
|
Effective
Yield/Rate(2)
|
Income (Expense)
|
Average
Balance(1)
|
Effective
Yield/Rate(2)
|
||||||||||||||||||
|
Securitized mortgage loans
|
$ | 12,234 | $ | 185,807 | 6.58 | % | $ | 17,169 | $ | 233,120 | 7.36 | % | ||||||||||||
|
Financing
|
(6,399 | ) | (136,052 | ) | (4.62 | %) | (11,819 | ) | (177,760 | ) | (5.67 | %) | ||||||||||||
|
Net interest income/spread
|
$ | 5,835 | 1.96 | % | $ | 5,350 | 1.69 | % | ||||||||||||||||
|
(1)
|
Average balance excludes funds held by trustees except proceeds from defeased loans held by trustees.
|
|
(2)
|
Certain income and expense items of a one-time nature are not annualized for the calculation of effective yields or rates. Examples of such one-time items include retrospective adjustments of discount and premium amortization arising from adjustments of effective interest rates.
|
The majority of the decrease in interest income on securitized mortgage loans is related to the lower average balance of the securitized mortgage loans outstanding for the year ended December 31, 2010, which decreased approximately $47.3 million compared to the average balance for the year ended December 31, 2009. The decrease in the average balance is primarily related to principal payments received of $55.0 million from December 31, 2009 to December 31, 2010, which includes both scheduled and unscheduled payments, net of amounts received on defeased loans. These balances have decreased year over year because we are no longer adding mortgage loans to our investment portfolio.
Interest income also declined as a result of an approximately 128 basis point decrease in the average yield on the single-family mortgage loan portion of our portfolio to 4.19% for the year ended December 31, 2010 from 5.47% for the year ended December 31, 2009. The average yield on the single-family mortgage loans declined as the interest rates on the underlying ARM loans reset at lower interest rates to a weighted average of 4.92% as of December 31, 2010 from a weighted average of 5.54% as of December 31, 2009.
The decrease in interest expense is related to a decline in the average balance of outstanding financing. The average balance declined due to the principal payments on the mortgage loan collateral noted above as well as the redemption during the third quarter of 2010 of $56.4 million of securitization financing we had issued in 1997. These bonds were collateralized by commercial mortgage loans which were originated by us.
The decrease in the average balance was offset by a decrease of $0.9 million in bond premium amortization (which reduces interest expense) for the year ended December 31, 2010 compared to the year ended December 31, 2009. The decrease in bond premium amortization was primarily related to the redemption of outstanding bonds noted above as well as changes in the estimated future cash flows resulting from changes in the prepayment expectations on the underlying loans securing the collateralized borrowings.
Other Interest (Income) Expense
Other interest expense during 2009 was primarily the result of an obligation under payment agreement which was settled in the fourth quarter of 2009.
Provision for Loan Losses
During the year ended December 31, 2010, we added approximately $1.2 million of reserves for estimated losses on our securitized mortgage loan portfolio, all of which was related to our securitized commercial mortgage loans. The reserves we provided during the year ended December 31, 2010 primarily related to a hospitality property in California that became delinquent during the year and had an unpaid principal balance of $2.4 million as of December 31, 2010. We did not provide any additional reserves for our portfolio of securitized single-family mortgage loans during the year ended December 31, 2010, because we believe that our current reserves are sufficient to cover projected losses on our securitized single-family mortgage loans. Considerations included in our estimate for losses on our single-family mortgage loans include the age of these loans, pool insurance, and other credit support. During the year ended December 31, 2009, we added approximately $0.8 million of reserves for estimated losses on our securitized mortgage loan portfolio.
38
Gain on sale of Investments, net
Gain on sale of investments, net increased by $2.7 million for the year ended December 31, 2010 compared to the year ended December 31, 2009. We recorded a gain of $2.2 million from the liquidation of a delinquent commercial mortgage loan and a gain of $0.7 million from the sale of Agency RMBS during 2010. The majority of the $0.2 million gain on sale of investments, net for the year ended December 31, 2009 resulted primarily from the net gain on sale of equity securities we owned during 2009.
Other Income, net
Other income, net for the year ended December 31, 2010 increased to $2.1 million from $0.1 million for the year ended December 31, 2009. This increase primarily consists of $0.6 million in net premium discounts related to our partial redemption of securitization financing bonds, $0.8 million in fees paid by the guarantor on certain delinquent commercial mortgage loans in connection with the repayment of those loans, and the reversal of $0.4 million in valuation impairment on a non-Agency CMBS. The reversal of the $0.4 million in valuation impairment resulted from the cash receipt received upon liquidation of a delinquent mortgage loan in the non-Agency CMBS.
Other income, net for the year ended December 31, 2009 consisted mostly of $2.4 million of income related to our equity in the income of a joint venture in which we owned a non-controlling interest of less than 50%, offset by an expense of $2.5 million related to our acquisition of all interests remaining in that joint venture prior to 2010.
General and Administrative Expenses
The increase of $2.1 million, or approximately 31.3%, in general and administrative expenses for the year ended December 31, 2010 compared to the year ended December 31, 2009 is primarily due to a $1.3 million increase in salary and benefits expenses, a $0.3 million increase in accounting and legal expenses, and a $0.3 million increase in consulting expenses. Our increased salary and benefits expense is primarily due to a fourth quarter bonus expense accrual of $1.1 million as a result of the attainment of certain key initiatives by management during 2010.
Year Ended December 31, 2009 Compared to Year Ended December 31, 2008
Net Interest Income – Agency MBS
The following table provides a summary of the results of our Agency MBS investments and related financings by type of collateral for the periods indicated:
|
For the Year Ended December 31, 2009
|
For the Year Ended December 31, 2008
|
|||||||||||||||||||||||
|
(amounts in thousands)
|
Income (Expense) (1)
|
Average
Balance(2)
|
Effective
Yield/Rate
|
Income (Expense)
|
Average
Balance(2)
|
Effective
Yield/Rate
|
||||||||||||||||||
|
Agency RMBS
|
$ | 20,962 | $ | 492,900 | 4.25 | % | $ | 6,731 | $ | 149,229 | 4.51 | % | ||||||||||||
|
Financing
|
(2,847 | ) | (448,279 | ) | (0.64 | %) | (3,978 | ) | (134,252 | ) | (2.96 | %) | ||||||||||||
|
Net interest income/spread
|
$ | 18,115 | 3.61 | % | $ | 2,753 | 1.55 | % | ||||||||||||||||
|
(1)
|
Expense amount and rate include interest rate swap expense.
|
|
(2)
|
Average balances are calculated as a simple average of the daily balances and exclude unrealized gains and losses.
|
The increase of $14.2 million in interest income on Agency MBS is related to the increase in Agency MBS investments from net purchases of approximately $389.2 million of Agency MBS during 2009, which increased the average balance on which we earned interest income. This increase is offset by a 26 basis point decrease in the average yield on Agency MBS. The lower average effective yield is primarily the result of lower yields on our purchases of Agency MBS during 2009 compared to 2008 as well as a decrease in the yield on some of our existing Agency MBS that had underlying loans resetting at lower interest rates during 2009. The effective yield was also lower due to an increase of $2.4 million in net premium amortization to $3.0 million for the year ended December 31, 2009 compared to $0.6 million for the year ended December 31, 2008.
39
The decrease of $1.1 million in interest expense on repurchase agreements financing the Agency MBS is primarily related to a 232 basis point decrease in the average rate on the repurchase agreements, which is reflective of the more readily accessible repurchase agreement financing made available to us at lower financing rates during 2009 compared to 2008. The benefit from the decrease in the average rate of borrowing costs was offset in part by a $314.0 million increase in the average balance of repurchase agreements outstanding because we used repurchase agreements to finance the acquisition of Agency MBS during 2009.
Net Interest Income – Non-Agency MBS
The following table provides a summary of the results of our non-Agency MBS investments and related financings by type of collateral for the periods indicated:
|
For the Year Ended December 31, 2009
|
For the Year Ended December 31, 2008
|
|||||||||||||||||||||||
|
(amounts in thousands)
|
Income (Expense)
|
Average
Balance(1)
|
Effective
Yield/Rate
|
Income (Expense)
|
Average
Balance(1)
|
Effective
Yield/Rate
|
||||||||||||||||||
|
Non-Agency RMBS
|
$ | 623 | $ | 6,724 | 9.26 | % | $ | 709 | 7,241 | 9.80 | % | |||||||||||||
|
Financing
|
– | – | – | – | – | – | ||||||||||||||||||
|
Net interest income/spread
|
$ | 623 | 9.26 | % | $ | 709 | 9.80 | % | ||||||||||||||||
|
Non-Agency CMBS
|
$ | 240 | $ | 5,465 | 4.40 | % | – | – | – | |||||||||||||||
|
Financing
|
(32 | ) | (1,808 | ) | (1.75 | %) | – | – | – | |||||||||||||||
|
Net interest income/spread
|
$ | 208 | 2.65 | % | – | – | ||||||||||||||||||
|
(1)
|
Average balances are calculated as a simple average of the daily balances and exclude unrealized gains and losses.
|
The yield on non-Agency RMBS decreased 54 basis points for the year ended December 31, 2009 compared to the year ended December 31, 2008 primarily because of the sale of a $2.7 million debt security in 2008 that had a yield of approximately 13.0%.
Net Interest Income – Securitized Mortgage Loans
The following table provides a summary of the results of our securitized mortgage loans and related financing for the periods indicated:
|
For the Year Ended December 31, 2009
|
For the Year Ended December 31, 2008
|
|||||||||||||||||||||||
|
(amounts in thousands)
|
Income (Expense)
|
Average
Balance(1)
|
Effective
Yield/Rate(2)
|
Income (Expense)
|
Average
Balance(1)
|
Effective
Yield/Rate(2)
|
||||||||||||||||||
|
Securitized mortgage loans
|
$ | 17,169 | $ | 233,120 | 7.36 | % | $ | 20,886 | $ | 262,482 | 7.95 | % | ||||||||||||
|
Financing
|
(11,819 | ) | (177,760 | ) | (5.67 | %) | (13,517 | ) | (193,435 | ) | (6.89 | %) | ||||||||||||
|
Net interest income/spread
|
$ | 5,350 | 1.69 | % | $ | 7,369 | 1.05 | % | ||||||||||||||||
|
(1)
|
Average balance excludes funds held by trustees except proceeds from defeased loans held by trustees.
|
|
(2)
|
Certain income and expense items of a one-time nature are not annualized for the calculation of effective yields or rates. Examples of such one-time items include retrospective adjustments of discount and premium amortization arising from adjustments of effective interest rates.
|
The majority of the decrease of $3.7 million in interest income on securitized mortgage loans is related to the lower average balance of the commercial and single-family mortgage loans outstanding for the year ended December 31, 2009, which decreased approximately $29.4 million, or 11%, compared to the average balance for the year ended December 31, 2008. The decrease in the average balance is primarily related to principal payments received of $29.1 million, which includes both scheduled and unscheduled payments net of amounts received on loans entering defeasance, during 2009.
40
The decrease of $1.7 million in interest expense on financing for securitized mortgage loans for the year ended December 31, 2009 compared to the year ended December 31, 2008 is primarily related to the decrease in the average financing rate of 122 basis points. The decrease in the average financing rate declined due to lower one-month LIBOR rates on which most of our variable-rate debt is based. Average one-month LIBOR for the year ended December 31, 2009 was 0.33% compared to 2.68% for the year ended December 31, 2008. In addition, we redeemed a portion of a securitization financing bond and replaced it with repurchase agreement financing at a lower interest rate.
Provision for Loan Losses
During the year ended December 31, 2009, we added approximately $0.8 million of reserves for estimated losses on our securitized mortgage loan portfolio. We provided $0.4 million for estimated losses on our commercial mortgage loans, which include $15.3 million of loans delinquent for 30 or more days at December 31, 2009. We also provided approximately $0.3 million for estimated losses on our portfolio of securitized single-family mortgage loans.
During the year ended December 31, 2008, we added approximately $1.0 million of reserves for estimated losses on our securitized mortgage loan portfolio. The majority of this amount was provided for estimated losses on our commercial mortgage loans, with less than $0.1 million provided for estimated losses on our portfolio of single–family mortgage loans.
Gain on Sale of Investments, Net
The gain on sale of investments for the year ended December 31, 2009 is primarily related to the sale of our remaining investment in the equity securities of publicly traded companies during the year which generated proceeds of approximately $3.6 million on equity securities in which we had a cost basis of approximately $3.4 million resulting in a gain of approximately $0.2 million. The gain of $2.3 million for the year ended December 31, 2008 is primarily related to the sale of approximately $14.2 million of equity securities during that period.
Fair Value Adjustments, Net
Fair value adjustments, net for the year ended December 31, 2009 was primarily comprised of an unfavorable fair value adjustment of $2.0 million related to the obligation under payment agreement offset by a favorable fair value adjustment of $1.9 million related to certain bond redemption rights. Prior to our acquisition of the remaining interests of the joint venture, market discount rates declined which resulted in an increase in the fair value of the obligation under payment agreement and the recognition of the unfavorable fair value adjustment of $2.0 million. When we acquired the remaining interests of the joint venture and consolidated its assets into our balance sheet, we recognized $2.7 million in redemption rights for CMBS which subsequently increased in fair value by $1.9 million.
Other (Expense) Income
Other expense of $2.3 million for the year ended December 31, 2009 was primarily related to a $2.5 million charge recognized in relation to our acquisition in November 2009 of the remaining 50.125% interest in the joint venture, Copperhead Ventures, LLC, in which we previously owned 49.875%.
Other income of $7.5 million for the year ended December 31, 2008 includes the recognition of $2.7 million of income related to the redemption of a commercial securitization bond. Of that amount approximately $1.4 million relates to the unamortized premium on the redeemed bond on the redemption date and $1.3 million relates to the release of a contingency reserve at the time of redemption. In addition, we recognized a $3.4 million benefit related to our release from an obligation to fund certain mortgage servicing payments. Other income also includes $1.2 million in dividend income we earned during 2008 on our investment in equity securities.
General and Administrative Expenses
41
Compensation and Benefits
Compensation and benefits expense increased $1.3 million to $3.6 million for the year ended December 31, 2009 from $2.3 million for the year ended December 31, 2008. Our stock-based compensation expense increased $0.8 million primarily due to an increase in the closing price of our common stock from $6.54 at December 31, 2008 to $8.73 at December 31, 2009. The remaining increase in compensation and benefits is primarily related to the salary, bonus and benefits associated with hiring two additional executive officers during the second half of 2008.
Other General and Administrative
The decrease of $0.2 million in other general and administrative expenses is primarily related to consulting and related expenses associated with expanding our investment platform and the related infrastructure that were incurred in 2008.
LIQUIDITY AND CAPITAL RESOURCES
Our primary sources of liquidity include borrowings under repurchase arrangements, non-recourse collateralized financings, and monthly principal and interest payments we receive on our investments. Additional sources may also include proceeds from the sale of investments, equity offerings, and payments received from counterparties from interest rate swap agreements. We use our liquidity to fund our investment purchases and other operating costs, to pay down borrowings, to make payments to counterparties as required under interest rate swap agreements, and to pay dividends on our common and preferred stock.
Repurchase Agreements
Our repurchase agreement borrowings generally have a term of between one and three months and carry a rate of interest based on a spread to an index such as LIBOR. Repurchase agreements are renewable at the discretion of our lenders and do not contain guaranteed roll-over terms. Given the short-term and uncommitted nature of repurchase agreement borrowings, we seek to maintain lending arrangements with multiple counterparties. We currently have 20 repurchase agreement lenders, of which we had $1.2 billion outstanding as of December 31, 2010 with 14 of these counterparties at a weighted average borrowing rate of 0.50%. As of December 31, 2009, we had $638.3 million outstanding with a weighted average borrowing rate of 0.76%.
The following table presents certain quantitative information regarding our short-term borrowings under repurchase agreements for the periods indicated:
|
For the Year Ended December 31,
|
||||||||
|
2010
|
2009
|
|||||||
|
Average balance outstanding
|
$ | 718,788 | $ | 470,956 | ||||
|
Weighted average borrowing rate
|
0.54 | % | 0.67 | % | ||||
|
Maximum balance outstanding
|
$ | 1,256,406 | $ | 638,746 | ||||
For our repurchase agreement borrowings, we are required to post margin to the lender (i.e., collateral deposits in excess of the repurchase agreement financing) in order to support the amount of the financing. When there is a decline in value of the investment collateral pledged to the lender on the repurchase agreement, the lender will make a “margin call”, requiring us to post additional collateral to compensate for any subsequent declines in the value of the investment collateral pledged. Declines in value of investments occur for any number of reasons including but not limited to changes in interest rates, changes in ratings on an investment, changes in actual or perceived liquidity of the investment, or changes in overall market risk perceptions. Additionally, values in Agency MBS will also decline from the payment delay feature of those securities as discussed further below.
Because of these requirements, we seek to maintain enough liquidity to meet margin calls. As of December 31, 2010, we had $125.0 million in unencumbered cash and unpledged Agency MBS. In addition, because non-Agency MBS are less liquid and their fair values are more volatile than Agency MBS, we are more conservative in leveraging non-Agency MBS as evidenced by our active management of our debt-to-equity ratio, which is discussed further below.
42
When the Company borrows under repurchase agreements or other recourse borrowings subject to margin calls, it generally borrows less than is permitted by its counterparties under their respective master repurchase agreements. This reduces the number and amount of potential margin calls in the event of a decline in the value of the securities pledged as collateral to the borrowings.
We believe monitoring and maintaining our debt-to-equity ratios is important to managing our liquidity. Our current operating policies provide that recourse borrowings including repurchase agreements used to finance investments will be in the range of 4 to 9 times our invested equity capital. Our current operating policies also limit our overall debt-to-equity ratio to no more than 6 times our invested equity capital and up to 10 times our equity capital invested in Agency and non-Agency MBS. Our current target is 7 to 8 times our invested equity capital in Agency MBS and 4 to 5 times our invested equity capital in non-Agency MBS.
Our repurchase agreement counterparties require us to comply with various customary operating and financial covenants, including, but not limited to, minimum net worth, minimum liquidity, and leverage requirements as well as maintaining our REIT status. In addition, some of the covenants contain cross default features, whereby default under one agreement simultaneously causes default under another agreement. To the extent that we fail to comply with the covenants contained in our financing agreements or are otherwise found to be in default under the terms of such agreements, we could be restricted from paying dividends or from engaging in other transactions that are necessary for us to maintain our REIT status. We were in compliance with all covenants as of and for the year ended December 31, 2010.
Over the past year, overall conditions in the general credit markets have improved. However, global credit markets remain fragile, and changes in economic conditions could reduce our repurchase agreement availability. Competition from other REITs, banks, hedge funds, and the federal government for capacity with our repurchase agreement lenders could also reduce our repurchase agreement availability. While we currently do not anticipate such events in the near term, a reduction in our borrowing capacity could force us to sell assets in order to repay our lenders or could otherwise restrict our ability to operate our business.
Non-recourse Collateralized Financing
Securitization financing is recourse only to the assets pledged as collateral to support the payment of the underlying bonds and is otherwise not recourse to us. The maturity of each class of securitization financing is directly affected by the rate of principal prepayments on the related collateral and is not subject to margin call risk. Due to a sizeable principal prepayment made in July using funds from loans held in defeasance, the remaining balance on our fixed-rate securitization bond became subject to redemption by us in accordance with the specific terms of the related indenture. We used a combination of cash and additional repurchase agreement borrowings to redeem $56.4 million of these bonds during the third quarter of 2010.
As indicated in Note 9 of the “Notes to the Consolidated Financial Statements”, we utilized TALF financing for a portion of our ‘AAA’ rated CMBS purchases in the first quarter of 2010. This financing is also recourse only to the assets pledged as collateral and is otherwise non-recourse to us.
Dividends
As a REIT, we are required to distribute to our shareholders amounts equal to at least 90% of our REIT taxable income for each taxable year after consideration of our tax NOL carryforward. We generally fund our dividend distributions through our cash flows from operations. If we make dividend distributions in excess of our operating cash flows during the period, whether for purposes of meeting our REIT distribution requirements or other strategic reasons, those distributions are generally funded either through our existing cash balances or through the return of principal from our investments (either through repayment or sale). Additionally, we have the option of utilizing our NOL carryforward to offset taxable income, thereby reducing our REIT distribution requirements. This would allow us to retain capital and increase our liquidity by reducing or eliminating our dividend payout to common shareholders.
43
CONTRACTUAL OBLIGATIONS AND COMMITMENTS
The following table summarizes our contractual obligations by payment due date as of December 31, 2010:
|
(amounts in thousands)
|
Payments due by period
|
|||||||||||||||||||
|
Contractual Obligations: (1)
|
Total
|
< 1 year
|
1-3 years
|
3-5 years
|
> 5 years
|
|||||||||||||||
|
Repurchase agreements (2)
|
$ | 1,234,183 | $ | 1,234,183 | $ | – | $ | – | $ | – | ||||||||||
|
Securitization financing (2) (3)
|
59,852 | 4,430 | 12,292 | 37,089 | 6,041 | |||||||||||||||
|
TALF financing (2) (3)
|
50,727 | – | 50,727 | – | – | |||||||||||||||
|
Operating lease obligations
|
475 | 154 | 321 | – | – | |||||||||||||||
|
Total
|
$ | 1,345,237 | $ | 1,238,767 | $ | 63,340 | $ | 37,089 | $ | 6,041 | ||||||||||
|
(1)
|
As the master servicer for certain of the series of non-recourse securitization financing securities which we have issued, and certain loans which have been securitized but for which we are not the master servicer, we have an obligation to advance scheduled principal and interest on delinquent loans in accordance with the underlying servicing agreements should the primary servicer of the loan fail to make such advance. Such advance amounts are generally repaid in the same month as they are made or shortly thereafter, and so the contractual obligation with respect to these advances is excluded from the above table. As of December 31, 2010, outstanding servicing advances were $0.2 million compared to $0.3 million as of December 31, 2009.
|
|
(2)
|
Amounts presented exclude interest on the related obligations.
|
|
(3)
|
Represents financing that is non-recourse to us as the debt is payable solely from loans and securities pledged as collateral. Payments due by period were estimated based on the principal repayments forecast for the underlying loans and securities, substantially all of which is used to repay the associated financing outstanding.
|
OFF-BALANCE SHEET ARRANGEMENTS
We do not believe that any off-balance sheet arrangements exist that are reasonably likely to have a material current or future effect on our financial condition, results of operations, liquidity or capital resources.
FORWARD-LOOKING STATEMENTS
Certain written statements in this Annual Report on Form 10-K that are not historical facts constitute “forward-looking statements” within the meaning of Section 27A of the 1933 Act and Section 21E of the Exchange Act. Statements in this report addressing expectations, assumptions, beliefs, projections, future plans and strategies, future events, developments that we expect or anticipate will occur in the future, and future operating results are forward-looking statements. Forward-looking statements are based upon management’s beliefs, assumptions, and expectations as of the date of this report regarding future events and operating performance, taking into account all information currently available to us, and are applicable only as of the date of this report. Forward-looking statements generally can be identified by use of words such as “believe”, “expect”, “anticipate”, “estimate”, “plan” “may”, “will”, “intend”, “should”, “could” or similar expressions. We caution readers not to place undue reliance on our forward-looking statements, which are not historical facts and may be based on projections, assumptions, expectations, and anticipated events that do not materialize. Except as required by law, we are not obligated to, and do not intend to, update or revise any forward-looking statement whether as a result of new information, future events, or otherwise.
We make forward-looking statements in this Annual Report on Form 10-K regarding:
|
·
|
Our business and investment strategy including our ability to generate acceptable risk-adjusted returns;
|
|
·
|
Our financing and hedging strategy;
|
|
·
|
Our investment portfolio composition and target investments;
|
|
·
|
Our investment portfolio performance, including the value and yields of our investment portfolio;
|
|
·
|
Our liquidity and ability to access financing, and the anticipated availability and cost of financing;
|
|
·
|
Our use of our tax NOL carryfoward;
|
|
·
|
Market, industry and economic trends; and
|
|
·
|
Interest rates.
|
44
Forward-looking statements are inherently subject to risks, uncertainties and other factors that could cause our actual results to differ materially from historical results or from any results expressed or implied by such forward-looking statements. Not all of these risks and other factors are known to us. New risks and uncertainties arise over time, and it is not possible to predict those events or how they may affect us. The projections, assumptions, expectations or beliefs upon which the forward-looking statements are based can also change as a result of these risks or other factors. If such a risk or other factor materializes in future periods, our business, financial condition, liquidity and results of operations may vary materially from those expressed or implied in our forward-looking statements.
While it is not possible to identify all factors, some of the factors that may cause actual results to differ from historical results or from any results expressed or implied by forward-looking statements, or that may cause our projections, assumptions, expectations or beliefs to change, include the following:
|
·
|
the risks and uncertainties referenced in this Annual Report on Form 10-K, particularly those set forth under Item 1A. “Risk Factors”;
|
|
·
|
our ability to find suitable reinvestment opportunities;
|
|
·
|
changes in economic conditions;
|
|
·
|
changes in interest rates and interest rate spreads;
|
|
·
|
our investment portfolio performance particularly as it relates to cash flow, prepayment rates and credit performance;
|
|
·
|
the cost and availability of financing;
|
|
·
|
the cost and availability of new equity capital;
|
|
·
|
changes in our use of leverage;
|
|
·
|
the quality of performance of third-party servicer providers of our loans and loans underlying our securities;
|
|
·
|
the level of defaults by borrowers on loans we have securitized;
|
|
·
|
changes in our industry;
|
|
·
|
increased competition;
|
|
·
|
changes in government regulations affecting our business;
|
|
·
|
government initiatives to support the U.S financial system and U.S. housing and real estate markets;
|
|
·
|
GSE reform or other government policies and actions; and
|
|
·
|
an ownership shift under Section 382 of the Code that impacts the use of our tax NOL carryforward.
|
CRITICAL ACCOUNTING POLICIES
The discussion and analysis of our financial condition and results of operations are based in large part upon our consolidated financial statements, which have been prepared in accordance with GAAP. The preparation of the financial statements requires management to make estimates and assumptions that affect the reported amounts of assets and liabilities and disclosure of contingent assets and liabilities at the date of the financial statements and the reported amounts of revenue and expenses during the reported period. Actual results may differ from the estimated amounts we have recorded.
Critical accounting policies are defined as those that are reflective of significant judgments or uncertainties, and which may result in materially different results under different assumptions and conditions, or the application of which may have a material impact on our financial statements.
Consolidation of Subsidiaries. The consolidated financial statements represent our accounts after the elimination of all inter-company transactions. We consolidate entities in which we own more than 50% of the voting equity and control does not rest with others and variable interest entities in which we are determined to be the primary beneficiary in accordance with Accounting Standards Codification (“ASC” or “Codification”) Topic 810. We follow the equity method of accounting for investments with greater than 20% and less than a 50% interest in partnerships and corporate joint ventures or when we are able to influence the financial and operating policies of the investee but own less than 50% of the voting equity.
45
Securitization. We have securitized mortgage loans in a securitization transaction by transferring financial assets to a wholly owned trust, and the trust issues non-recourse securitization financing bonds pursuant to an indenture. Generally, we retain some form of control over the transferred assets, and/or the trust is not deemed to be a qualified special purpose entity. In instances where the trust is deemed not to be a qualified special purpose entity, the trust is included in our consolidated financial statements. For accounting and tax purposes, the loans and securities financed through the issuance of bonds in a securitization financing transaction are treated as our assets (presented as securitized mortgage loans), and the associated bonds issued are treated as our debt as securitization financing. We may retain certain of the bonds issued by the trust, and we have generally transferred collateral in excess of the bonds issued. This excess is typically referred to as over-collateralization. Each securitization trust generally provides us the right to redeem, at our option, the remaining outstanding bonds prior to their maturity date.
Other-than-Temporary Impairments. We evaluate all securities in our investment portfolio for other-than-temporary impairments. A security is generally defined to be other-than-temporarily impaired if the carrying value of such security exceeds its estimated fair value. Under the provisions of ASC Topic 320, a security is considered to be other-than-temporarily impaired if the present value of cash flows expected to be collected is less than the security’s amortized cost basis (the difference being defined as the credit loss) or if the fair value of the security is less than the security’s amortized cost basis and the investor intends, or more-likely-than-not will be required, to sell the security before recovery of the security’s amortized cost basis. The charge to earnings is limited to the amount of credit loss if the investor does not intend, and it is more-likely-than-not that it will not be required, to sell the security before recovery of the security’s amortized cost basis. Any remaining difference between fair value and amortized cost is recognized in other comprehensive income, net of applicable taxes. Otherwise, the entire difference between fair value and amortized cost is charged to earnings. In certain instances, as a result of the other-than-temporary impairment analysis, the recognition or accrual of interest will be discontinued and the security will be placed on non-accrual status. Securities normally are not placed on non-accrual status if the servicer continues to advance on the impaired mortgage loans in the security.
Allowance for Loan Losses. An allowance for loan losses has been estimated and established for currently existing and probable losses for mortgage loans that are considered impaired. Provisions made to increase the allowance are charged as a current period expense. Commercial mortgage loans are secured by income-producing real estate and are evaluated individually for impairment when the debt service coverage ratio on the mortgage loan is less than 1:1 or when the mortgage loan is delinquent. An allowance may be established for a particular impaired commercial mortgage loan. Commercial mortgage loans not evaluated for individual impairment or not deemed impaired are evaluated for a general allowance. Certain of the commercial mortgage loans are covered by mortgage loan guarantees that limit the Company’s exposure on these mortgage loans. Single-family mortgage loans are considered homogeneous and are evaluated on a pool basis for a general allowance.
We consider various factors in determining our specific and general allowance requirements. Such factors include whether a loan is delinquent, our historical experience with similar types of loans, historical cure rates of delinquent loans, and historical and anticipated loss severity of the mortgage loans as they are liquidated. The factors may differ by mortgage loan type (e.g., single-family versus commercial) and collateral type (e.g., multifamily versus office property). The allowance for loan losses is evaluated and adjusted periodically by management based on the actual and estimated timing and amount of probable credit losses as well as industry loss experience.
Derivatives. As required by ASC Topic 815, we record all derivatives on our balance sheet at fair value. The accounting for changes in the fair value of each derivative depends on whether we designate the derivative as a trading position or as a hedging position for a financial instrument or forecasted transaction. If we designate a derivative as a trading position, changes in its fair value are immediately recognized in the current period’s consolidated statement of income as trading income or loss. If we designate a derivative as a hedging position and we satisfy certain criteria established within ASC Topic 815, then we may apply hedge accounting to record changes in the derivative’s fair value. Hedge accounting involves evaluating the effectiveness of the hedge against the financial instrument or transaction being hedged. The ineffective portion of the hedge relationship is immediately recognized in the current period’s statement of income as a portion of other income (expense) while the effective portion of the hedge relationship is reported in accumulated other comprehensive income (“AOCI”) and later reclassified into the statement of income as a portion of interest expense in the same period during which the hedged financial instrument or transaction affects earnings. If our management decides to terminate any or all derivatives designated as hedging positions or if our management decides to sell or terminate the underlying financial instruments being hedged, any changes in fair value of the associated derivatives recorded in other
46
comprehensive income at the time of termination will be recognized in that period’s statement of income. In addition, our interest rate agreements contain covenants which require us to maintain a minimum level of equity and earnings as well as maintain our REIT status. If we breach any of these covenants, our counterparties will be allowed to immediately terminate any interest rate agreement they have with us. At the time of this termination, any changes in fair value of the derivatives recorded in other comprehensive income will be recognized in that period’s statement of income.
Fair Value. As defined in ASC Topic 820, the fair value of a financial instrument is the exchange price in an orderly transaction, that is not a forced liquidation or distressed sale, between market participants to sell an asset or transfer a liability in the market in which the reporting entity would transact for the asset or liability, that is, the principal or most advantageous market for the asset/liability. The transaction to sell the asset or transfer the liability is a hypothetical transaction at the measurement date, considered from the perspective of a market participant that holds the asset/liability. ASC Topic 820 provides a consistent definition of fair value which focuses on exit price and prioritizes, within a measurement of fair value, the use of market-based inputs over entity-specific inputs. In addition, ASC Topic 820 provides a framework for measuring fair value and establishes a three-level hierarchy for fair value measurements based upon the transparency of inputs to the valuation of an asset or liability as of the measurement date.
The three levels of valuation hierarchy established by ASC Topic 820 are as follows:
|
·
|
Level 1 — Inputs are unadjusted, quoted prices in active markets for identical assets or liabilities at the measurement date. Our investments included in Level 1 fair value generally are equity securities listed in active markets.
|
|
·
|
Level 2 — Inputs (other than quoted prices included in Level 1) are either directly or indirectly observable for the asset or liability through correlation with market data at the measurement date and for the duration of the instrument’s anticipated life. Fair valued assets and liabilities that are generally included in this category are Agency MBS, which are valued based on the average of multiple dealer quotes that are active in the Agency MBS market, and interest rate swaps, which are valued using a third-party pricing service, and the valuations are tested with internally developed models that apply readily observable market variables.
|
|
·
|
Level 3 — Inputs reflect management’s best estimate of what market participants would use in pricing the asset or liability at the measurement date. Consideration is given to the risk inherent in the valuation technique and the risk inherent in the inputs to the model. Generally, assets and liabilities carried at fair value and included in this category are non-Agency MBS, delinquent property tax receivables and the obligation under payment agreement liability.
|
Estimates of fair value for financial instruments are based primarily on management’s judgment. Since the fair value of our financial instruments is based on estimates, actual fair values recognized may differ from those estimates recorded in the consolidated financial statements. Please see Note 10 of the “Notes to the Consolidated Financial Statements” contained within this Annual Report on Form 10-K for additional information regarding ASC Topic 820 with respect to specific assets.
We account for our Agency MBS and non-Agency securities in accordance with ASC Topic 320, which requires that investments in debt and equity securities be designated as either “held-to-maturity,” “available-for-sale” or “trading” at the time of acquisition. All of our securities are designated as available-for-sale and are carried at their fair value with unrealized gains and losses excluded from earnings and reported in other comprehensive (loss)/income as a component of shareholders’ equity. We determine the fair value of our non-Agency securities by discounting the estimated future cash flows derived from pricing models that utilize information such as the security’s coupon rate, estimated prepayment speeds, expected weighted average life, collateral composition, estimated future interest rates, expected losses, and credit enhancement as well as certain other relevant information. The fair value of our other investment securities is based upon prices obtained from a third-party pricing service and broker quotes.
Although we generally intend to hold our investment securities until maturity, we may, from time to time, sell any of our securities as part of the overall management of our business. The available-for-sale designation provides us with the flexibility to sell any of our investment securities. Upon the sale of an investment security, any unrealized gain or loss is reclassified out of AOCI to earnings as a realized gain or loss using the specific identification method.
47
|
ITEM 7A.
|
QUANTITATIVE AND QUALITATIVE DISCLOSURES ABOUT MARKET RISK
|
We seek to manage various risks inherent in our business strategy, which include interest rate, prepayment, reinvestment, market value, credit, and liquidity risks. We do not seek to avoid risk completely, but rather, we attempt to manage these risks while earning an acceptable risk-adjusted return for our shareholders.
Interest Rate Risk
Our primary market risk is interest rate risk, which we seek to actively manage through our investment purchases, financing alternatives, and hedging techniques. Investing in interest-rate sensitive investments on a leveraged basis subjects us to interest rate risk because of the difference in the timing of resets of interest rates on our investments versus the associated borrowings, as well as differences in the indices on which the investments reset versus the borrowings.
Interest Rate Reset Risk. The rates on our borrowings will generally reset on a more frequent basis than the interest rates on our investments. During a period of rising short-term interest rates, as our borrowings reset more quickly than our investments, our net interest income will decrease. Conversely, net interest income may increase following a fall in short-term interest rates. Any increase or decrease in our net interest income for at least a portion of our investment portfolio may be temporary as the yields on Agency ARMs and securitized adjustable-rate mortgage loans adjust to new interest rates after a lag period.
Net interest income may be impacted by the proceeds or costs of interest rate swap or cap agreements. We enter into these agreements with the intention of hedging our exposure to rising costs of our borrowings from future interest rate increases. Interest rate swap agreements generally result in interest savings in a rising interest rate environment when the current market interest rate we receive on the swap (which generally is equal to one-month LIBOR) rises higher than the stated fixed rate we pay on the notional amount for each interest rate swap agreement. Alternatively, a declining or stable interest rate environment generally results in interest expense equal to the difference between the stated fixed rate we pay less the current market interest rate we receive.
The table below sets forth the time frames for the prospective reset of interest rates on our investments and the associated borrowings on these investments as of December 31, 2010. This table includes the impact of our hedging instruments (which as of December 31, 2010 were all interest rate swaps), but excludes future changes to our portfolio and the potential impact of prepayments on our investments.
|
Investments
|
Borrowings
|
|||||||||||||||
|
(amounts in thousands)
|
Amounts (1)
|
Percent
|
Amounts
|
Percent
|
||||||||||||
|
Fixed Rate
|
$ | 578,662 | 35.7 | % | $ | 86,312 | 6.5 | % | ||||||||
|
Adjustable Rate:
|
||||||||||||||||
|
0-12 months
|
280,623 | 17.3 | % | 934,976 | 69.7 | % | ||||||||||
|
13-24 months
|
203,093 | 12.5 | % | 125,000 | 9.3 | % | ||||||||||
|
25-36 months
|
323,988 | 20.0 | % | – | – | |||||||||||
|
Over 36 months
|
235,969 | 14.5 | % | 195,000 | 14.5 | % | ||||||||||
|
Total
|
$ | 1,622,335 | 100.0 | % | $ | 1,341,288 | 100.0 | % | ||||||||
|
(1)
|
The investment amount represents the fair value of the related securities and amortized cost basis of the related loans, excluding any related allowance for loan losses.
|
Interest Rate Cap Risk. Our adjustable-rate investments have interest rates which are predominantly based upon six-month and one-year LIBOR, and generally contain periodic or lifetime interest rate caps which often limit the amount by which the interest rate may reset. Periodic caps on our investments typically range from 1-5% annually, and lifetime caps are typically 5%. Generally, the interest rates on our borrowings (which are generally repurchase agreements) used to finance
48
these assets are based on one-month LIBOR, reset every 30 to 90 days, and will not have periodic or lifetime interest rate caps. In addition, certain of our securitized mortgage loans have a fixed rate of interest and are financed with borrowings with interest rates that adjust monthly.
The following table presents information about the lifetime and interim interest rate caps on our adjustable-rate Agency MBS portfolio as of December 31, 2010:
|
Lifetime Interest Rate Caps on ARM MBS
|
Interim Interest Rate Caps on ARM MBS
|
|||
|
% of Total
|
% of Total
|
|||
|
9.0% to 10.0%
|
49.15%
|
1.0%
|
1.64%
|
|
|
>10.0% to 11.0%
|
37.10%
|
2.0%
|
27.34%
|
|
|
>11.0% to 12.0%
|
13.75%
|
5.0%
|
71.02%
|
|
|
100.00%
|
100.00%
|
|||
Effect of Changes in Interest Rates on Net Interest Income and Market Value. The tables below provide a sensitivity analysis for the projected net interest income and the projected market value of our investments (for those carried at fair value on our balance sheet, and including interest rate swaps) as they existed as of December 31, 2010 based on changes in market interest rates as set forth in the table. The analysis presented in the first table below shows the estimated impact of instantaneous parallel shifts in interest rates as of December 31, 2010, assuming a static investment portfolio. The impact is measured as a percentage change in projected net interest income and a percentage change in projected market value. The sensitivity analysis presented in the second table below assumes the same instantaneous parallel shift in interest rates as in the first table while also assuming a concurrent instantaneous change in mortgage spreads of 25 and 50 basis points. The impact of the change in interest rates and mortgage interest rate spreads is measured based on the percentage change in market value only for our investments and also assumes a static investment portfolio. The percentage change in market value is based on a LIBOR option-adjusted spread model.
The projections below for percentage change in projected net income are based on the projected net income on the investment portfolio over the next twenty-four months. The projections are based upon a variety of assumptions including investment prepayment speeds, credit performance, and the availability of financing over the projection period. Further, the table below assumes a static portfolio throughout the projected period and does not consider any reinvestment or rebalancing of the investment portfolio or additional hedging activity by the Company. Changes in our types of investments, changes in future interest rates, changes in the shape of the yield curve, the availability of financing and/or the mix of our investments and financings may cause actual results to differ significantly from the modeled results. There can be no assurance that assumed events used for the model below will occur, or that other events will not occur, that would affect the outcomes; therefore, the tables below and all related disclosures constitute forward-looking statements.
|
As of December 31, 2010
|
||
|
Basis Point Change in
Interest Rates
|
Percentage change in projected net interest income(1)
|
Percentage change in projected market value(2)
|
|
+100
|
(6.3)%
|
(1.4)%
|
|
+50
|
(2.5)%
|
(0.7)%
|
|
0
|
–
|
–
|
|
-50
|
(0.4)%
|
0.6%
|
|
-100
|
(8.2)%
|
1.1%
|
|
(1)
|
Includes changes in interest expense from the financings for our investments as well as our interest rate swaps.
|
|
(2)
|
Includes changes in market value of our interest rate swaps, but excludes changes in market value of our financings because they are not carried at fair value on our balance sheet.
|
The following table presents the expected percentage change in the projected market value of our investments (including interest rate swaps, but excluding our financings because they are not carried at fair value on our balance sheet), as they existed as of December 31, 2010, assuming a static portfolio as well as an instantaneous parallel shift in interest rates and a concurrent instantaneous change in mortgage spreads of 25 and 50 basis points as of that date:
49
|
Basis Point Change in Interest Rates
|
Basis Point Change in Mortgage Spreads
|
||||
|
-50
|
-25
|
0
|
+25
|
+50
|
|
|
+100
|
(0.2)%
|
(0.8)%
|
(1.4)%
|
(2.1)%
|
(2.9)%
|
|
+50
|
0.6%
|
(0.0)%
|
(0.7)%
|
(1.4)%
|
(2.1)%
|
|
0
|
1.2%
|
0.6%
|
–
|
(0.7)%
|
(1.5)%
|
|
-50
|
1.8%
|
1.2%
|
0.6%
|
(0.1)%
|
(0.9)%
|
|
-100
|
2.3%
|
1.7%
|
1.1%
|
0.4%
|
(0.4)%
|
The two tables above are intended to demonstrate our sensitivity to interest rates based on our investments and associated financings and interest rate swap positions as of December 31, 2010. The impact of changing interest rates on net interest income and market value of our investments can change significantly when interest rates change beyond the above levels or if market expectations of future interest rates begin to materially change. In addition, other factors will impact the net interest income from and market value of our interest rate-sensitive investments and hedging instruments, such as prepayment rates, the shape of the yield curve, market expectations as to future interest rate changes and other market conditions. Accordingly, interest income would likely differ from that shown above, and such difference might be material.
Prepayment and Reinvestment Risk
Prepayment risk is the risk of an early, unscheduled return of principal on an investment. We are subject to prepayment risk from premiums paid on our investments. We are also subject to prepayment risk for discounts accepted on the issuance of securitization financings. In general, purchase premiums on our investments and discounts on our financings are amortized as a reduction in interest income or an increase in interest expense using the effective yield method under GAAP, adjusted for the actual and anticipated prepayment activity of the investment and/or financing. An increase in the actual or expected rate of prepayment will typically accelerate the amortization of purchase premiums or issuance discounts, thereby reducing the yield/interest income earned on such assets or increasing the cost of such financing.
The majority of the premiums on our securities are on Agency RMBS and CMBS. We amortize the premiums on our Agency RMBS and CMBS using a retrospective level-yield method based on the actual principal payments we have received on the securities and forecasted prepayment rates. As of December 31, 2010, we are currently forecasting one-year prepayment rates on our Agency RMBS of 20.9% and Agency CMBS of 0%. The loans underlying our Agency CMBS generally have prepayment provisions, such as prepayment lock-outs or yield maintenance payment requirements. These provisions create an economic disincentive for the loans to prepay, thereby reducing the prepayments on the related securities, and compensate us in the event that there are prepayments.
|
Agency
|
Non-Agency
|
|||||||||||||||
|
(amounts in thousands)
|
RMBS
|
CMBS
|
RMBS
|
CMBS
|
||||||||||||
|
Principal/par value (including principal receivable)
|
$ | 941,108 | $ | 190,511 | $ | 16,101 | $ | 247,501 | ||||||||
|
Unamortized premium, net
|
43,740 | 18,757 | (977 | ) | (5,944 | ) | ||||||||||
|
Amortized cost basis
|
$ | 984,848 | $ | 209,268 | $ | 15,124 | $ | 241,557 | ||||||||
|
Amortized cost as a percentage of par value
|
104.7 | % | 109.9 | % | 93.9 | % | 97.6 | % | ||||||||
We seek to manage our prepayment risk by diversifying our investments, seeking investments which we believe will have superior prepayment performance, and investing in securities which have some sort of prepayment prohibition or yield maintenance (as is the case with Agency CMBS).
We are also subject to reinvestment risk as a result of the prepayment, repayment or sale of our investments. Yields on assets in which we invest now are generally lower than yields on existing assets that we may sell or which may be repaid, due to lower overall interest rates and more competition for these as investment assets. As a result, our interest income may decline in the future, thereby reducing earnings per share. In order to maintain our investment portfolio size and our earnings, we need to reinvest our capital into new interest-earning assets. If we are unable to find suitable reinvestment opportunities, interest income on our investment portfolio and investment cash flows could be negatively impacted.
50
Credit Risk
Credit risk is the risk that we will not receive all contractual amounts due on investments that we have purchased or funded due to default by the borrower or due to a deficiency in proceeds from the liquidation of the collateral securing the obligation. To mitigate credit risk, certain of our investments, such as Agency MBS and portions of our securitized mortgage loan portfolio, contain a guaranty of payment from third parties. For example, our Agency MBS have credit risk to the extent that Fannie Mae or Freddie Mac fails to remit payments on these MBS for which they have issued a guaranty of payment. In addition, certain of our securitized mortgage loans have “pool” guarantees by which certain parties provide guarantees of repayment on pools of loans up to a limited amount. The following tables present information as of December 31, 2010 and December 31, 2009 with respect to our investments and the amounts guaranteed, if applicable.
|
December 31, 2010
|
||||||||||
|
Investment
(amounts in thousands)
|
Accounting Basis
|
Amount of Guaranty
|
Guarantor
|
Credit Rating of Guarantor (1)
|
||||||
|
With Guaranty of Payment
|
||||||||||
|
Agency MBS
|
$ | 1,196,311 | $ | 1,127,887 |
Fannie Mae/Freddie Mac
|
AAA
|
||||
|
Securitized mortgage loans:
|
||||||||||
|
Commercial
|
46,741 | 6,619 |
American International Group
|
BBB
|
||||||
|
Single-family
|
18,465 | 18,169 |
PMI/GEMICO
|
Caa2/Baa3
|
||||||
|
Defeased loans
|
3,289 | 3,306 |
Fully secured with cash
|
|||||||
|
Without Guaranty of Payment
|
||||||||||
|
Non-Agency MBS
|
267,363 | – | ||||||||
|
Securitized mortgage loans:
|
||||||||||
|
Commercial
|
52,338 | – | ||||||||
|
Single-family
|
36,599 | – | ||||||||
|
Other investments
|
1,229 | – | ||||||||
| 1,622,335 | ||||||||||
|
Allowance for loan losses
|
(4,470 | ) | – | |||||||
|
Total investments
|
$ | 1,617,865 | $ | 1,155,981 | ||||||
|
(1)
|
Reflects lowest rating by three nationally-recognized ratings agencies for the senior unsecured debt of the guarantor.
|
51
|
December 31, 2009
|
||||||||||||
|
Investment
(amounts in thousands)
|
Accounting Basis
|
Amount of Guaranty
|
Guarantor
|
Credit Rating of Guarantor (1)
|
||||||||
|
With Guaranty of Payment
|
||||||||||||
|
Agency MBS
|
$ | 594,120 | $ | 566,656 |
Fannie Mae/Freddie Mac
|
AAA
|
||||||
|
Securitized mortgage loans:
|
||||||||||||
|
Commercial
|
59,684 | 6,359 |
American International Group
|
A3 | ||||||||
|
Single-family
|
20,369 | 20,029 |
PMI/GEMICO
|
Caa2
|
||||||||
|
Defeased loans
|
17,492 | 17,588 |
Fully secured with cash
|
|||||||||
|
Without Guaranty of Payment
|
||||||||||||
|
Non-Agency MBS
|
109,110 | – | ||||||||||
|
Securitized mortgage loans:
|
||||||||||||
|
Commercial
|
77,130 | – | ||||||||||
|
Single-family
|
42,008 | – | ||||||||||
|
Other investments
|
2,376 | – | ||||||||||
| 922,289 | 610,632 | |||||||||||
|
Allowance for loan losses
|
(4,308 | ) | – | |||||||||
|
Total investments
|
$ | 917,981 | $ | 610,632 | ||||||||
|
(1)
|
Reflects lowest rating by three nationally-recognized ratings agencies for the senior unsecured debt of the guarantor.
|
The following tables present information for securitized mortgage loans as of December 31, 2010 and December 31, 2009.
|
As of December 31, 2010
|
||||||||||||||||||||
|
Investment
(amounts in thousands)
|
Amortized Cost Basis of Loans
|
Average Seasoning
(in years)
|
Current Loan-to-Value based on Original Appraised Value
|
Amortized Cost Basis of Delinquent Loans(1)
|
Delinquency %
|
|||||||||||||||
|
Commercial mortgage loans
|
$ | 98,167 | 14 | 45 | % | $ | 12,147 | 16.0 | % | |||||||||||
|
Single-family mortgage loans
|
54,795 | 17 | 48 | % | 5,277 | (2) | 10.1 | % | ||||||||||||
|
As of December 31, 2009
|
||||||||||||||||||||
|
Investment
(amounts in thousands)
|
Amortized Cost Basis of Loans
|
Average Seasoning
(in years)
|
Current Loan-to-Value based on Original Appraised Value
|
Amortized Cost Basis of Delinquent Loans(1)
|
Delinquency %
|
|||||||||||||||
|
Commercial mortgage loans
|
$ | 150,017 | 13 | 47 | % | $ | 15,165 | 9.77 | % | |||||||||||
|
Single-family mortgage loans
|
62,100 | 15 | 50 | % | 6,284 | (2) | 9.96 | % | ||||||||||||
|
(1)
|
Loans contractually delinquent by 30 or more days, which include loans on non-accrual status.
|
|
(2)
|
As of December 31, 2010, approximately $1.7 million of the delinquent single-family loans are pool insured and, of the remaining $3.8 million, $2.2 million of the loans made a payment within the 90 days prior to December 31, 2010. As of December 31, 2009, approximately $1.9 million of the delinquent single-family loans were pool insured and, of the remaining $4.4 million, $1.9 million of the loans made a payment within the 90 days prior to December 31, 2009.
|
52
Additionally, the mortgage loans collateralizing our securitized portfolio are typically well-seasoned, thereby lowering our average loan-to-value (“LTV”) ratio and decreasing our risk of loss. Other efforts to mitigate credit risk include maintaining a risk management function that monitors and oversees the performance of the servicers of the mortgage loans, as well as providing an allowance for loan loss as required by GAAP.
Market Value Risk
Market value risk generally represents the risk of loss from the change in the value of a financial instrument due to fluctuations in interest rates and changes in the perceived risk in owning such financial instrument. Regardless of whether an investment is carried at fair value or at historical cost in our financial statements, we will monitor the change in its market value. In particular, we will monitor changes in the value of investments which collateralize a repurchase agreement for liquidity management and other purposes. We attempt to manage this risk by managing our exposure to factors that can impact the market value of our investments such as changes in interest rates. For example, the types of derivative instruments we are currently using to hedge the interest rates on our debt tend to increase in value when our investment portfolio decreases in value. See the analysis in the “Interest Rate Risk” section above, which presents the estimated change in our portfolio given changes in market interest rates and mortgage spreads.
Liquidity Risk
We have liquidity risk principally from the use of recourse repurchase agreements to finance our ownership of securities. Our repurchase agreements provide a source of uncommitted short-term financing that finances a longer-term asset, thereby creating a mismatch between the maturity of the asset and of the associated financing. Our repurchase agreements are renewable at the discretion of our lenders and do not contain guaranteed roll-over terms. If we fail to repay the lender at maturity, the lender has the right to immediately sell the collateral and pursue us for any shortfall if the sales proceeds are inadequate to cover the repurchase agreement financing.
At the inception of the repurchase agreement, we post margin to the lender in order to support the amount of the financing and to give the lender a cushion against fluctuations in the value of the collateral pledged. The repurchase agreement lender may also request that we post additional margin (“margin calls”) in the event of a decline in market value of the collateral pledged, which may happen for market reasons or as a result of the payment delay feature on Agency MBS as discussed in “Liquidity and Capital Resources” in Item 7 of Part II to this Annual Report on Form 10-K. Such margin calls could adversely change our liquidity position. If we fail to meet this margin call, the lender has the right to terminate the repurchase agreement and immediately sell the collateral. If the proceeds from the sale of the collateral are insufficient to repay the entire amount of the repurchase agreement outstanding, we would be required to repay any shortfall. All of our repurchase agreements provide that the lender is responsible for obtaining collateral valuations, which must be from a generally recognized source agreed to by both us and the lender, or the most recent closing quotation of such source. Given the uncommitted nature of repurchase agreement financing and the varying collateral requirements, we cannot assume that we will always be able to roll over our repurchase agreements as they mature.
We attempt to mitigate liquidity risk in several ways. We typically pledge only Agency MBS and higher credit quality non-Agency MBS to secure our outstanding repurchase agreements. In general the market value of these investments, particularly Agency MBS, is not as volatile as lower rated investments, thereby reducing the likelihood of subsequent margin calls. However, in 2008 as a result of the crisis in the financial and credit markets, all securities experienced significant market value volatility, and in some cases, repurchase agreement lenders would not accept non-Agency MBS as collateral.
Other ways in which we attempt to manage liquidity risk include pledging collateral with a fair value in excess of the margin required by our counterparties and maintaining a cushion of cash and unencumbered Agency MBS to meet potential margin calls on our repurchase agreements. We also attempt to maintain unused capacity under our existing repurchase agreement credit lines with multiple counterparties which protects us in the event of a counterparty’s failure to renew existing repurchase agreements either with favorable terms or at all. As discussed within the “Liquidity and Capital Resources” section, we also manage our debt-to-equity ratio in order to remain within a range which management determines to be risk appropriate given current economic and market conditions.
53
For additional information regarding our use of forward-looking statements and risks that could cause actual events or results to differ materially from results expressed or implied in such forward-looking statements, see Item 1A, “Risk Factors” as well as “Forward-Looking Statements” set forth in Item 7, “Management’s Discussion and Analysis of Financial Condition and Results of Operations” of this Annual Report on Form 10-K.
|
ITEM 8.
|
FINANCIAL STATEMENTS AND SUPPLEMENTARY DATA
|
Our consolidated financial statements and the related notes, together with the Reports of the Independent Registered Public Accounting Firm thereon, are set forth on pages F-1 through F-30 of this Annual Report on Form 10-K.
|
ITEM 9.
|
CHANGES IN AND DISAGREEMENTS WITH ACCOUNTANTS ON ACCOUNTING AND FINANCIAL DISCLOSURE
|
Not applicable.
|
ITEM 9A.
|
CONTROLS AND PROCEDURES
|
Evaluation of Disclosure Controls and Procedures
Our management evaluated, with the participation of our principal executive officer and principal financial officer, the effectiveness of our disclosure controls and procedures, as defined in Rule 13a-15(e) under the Exchange Act, as of the end of the period covered by this report (the “Evaluation Date”). Based on this evaluation, our principal executive officer and principal financial officer concluded that our disclosure controls and procedures were effective as of the Evaluation Date.
Changes in Internal Control over Financial Reporting
There were no changes in our internal control over financial reporting during the fourth quarter of 2010 that materially affected, or are reasonably likely to materially affect, our internal control over financial reporting.
Management’s Report on Internal Control over Financial Reporting
Our management is responsible for establishing and maintaining adequate internal control over financial reporting as defined in Rule 13a-15(f) of the Exchange Act. Because of inherent limitations, a system of internal control over financial reporting may not prevent or detect misstatements. Also, projections of any evaluation of effectiveness to future periods are subject to the risk that controls may become inadequate due to change in conditions, or that the degree of compliance with policies or procedures may deteriorate.
Our management evaluated, with the participation of our principal executive officer and principal financial officer, the effectiveness of our internal control over financial reporting using the criteria set forth by the Committee of Sponsoring Organizations of the Treadway Commission (“COSO”) in “Internal Control-Integrated Framework.” Based on that evaluation, our principal executive officer and principal financial officer concluded that our internal control over financial reporting was effective as of the end of the period covered by this report.
The Company’s internal control over financial reporting as of December 31, 2010 has been audited by BDO USA, LLP, the independent registered public accounting firm that also audited the Company’s consolidated financial statements included in this Annual Report on Form 10-K. The attestation report of BDO USA, LLP on the effectiveness of the Company’s internal control over financial reporting appears on page F-4 herein.
|
ITEM 9B.
|
OTHER INFORMATION
|
None.
54
|
|
PART III
|
|
ITEM 10.
|
DIRECTORS, EXECUTIVE OFFICERS AND CORPORATE GOVERNANCE
|
The information about our executive officers required by this item is included in Part I, Item I of this Annual Report on Form 10-K under the caption “Executive Officers of the Registrant”. The remaining information required by Item 10 will be included in our definitive proxy statement for use in connection with our 2011 Annual Meeting of Shareholders (“2011 Proxy Statement”) under the captions “Election of Directors,” “Committees of the Board,” “Code of Ethics” and “Section 16(a) Beneficial Ownership Reporting Compliance,” and is incorporated herein by reference.
|
ITEM 11.
|
EXECUTIVE COMPENSATION
|
The information required by Item 11 is included in the 2011 Proxy Statement under the captions “Compensation Committee,” “Executive Compensation” and “Directors’ Compensation,” and is incorporated herein by reference.
|
ITEM 12.
|
SECURITY OWNERSHIP OF CERTAIN BENEFICIAL OWNERS AND MANAGEMENT AND RELATED STOCKHOLDER MATTERS
|
The following table sets forth information as of December 31, 2010, with respect to the Company’s equity compensation plans, under which shares of our common stock are authorized for issuance.
|
Plan Category
|
Number of Securities to Be Issued upon Exercise of Outstanding Options, Warrants and Rights (1)
|
Weighted-Average
Exercise Price of Outstanding Options, Warrants and Rights
|
Number of Securities Remaining Available for Future Issuance Under Equity Compensation Plans(2)
|
|||||||||
|
Equity Compensation Plans Approved by Shareholders:
|
||||||||||||
|
2004 Stock Incentive Plan
|
45,000 | $ | 8.75 | – | ||||||||
|
2009 Stock and Incentive Plan
|
– | – | 2,452,970 | |||||||||
|
Equity Compensation Plans Not Approved by Shareholders(3)
|
– | – | – | |||||||||
|
Total
|
45,000 | $ | 8.75 | 2,452,970 | ||||||||
|
(1)
|
Amount includes all outstanding stock option awards, but excludes all outstanding stock appreciation rights, which can only be settled for cash.
|
|
(2)
|
Reflects shares available to be granted under the 2009 Stock and Incentive Plan in the form of stock options, stock appreciation rights, stock awards, dividend equivalent rights, performance share awards, stock units and incentive awards. No new awards may be issued under the 2004 Stock Incentive Plan on or after May 13, 2009.
|
|
(3)
|
The Company does not have any equity compensation plans that have not been approved by shareholders.
|
The remaining information required by Item 12 is included in the 2011 Proxy Statement under the caption “Ownership of Stock” and is incorporated herein by reference.
|
ITEM 13.
|
CERTAIN RELATIONSHIPS AND RELATED TRANSACTIONS, AND DIRECTOR INDEPENDENCE
|
The information required by Item 13 is included in the 2011 Proxy Statement under the captions “Related Person Transactions” and “Director Independence,” and is incorporated herein by reference.
55
|
ITEM 14.
|
PRINCIPAL ACCOUNTANT FEES AND SERVICES
|
The information required by Item 14 is included in the 2011 Proxy Statement under the caption “Audit Information,” and is incorporated herein by reference.
56
PART IV
|
ITEM 15.
|
EXHIBITS, FINANCIAL STATEMENT SCHEDULES
|
(a) Documents filed as part of this report:
|
1. and 2.
|
Financial Statements and Schedules
The information required by this section of Item 15 is set forth in the Consolidated Financial Statements and Reports of Independent Registered Public Accounting Firm beginning at page F-1 of this Annual Report on Form 10-K. The index to the Financial Statements is set forth at page F-2 of this
Annual Report on Form 10-K.
|
|
3.
|
Exhibits
|
|
Number
|
Exhibit
|
|
3.1
|
Restated Articles of Incorporation, effective July 9, 2008 (incorporated herein by reference to Exhibit 3.1 to Dynex’s Current Report on Form 8-K filed July 11, 2008).
|
|
3.2
|
Amended and Restated Bylaws, effective March 26, 2008 (incorporated herein by reference to Exhibit 3.2 to Dynex’s Current Report on Form 8-K filed April 1, 2008).
|
|
8.1
|
Opinion of Troutman Sanders, LLP (incorporated herein by reference to Exhibit 8.1 to Dynex’s Annual Report on Form 10-K for the year ended December 31, 2008).
|
|
10.1*
|
Dynex Capital, Inc. 2004 Stock Incentive Plan (incorporated herein by reference to Exhibit 10.1 to Dynex’s Annual Report on Form 10-K for the year ended December 31, 2004).
|
|
10.1.1*
|
409A Amendment to Dynex Capital, Inc. 2004 Stock Incentive Plan, dated December 31, 2008 (incorporated herein by reference to Exhibit 10.1.1 to Dynex’s Annual Report on Form 10-K for the year ended December 31, 2008).
|
|
10.2*
|
Form of Stock Option Agreement for Non-Employee Directors under the Dynex Capital, Inc. 2004 Stock Incentive Plan (incorporated herein by reference to Exhibit 10.2 to Dynex’s Quarterly Report on Form 10-Q for the quarter ended June 30, 2005).
|
|
10.3*
|
Form of Stock Appreciation Rights Agreement for Senior Executives under the Dynex Capital, Inc. 2004 Stock Incentive Plan (incorporated herein by reference to Exhibit 10.3 to Dynex’s Quarterly Report on Form 10-Q for the quarter ended June 30, 2005).
|
|
10.5*
|
Severance Agreement between Dynex Capital, Inc. and Stephen J. Benedetti dated June 11, 2004 (incorporated herein by reference to Exhibit 10.5 to Dynex’s Annual Report on Form 10-K for the year ended December 31, 2007).
|
57
|
Number
|
Exhibit
|
|
10.5.1*
|
409A Amendment to Severance Agreement between Dynex Capital, Inc. and Stephen J. Benedetti, dated December 31, 2008 (incorporated herein by reference to Exhibit 10.1.1 to Dynex’s Annual Report on Form 10-K for the year ended December 31, 2008).
|
|
10.6*
|
Employment Agreement, effective as of March 1, 2010, between Dynex Capital, Inc. and Thomas B. Akin (incorporated herein by reference to Exhibit 10.6 to Dynex’s Current Report on Form 8-K filed March 16, 2010).
|
|
10.7*
|
Dynex Capital, Inc. 401(k) Overflow Plan, effective July 1, 1997 (incorporated herein by reference to Exhibit 10.7 to Dynex’s Quarterly Report on Form 10-Q for the quarter ended March 31, 2008).
|
|
10.8
|
Sales Agreement, dated as of March 16, 2009, between Dynex Capital, Inc. and Cantor Fitzgerald & Co. (incorporated herein by reference to Exhibit 10.8 to Dynex’s Annual Report on Form 10-K for the year ended December 31, 2008).
|
|
10.9*
|
Dynex Capital, Inc. Performance Bonus Program, as approved August 5, 2010 (incorporated herein by reference to Exhibit 10.9 to Dynex’s Quarterly Report on Form 10-Q for the quarter ended June 30, 2010).
|
|
10.11*
|
Dynex Capital, Inc. 2009 Stock and Incentive Plan, effective as of May 13, 2009 (incorporated herein by reference to Appendix A to Dynex’s Proxy Statement filed April 3, 2009).
|
|
10.12*
|
Employment Agreement, dated as of July 31, 2009, between Dynex Capital, Inc. and Byron L. Boston (incorporated herein by reference to Exhibit 10.12 to Dynex’s Quarterly Report on Form 10-Q for the quarter ended September 30, 2009).
|
|
10.13
|
Assignment and Transfer of Interest in Copperhead Ventures, LLC, dated as of November 20, 2009, between DBAH Capital, LLC, and Issued Holdings Capital Corporation (incorporated herein by reference to Exhibit 10.13 to Dynex’s Current Report on Form 8-K filed November 24, 2009).
|
|
10.14
|
Equity Distribution Agreement between Dynex Capital, Inc. and JMP Securities LLC, dated June 24, 2010 (incorporated herein by reference to Exhibit 10.14 to Dynex’s Current Report on Form 8-K filed June 24, 2010).
|
|
10.15
|
Underwriting Agreement, dated December 14, 2010, by and between Dynex Capital, Inc. and JMP Securities LLC (incorporated herein by reference to Exhibit 10.15 to Dynex’s Current Report on Form 8-K filed December 17, 2010).
|
|
10.16*
|
Form of Restricted Stock Agreement for Executive Officers under the Dynex Capital, Inc. 2009 Stock and Incentive Plan (filed herewith).
|
|
10.17*
|
Base salaries for named executive officers of Dynex Capital, Inc. (filed herewith).
|
58
|
Number
|
Exhibit
|
|
10.18*
|
Non-employee directors’ annual compensation for Dynex Capital, Inc. (filed herewith).
|
| 10.19 |
Underwriting Agreement, dated March 4, 2011, by and among Dynex Capital, Inc., Merrill Lynch, Pierce, Fenner & Smith Incorporated and Credit Suisse Securities (USA) LLC (incorporated herein by reference to Exhibit 1.1 to Dynex’s Current Report on Form 8-K filed March 9, 2011).
|
|
21.1
|
List of consolidated entities of Dynex (filed herewith).
|
|
23.1
|
Consent of BDO USA, LLP (filed herewith).
|
|
31.1
|
Certification of principal executive officer pursuant to Section 302 of the Sarbanes-Oxley Act of 2002 (filed herewith).
|
|
31.2
|
Certification of principal financial officer pursuant to Section 302 of the Sarbanes-Oxley Act of 2002 (filed herewith).
|
|
32.1
|
Certification of principal executive officer and principal financial officer pursuant to Section 906 of the Sarbanes-Oxley Act of 2002 (filed herewith).
|
________________________________________
* Denotes management contract.
(b) Exhibits: See Item 15(a)(3) above.
(c) Financial Statement Schedules: None.
59
SIGNATURES
Pursuant to the requirements of Section 13 or 15(d) of the Securities Exchange Act of 1934, the registrant has duly caused this report to be signed on its behalf by the undersigned, thereunto duly authorized.
|
DYNEX CAPITAL, INC.
|
||
|
(Registrant)
|
||
|
March 16, 2011
|
/s/ Stephen J. Benedetti
|
|
|
Stephen J. Benedetti, Executive Vice President, Chief Operating Officer and Chief Financial Officer
|
||
Pursuant to the requirements of the Securities Exchange Act of 1934, this report has been signed below by the following persons on behalf of the registrant and in the capacities and on the dates indicated.
|
Signature
|
Title
|
Date
|
|
/s/ Thomas B. Akin
|
Chairman and Chief Executive Officer
|
March 16, 2011
|
|
Thomas B. Akin
|
and Director
|
|
|
(Principal Executive Officer)
|
||
|
/s/ Stephen J. Benedetti
|
Executive Vice President, Chief
|
March 16, 2011
|
|
Stephen J. Benedetti
|
Operating Officer and Chief Financial Officer
|
|
|
(Principal Financial Officer)
|
||
|
/s/ Jeffrey L. Childress
|
Vice President and Controller
|
March 16, 2011
|
|
Jeffrey L. Childress
|
(Principal Accounting Officer)
|
|
|
/s/ Michael R. Hughes
|
Director
|
March 16, 2011
|
|
Michael R. Hughes
|
||
|
/s/ Barry Idgaloff
|
Director
|
March 16, 2011
|
|
Barry Igdaloff
|
||
|
/s/ Daniel K. Osborne
|
Director
|
March 16, 2011
|
|
Daniel K. Osborne
|
||
|
/s/ James C. Wheat, III
|
Director
|
March 16, 2011
|
|
James C. Wheat, III
|
||
60
DYNEX CAPITAL, INC.
CONSOLIDATED FINANCIAL STATEMENTS AND
REPORTS OF INDEPENDENT REGISTERED PUBLIC ACCOUNTING FIRM
For Inclusion in Form 10-K
Annual Report Filed with
Securities and Exchange Commission
December 31, 2010
F-1
DYNEX CAPITAL, INC.
INDEX TO FINANCIAL STATEMENTS
|
Page
|
||
|
Reports of Independent Registered Public Accounting Firm
|
F-3
|
|
|
Consolidated Balance Sheets – As of December 31, 2010 and 2009
|
F-5
|
|
|
Consolidated Statements of Income – For the Years ended December 31, 2010, 2009 and 2008
|
F-6
|
|
|
Consolidated Statements of Comprehensive Income – For the Years ended December 31, 2010, 2009 and 2008
|
F-7
|
|
|
Consolidated Statements of Shareholders’ Equity – Years ended December 31, 2010, 2009 and 2008
|
F-8
|
|
|
Consolidated Statements of Cash Flows – Years ended December 31, 2010, 2009 and 2008
|
F-9
|
|
|
Notes to the Consolidated Financial Statements
|
F-10
|
F-2
Report of Independent Registered Public Accounting Firm
Board of Directors and Stockholders
Dynex Capital, Inc.
Glen Allen, Virginia
We have audited the accompanying consolidated balance sheets of Dynex Capital, Inc. (Dynex) as of December 31, 2010 and 2009 and the related consolidated statements of income and comprehensive income, shareholders’ equity, and cash flows for each of the three years in the period ended December 31, 2010. These financial statements are the responsibility of the Company’s management. Our responsibility is to express an opinion on these financial statements based on our audits.
We conducted our audits in accordance with the standards of the Public Company Accounting Oversight Board (United States). Those standards require that we plan and perform the audit to obtain reasonable assurance about whether the financial statements are free of material misstatement. An audit also includes examining, on a test basis, evidence supporting the amounts and disclosures in the financial statements, assessing the accounting principles used and significant estimates made by management, as well as evaluating the overall financial statement presentation. We believe that our audits provide a reasonable basis for our opinion.
In our opinion, the consolidated financial statements referred to above present fairly, in all material respects, the financial position of Dynex at December 31, 2010 and 2009, and the results of its operations and its cash flows for each of the three years in the period ended December 31, 2010, in conformity with accounting principles generally accepted in the United States of America.
We also have audited, in accordance with the standards of the Public Company Accounting Oversight Board (United States), Dynex’s internal control over financial reporting as of December 31, 2010, based on criteria established in Internal Control – Integrated Framework issued by the Committee of Sponsoring Organizations of the Treadway Commission (COSO) and our report dated March 16, 2011 expressed an unqualified opinion thereon.
BDO USA, LLP
Richmond, Virginia
March 16, 2011
F-3
Report of Independent Registered Public Accounting Firm
Board of Directors and Stockholders
Dynex Capital, Inc.
Glen Allen, Virginia
We have audited Dynex Capital, Inc.’s (Dynex) internal control over financial reporting as of December 31, 2010, based on criteria established in Internal Control – Integrated Framework issued by the Committee of Sponsoring Organizations of the Treadway Commission (the COSO criteria). Dynex’s management is responsible for maintaining effective internal control over financial reporting and for its assessment of the effectiveness of internal control over financial reporting, included in the accompanying Item 9A, Management’s Report on Internal Control Over Financial Reporting. Our responsibility is to express an opinion on the company’s internal control over financial reporting based on our audit.
We conducted our audit in accordance with the standards of the Public Company Accounting Oversight Board (United States). Those standards require that we plan and perform the audit to obtain reasonable assurance about whether effective internal control over financial reporting was maintained in all material respects. Our audit included obtaining an understanding of internal control over financial reporting, assessing the risk that a material weakness exists, and testing and evaluating the design and operating effectiveness of internal control based on the assessed risk. Our audit also included performing such other procedures as we considered necessary in the circumstances. We believe that our audit provides a reasonable basis for our opinion.
A company’s internal control over financial reporting is a process designed to provide reasonable assurance regarding the reliability of financial reporting and the preparation of financial statements for external purposes in accordance with generally accepted accounting principles. A company’s internal control over financial reporting includes those policies and procedures that (1) pertain to the maintenance of records that, in reasonable detail, accurately and fairly reflect the transactions and dispositions of the assets of the company; (2) provide reasonable assurance that transactions are recorded as necessary to permit preparation of financial statements in accordance with generally accepted accounting principles, and that receipts and expenditures of the company are being made only in accordance with authorizations of management and directors of the company; and (3) provide reasonable assurance regarding prevention or timely detection of unauthorized acquisition, use, or disposition of the company’s assets that could have a material effect on the financial statements.
Because of its inherent limitations, internal control over financial reporting may not prevent or detect misstatements. Also, projections of any evaluation of effectiveness to future periods are subject to the risk that controls may become inadequate because of changes in conditions, or that the degree of compliance with the policies or procedures may deteriorate.
In our opinion, Dynex maintained, in all material respects, effective internal control over financial reporting as of December 31, 2010, based on the COSO criteria.
We also have audited, in accordance with the standards of the Public Company Accounting Oversight Board (United States), the consolidated balance sheets of Dynex Capital, Inc. as of December 31, 2010 and 2009, and the related consolidated statements of income and comprehensive income, shareholders’ equity, and cash flows for each of the three years in the period ended December 31, 2010 and our report dated March 16, 2011 expressed an unqualified opinion thereon.
BDO USA, LLP
Richmond, Virginia
March 16, 2011
F-4
DYNEX CAPITAL, INC.
CONSOLIDATED BALANCE SHEETS
(amounts in thousands except share data)
|
December 31, 2010
|
December 31, 2009
|
|||||||
|
ASSETS
|
||||||||
|
Agency MBS (including pledged of $1,090,174 and $575,386, respectively)
|
$ | 1,196,311 | $ | 594,120 | ||||
|
Non-Agency MBS (including pledged of $259,350 and $82,770, respectively)
|
267,363 | 109,110 | ||||||
|
Securitized mortgage loans, net
|
152,962 | 212,471 | ||||||
|
Other investments, net
|
1,229 | 2,280 | ||||||
| 1,617,865 | 917,981 | |||||||
|
Cash and cash equivalents
|
18,836 | 30,173 | ||||||
|
Derivative assets
|
692 | 1,008 | ||||||
|
Accrued interest receivable
|
6,105 | 4,583 | ||||||
|
Other assets, net
|
6,086 | 4,317 | ||||||
|
Total assets
|
$ | 1,649,584 | $ | 958,062 | ||||
|
LIABILITIES AND SHAREHOLDERS’ EQUITY
|
||||||||
|
Liabilities:
|
||||||||
|
Repurchase agreements
|
$ | 1,234,183 | $ | 638,329 | ||||
|
Non-recourse collateralized financing
|
107,105 | 143,081 | ||||||
|
Derivative liabilities
|
3,532 | – | ||||||
|
Accrued interest payable
|
1,079 | 1,208 | ||||||
|
Accrued dividends payable
|
8,192 | 4,207 | ||||||
|
Other liabilities
|
3,136 | 2,484 | ||||||
| 1,357,227 | 789,309 | |||||||
|
Commitments and Contingencies (Note 13)
|
||||||||
|
Shareholders’ equity:
|
||||||||
|
Preferred stock, par value $.01 per share, 9.5% cumulative
convertible Series D; none and 4,221,539 shares issued and
outstanding, respectively
|
– | 41,749 | ||||||
|
Common stock, par value $.01 per share, 100,000,000 shares
authorized; 30,342,897 and 13,931,512 shares issued and outstanding, respectively
|
303 | 139 | ||||||
|
Additional paid-in capital
|
538,304 | 379,717 | ||||||
|
Accumulated other comprehensive income
|
10,057 | 10,061 | ||||||
|
Accumulated deficit
|
(256,307 | ) | (262,913 | ) | ||||
| 292,357 | 168,753 | |||||||
|
Total liabilities and shareholders’ equity
|
$ | 1,649,584 | $ | 958,062 | ||||
See notes to the consolidated financial statements.
F-5
DYNEX CAPITAL, INC.
CONSOLIDATED STATEMENTS OF INCOME
(amounts in thousands except per share data)
|
For the Year Ended December 31,
|
||||||||||||
|
2010
|
2009
|
2008
|
||||||||||
|
Interest income:
|
||||||||||||
|
Agency MBS
|
$ | 22,920 | $ | 20,962 | $ | 6,731 | ||||||
|
Non-Agency MBS
|
13,491 | 863 | 709 | |||||||||
|
Securitized mortgage loans
|
12,234 | 17,169 | 20,886 | |||||||||
|
Other investments
|
125 | 226 | 642 | |||||||||
|
Cash and cash equivalents
|
11 | 16 | 685 | |||||||||
| 48,781 | 39,236 | 29,653 | ||||||||||
|
Interest expense:
|
||||||||||||
|
Repurchase agreements
|
6,368 | 3,288 | 4,079 | |||||||||
|
Non-recourse collateralized financing
|
7,989 | 9,801 | 13,416 | |||||||||
|
Other interest (income) expense
|
(1 | ) | 1,582 | 1,611 | ||||||||
| 14,356 | 14,671 | 19,106 | ||||||||||
|
Net interest income
|
34,425 | 24,565 | 10,547 | |||||||||
|
Provision for loan losses
|
(1,379 | ) | (782 | ) | (991 | ) | ||||||
|
Net interest income after provision for loan losses
|
33,046 | 23,783 | 9,556 | |||||||||
|
Gain on sale of investments, net
|
2,891 | 171 | 2,316 | |||||||||
|
Fair value adjustments, net
|
294 | 205 | 7,147 | |||||||||
|
Other income, net
|
2,058 | 138 | 1,734 | |||||||||
|
General and administrative expenses:
|
||||||||||||
|
Compensation and benefits
|
(4,930 | ) | (3,626 | ) | (2,341 | ) | ||||||
|
Other general and administrative expenses
|
(3,887 | ) | (3,090 | ) | (3,291 | ) | ||||||
|
Net income
|
29,472 | 17,581 | 15,121 | |||||||||
|
Preferred stock dividends
|
(3,061 | ) | (4,010 | ) | (4,010 | ) | ||||||
|
Net income to common shareholders
|
$ | 26,411 | $ | 13,571 | $ | 11,111 | ||||||
|
Weighted average common shares:
|
||||||||||||
|
Basic
|
17,595 | 13,088 | 12,166 | |||||||||
|
Diluted
|
20,919 | 17,311 | 12,170 | |||||||||
|
Net income per common share:
|
||||||||||||
|
Basic
|
$ | 1.50 | $ | 1.04 | $ | 0.91 | ||||||
|
Diluted
|
$ | 1.41 | $ | 1.02 | $ | 0.91 | ||||||
|
Dividends declared per common share
|
$ | 0.98 | $ | 0.92 | $ | 0.71 | ||||||
See notes to the consolidated financial statements.
F-6
DYNEX CAPITAL, INC.
CONSOLIDATED STATEMENTS OF COMPREHENSIVE INCOME
(amounts in thousands)
|
For the Year Ended December 31,
|
||||||||||||
|
2010
|
2009
|
2008
|
||||||||||
|
Net income
|
$ | 29,472 | $ | 17,581 | $ | 15,121 | ||||||
|
Other comprehensive income:
|
||||||||||||
|
Available-for-sale securities:
|
||||||||||||
|
Change in market value
|
4,603 | 9,976 | (2,725 | ) | ||||||||
|
Reclassification of net gain on sale of investments
|
(779 | ) | (171 | ) | (2,317 | ) | ||||||
|
Reclassification of loss on acquisition of jointventure
|
– | 2,490 | – | |||||||||
|
Reclassification adjustment for joint venture’s other-than-temporary impairment
|
– | 707 | – | |||||||||
|
Net unrealized (loss) gain on cash flow hedginginstruments
|
(3,828 | ) | 1,008 | – | ||||||||
|
Total other comprehensive income (loss)
|
(4 | ) | 14,010 | (5,042 | ) | |||||||
|
Comprehensive income
|
29,468 | 31,591 | 10,079 | |||||||||
|
Dividends declared on preferred stock
|
(3,061 | ) | (4,010 | ) | (4,010 | ) | ||||||
|
Comprehensive income to common shareholders
|
$ | 26,407 | $ | 27,581 | $ | 6,069 | ||||||
See notes to the consolidated financial statements.
F-7
DYNEX CAPITAL, INC.
CONSOLIDATED STATEMENTS OF SHAREHOLDERS’ EQUITY
(amounts in thousands)
|
Preferred
Stock
|
Common
Stock
|
Additional
Paid-in
Capital
|
Accumulated Other
Comprehensive (Loss)
Income
|
Accumulated
Deficit
|
Total
|
|||||||||||||||||||
|
Balance as of January 1, 2008
|
$ | 41,749 | $ | 121 | $ | 366,716 | $ | 1,093 | $ | (267,743 | ) | $ | 141,936 | |||||||||||
|
Common stock issuance
|
– | – | 13 | – | – | 13 | ||||||||||||||||||
|
Restricted stock vesting
|
– | 1 | 88 | – | – | 89 | ||||||||||||||||||
|
Cumulative effect of adoption of new accounting principle
|
– | – | – | – | 943 | 943 | ||||||||||||||||||
|
Net income
|
– | – | – | – | 15,121 | 15,121 | ||||||||||||||||||
|
Dividends on preferred stock
|
– | – | – | – | (4,010 | ) | (4,010 | ) | ||||||||||||||||
|
Dividends on common stock
|
– | – | – | – | (8,641 | ) | (8,641 | ) | ||||||||||||||||
|
Other comprehensive loss
|
– | – | – | (5,042 | ) | – | (5,042 | ) | ||||||||||||||||
|
Balance as of December 31, 2008
|
41,749 | 122 | 366,817 | (3,949 | ) | (264,330 | ) | 140,409 | ||||||||||||||||
|
Common stock issuance
|
– | 17 | 12,782 | – | – | 12,799 | ||||||||||||||||||
|
Granting and vesting of restricted stock
|
– | – | 118 | – | – | 118 | ||||||||||||||||||
|
Net income
|
– | – | – | – | 17,581 | 17,581 | ||||||||||||||||||
|
Dividends on preferred stock
|
– | – | – | – | (4,010 | ) | (4,010 | ) | ||||||||||||||||
|
Dividends on common stock
|
– | – | – | – | (12,154 | ) | (12,154 | ) | ||||||||||||||||
|
Other comprehensive income
|
– | – | – | 14,010 | – | 14,010 | ||||||||||||||||||
|
Balance as of December 31, 2009
|
41,749 | 139 | 379,717 | 10,061 | (262,913 | ) | 168,753 | |||||||||||||||||
|
Common stock issuance
|
– | 122 | 116,948 | – | – | 117,070 | ||||||||||||||||||
|
Granting and vesting of restricted stock
|
– | – | 60 | – | – | 60 | ||||||||||||||||||
|
Conversion of preferred shares to common shares
|
(41,749 | ) | 42 | 41,707 | – | – | – | |||||||||||||||||
|
Capitalized expenses associated with stock issuances
|
– | – | (128 | ) | – | – | (128 | ) | ||||||||||||||||
|
Cumulative effect of adoption of new accounting principle
|
– | – | – | – | 12 | 12 | ||||||||||||||||||
|
Net income
|
– | – | – | – | 29,472 | 29,472 | ||||||||||||||||||
|
Dividends on preferred stock
|
– | – | – | – | (3,061 | ) | (3,061 | ) | ||||||||||||||||
|
Dividends on common stock
|
– | – | – | – | (19,817 | ) | (19,817 | ) | ||||||||||||||||
|
Other comprehensive income
|
– | – | – | (4 | ) | – | (4 | ) | ||||||||||||||||
|
Balance as of December 31, 2010
|
$ | – | $ | 303 | $ | 538,304 | $ | 10,057 | $ | (256,307 | ) | $ | 292,357 | |||||||||||
See notes to the consolidated financial statements.
F-8
DYNEX CAPITAL, INC.
CONSOLIDATED STATEMENTS OF CASH FLOWS
(amounts in thousands)
See notes to the consolidated financial statements.
F-9
NOTES TO THE CONSOLIDATED FINANCIAL STATEMENTS
DYNEX CAPITAL, INC.
(amounts in thousands except share and per share data)
NOTE 1 – SUMMARY OF SIGNIFICANT ACCOUNTING POLICIES
Basis of Presentation and Reclassifications
The accompanying consolidated financial statements have been prepared in accordance with the generally accepted accounting principles in the United States (“GAAP”) and the instructions to the Annual Report on Form 10-K. Certain items in the prior years’ consolidated balance sheets and consolidated statements of income have been reclassified to conform to the current year’s presentation. The Company’s consolidated balance sheets now present separately its accrued dividends payable which was previously included in the balance presented for “Other Liabilities”. In prior years, the Company’s consolidated statements of income presented “Obligation under payment agreement” and “Equity in income (loss) of joint venture, net” which are both related to a joint venture in which the Company owned less than 50% interest. The Company no longer participates in any joint venture, and therefore these amounts for prior years are now included within “Other interest (income) expense, net” and “Other income, net”, respectively. These reclassifications did not have an effect on reported total assets, total liabilities, net interest income, or net income for any of the periods presented.
Consolidation of Subsidiaries
The consolidated financial statements include the accounts of the Company, its qualified REIT subsidiaries and its taxable REIT subsidiary. The consolidated financial statements represent the Company’s accounts after the elimination of intercompany balances and transactions. The Company consolidates entities in which it owns more than 50% of the voting equity and control does not rest with others and variable interest entities in which it is determined to be the primary beneficiary in accordance with Financial Accounting Standards Board (“FASB”) Accounting Standards Codification (“ASC”) Topic 810. The Company follows the equity method of accounting for investments with greater than a 20% and less than a 50% interest in partnerships and corporate joint ventures or when it is able to influence the financial and operating policies of the investee but owns less than 50% of the voting equity.
Use of Estimates
The preparation of financial statements in conformity with GAAP requires management to make estimates and assumptions that affect the reported amounts of assets and liabilities and the disclosure of contingent assets and liabilities at the date of the financial statements as well as the reported amounts of revenue and expenses during the reported period. Actual results could differ from those estimates. The most significant estimates used by management include but are not limited to fair value measurements of its investments, allowance for loan losses, other-than-temporary impairments, commitments and contingencies, and amortization of premiums and discounts. These items are discussed further below within this note to the consolidated financial statements.
Federal Income Taxes
The Company believes it has complied with the requirements for qualification as a REIT under the Internal Revenue Code of 1986, as amended (the “Code”). As such, the Company believes that it qualifies as a REIT for federal income tax purposes, and it generally will not be subject to federal income tax on the amount of its income or gain that is distributed as dividends to shareholders. The Company uses the calendar year for both tax and financial reporting purposes. There may be differences between taxable income and income computed in accordance with GAAP.
F-10
Cash Equivalents
Cash and cash equivalents include cash on hand and highly liquid investments with original maturities of three months or less.
Investments
The Company’s investments include Agency mortgage-backed securities (“MBS”), non-Agency MBS, securitized mortgage loans, and other investments.
Agency MBS. Agency MBS are comprised of residential mortgage-backed securities (“RMBS”) and commercial mortgage-backed securities (“CMBS”) issued or guaranteed by a federally chartered corporation, such as Federal National Mortgage Corporation, or Fannie Mae, or Federal Home Loan Mortgage Corporation, or Freddie Mac, or an agency of the U.S. government, such as Government National Mortgage Association, or Ginnie Mae. The Company’s Agency RMBS are comprised primarily of hybrid Agency ARMs and Agency ARMs. Hybrid Agency ARMs are MBS collateralized by hybrid adjustable-rate mortgage loans which are loans that have a fixed rate of interest for a specified period (typically three to ten years) and which then adjust their interest rate at least annually to an increment over a specified interest rate index as further discussed below. Agency ARMs are MBS collateralized by adjustable-rate mortgage loans which have interest rates that generally will adjust at least annually to an increment over a specified interest rate index. Agency ARMs also include hybrid Agency ARMs that are past their fixed-rate periods.
Interest rates on the adjustable-rate mortgage loans collateralizing the hybrid Agency ARMs or Agency ARMs are based on specific index rates, such as the one-year constant maturity treasury, or CMT rate, the London Interbank Offered Rate, or LIBOR, the Federal Reserve U.S. 12-month cumulative average one-year CMT, or MTA, or the 11th District Cost of Funds Index, or COFI. These loans will typically have interim and lifetime caps on interest rate adjustments, or interest rate caps, limiting the amount that the rates on these loans may reset in any given period.
The Company’s Agency CMBS are typically comprised of fixed-rate securities issued primarily by Fannie Mae. These securities are collateralized mostly by first mortgage loans on multifamily properties that are usually either locked out of prepayment options or have yield maintenance provisions which provide the Company protection against prepayment of the investment.
The Company accounts for its Agency MBS in accordance with ASC Topic 320, which requires that investments in debt and equity securities be designated as either “held-to-maturity,” “available-for-sale” or “trading” at the time of acquisition. All of the Company’s Agency MBS are designated as available-for-sale with changes in their fair value reported in other comprehensive income until the security is collected, disposed of, or determined to be other than temporarily impaired. The Company determines the fair value of its investment securities based upon prices obtained from a third-party pricing service and broker quotes. Although the Company generally intends to hold its investment securities until maturity, it may, from time to time, sell any of its securities as part of the overall management of its business. The available-for-sale designation provides the Company with the flexibility to sell any of its investment securities. Upon the sale of an investment security, any unrealized gain or loss is reclassified out of accumulated other comprehensive income (“AOCI”) to earnings as a realized gain or loss using the specific identification method.
Non-Agency MBS. The Company’s non-Agency MBS are comprised of RMBS and CMBS, the majority of which are rated as investment grade. Interest rates for non-Agency MBS collateralized with ARMs are based on indexes similar to those of Agency MBS. Like Agency MBS, the Company accounts for its non-Agency MBS in accordance with ASC Topic 320, and all of the Company’s non-Agency MBS are designated as available-for-sale with changes in their fair value reported in other comprehensive income until the security is collected, disposed of, or determined to be other than temporarily impaired.
F-11
The Company determines the fair value for certain of its non-Agency MBS based upon prices obtained from a third-party pricing service and broker quotes with the remainder of the non-Agency MBS being valued by discounting the estimated future cash flows derived from pricing models that utilize information such as the security’s coupon rate, estimated prepayment speeds, expected weighted average life, collateral composition, estimated future interest rates, expected losses, credit enhancement, as well as certain other relevant information. Like Agency MBS, the Company generally intends to hold its investments in non-Agency MBS until maturity, but it may, from time to time, sell any of its securities as part of the overall management of its business. Upon the sale of an investment security, any unrealized gain or loss is reclassified out of AOCI to earnings as a realized gain or loss using the specific identification method.
Securitized Mortgage Loans. Securitized mortgage loans consist of loans pledged to support the repayment of securitization financing bonds issued by the Company. Securitized mortgage loans are reported at amortized cost. An allowance has been established for currently existing estimated losses on such loans. Securitized mortgage loans can only be sold subject to the lien of the respective securitization financing indenture.
Other Investments. Other investments include unsecuritized single-family and commercial mortgage loans which are carried at amortized cost.
Allowance for Loan Losses
An allowance for loan losses has been estimated and established for currently existing and probable losses for mortgage loans that are considered impaired. Provisions made to increase the allowance are charged as a current period expense. Commercial mortgage loans are secured by income-producing real estate and are evaluated individually for impairment when the debt service coverage ratio on the mortgage loan is less than 1:1 or when the mortgage loan is delinquent. An allowance may be established for a particular impaired commercial mortgage loan. Commercial mortgage loans not evaluated for individual impairment or not deemed impaired are evaluated for a general allowance. Certain of the commercial mortgage loans are covered by mortgage loan guarantees that limit the Company’s exposure on these mortgage loans. Single-family mortgage loans are considered homogeneous and are evaluated on a pool basis for a general allowance.
The Company considers various factors in determining its specific and general allowance requirements, including whether a loan is delinquent, the Company’s historical experience with similar types of loans, historical cure rates of delinquent loans, and historical and anticipated loss severity of the mortgage loans as they are liquidated. The factors may differ by mortgage loan type (e.g., single-family versus commercial) and collateral type (e.g., multifamily versus office property). The allowance for loan losses is evaluated and adjusted periodically by management based on the actual and estimated timing and amount of probable credit losses, using the above factors, as well as industry loss experience.
Repurchase Agreements
Repurchase agreements are treated as financings in accordance with the provision of ASC Topic 860 under which the Company pledges its securities as collateral to secure a loan, which is equal in value to a specified percentage of the estimated fair value of the pledged collateral. The Company retains beneficial ownership of the pledged collateral. At the maturity of a repurchase agreement, the Company is required to repay the loan and concurrently receives back its pledged collateral from the lender or, with the consent of the lender, the Company may renew the agreement at the then prevailing financing rate. A repurchase agreement lender may require the Company to pledge additional collateral in the event of a decline in the fair value of the collateral pledged. Repurchase agreement financing is recourse to the Company and the assets pledged. The Company’s repurchase agreements are based on the September 1996 version of the Bond Market Association Master Repurchase Agreement, which generally provide that the lender, as buyer, is responsible for obtaining collateral valuations from a generally recognized source agreed to by both the Company and the lender, or, in an instance when such source is not available, the value determination is made by the lender.
F-12
Securitization Transactions
The Company has securitized mortgage loans and non-Agency CMBS through securitization transactions by transferring financial assets to a wholly owned trust, where the trust issues non-recourse securitization financing bonds pursuant to an indenture. The Company retains some form of control over the transferred assets, and therefore the trust is included in the consolidated financial statements of the Company. For accounting and tax purposes, the loans and securities financed through the issuance of bonds in a securitization financing transaction are treated as assets of the Company (presented as securitized mortgage loans on the balance sheet), and the associated bonds issued are treated as debt of the Company (presented as a portion of non-recourse collateralized financing on the balance sheet). The Company has retained certain of the bonds issued by the trust and has transferred collateral in excess of the bonds issued. This excess is typically referred to as over-collateralization. Each securitization trust generally provides the Company the right to redeem, at its option, the remaining outstanding bonds prior to their maturity date.
Derivative Instruments
The Company may enter into interest rate swap agreements, interest rate cap agreements, interest rate floor agreements, financial forwards, financial futures and options on financial futures (“interest rate agreements”) to manage its sensitivity to changes in interest rates. The Company accounts for its interest rate agreements under ASC Topic 815, designating each as either cash flow hedging positions or trading positions using criteria established therein. In order to qualify as a cash flow hedge, ASC Topic 815 requires formal documentation to be prepared at the inception of the interest rate agreement that meets certain conditions. If these conditions are not met, an interest rate agreement will be classified as a trading position.
For interest rate agreements designated as cash flow hedges, the Company evaluates the effectiveness of these hedges against the financial instrument being hedged. The effective portion of the hedge relationship on an interest rate agreement designated as a cash flow hedge is reported in AOCI and is later reclassified into the statement of income in the same period during which the hedged transaction affects earnings. The ineffective portion of such hedge is immediately reported in the current period’s statement of income. These derivative instruments are carried at fair value on the Company’s balance sheet in accordance with ASC Topic 815. Cash posted to meet margin calls, if any, is included on the consolidated balance sheets in other assets.
The Company may be required periodically to terminate hedging instruments. Any basis adjustments or changes in the fair value of hedges recorded in other comprehensive income are recognized into income or expense in conjunction with the original hedge or hedged exposure.
If the underlying asset, liability or commitment is sold or matures, the hedge is deemed partially or wholly ineffective, or if the criterion that was established at the time the hedging instrument was entered into no longer exists, the interest rate agreement no longer qualifies as a designated hedge. Under these circumstances, such changes in the market value of the interest rate agreement are recognized in current period’s statement of income.
Interest Income
Interest income on Agency and non-Agency MBS that are rated “AAA” and loans is recognized over the expected life of the investment using the effective interest method. Interest income on non-Agency MBS that are rated “AA” or lower is recognized over the expected life as adjusted for estimated prepayments and credit losses of the securities in accordance with ASC Topic 325. For loans, the accrual of interest is discontinued when, in the opinion of management, the interest is not collectible in the normal course of business, when the loan is significantly past due or when the primary servicer of the loan fails to advance the interest and/or principal due on the loan. Loans are considered past due when the borrower fails to make a timely payment in accordance with the underlying loan agreement. For securities and other investments, the accrual of interest is discontinued when, in the opinion of management, it is probable that all amounts contractually due will not be collected. All interest accrued but not collected for investments that are placed on a non-accrual status or are charged-off is reversed against interest income. Interest on these investments is accounted for on the cash-basis or cost-recovery method, until qualifying for return to accrual status. Investments are returned to accrual status when all the principal and interest amounts contractually due are brought current and future payments are reasonably assured.
F-13
Amortization of Premiums, Discounts, and Deferred Issuance Costs
Premiums and discounts on investments and obligations, as well as debt issuance costs and hedging basis adjustments, are amortized into interest income or expense, respectively, over the contractual life of the related investment or obligation using the effective interest method in accordance with ASC Topic 310 and ASC Topic 470. For securities representing beneficial interests in securitizations that are not highly rated, unamortized premiums and discounts are recognized over the expected life, as adjusted for estimated prepayments and credit losses of the securities, in accordance with ASC Topic 325. Actual prepayment and credit loss experience are reviewed, and effective yields are recalculated when originally anticipated prepayments and credit losses differ from amounts actually received plus anticipated future prepayments.
Other-than-Temporary Impairments
The Company evaluates all debt securities in its investment portfolio for other-than-temporary impairments by applying the guidance prescribed in ASC Topic 320, which states that a debt security is considered to be other-than-temporarily impaired if the present value of cash flows expected to be collected is less than the security’s amortized cost basis (the difference being defined as the credit loss) or if the fair value of the security is less than the security’s amortized cost basis and the Company intends, or is required, to sell the security before recovery of the security’s amortized cost basis. Although the principal and interest related to Agency MBS are guaranteed by the issuers, who have the implicit guarantee of the U.S. government, the Company assesses its ability to hold an Agency MBS with an unrealized loss until the recovery in its value. Please see Note 10 for additional information related to the Company’s evaluation for other-than-temporary impairments.
Declines in the fair value of held-to-maturity and available-for-sale securities below their cost that are deemed to be other-than-temporary are reflected in earnings as realized losses to the extent the impairment is related to credit losses. Any remaining difference between fair value and amortized cost is recognized in other comprehensive income.
In certain instances, as a result of the other-than-temporary impairment analysis, the recognition or accrual of interest will be discontinued and the security will be placed on non-accrual status. Securities normally are not placed on non-accrual status if the servicer continues to advance on the delinquent mortgage loans in the security.
Contingencies
In the normal course of business, there are various lawsuits, claims, and contingencies pending against the Company. In accordance with ASC Topic 450, we evaluate whether to establish provisions for estimated losses from pending claims, investigations and proceedings. Although the ultimate outcome of the various matters cannot be ascertained at this point, it is the opinion of management, after consultation with counsel, that the resolution of the foregoing matters will not have a material adverse effect on the financial condition of the Company taken as a whole. Such resolution may, however, have a material effect on the results of operations or cash flows in any future period, depending on the level of income for such period.
Recent Accounting Pronouncements
In January 2010, FASB issued Accounting Standards Update (“ASU” or “Update”) No. 2010-01 which amends the accounting guidance specified in ASC Topic 505. Specifically, the amendment clarifies that the stock portion of a distribution to shareholders that allows them to elect to receive cash or stock with a potential limitation on the total amount of cash that all shareholders can elect to receive in the aggregate is considered a share issuance that is reflected in earnings per share prospectively and is not a stock dividend. This Update is effective for interim and annual reporting periods ending on or after December 15, 2009, and should be applied retrospectively. The Company has only distributed cash dividends to its shareholders, and does not currently intend to change this policy. As such, this amendment to ASC Topic 505 did not have and is not expected to have a material impact on the Company’s financial condition or results of operations.
F-14
In January 2010, FASB issued Update No. 2010-06, which amends ASC Topic 820 to require additional disclosures and to clarify existing disclosures. Specifically, entities will be required to disclose reasons for and amounts of transfers in and out of levels 1 and 2 as well as a reconciliation of level 3 measurements to include separate information about purchases, sales, issuances, and settlements. Additionally, this amendment clarifies that a “class” of assets or liabilities is often a subset of assets or liabilities within a line item on the entity’s balance sheet, and that a reporting entity should provide fair value measurement disclosures for each class. This amendment also clarifies that disclosures about valuation techniques and inputs used to measure fair value for both recurring and nonrecurring fair value measurements is required for those measurements that fall in either level 2 or 3. The effective date for the new disclosure requirements relating to the rollforward of activity in level 3 fair value measurements is for fiscal years beginning after December 15, 2010, and for interim periods within those fiscal years. All other new disclosures and clarifications of existing disclosures issued in this Update are effective for interim and annual reporting periods beginning after December 15, 2009. The Company has not had any transfers into or out of levels 1 or 2, but will provide these disclosures in the future when such a change occurs. Because these amendments to ASC Topic 820 relate only to disclosures and do not alter GAAP, they do not impact the Company’s financial condition or results of operations.
In February 2010, ASU No. 2010-10 was issued which allows certain reporting entities to defer the consolidation requirements amended in ASC Topic 810 by ASU No. 2009-17. The Company is not eligible for this deferral. As such, the amendments provided in ASU No. 2009-17 were adopted by the Company effective January 1, 2010.
In April 2010, FASB issued ASU No. 2010-18, which amends ASC Topic 310 to provide that modifications of loans that are accounted for within a pool under Subtopic 310-30 do not result in the removal of those loans from the pool even if the modification of those loans would otherwise be considered a troubled debt restructuring. An entity will continue to be required to consider whether the pool of assets in which the loan is included is impaired if expected cash flows for the pool change. ASU 2010-18 does not affect the accounting for loans under the scope of Subtopic 310-30 that are not accounted for within pools. Loans accounted for individually under Subtopic 310-30 continue to be subject to the troubled debt restructuring accounting provisions within Subtopic 310-40. ASU 2010-18 is effective prospectively for modifications of loans accounted for within pools under Subtopic 310-30 occurring in the first interim or annual period ending on or after July 15, 2010. Early application is permitted. Management has evaluated these amendments and has determined that they do not have a material impact on the Company’s financial condition or results of operations.
In July 2010, FASB issued ASU No. 2010-20, which amends ASC Topic 310 to require additional disclosures regarding an entity’s long-term financing receivables that are measured at amortized cost. Specifically, entities are to provide disclosures on a disaggregated basis on two defined levels: (1) portfolio segment; and (2) class of financing receivable. The ASU makes changes to existing disclosure requirements and includes additional disclosure requirements about financing receivables, including credit quality indicators of financing receivables at the end of the reporting period by class; the aging of past due financing receivables at the end of the reporting period by class; and the nature and extent of troubled debt restructurings that occurred during the period by class and their effect on the allowance for credit losses. For public entities, the disclosure requirements of ASC Topic 310 regarding financing receivables as of the end of a reporting period are effective for interim and annual reporting periods ending on or after December 15, 2010. Subsequently, in January 2011, FASB issued ASU No. 2011-01, which temporarily delays the effective date of the disclosures about troubled debt restructurings in ASU No. 2010-20. This delay is intended to allow the FASB time to complete its deliberations on what constitutes a troubled debt restructuring. Because these amendments to ASC Topic 310 relate only to disclosures and do not alter GAAP, they do not impact the Company’s financial condition or results of operations.
NOTE 2 – NET INCOME PER COMMON SHARE
Net income per common share is presented on both a basic and diluted basis. Diluted net income per common share assumes the conversion of the convertible preferred stock into common stock using the two-class method, and stock options using the treasury stock method, but only if these items are dilutive. The following tables reconcile the numerator and denominator for both basic and diluted net income per common share:
F-15
|
For the Years Ended December 31,
|
||||||||||||||||||||||||
|
2010
|
2009
|
2008
|
||||||||||||||||||||||
|
Income
|
Weighted Average Common Shares
|
Income
|
Weighted Average Common Shares
|
Income
|
Weighted Average Common Shares
|
|||||||||||||||||||
|
Net income
|
$ | 29,472 | $ | 17,581 | $ | 15,121 | ||||||||||||||||||
|
Preferred stock dividends
|
(3,061 | ) | (4,010 | ) | (4,010 | ) | ||||||||||||||||||
|
Net income to common shareholders
|
26,411 | 17,595,022 | 13,571 | 13,088,154 | 11,111 | 12,166,558 | ||||||||||||||||||
|
Effect of dilutive items
|
3,061 | 3,324,014 | 4,010 | 4,222,826 | – | 3,053 | ||||||||||||||||||
|
Diluted income
|
$ | 29,472 | 20,919,036 | $ | 17,581 | 17,310,980 | $ | 11,111 | 12,169,611 | |||||||||||||||
|
Net income per common share:
|
||||||||||||||||||||||||
|
Basic
|
$ | 1.50 | $ | 1.04 | $ | 0.91 | ||||||||||||||||||
|
Diluted
|
$ | 1.41 | $ | 1.02 | $ | 0.91 | ||||||||||||||||||
|
Components of dilutive items:
|
||||||||||||||||||||||||
|
Convertible preferred stock
|
$ | 3,061 | 3,319,395 | $ | 4,010 | 4,221,539 | – | – | ||||||||||||||||
|
Stock options
|
– | 4,619 | – | 1,287 | – | 3,053 | ||||||||||||||||||
| $ | 3,061 | 3,324,014 | $ | 4,010 | 4,222,826 | $ | 11,111 | 3,053 | ||||||||||||||||
Because their inclusion would have been anti-dilutive, the calculation of diluted net income per common share excludes 15,000 unexercised stock option awards for the year ended December 31, 2010, 70,000 unexercised stock option awards for the year ended December 31, 2009, and 118,053 unexercised stock option awards and 4,221,539 convertible preferred shares for the year ended December 31, 2008.
NOTE 3 – AGENCY MBS
The following table presents the components of the Company’s investment in Agency MBS as of the periods indicated:
|
December 31, 2010
|
December 31, 2009
|
|||||||||||||||||||||||
|
RMBS
|
CMBS
|
TOTAL
|
RMBS
|
CMBS
|
TOTAL
|
|||||||||||||||||||
|
Principal/par value
|
$ | 937,376 | $ | 190,511 | $ | 1,127,887 | $ | 566,656 | $ | – | $ | 566,656 | ||||||||||||
|
Principal receivable
|
3,732 | – | 3,732 | 3,559 | – | 3,559 | ||||||||||||||||||
|
Unamortized premium
|
43,776 | 18,757 | 62,533 | 12,991 | – | 12,991 | ||||||||||||||||||
|
Unamortized discount
|
(36 | ) | – | (36 | ) | (44 | ) | – | (44 | ) | ||||||||||||||
|
Amortized cost
|
984,848 | 209,268 | 1,194,116 | 583,162 | – | 583,162 | ||||||||||||||||||
|
Gross unrealized gains
|
8,266 | 567 | 8,833 | 11,261 | – | 11,261 | ||||||||||||||||||
|
Gross unrealized losses
|
(3,371 | ) | (3,267 | ) | (6,638 | ) | (303 | ) | – | (303 | ) | |||||||||||||
|
Fair value
|
$ | 989,743 | $ | 206,568 | $ | 1,196,311 | $ | 594,120 | $ | – | $ | 594,120 | ||||||||||||
|
Weighted average coupon
|
4.46 | % | 5.41 | % | 4.62 | % | 4.75 | % | – | 4.75 | % | |||||||||||||
F-16
The Company purchased $908,407 and sold $18,762 of Agency MBS during the year ended December 31, 2010 on which it recognized gains of $702. The Company purchased $389,220 of Agency MBS during the year ended December 31, 2009, but did not sell any Agency MBS during that same period.
NOTE 4 – NON-AGENCY MBS
The following table presents the components of the Company’s non-Agency MBS as of the periods indicated:
|
December 31, 2010
|
December 31, 2009
|
|||||||||||||||||||||||
|
RMBS
|
CMBS
|
TOTAL
|
RMBS
|
CMBS
|
TOTAL
|
|||||||||||||||||||
|
Principal/par value
|
$ | 16,101 | $ | 247,501 | $ | 263,602 | $ | 7,705 | $ | 114,103 | $ | 121,808 | ||||||||||||
|
Unamortized premium
|
138 | 5,352 | 5,490 | – | 4,177 | 4,177 | ||||||||||||||||||
|
Unamortized discount
|
(1,115 | ) | (11,296 | ) | (12,411 | ) | (1,243 | ) | (13,727 | ) | (14,970 | ) | ||||||||||||
|
Amortized cost
|
15,124 | 241,557 | 256,681 | 6,462 | 104,553 | 111,015 | ||||||||||||||||||
|
Gross unrealized gains
|
632 | 10,978 | 11,610 | 416 | 2,795 | 3,211 | ||||||||||||||||||
|
Gross unrealized losses
|
(348 | ) | (580 | ) | (928 | ) | (971 | ) | (4,145 | ) | (5,116 | ) | ||||||||||||
|
Fair value
|
$ | 15,408 | $ | 251,955 | $ | 267,363 | $ | 5,907 | $ | 103,203 | $ | 109,110 | ||||||||||||
|
Weighted average coupon
|
4.54 | % | 6.49 | % | 6.37 | % | 7.93 | % | 7.96 | % | 7.96 | % | ||||||||||||
The Company’s non-Agency CMBS are comprised primarily of investment-grade rated securities with a fair value of $246,948 and $99,092, as of December 31, 2010 and December 31, 2009, respectively. The Company purchased or redeemed $183,045 and sold $31,328 of non-Agency CMBS for which it recognized gains of $77 during the year ended December 31, 2010.
The Company also purchased $11,893 of non-Agency RMBS during the year ended December 31, 2010. The Company did not purchase any non-Agency RMBS during the year ended December 31, 2009.
NOTE 5 – SECURITIZED MORTGAGE LOANS, NET
The following table summarizes the components of securitized mortgage loans as of the periods indicated:
|
December 31, 2010
|
December 31, 2009
|
|||||||
|
Securitized mortgage loans:
|
||||||||
|
Commercial, unpaid principal balance
|
$ | 99,432 | $ | 137,567 | ||||
|
Single-family, unpaid principal balance
|
54,181 | 61,336 | ||||||
| 153,613 | 198,903 | |||||||
|
Funds held by trustees, including funds held for defeasance
|
3,455 | 17,737 | ||||||
|
Unamortized discounts and premiums, net
|
364 | 43 | ||||||
|
Loans, at amortized cost
|
157,432 | 216,683 | ||||||
|
Allowance for loan losses
|
(4,470 | ) | (4,212 | ) | ||||
| $ | 152,962 | $ | 212,471 | |||||
Commercial mortgage loans were originated principally in 1996 and 1997 and are collateralized by first deeds of trust on income producing properties. Approximately 80% of commercial mortgage loans are secured by multifamily properties. The Company identified securitized commercial mortgage loans with combined unpaid principal balances of $18,219 as being impaired as of December 31, 2010 compared to impairments of $20,491 as of December 31, 2009. The Company recognized $609 of interest income on impaired securitized commercial mortgage loans for the year ended December 31, 2010 compared to $1,423 of interest income for the year ended December 31, 2009.
F-17
Funds held by trustees as of December 31, 2010 and December 31, 2009 include $3,306 and $17,588, respectively, of cash and cash equivalents held by the trust for defeased commercial mortgage loans. These funds were paid by the borrower to the securitization trust pursuant to the contractual terms of the mortgage loan and represent replacement collateral for defeased loans. In accordance with the underlying agreements, cash payments are made by the securitization trust using these defeased amounts until the funds held for that particular defeased mortgage loan equal the scheduled principal balance of the original loan. At that point a final distribution to the trust is made as payment in full of the principal amount due on the loan.
Single-family mortgage loans are secured by first deeds of trust on residential real estate and were originated principally from 1992 to 1997. The Company identified securitized single-family mortgage loans with combined unpaid principal balances of $3,587 as being impaired as of December 31, 2010 compared to impairments of $4,065 as of December 31, 2009. Of these amounts, $1,480 and $1,512 represent the unpaid principal balances of the loans in foreclosure as of December 31, 2010 and December 31, 2009, respectively. The Company recognized $205 of interest income on impaired securitized single-family mortgage loans for the year ended December 31, 2010 compared to $319 on impaired single-family mortgage loans for the year ended December 31, 2009.
All of the securitized mortgage loans are pledged as collateral for the associated securitization financing bonds, which are discussed further in Note 9.
NOTE 6 – ALLOWANCE FOR LOAN LOSSES
The following table presents the components of the allowance for loan losses as of the periods indicated:
|
December 31, 2010
|
December 31, 2009
|
|||||||
|
Securitized commercial mortgage loans
|
$ | 4,200 | $ | 3,935 | ||||
|
Securitized single-family mortgage loans
|
270 | 277 | ||||||
| 4,470 | 4,212 | |||||||
|
Other investments
|
– | 96 | ||||||
| $ | 4,470 | $ | 4,308 | |||||
The following table presents certain information on impaired single-family and commercial securitized mortgage loans as of December 31, 2010 and December 31, 2009:
|
December 31, 2010
|
December 31, 2009
|
|||||||||||||||
|
Commercial
|
Single-family
|
Commercial
|
Single-family
|
|||||||||||||
|
Amortized cost basis of impaired loans
|
$ | 18,154 | $ | 3,646 | $ | 20,465 | $ | 4,152 | ||||||||
|
Allowance for loan losses
|
(4,200 | ) | (270 | ) | (3,935 | ) | (277 | ) | ||||||||
|
Investment in excess of allowance
|
$ | 13,954 | $ | 3,376 | $ | 16,530 | $ | 3,875 | ||||||||
The following table summarizes the aggregate activity for the portion of the allowance for loan losses that relates to the securitized mortgage loan portfolio for the periods indicated:
|
Commercial
|
Single-family
|
|||||||
|
Allowance as of January 1, 2008
|
$ | 2,590 | $ | 131 | ||||
|
Provision for loan losses
|
937 | 54 | ||||||
|
Credit losses, net of recoveries
|
– | (5 | ) | |||||
|
Allowance as of December 31, 2008
|
3,527 | 180 | ||||||
|
Provision for loan losses
|
433 | 254 | ||||||
|
Credit losses, net of recoveries
|
(25 | ) | (157 | ) | ||||
|
Allowance as of December 31, 2009(1)
|
3,935 | 277 | ||||||
|
Provision for loan losses
|
1,194 | – | ||||||
|
Credit losses, net of recoveries
|
(929 | ) | (7 | ) | ||||
|
Allowance as of December 31, 2010(2)
|
$ | 4,200 | $ | 270 | ||||
F-18
|
(1)
|
Activity shown excludes provision of $96 related to the Company’s unsecuritized mortgage loan portfolio for the year ended December 31, 2009.
|
|
(2)
|
Activity shown excludes provision of $185 and credit losses of $(281) related to the Company’s unsecuritized mortgage loan portfolio for the year ended December 31, 2010.
|
Please see Note 1 for additional information related to the Company’s accounting policies for derivative instruments.
The table below presents the fair value of the Company’s derivative financial instruments designated as hedging instruments under ASC Topic 815 as well as their classification on the balance sheet as of the periods indicated:
|
Type of Derivative
|
Balance Sheet
Location
|
Fair Value As of
December 31, 2010
|
Fair Value As of
December 31, 2009
|
||||||
|
Interest rate swaps
|
Derivative assets
|
$ | 692 | $ | 1,008 | ||||
|
Interest rate swaps
|
Derivative liabilities
|
(3,532 | ) | – | |||||
| $ | (2,840 | ) | $ | 1,008 | |||||
The Company’s objective for using interest rate swaps is to minimize its exposure to the risk of increased interest expense resulting from its use of existing and forecasted short-term, fixed-rate borrowings. The sequential rollover nature of the repurchase agreement financings creates a variable interest expense pattern. The changes in the cash flows of the interest rate swaps listed above are expected to be highly effective at offsetting changes in the interest portion of the cash flows expected to be paid at maturity of each borrowing.
The following table summarizes information regarding the Company’s outstanding interest rate swap agreements as of December 31, 2010:
|
Maturity Date
|
Notional Amount
|
Fixed Rate Swapped
|
||||||
|
November 24, 2011
|
$ | 25,000 | 0.96 | % | ||||
|
February 8, 2012
|
75,000 | 1.03 | % | |||||
|
November 24, 2012
|
50,000 | 1.53 | % | |||||
|
May 8, 2014
|
35,000 | 1.93 | % | |||||
|
December 24, 2014
|
30,000 | 2.50 | % | |||||
|
December 15, 2015
|
25,000 | 1.75 | % | |||||
|
December 15, 2015
|
25,000 | 1.77 | % | |||||
|
December 15, 2015
|
50,000 | 2.01 | % | |||||
|
December 16, 2015
|
30,000 | 2.23 | % | |||||
| $ | 345,000 | |||||||
These interest rate swaps have been designated as cash flow hedging positions. The Company did not have derivative instruments designated as trading positions as of December 31, 2010 or December 31, 2009.
The table below presents the effect of the derivatives designated as hedging instruments on the Company’s consolidated statement of income for the years ended December 31, 2010 and December 31, 2009, respectively. The Company did not hold any derivative financial instruments during the year ended December 31, 2008.
F-19
|
For the Year Ended December 31, 2010
|
|||||
|
Type of Derivative Designated as Cash Flow Hedge
|
Amount of Loss Recognized in OCI (Effective Portion)
|
Location of Amount Reclassified from OCI into Statement of Income (Effective Portion)
|
Amount Reclassified from OCI into Statement of Income (Effective Portion)
|
Location of Amount Recognized in Statement of Income (Ineffective Portion)
|
Amount Recognized in Statement of Income (Ineffective Portion)
|
|
Interest rate swaps
|
$6,315
|
Interest expense
|
$(2,487)
|
Other income, net
|
$20
|
|
For the Year Ended December 31, 2009
|
|||||
|
Type of Derivative Designated as Cash Flow Hedge
|
Amount of Gain Recognized in OCI (Effective Portion)
|
Location of Amount Reclassified from OCI into Statement of Income (Effective Portion)
|
Amount Reclassified from OCI into Statement of Income (Effective Portion)
|
Location of Amount Recognized in Statement of Income (Ineffective Portion)
|
Amount Recognized in Statement of Income (Ineffective Portion)
|
|
Interest rate swaps
|
$(905)
|
Interest expense
|
$(103)
|
Other income, net
|
$–
|
The Company estimates that an additional $4,531 will be reclassified to earnings from AOCI as an increase to interest expense during the next 12 months. The table below presents the effect of the Company’s derivatives designated as hedging instruments on the Company’s accumulated other comprehensive income for the periods indicated:
|
For the Year Ended
|
For the Year Ended
|
|||||||
|
December 31, 2010
|
December 31, 2009
|
|||||||
|
Balance at beginning of period
|
$ | 1,008 | $ | – | ||||
|
Change in fair value of interest rate swaps
|
(6,315 | ) | 905 | |||||
|
Reclassification adjustment for amounts included in statement of operations
|
2,487 | 103 | ||||||
|
Balance at end of period
|
$ | (2,820 | ) | $ | 1,008 | |||
As of December 31, 2010, the Company had margin requirements for its interest rate swaps for which Agency MBS with a fair value of $3,174 and cash of $894 have been posted as collateral.
The interest rate agreements the Company has with its derivative counterparties contain various covenants related to the Company’s credit risk. Specifically, if the Company defaults on any of its indebtedness, including those circumstances whereby repayment of the indebtedness has not been accelerated by the lender, then the Company could also be declared in default of its derivative obligations. Additionally, the agreements outstanding with certain derivative counterparties allow those counterparties to require settlement of its outstanding derivative transactions if the Company fails to earn GAAP net income greater than one dollar as measured on a rolling two quarter basis. These interest rate agreements also contain provisions whereby, if the Company fails to maintain a minimum net amount of shareholders’ equity, then the Company may be declared in default on its derivative obligations. As of December 31, 2010, the Company had derivatives in a liability position totaling $3,631, inclusive of accrued interest but excluding any adjustment for nonperformance risk, for which it had pledged collateral of $4,068 to its derivative counterparties. If the Company had breached any of these agreements as of December 31, 2010, it could have been required to settle those derivatives at their termination value of $3,631.
NOTE 8 – REPURCHASE AGREEMENTS
The Company uses repurchase agreements, which are recourse to the Company, to finance certain of its investments. The following tables present the components of the Company’s repurchase agreements for the periods indicated by the type of securities collateralizing the repurchase agreement:
F-20
|
December 31, 2010
|
||||||||||||
|
Collateral Type
|
Balance
|
Weighted Average Rate
|
Fair Value of Collateral Pledged
|
|||||||||
|
Agency RMBS
|
$ | 869,537 | 0.33 | % | $ | 908,375 | ||||||
|
Agency CMBS
|
150,178 | 0.31 | % | 161,143 | ||||||||
|
Non-Agency CMBS
|
135,143 | 1.29 | % | 164,871 | ||||||||
|
Non-Agency RMBS
|
12,126 | 1.31 | % | 13,628 | ||||||||
|
Securitization financing bonds (see Note 9)
|
67,199 | 1.36 | % | 79,080 | ||||||||
| $ | 1,234,183 | 0.50 | % | $ | 1,327,097 | |||||||
|
December 31, 2009
|
||||||||||||
|
Collateral Type
|
Balance
|
Weighted Average Rate
|
Fair Value of Collateral Pledged
|
|||||||||
|
Agency RMBS
|
$ | 540,586 | 0.60 | % | $ | 575,386 | ||||||
|
Non-Agency CMBS
|
73,338 | 1.73 | % | 82,770 | ||||||||
|
Securitization financing bonds (see Note 9)
|
24,405 | 1.59 | % | 34,431 | ||||||||
| $ | 638,329 | 0.76 | % | $ | 692,587 | |||||||
As of December 31, 2010 and December 31, 2009, the repurchase agreements had the following original maturities:
|
Original Maturity
|
December 31, 2010
|
December 31, 2009
|
||||||
|
30 days or less
|
$ | 478,848 | $ | 69,576 | ||||
|
31 to 60 days
|
372,702 | 300,413 | ||||||
|
61 to 90 days
|
202,569 | 180,643 | ||||||
|
Greater than 90 days
|
180,064 | 87,697 | ||||||
| $ | 1,234,183 | $ | 638,329 | |||||
As of December 31, 2010, the maximum amount of equity at risk under repurchase agreements with any individual counterparty is $25,979. The combined weighted average original term to maturity is 50 days.
The repurchase agreements the Company has with its various counterparties contain covenants related to the Company’s credit risk. Specifically, if the Company defaults on any of its indebtedness, including those circumstances whereby repayment of the indebtedness has not been accelerated by the lender, then the Company could also be declared in default of its other obligations. Additionally, agreements with certain counterparties allow those counterparties to require settlement of its outstanding transactions if the Company fails to earn GAAP net income greater than one dollar as measured on a rolling two quarter basis. These agreements also contain provisions whereby, if the Company fails to maintain a minimum net amount of shareholders’ equity, then the Company may be declared in default on its obligations.
NOTE 9 – NON-RECOURSE COLLATERIZED FINANCING
The following table summarized information about the Company’s non-recourse collateralized financing for the periods indicated:
F-21
|
December 31, 2010
|
|||||||||||||
|
Interest Rate
|
Weighted Average Life Remaining
(in years)
|
Balance Outstanding(1)
|
Value of
Collateral(2)
|
||||||||||
|
Securitization financing:
|
|||||||||||||
|
Secured by commercial mortgage loans
|
7.2% fixed
|
3.7 | $ | 23,669 | $ | 97,959 | (3) | ||||||
|
Secured by non-Agency CMBS
|
6.2% fixed
|
3.4 | 15,000 | 16,754 | |||||||||
|
Secured by single-family mortgage loans
|
1-month LIBOR plus 0.30%
|
3.4 | 21,183 | 21,889 | |||||||||
|
TALF financing: (4)
|
|||||||||||||
|
Secured by non-Agency CMBS
|
2.7% fixed
|
2.2 | 50,713 | 64,097 | |||||||||
|
Unamortized net bond premium and deferred costs
|
(3,460 | ) | n/a | ||||||||||
| $ | 107,105 | $ | 200,699 | ||||||||||
|
(1)
|
For comparative purposes, balances outstanding for securitization financing secured by commercial mortgage loans and single-family mortgage loans were $121,168 and $23,852 as of December 31, 2009, respectively. There were no outstanding securitization financings secured by non-Agency CMBS as of December 31, 2009.
|
|
(2)
|
For comparative purposes, the unpaid principal balances (including defeased loans) of the commercial mortgage loans and single-family mortgage loans collateralizing the outstanding securitization financing bonds were $142,039 and $24,563, respectively, as of December 31, 2009.
|
|
(3)
|
The value of the commercial mortgage loans collateralizing the bond class with $23,669 remaining outstanding represents the unpaid principal balance, which includes proceeds from defeased loans. The value of the commercial mortgage loans also includes the amounts collateralizing the bond classes of the trust that the Company has redeemed. These redeemed classes are senior to the outstanding class and have a balance as of December 31, 2010 of $54,519, which must be paid in full before any proceeds from the collateral may be used to pay the balance of the outstanding class.
|
|
(4)
|
Financing provided by the Federal Reserve Bank of New York under its Term Asset-Backed Securities Loan Facility (“TALF”). The Company did not have TALF financing as of December 31, 2009.
|
The Company has redeemed securitization bonds in the past, and in certain instances, the Company has kept the bond outstanding and used it as collateral for additional repurchase agreement borrowings. These additional borrowings may have been used to either finance the bond redemption or to purchase additional investments. Although these bonds are legally outstanding, the balances are eliminated in consolidation because the issuing trust is included in the Company’s consolidated financial statements.
In August 2010, the Company redeemed $56.4 million of securitization financing that it had issued in 1997 with commercial mortgage loans as collateral, and replaced it with thirty-day repurchase agreement financing. The effective rate on the redeemed securitization financing of 8.76% was replaced with repurchase agreement financing at an effective rate of 1.36% as of December 31, 2010. The following table summarizes information regarding all of the Company’s redeemed bonds that have an outstanding balance as of December 31, 2010:
|
Collateral Type
|
Par Value Outstanding
|
Fair Value
|
Repurchase Agreement Balance
|
|||||||||
|
Single-family mortgage loans
|
$ | 25,743 | $ | 23,493 | $ | 20,522 | ||||||
|
Commercial mortgage loans
|
54,519 | 55,587 | 46,677 | |||||||||
| $ | 80,262 | $ | 79,080 | $ | 67,199 | |||||||
F-22
NOTE 10 – FAIR VALUE OF FINANCIAL INSTRUMENTS
The Company utilizes fair value measurements at various levels within the hierarchy established by ASC Topic 820 for certain of its assets and liabilities. The three levels of valuation hierarchy established by ASC Topic 820 are as follows:
|
·
|
Level 1 – Inputs are unadjusted, quoted prices in active markets for identical assets or liabilities at the measurement date.
|
|
·
|
Level 2 – Inputs (other than quoted prices included in Level 1) are either directly or indirectly observable for the asset or liability through correlation with market data at the measurement date and for the duration of the instrument’s anticipated life. The Company’s fair valued assets and liabilities that are generally included in this category are Agency MBS, certain non-Agency CMBS, and its derivatives.
|
|
·
|
Level 3 – Inputs reflect management’s best estimate of what market participants would use in pricing the asset or liability at the measurement date. Consideration is given to the risk inherent in the valuation technique and the risk inherent in the inputs to the model. Generally, the Company’s assets and liabilities carried at fair value and included in this category are non-Agency MBS.
|
The following table presents the fair value of the Company’s assets and liabilities as of December 31, 2010, segregated by the hierarchy level of the fair value estimate:
|
Fair Value Measurements
|
||||||||||||||||
|
Fair Value
|
Level 1
|
Level 2
|
Level 3
|
|||||||||||||
|
Assets:
|
||||||||||||||||
|
Agency MBS
|
$ | 1,196,311 | $ | – | $ | 1,196,311 | $ | – | ||||||||
|
Non-Agency MBS:
|
||||||||||||||||
|
RMBS
|
15,408 | – | 6,101 | 9,307 | ||||||||||||
|
CMBS
|
251,955 | – | 105,277 | 146,678 | ||||||||||||
|
Other investments
|
25 | – | – | 25 | ||||||||||||
|
Derivative assets
|
692 | – | 692 | – | ||||||||||||
|
Total assets carried at fair value
|
$ | 1,464,391 | $ | – | $ | 1,308,381 | $ | 156,010 | ||||||||
|
Liabilities:
|
||||||||||||||||
|
Derivative liabilities
|
$ | 3,532 | $ | – | $ | 3,532 | $ | – | ||||||||
|
Total liabilities carried at fair value
|
$ | 3,532 | $ | – | $ | 3,532 | $ | – | ||||||||
The Company’s Agency MBS, as well a portion of its non-Agency CMBS, are substantially similar to securities that either are currently actively traded or have been recently traded in their respective market. Their fair values are derived from an average of multiple dealer quotes and thus are considered Level 2 fair value measurements.
The Company’s remaining non-Agency RMBS and non-Agency CMBS are comprised of securities for which there are not substantially similar securities that trade frequently. As such, the Company determines the fair value of those securities by discounting the estimated future cash flows modeled using assumptions that are confirmed to the extent possible by third party dealers or other pricing indicators. Significant inputs into those pricing models are Level 3 in nature due to the lack of readily available market quotes. Information utilized in those pricing models include the security’s credit rating, coupon rate, estimated prepayment speeds, expected weighted average life, collateral composition, estimated future interest rates, expected credit losses, credit enhancement, as well as certain other relevant information. The following tables present the beginning and ending balances of the Level 3 fair value estimates for the years ended December 31, 2010 and December 31, 2009:
F-23
|
Level 3 Fair Values
|
||||||||||||||||
|
Non-Agency
RMBS
|
Non-Agency CMBS
|
Other
|
Total assets
|
|||||||||||||
|
Balance as of December 31, 2009
|
$ | 5,907 | $ | 103,203 | $ | 131 | $ | 109,241 | ||||||||
|
Cumulative effect of adoption of new
accounting principle
|
– | 14,924 | – | 14,924 | ||||||||||||
|
Balance as of January 1, 2010
|
5,907 | 118,127 | 131 | 124,165 | ||||||||||||
|
Total realized and unrealized gains (losses):
|
||||||||||||||||
|
Included in the statement of operations (1)
|
(5 | ) | 77 | – | 72 | |||||||||||
|
Included in other comprehensive income
|
668 | 9,265 | – | 9,933 | ||||||||||||
|
Purchases
|
5,449 | 79,377 | – | 84,826 | ||||||||||||
|
Sales
|
– | (31,405 | ) | (106 | ) | (31,511 | ) | |||||||||
|
Principal payments
|
(2,725 | ) | (27,585 | ) | – | (30,310 | ) | |||||||||
|
(Amortization) accretion
|
13 | (1,178 | ) | – | (1,165 | ) | ||||||||||
|
Transfers in and/or out of Level 3
|
– | – | – | – | ||||||||||||
|
Balance as of December 31, 2010
|
$ | 9,307 | $ | 146,678 | $ | 25 | $ | 156,010 | ||||||||
|
(1)
|
Realized gains (losses) are included within “Gain on sale of investments, net” in the Company’s statement of operations.
|
The following table presents the recorded basis and estimated fair values of the Company’s financial instruments as of December 31, 2010 and December 31, 2009:
|
December 31, 2010
|
December 31, 2009
|
|||||||||||||||
|
Recorded
Basis
|
Fair
Value
|
Recorded
Basis
|
Fair
Value
|
|||||||||||||
|
Assets:
|
||||||||||||||||
|
Agency MBS
|
$ | 1,196,311 | $ | 1,196,311 | $ | 594,120 | $ | 594,120 | ||||||||
|
Non-Agency RMBS
|
15,408 | 15,408 | 5,907 | 5,907 | ||||||||||||
|
Non-Agency CMBS
|
251,955 | 251,955 | 103,203 | 103,203 | ||||||||||||
|
Securitized mortgage loans, net
|
152,962 | 142,177 | 212,471 | 186,547 | ||||||||||||
|
Other investments
|
1,229 | 1,112 | 2,280 | 2,079 | ||||||||||||
|
Derivative assets
|
692 | 692 | 1,008 | 1,008 | ||||||||||||
|
Liabilities:
|
||||||||||||||||
|
Repurchase agreements
|
1,234,183 | 1,234,183 | 638,329 | 638,329 | ||||||||||||
|
Non-recourse collateralized financing
|
107,105 | 109,395 | 143,081 | 132,234 | ||||||||||||
|
Derivative liabilities
|
3,532 | 3,532 | – | – | ||||||||||||
There were no assets or liabilities which were measured at fair value on a non-recurring basis as of December 31, 2010 or December 31, 2009.
The following table presents certain information for Agency MBS and non-Agency MBS that were in an unrealized loss position as of December 31, 2010 and December 31, 2009:
F-24
|
December 31, 2010
|
December 31, 2009
|
|||||||||||||||
|
Fair
Value
|
Unrealized
Loss
|
Fair
Value
|
Unrealized Loss
|
|||||||||||||
|
Unrealized loss position for:
|
||||||||||||||||
|
Less than one year:
|
||||||||||||||||
|
Agency MBS
|
$ | 695,854 | $ | 6,638 | $ | 73,288 | $ | 302 | ||||||||
|
Non-Agency MBS
|
45,602 | 592 | 92,438 | 4,145 | ||||||||||||
|
One year or more:
|
||||||||||||||||
|
Non-Agency MBS
|
3,494 | 337 | 4,087 | 971 | ||||||||||||
| $ | 173,166 | $ | 2,701 | $ | 169,813 | $ | 5,418 | |||||||||
Because the principal and interest related to Agency MBS are guaranteed by the issuers, who have the implicit guarantee of the U.S. government, the Company does not consider any of the unrealized losses on its Agency MBS to be credit related. The Company assesses its ability to hold an Agency MBS with an unrealized loss until the recovery in its value. This assessment is based on the amount of the unrealized loss and significance of the related investment as well as the Company’s current leverage and anticipated liquidity. Based on this analysis, the Company has determined that the unrealized losses on its Agency MBS as of December 31, 2010 are temporary.
The Company reviews the estimated future cash flows for its non-Agency MBS to determine whether there have been adverse changes in the cash flows that necessitate recognition of other-than-temporary impairment amounts. Approximately $3,505 of the $49,096 non-Agency MBS in an unrealized loss position as of December 31, 2010 are investment grade MBS collateralized by mortgage loans that were originated during or prior to 1999. Based on the credit rating of these MBS and the seasoning of the mortgage loans collateralizing these securities, the impairment of these MBS is not determined to be other-than-temporary as of December 31, 2010.
The estimated cash flows of the remaining $45,591 of non-Agency MBS were reviewed based on the performance of the underlying mortgage loans collateralizing the MBS as well as projected loss and prepayment rates. Based on that review, management did not determine any adverse changes in the timing or amount of estimated cash flows that necessitate recognition of other-than-temporary impairment amounts as of December 31, 2010.
NOTE 11 – SHAREHOLDERS’ EQUITY
The Company has a continuous equity placement program (“EPP”) whereby the Company may offer and sell through its sales agent shares of its common stock in negotiated transactions or transactions that are deemed to be “at the market offerings,” as defined in Rule 415 under the 1933 Act, including sales made directly on the New York Stock Exchange or sales made to or through a market maker other than on an exchange. During the year ended December 31, 2010, the Company has received proceeds of $48,695, net of broker sales commission, for 5,192,816 shares of common stock sold under its EPP at a weighted average price of $9.56.
On December 17, 2010, the Company closed a public offering of 6,900,000 shares of its common stock, including 900,000 shares pursuant to an option that was fully exercised by the underwriters, at a public offering price of $10.20 per share for total net proceeds of approximately $67,689 after deduction of underwriting discounts, commissions and estimated expenses. The Company intends to use the net proceeds from this offering to acquire additional investments consistent with its investment policy and for general corporate purposes, which may include, among other things, repayment of maturing obligations, capital expenditures and working capital.
Effective October 15, 2010, the Company redeemed all 4,221,539 shares of its outstanding shares of the Company’s Series D 9.50% Cumulative Convertible Preferred Stock (the “Series D Preferred Stock”) in exchange for one share of its common stock. As of December 31, 2010, the Company does not have any outstanding shares of of the Series D Preferred Stock.
F-25
The Company also issued shares under its 2009 Stock and Incentive Plan for a portion of management’s 2009 performance bonus as well as for a portion of the Chief Executive Officer’s 2010 salary through December 31, 2010.
On December 13, 2010, the Company declared a fourth quarter common stock dividend of $0.27 to be paid on January 31, 2011 to shareholders of record on December 31, 2010.
NOTE 12 – EMPLOYEE BENEFITS
Stock Incentive Plan
Pursuant to the Company’s 2009 Stock and Incentive Plan, the Company may grant to eligible employees, directors or consultants or advisors to the Company stock based compensation, including stock options, stock appreciation rights (“SARs”), stock awards, dividend equivalent rights, performance shares, and stock units. Of the 2,500,000 shares of common stock authorized for issuance under this plan, 2,452,970 shares remain available as of December 31, 2010. Although the Company is no longer issuing stock based compensation under its 2004 Stock Incentive Plan, there are stock options, SARs, and restricted stock still outstanding and exercisable thereunder as of December 31, 2010.
SARs issued by the Company may be settled only in cash, and therefore have been treated as liability awards with their fair value measured at the grant date and remeasured at the end of each reporting period as required by ASC Topic 718. As of December 31, 2010, the fair value of the Company’s outstanding unexercised SARs of $492 is recorded as part of “Other liabilities” on its consolidated balance sheet and the weighted average remaining contractual term is 24 months. The fair value of SARs was estimated as of December 31, 2010 and December 31, 2009 using the Black-Scholes option valuation model based upon the assumptions in the table below.
|
December 31, 2010
|
December 31, 2009
|
|||||||
|
Expected volatility
|
16.2%-18.6 | % | 25.4%-30.9 | % | ||||
|
Weighted-average volatility
|
17.3 | % | 29.4 | % | ||||
|
Expected dividends
|
9.9%-10.3 | % | 10.4 | % | ||||
|
Expected term (in months)
|
12 | 18 | ||||||
|
Weighted-average risk-free rate
|
0.81 | % | 1.87 | % | ||||
|
Range of risk-free rates
|
0.4%-1.3 | % | 1.44%-2.42 | % | ||||
The following tables present a rollforward of the SARs activity for the period ending December 31, 2010:
|
Number of Shares
|
Weighted-Average
Exercise Price
|
|||||||
|
SARs outstanding as of January 1, 2010
|
278,146 | $ | 7.27 | |||||
|
SARs granted
|
– | – | ||||||
|
SARs forfeited, redeemed, or exercised
|
(141,271 | ) | 7.24 | |||||
|
SARs outstanding as of December 31, 2010
|
136,875 | $ | 7.31 | |||||
|
SARs vested and exercisable as of December 31, 2010
|
116,875 | $ | 7.35 | |||||
Because the remaining 20,000 nonvested SARs vested on January 3, 2011, all remaining compensation cost related to these awards has been expensed as of December 31, 2010. There was no activity related to SARs outstanding SARs for the years ended December 31, 2009 or 2008.
F-26
The stock options and restricted stock issued by the Company may be settled only in shares of its common stock; and therefore have been treated as equity awards with their fair value measured at the grant date as required by ASC Topic 718. The compensation cost related to all stock options has been expensed in prior periods. As of December 31, 2010 and December 31, 2009, the fair value of the Company’s outstanding restricted stock remaining to be amortized into net income is $102 and $162, respectively.
The following tables present a rollforward of the stock option activity for the periods presented:
|
Number of Shares
|
Weighted-Average
Exercise Price
|
|||||||
|
Options outstanding as of January 1, 2008 (all vested and exercisable)
|
90,000 | $ | 8.27 | |||||
|
Options granted
|
25,000 | 9.81 | ||||||
|
Options forfeited
|
(5,000 | ) | 9.81 | |||||
|
Options exercised
|
– | – | ||||||
|
Options outstanding as of December 31, 2008 (all vested and exercisable)
|
110,000 | $ | 8.61 | |||||
|
Options granted
|
– | – | ||||||
|
Options forfeited
|
(15,000 | ) | 8.30 | |||||
|
Options exercised
|
– | – | ||||||
|
Options outstanding as of December 31, 2009 (all vested and exercisable)
|
95,000 | $ | 8.59 | |||||
|
Options granted
|
– | – | ||||||
|
Options forfeited
|
– | – | ||||||
|
Options exercised
|
(50,000 | ) | 8.45 | |||||
|
Options outstanding as of December 31, 2010 (all vested and exercisable)
|
45,000 | $ | 8.75 | |||||
The following tables present a rollforward of the restricted stock activity for the periods presented:
|
Number of Shares of Restricted Stock
|
||||
|
Restricted stock as of January 1, 2008
|
– | |||
|
Restricted stock granted
|
33,500 | |||
|
Restricted stock forfeited
|
– | |||
|
Restricted stock vested
|
(3,500 | ) | ||
|
Restricted stock outstanding as of December 31, 2008
|
30,000 | |||
|
Restricted stock granted
|
10,000 | |||
|
Restricted stock forfeited
|
– | |||
|
Restricted stock vested
|
(7,500 | ) | ||
|
Restricted stock outstanding as of December 31, 2009
|
32,500 | |||
|
Restricted stock granted
|
10,000 | |||
|
Restricted stock forfeited
|
– | |||
|
Restricted stock vested
|
(17,500 | ) | ||
|
Restricted stock outstanding as of December 31, 2010
|
25,000 | |||
Total stock based compensation expense (benefit) recognized by the Company for the years ended December 31, 2010, 2009, and 2008 is $627, $526, and $(271), respectively.
F-27
Employee Savings Plan
The Company provides an Employee Savings Plan under Section 401(k) of the Code. The Employee Savings Plan allows eligible employees to defer up to 25% of their income on a pretax basis. The Company matches the employees’ contribution, up to 6% of the employees’ eligible compensation. The Company may also make discretionary contributions based on the profitability of the Company. The total expense related to the Company’s matching and discretionary contributions was $90, $77, and $64 for the years ended December 31, 2010, 2009, and 2008, respectively. The Company does not provide post-employment or post-retirement benefits to its employees.
NOTE 13 – COMMITMENTS AND CONTINGENCIES
The Company and its subsidiaries are parties to various legal proceedings, including those described below. Although the ultimate outcome of any of these legal proceedings cannot be ascertained at this time, and the results of legal proceedings cannot be predicted with certainty, the Company believes, based on current knowledge, that the resolution of any of these proceedings, including those described below, will not have a material adverse effect on the Company’s consolidated financial condition or liquidity. However, the resolution of any of these proceedings could have a material impact on results of operations in a given reporting period as the proceedings are resolved.
One of the Company’s subsidiaries, GLS Capital, Inc. (“GLS”), and the County of Allegheny, Pennsylvania are defendants in a class action lawsuit (“Pentlong”) filed in 1997 in the Court of Common Pleas of Allegheny County, Pennsylvania (the “Court”). Between 1995 and 1997, GLS purchased from Allegheny County delinquent county property tax receivables for properties located in the County. In their initial pleadings, the Pentlong plaintiffs (“Pentlong Plaintiffs”) alleged that GLS did not have the right to recover from delinquent taxpayers certain attorney fees, lien docketing, revival, assignment and satisfaction costs, and expenses associated with the original purchase transaction, and interest, in the collection of the property tax receivables pursuant to the Pennsylvania Municipal Claims and Tax Lien Act (the “Act”). During the course of the litigation, the Pennsylvania State Legislature enacted Act 20 of 2003, which cured many deficiencies in the Act at issue in the Pentlong case, including confirming GLS’ right to collect attorney fees from delinquent taxpayers retroactive back to the date when GLS first purchased the delinquent tax receivables.
Subsequent to the enactment of Act 20, GLS has filed various motions with the Court seeking dismissal of the Pentlong Plaintiffs’ remaining claims regarding GLS’ right to collect reasonable attorneys fees from the named plaintiffs and purported class members; its right to collect lien docketing, revival, assignment and satisfaction costs from delinquent taxpayers; and its practice of charging interest on the first of each month for the entire month. Subsequently, the plaintiffs abandoned their claims with respect to lien docketing, satisfaction costs, and the issue of interest. On April 2, 2010, the Court granted GLS’ motion for summary judgment with respect to its right to charge attorney fees and interest in the collection of the receivables, and on August 25, 2010, the Court granted GLS’s motion for summary judgment with respect to lien costs, removing these claims from the Pentlong Plaintiffs’ case. The Court has indicated that it will undertake arguments over the reasonableness of attorney fees at a later date. GLS intends to seek decertification of the class at that time as well.
The Pentlong Plaintiffs have not enumerated their damages in this matter.
Dynex Capital, Inc. and Dynex Commercial, Inc. (“DCI”), a former affiliate of the Company and now known as DCI Commercial, Inc., are appellees (or respondents) in the Supreme Court of Texas related to the matter of Basic Capital Management, Inc. et al. (collectively, “BCM” or the “Plaintiffs”) versus DCI et al. The appeal seeks to overturn the trial court’s judgment, and subsequent affirmation by the Fifth Court of Appeals at Dallas, in our and DCI’s favor which denied recovery to Plaintiffs. Specifically, Plaintiffs are seeking reversal of the trial court’s judgment and sought rendition of judgment against us for alleged breach of loan agreements for tenant improvements in the amount of $253,000. They also seek reversal of the trial court’s judgment and rendition of judgment against DCI in favor of BCM under two mutually exclusive damage models, for $2,200 and $25,600, respectively, related to the alleged breach by DCI of a $160,000 “master” loan commitment. Plaintiffs also seek reversal and rendition of a judgment in their favor for attorneys’ fees in the amount of $2,100. Alternatively,
F-28
Plaintiffs seek a new trial. Even if Plaintiffs were to be successful on appeal, DCI is a former affiliate of the Company, and therefore management does not believe that it would be obligated for any amounts awarded to the Plaintiffs as a result of the actions of DCI.
Dynex Capital, Inc., MERIT Securities Corporation, a subsidiary ("MERIT"), and the former president and current Chief Operating Officer/Chief Financial Officer of Dynex Capital, Inc., (together, "Defendants") are defendants in a putative class action brought by the Teamsters Local 445 Freight Division Pension Fund ("Teamsters") in the United States District Court for the Southern District of New York ("District Court"). The original complaint, which was filed on February 7, 2005 alleged violations of the federal securities laws and was purportedly filed on behalf of purchasers between February 2000 and May 2004 of MERIT Series 12 and MERIT Series 13 securitization financing bonds ("Bonds"), which are collateralized by manufactured housing loans. After a series of rulings by the District Court and an appeal by the Company and MERIT, on February 22, 2008 the United States Court of Appeals for the Second Circuit dismissed the litigation against the Company and MERIT. Teamsters filed an amended complaint on August 6, 2008, which essentially restated the same allegations as the original complaint and added the Company’s former president and current Chief Operating Officer/Chief Financial Officer as defendants. The District Court denied Defendants’ motion to dismiss the amended complaint. Teamster’s seeks unspecified damages and alleges, among other things, fraud and misrepresentations in connection with the issuance of and subsequent reporting related to the Bonds. On March 7, 2011, the District Court granted Teamsters’ motion to certify the class for this action. The Company has evaluated the allegations made in the complaint, and continues to believe them to be without merit and intends to defend itself against them vigorously, including appealing the District Court’s decision certifying the class for this action.
NOTE 14 – ACCUMULATED OTHER COMPREHENSIVE INCOME
Accumulated other comprehensive income as of December 31, 2010 and December 31, 2009 is comprised of the following items:
|
December 31, 2010
|
December 31, 2009
|
|||||||
|
Available for sale investments:
|
||||||||
|
Unrealized gains
|
$ | 20,443 | $ | 14,472 | ||||
|
Unrealized losses
|
(7,566 | ) | (5,419 | ) | ||||
| 12,877 | 9,053 | |||||||
|
Hedging instruments:
|
||||||||
|
Unrealized gains
|
692 | 1,008 | ||||||
|
Unrealized losses
|
(3,512 | ) | – | |||||
| (2,820 | ) | 1,008 | ||||||
|
Accumulated other comprehensive income
|
$ | 10,057 | $ | 10,061 | ||||
Due to the Company’s REIT status, the items comprising other comprehensive income do not have related tax effects.
NOTE 15 – RELATED PARTY TRANSACTIONS
As discussed in Note 13, the Company and DCI have been jointly named in litigation regarding the activities of DCI while it was an operating subsidiary of an affiliate of the Company. The Company and DCI entered into a Litigation Cost Sharing Agreement whereby the parties set forth how the costs of defending against litigation would be shared, and whereby the Company agreed to fund all costs of such litigation, including DCI’s portion. DCI’s cumulative portion of costs associated with litigation and funded by the Company is $3,391 and is secured by the proceeds of any counterclaims that DCI may receive in the litigation. DCI costs funded by the Company are loans and bear simple interest at the rate of Prime plus 8.0% per annum. As of December 31, 2010, the total amount due the Company under the Litigation Cost Sharing Agreement, including interest, was $6,944, which has been fully reserved by the Company. DCI is currently wholly owned by ICD Holding, Inc. An executive of the Company is the sole shareholder of ICD Holding, Inc.
F-29
NOTE 16 – NON-CONSOLIDATED AFFILIATES
The Company holds a 1% limited partnership interest in a partnership that owns a low-income housing tax credit multifamily housing property located in Texas. The Company has loaned the partnership $1,038, $52 of which was advanced to the partnership during 2010. These advances and the accrued interest thereon are due on demand. The Company, through a subsidiary, has made a first mortgage loan to the partnership secured by the property, with a current unpaid principal balance of $1,253. Because the Company does not have control or exercise significant influence over the operations of this partnership, its investment in the partnership is accounted for using the cost method as per ASC Topic 325.
NOTE 17 – SUMMARY OF QUARTERLY RESULTS (UNAUDITED)
|
Year Ended December 31, 2010
|
First Quarter
|
Second Quarter
|
Third Quarter
|
Fourth Quarter
|
||||||||||||
|
Operating results:
|
||||||||||||||||
|
Net interest income
|
$ | 7,197 | $ | 7,932 | $ | 8,401 | $ | 10,896 | ||||||||
|
Net interest income after provision for loan losses
|
6,788 | 7,782 | 8,190 | 10,286 | ||||||||||||
|
Net income
|
5,537 | 7,267 | 7,022 | 9,646 | ||||||||||||
|
Basic net income per common share
|
0.32 | 0.41 | 0.35 | 0.41 | ||||||||||||
|
Diluted net income per common share
|
0.30 | 0.38 | 0.33 | 0.40 | ||||||||||||
|
Cash dividends declared per common share
|
0.23 | 0.23 | 0.25 | 0.27 | ||||||||||||
|
Year Ended December 31, 2009
|
First Quarter
|
Second Quarter
|
Third Quarter
|
Fourth Quarter
|
||||||||||||
|
Operating results:
|
||||||||||||||||
|
Net interest income
|
$ | 5,044 | $ | 5,881 | $ | 6,597 | $ | 7,043 | ||||||||
|
Net interest income after provision for loan losses
|
4,865 | 5,742 | 6,349 | 6,827 | ||||||||||||
|
Net income
|
3,134 | 4,370 | 6,002 | 4,075 | ||||||||||||
|
Basic net income per common share
|
0.18 | 0.26 | 0.37 | 0.23 | ||||||||||||
|
Diluted net income per common share
|
0.18 | 0.25 | 0.34 | 0.23 | ||||||||||||
|
Cash dividends declared per common share
|
0.23 | 0.23 | 0.23 | 0.23 | ||||||||||||
NOTE 18 – SUBSEQUENT EVENTS
Management has evaluated events and circumstances occurring as of and through the date this Annual Report on Form 10-K was filed with the SEC and made available to the public and has determined that there have been no significant events or circumstances that provide additional evidence about conditions of the Company that existed as of December 31, 2010, or that qualify as “recognized subsequent events” as defined by ASC Topic 855.
The following events, which occurred subsequent to December 31, 2010 and before the filing of this Annual Report on Form 10-K, qualify as “nonrecognized subsequent events” as defined by ASC Topic 855:
The Company issued 9,922,237 shares of its common stock since December 31, 2010 for the following transactions. The Company issued 409,237 shares through its EPP, which generated net proceeds of $4,332. The Company also issued and sold 9,200,000 shares at a public offering price of $10.35 per share, which closed on March 9, 2011 and resulted in proceeds to the Company of $90,459, before expenses. The Company issued 10,000 shares to a former director related to his exercise of a stock option issued under the 2004 Stock Incentive Plan. In addition, on February 11, 2011, the Company granted 303,000 shares of restricted stock to certain officers and employees of the Company under the 2009 Stock and Incentive Plan, which vest over periods ranging from three to four years.
F-30