Attached files
| file | filename |
|---|---|
| 8-K - 8-K - Chaparral Energy, Inc. | cpr8kcreditsuisse052815.htm |
May 2015 Chaparral First Quarter Update
Company Representatives 2 Joe Evans Chief Financial Officer Mark Fischer Chief Executive Officer Earl Reynolds President & Chief Operating Officer
This presentation contains "forward-looking statements" within the meaning of Section 27A of the Securities Act of 1933, as amended, and Section 21E of the Securities Exchange Act of 1934, as amended. These forward-looking statements are subject to certain risks, trends and uncertainties that could cause actual results to differ materially from those projected. Among those risks, trends and uncertainties are our ability to find oil and natural gas reserves that are economically recoverable, the volatility of oil and natural gas prices, the uncertain economic conditions in the United States and globally the decline in the values of our properties that have resulted and may in the future result in additional ceiling test write-downs, our ability to replace reserves and sustain production, our estimate of the sufficiency of our existing capital sources, our ability to raise additional capital to fund cash requirements for future operations, the uncertainties involved in prospect development and property acquisitions or dispositions and in projecting future rates of production or future reserves, the timing of development expenditures and drilling of wells, the impact of hurricanes and other natural disasters on our present and future operations, the impact of government regulation and the operating hazards attendant to the oil and natural gas business. In particular, careful consideration should be given to cautionary statements made in the various reports we have filed with the Securities and Exchange Commissions. We undertake no duty to update or revise these forward-looking statements. Forward-looking Statements 3
I. Current Initiatives II. Company Overview III. 2015 Focus Areas a) E&P b) CO2 Enhanced Oil Recovery IV. Financial Overview Corporate Overview 4
Current Initiatives 5
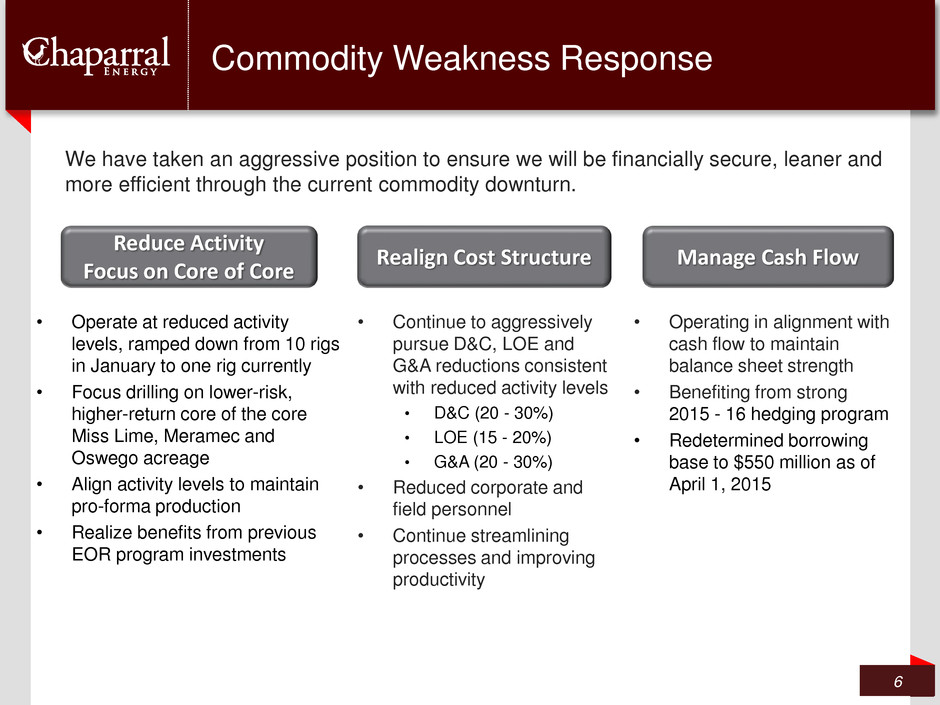
We have taken an aggressive position to ensure we will be financially secure, leaner and more efficient through the current commodity downturn. Commodity Weakness Response • Operating in alignment with cash flow to maintain balance sheet strength • Benefiting from strong 2015 - 16 hedging program • Redetermined borrowing base to $550 million as of April 1, 2015 • Operate at reduced activity levels, ramped down from 10 rigs in January to one rig currently • Focus drilling on lower-risk, higher-return core of the core Miss Lime, Meramec and Oswego acreage • Align activity levels to maintain pro-forma production • Realize benefits from previous EOR program investments • Continue to aggressively pursue D&C, LOE and G&A reductions consistent with reduced activity levels • D&C (20 - 30%) • LOE (15 - 20%) • G&A (20 - 30%) • Reduced corporate and field personnel • Continue streamlining processes and improving productivity Manage Cash Flow Realign Cost Structure Reduce Activity Focus on Core of Core 6
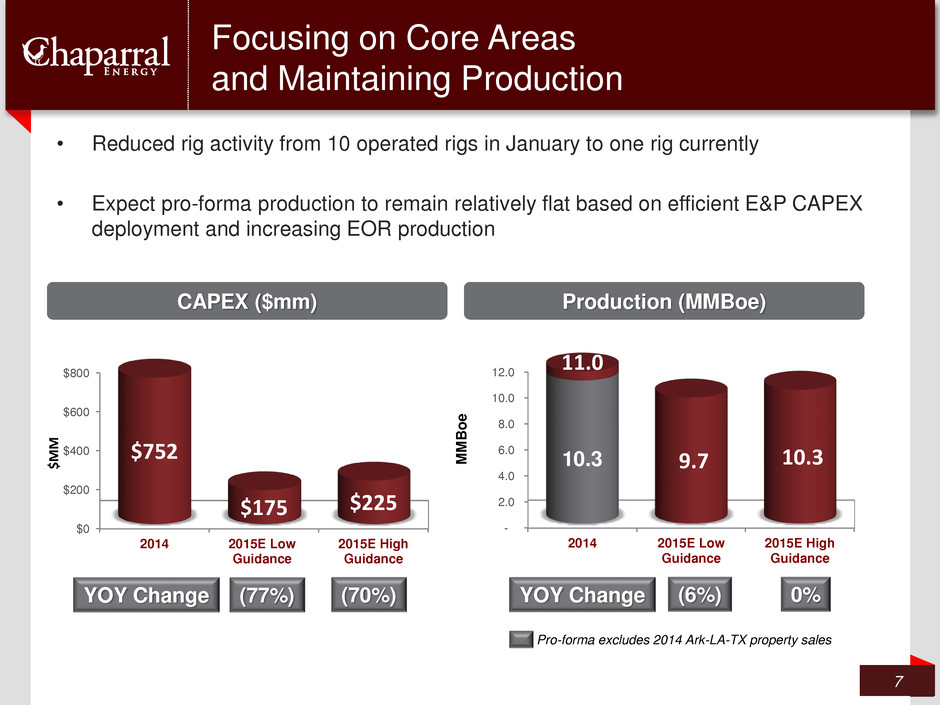
• Reduced rig activity from 10 operated rigs in January to one rig currently • Expect pro-forma production to remain relatively flat based on efficient E&P CAPEX deployment and increasing EOR production Focusing on Core Areas and Maintaining Production 7 Production (MMBoe) - 2.0 4.0 6.0 8.0 10.0 12.0 2014 2015E Low Guidance 2015E High Guidance 11.0 9.7 10.3 M M B o e CAPEX ($mm) $0 $200 $400 $600 $800 2014 2015E Low Guidance 2015E High Guidance $752 $175 $225 $ M M (77%) YOY Change (70%) (6%) 0% YOY Change 10.3 Pro-forma excludes 2014 Ark-LA-TX property sales
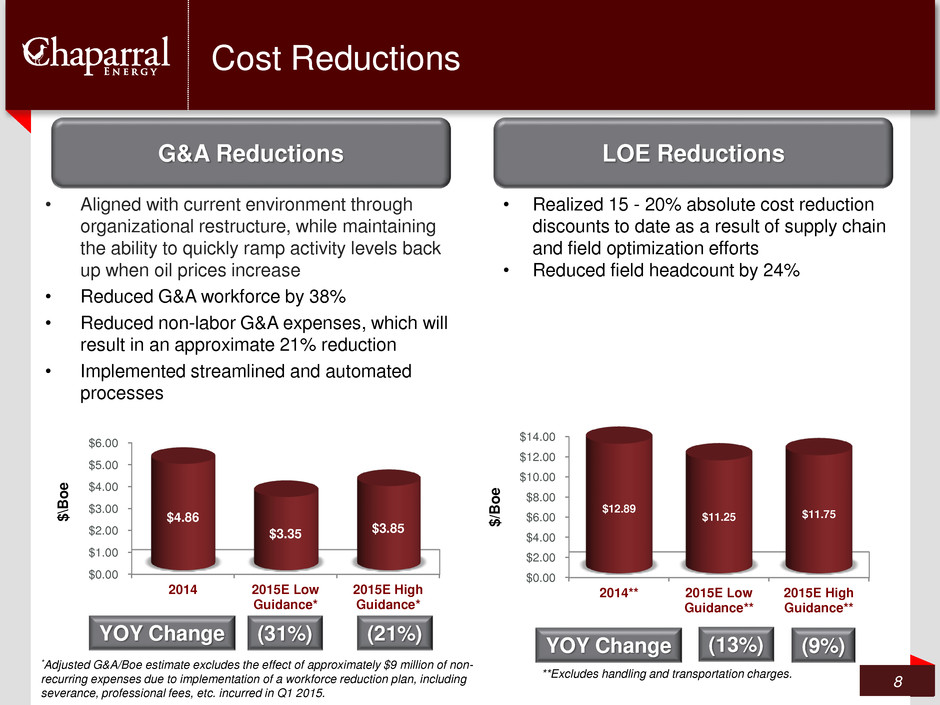
• Aligned with current environment through organizational restructure, while maintaining the ability to quickly ramp activity levels back up when oil prices increase • Reduced G&A workforce by 38% • Reduced non-labor G&A expenses, which will result in an approximate 21% reduction • Implemented streamlined and automated processes 8 G&A Reductions LOE Reductions • Realized 15 - 20% absolute cost reduction discounts to date as a result of supply chain and field optimization efforts • Reduced field headcount by 24% Cost Reductions $0.00 $2.00 $4.00 $6.00 $8.00 $10.00 $12.00 $14.00 2014** 2015E Low Guidance** 2015E High Guidance** $12.89 $11.25 $11.75 $/B o e $0.00 $1.00 $2.00 $3.00 $4.00 $5.00 $6.00 2014 2015E Low Guidance* 2015E High Guidance* $4.86 $3.35 $3.85 $ \B o e (31%) (21%) (13%) (9%) YOY Change YOY Change *Adjusted G&A/Boe estimate excludes the effect of approximately $9 million of non- recurring expenses due to implementation of a workforce reduction plan, including severance, professional fees, etc. incurred in Q1 2015. **Excludes handling and transportation charges.
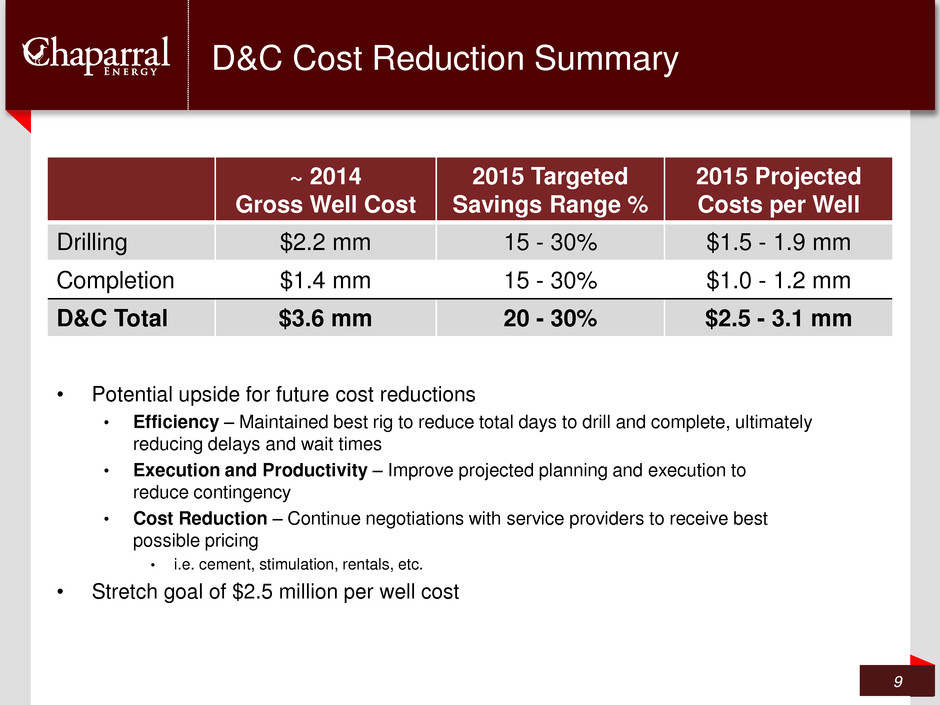
• Potential upside for future cost reductions • Efficiency – Maintained best rig to reduce total days to drill and complete, ultimately reducing delays and wait times • Execution and Productivity – Improve projected planning and execution to reduce contingency • Cost Reduction – Continue negotiations with service providers to receive best possible pricing • i.e. cement, stimulation, rentals, etc. • Stretch goal of $2.5 million per well cost D&C Cost Reduction Summary 9 ~ 2014 Gross Well Cost 2015 Targeted Savings Range % 2015 Projected Costs per Well Drilling $2.2 mm 15 - 30% $1.5 - 1.9 mm Completion $1.4 mm 15 - 30% $1.0 - 1.2 mm D&C Total $3.6 mm 20 - 30% $2.5 - 3.1 mm
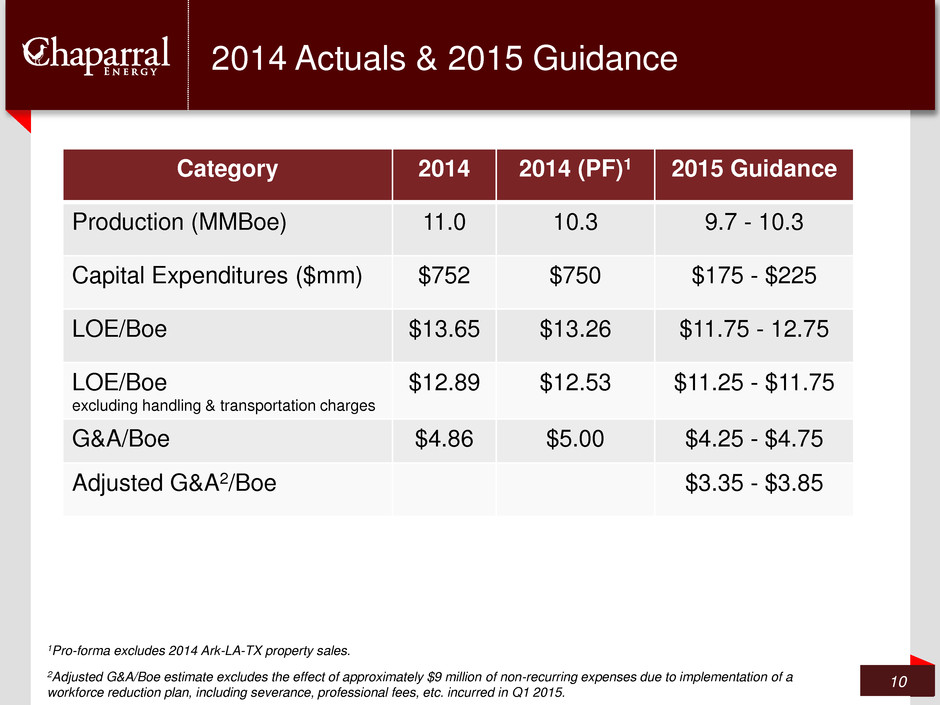
2014 Actuals & 2015 Guidance 10 Category 2014 2014 (PF)1 2015 Guidance Production (MMBoe) 11.0 10.3 9.7 - 10.3 Capital Expenditures ($mm) $752 $750 $175 - $225 LOE/Boe $13.65 $13.26 $11.75 - 12.75 LOE/Boe excluding handling & transportation charges $12.89 $12.53 $11.25 - $11.75 G&A/Boe $4.86 $5.00 $4.25 - $4.75 Adjusted G&A2/Boe $3.35 - $3.85 1Pro-forma excludes 2014 Ark-LA-TX property sales. 2Adjusted G&A/Boe estimate excludes the effect of approximately $9 million of non-recurring expenses due to implementation of a workforce reduction plan, including severance, professional fees, etc. incurred in Q1 2015.

Chaparral Overview 11 5/26/2015
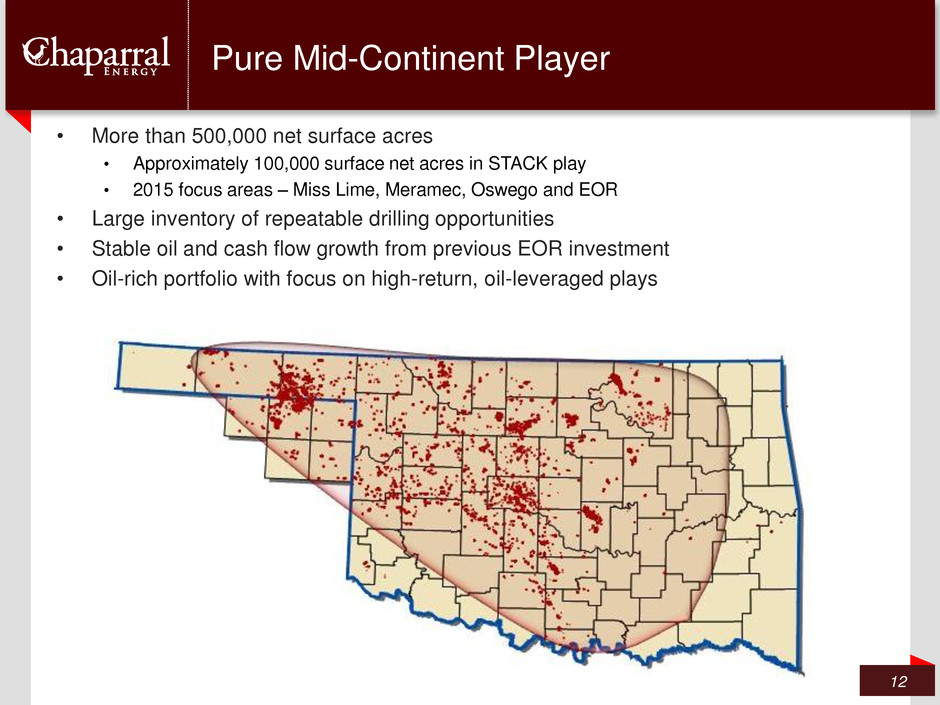
• More than 500,000 net surface acres • Approximately 100,000 surface net acres in STACK play • 2015 focus areas – Miss Lime, Meramec, Oswego and EOR • Large inventory of repeatable drilling opportunities • Stable oil and cash flow growth from previous EOR investment • Oil-rich portfolio with focus on high-return, oil-leveraged plays Pure Mid-Continent Player 12
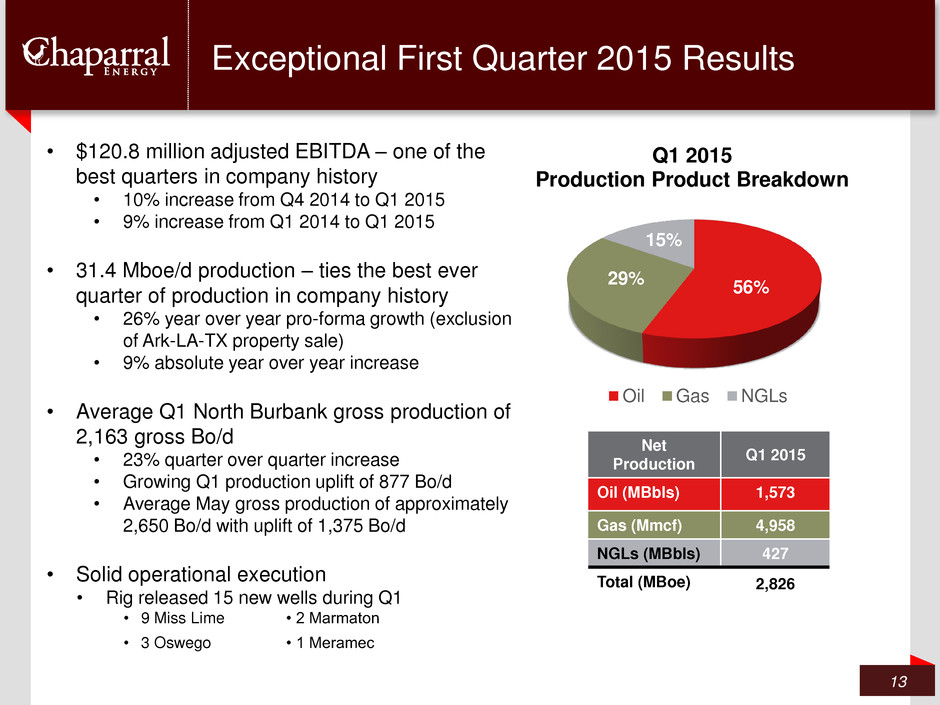
Exceptional First Quarter 2015 Results 13 56% 29% 15% Q1 2015 Production Product Breakdown Oil Gas NGLs Net Production Q1 2015 Oil (MBbls) 1,573 Gas (Mmcf) 4,958 NGLs (MBbls) 427 Total (MBoe) 2,826 • $120.8 million adjusted EBITDA – one of the best quarters in company history • 10% increase from Q4 2014 to Q1 2015 • 9% increase from Q1 2014 to Q1 2015 • 31.4 Mboe/d production – ties the best ever quarter of production in company history • 26% year over year pro-forma growth (exclusion of Ark-LA-TX property sale) • 9% absolute year over year increase • Average Q1 North Burbank gross production of 2,163 gross Bo/d • 23% quarter over quarter increase • Growing Q1 production uplift of 877 Bo/d • Average May gross production of approximately 2,650 Bo/d with uplift of 1,375 Bo/d • Solid operational execution • Rig released 15 new wells during Q1 • 9 Miss Lime • 2 Marmaton • 3 Oswego • 1 Meramec
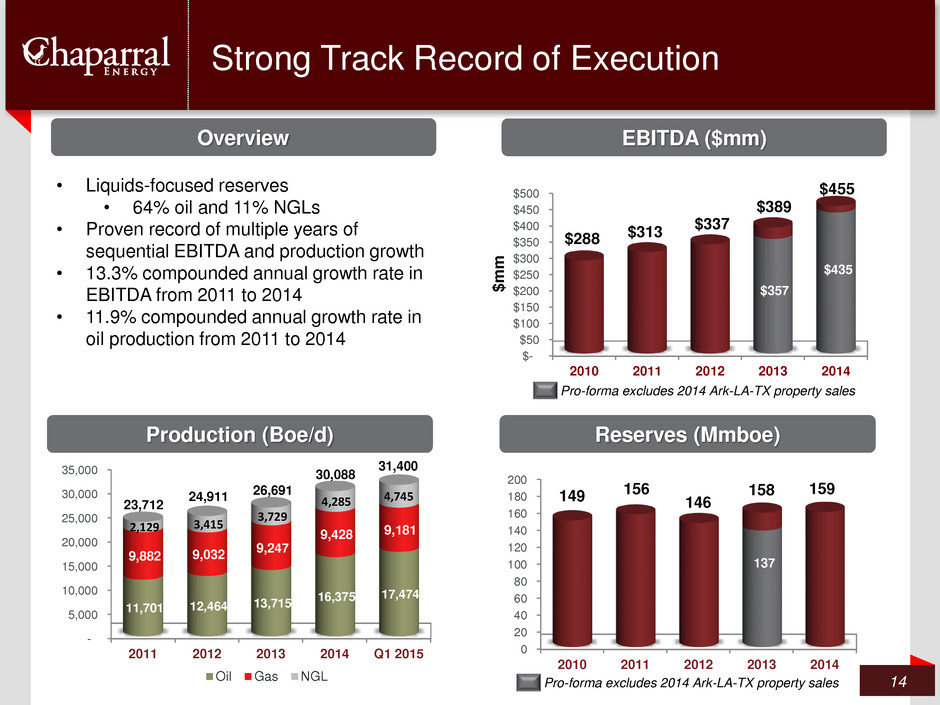
Strong Track Record of Execution 14 Production (Boe/d) EBITDA ($mm) Reserves (Mmboe) $- $50 $100 $150 $200 $250 $300 $350 $400 $450 $500 2010 2011 2012 2013 2014 $288 $313 $337 $389 $455 $ m m 0 20 40 60 80 100 120 140 160 180 200 2010 2011 2012 2013 2014 149 156 146 158 159 Overview - 5,000 10,000 15,000 20,000 25,000 30,000 35,000 2011 2012 2013 2014 Q1 2015 11,701 12,464 13,715 16,375 17,474 9,882 9,032 9,247 9,428 9,181 2,129 3,415 3,729 4,285 4,745 Oil Gas NGL • Liquids-focused reserves • 64% oil and 11% NGLs • Proven record of multiple years of sequential EBITDA and production growth • 13.3% compounded annual growth rate in EBITDA from 2011 to 2014 • 11.9% compounded annual growth rate in oil production from 2011 to 2014 23,712 24,911 26,691 30,088 Pro-forma excludes 2014 Ark-LA-TX property sales 137 Pro-forma excludes 2014 Ark-LA-TX property sales $357 $435 31,400
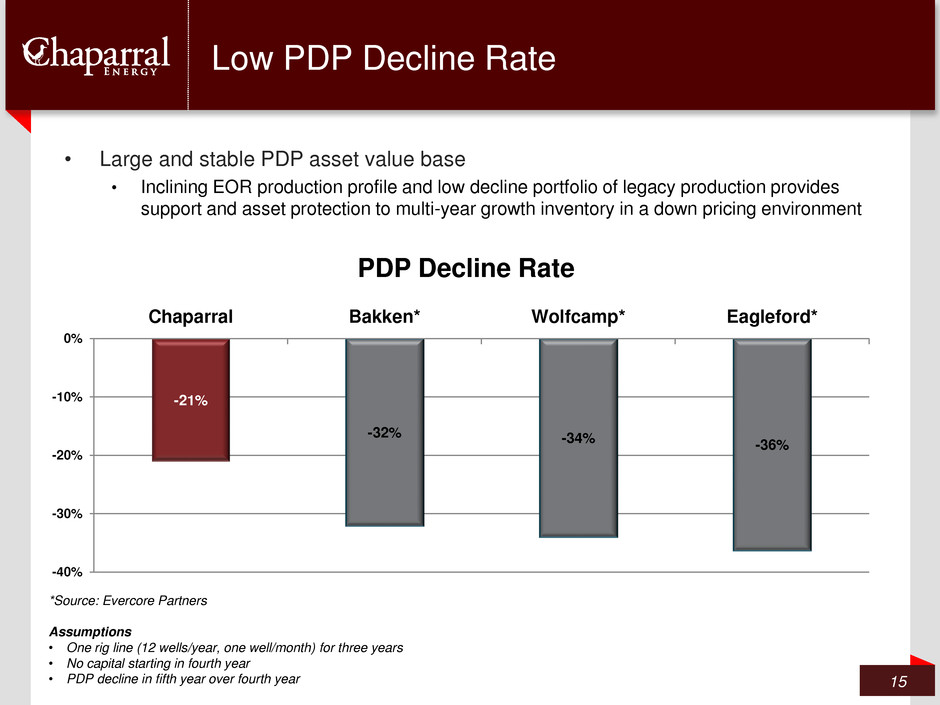
• Large and stable PDP asset value base • Inclining EOR production profile and low decline portfolio of legacy production provides support and asset protection to multi-year growth inventory in a down pricing environment Low PDP Decline Rate 15 -21% -32% -34% -36% -40% -30% -20% -10% 0% Chaparral Bakken* Wolfcamp* Eagleford* PDP Decline Rate *Source: Evercore Partners Assumptions • One rig line (12 wells/year, one well/month) for three years • No capital starting in fourth year • PDP decline in fifth year over fourth year
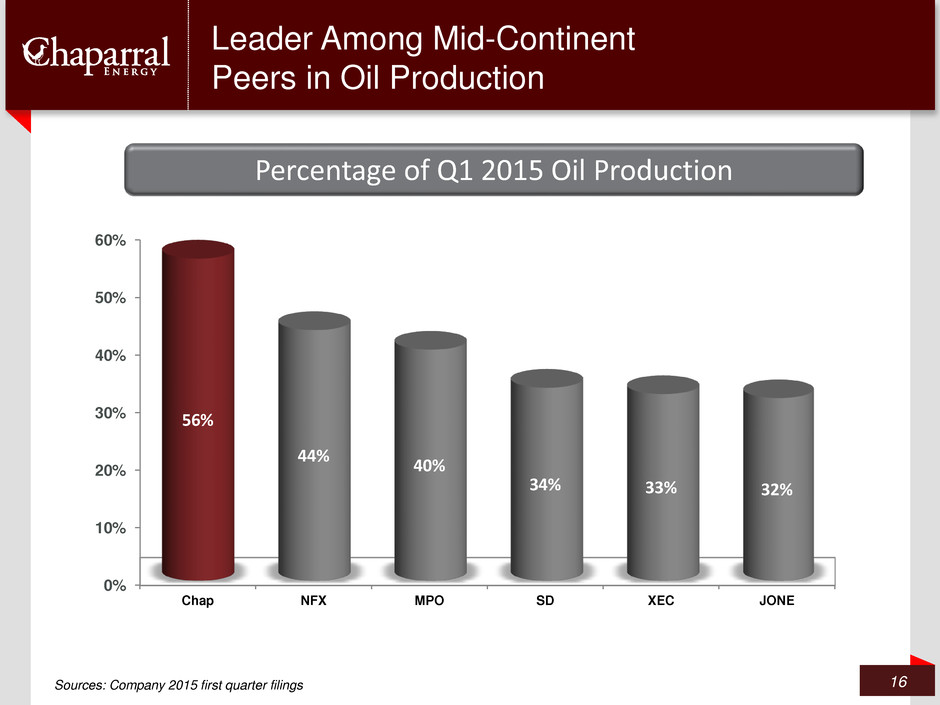
Leader Among Mid-Continent Peers in Oil Production 16 Percentage of Q1 2015 Oil Production $300 0% 10% 20% 30% 40% 50% 60% Chap NFX MPO SD XEC JONE 56% 44% 40% 34% 33% 32% Sources: Company 2015 first quarter filings
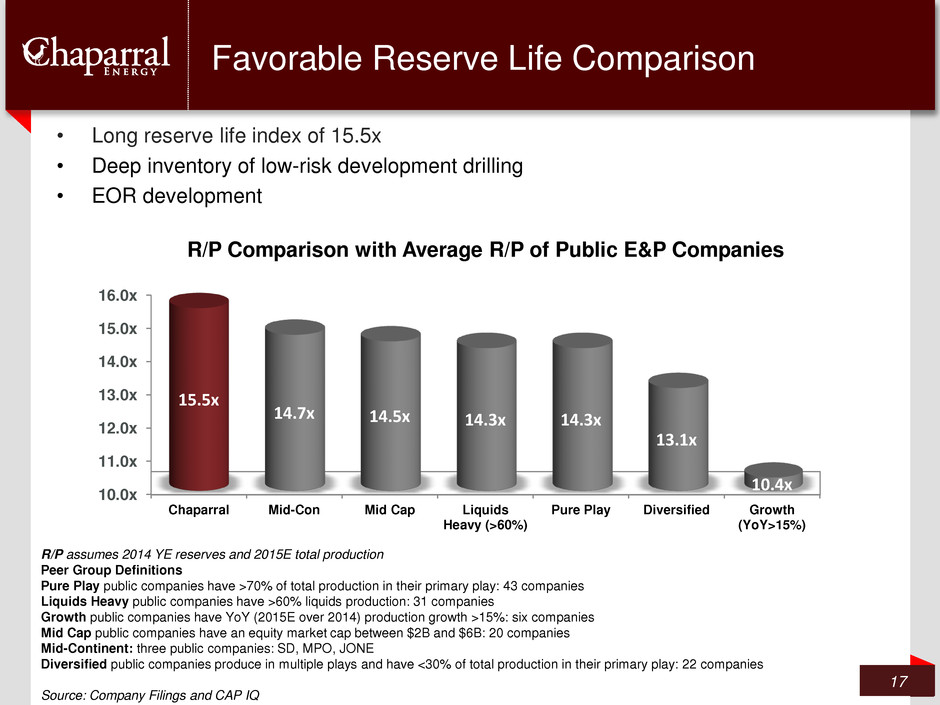
• Long reserve life index of 15.5x • Deep inventory of low-risk development drilling • EOR development Favorable Reserve Life Comparison 17 R/P Comparison with Average R/P of Public E&P Companies 10.0x 11.0x 12.0x 13.0x 14.0x 15.0x 16.0x Chaparral Mid-Con Mid Cap Liquids Heavy (>60%) Pure Play Diversified Growth (YoY>15%) 15.5x 14.7x 14.5x 14.3x 14.3x 13.1x 10.4x R/P assumes 2014 YE reserves and 2015E total production Peer Group Definitions Pure Play public companies have >70% of total production in their primary play: 43 companies Liquids Heavy public companies have >60% liquids production: 31 companies Growth public companies have YoY (2015E over 2014) production growth >15%: six companies Mid Cap public companies have an equity market cap between $2B and $6B: 20 companies Mid-Continent: three public companies: SD, MPO, JONE Diversified public companies produce in multiple plays and have <30% of total production in their primary play: 22 companies Source: Company Filings and CAP IQ
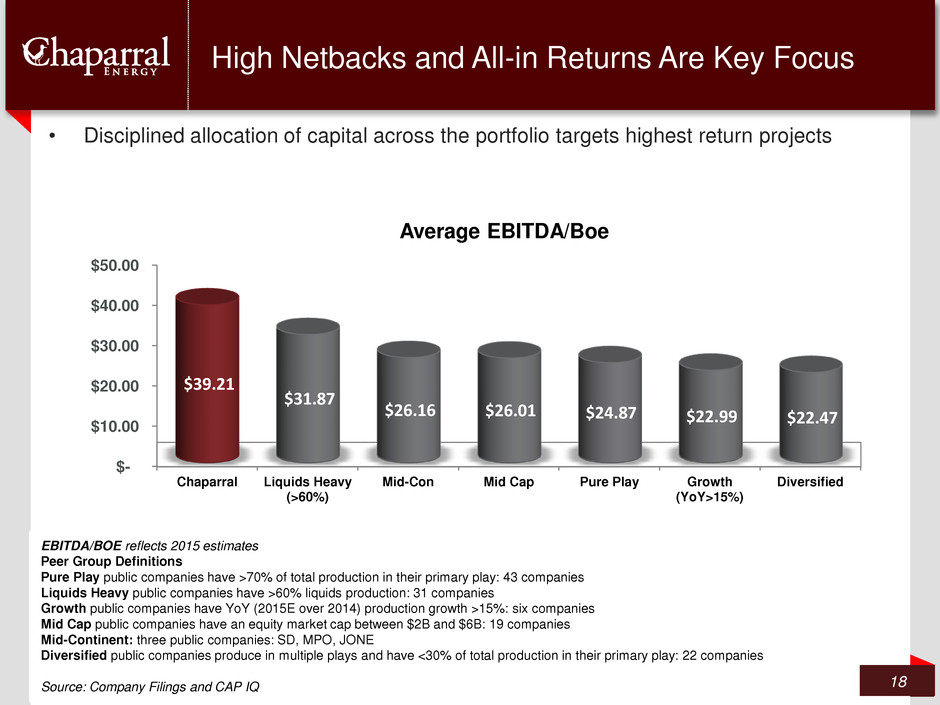
• Disciplined allocation of capital across the portfolio targets highest return projects High Netbacks and All-in Returns Are Key Focus 18 EBITDA/BOE reflects 2015 estimates Peer Group Definitions Pure Play public companies have >70% of total production in their primary play: 43 companies Liquids Heavy public companies have >60% liquids production: 31 companies Growth public companies have YoY (2015E over 2014) production growth >15%: six companies Mid Cap public companies have an equity market cap between $2B and $6B: 19 companies Mid-Continent: three public companies: SD, MPO, JONE Diversified public companies produce in multiple plays and have <30% of total production in their primary play: 22 companies Source: Company Filings and CAP IQ $- $10.00 $20.00 $30.00 $40.00 $50.00 Chaparral Liquids Heavy (>60%) Mid-Con Mid Cap Pure Play Growth (YoY>15%) Diversified $39.21 $31.87 $26.16 $26.01 $24.87 $22.99 $22.47 Average EBITDA/Boe
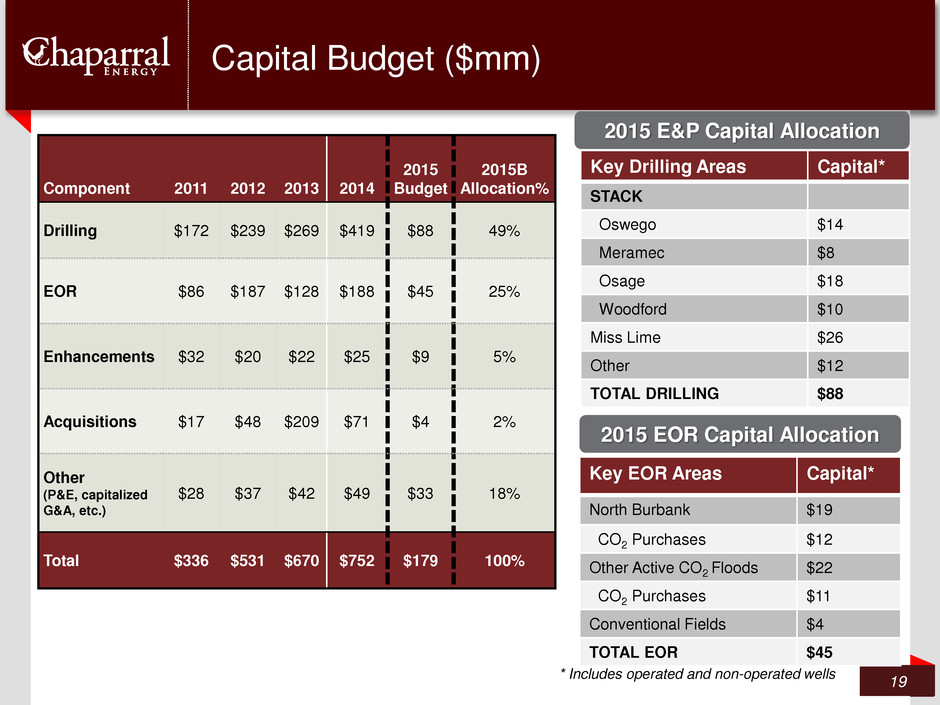
Key EOR Areas Capital* North Burbank $19 CO2 Purchases $12 Other Active CO2 Floods $22 CO2 Purchases $11 Conventional Fields $4 TOTAL EOR $45 * Includes operated and non-operated wells 2015 EOR Capital Allocation Capital Budget ($mm) 19 Component 2011 2012 2013 2014 2015 Budget 2015B Allocation% Drilling $172 $239 $269 $419 $88 49% EOR $86 $187 $128 $188 $45 25% Enhancements $32 $20 $22 $25 $9 5% Acquisitions $17 $48 $209 $71 $4 2% Other (P&E, capitalized G&A, etc.) $28 $37 $42 $49 $33 18% Total $336 $531 $670 $752 $179 100% 2015 E&P Capital Allocation Key Drilling Areas Capital* STACK Oswego $14 Meramec $8 Osage $18 Woodford $10 Miss Lime $26 Other $12 TOTAL DRILLING $88
2015 Focus Areas 20
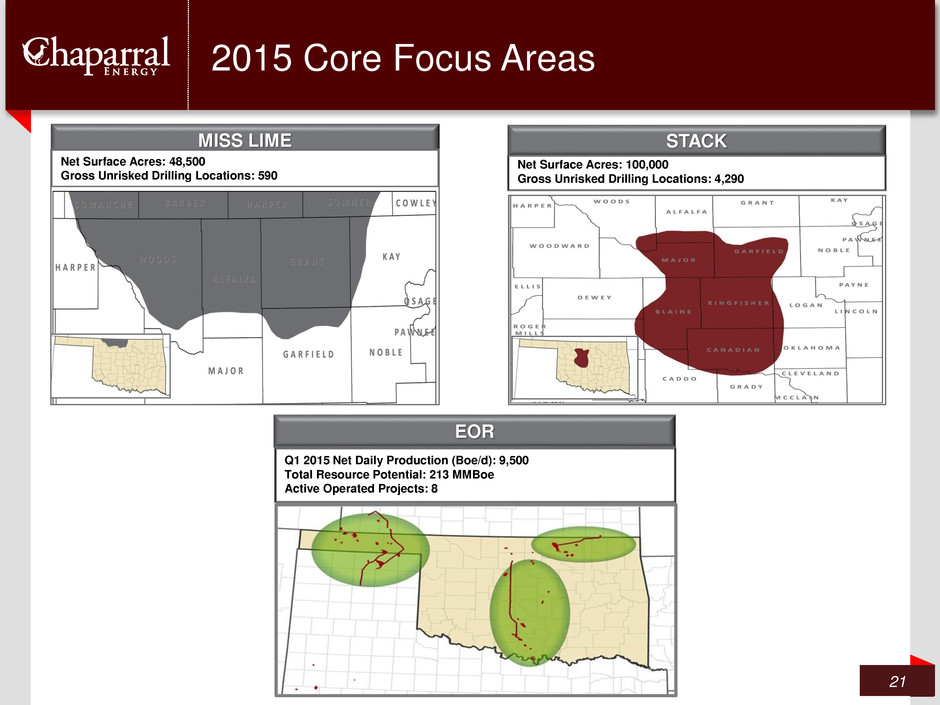
2015 Core Focus Areas 21 Net Surface Acres: 100,000 Gross Unrisked Drilling Locations: 4,290 STACK Q1 2015 Net Daily Production (Boe/d): 9,500 Total Resource Potential: 213 MMBoe Active Operated Projects: 8 EOR MISS LIME Net Surface Acres: 48,500 Gross Unrisked Drilling Locations: 590
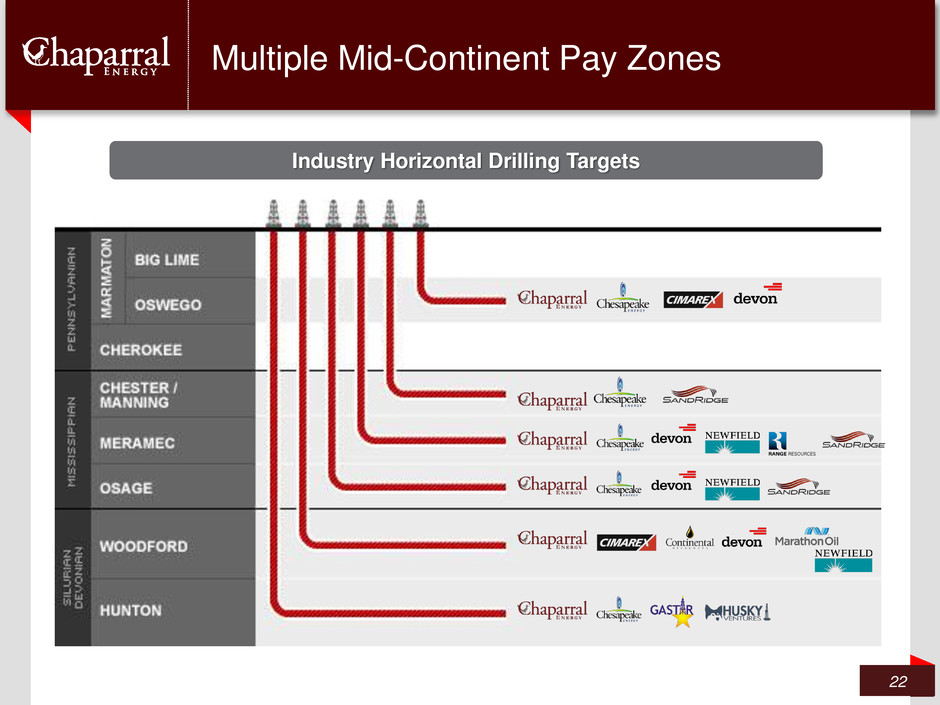
Multiple Mid-Continent Pay Zones 22 Industry Horizontal Drilling Targets
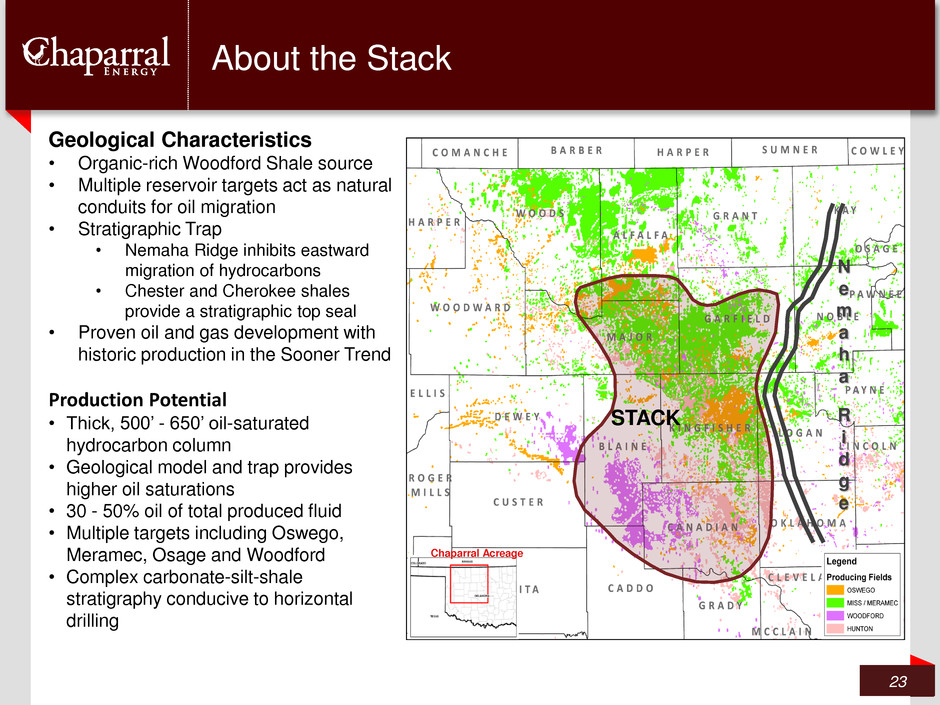
23 About the Stack Geological Characteristics • Organic-rich Woodford Shale source • Multiple reservoir targets act as natural conduits for oil migration • Stratigraphic Trap • Nemaha Ridge inhibits eastward migration of hydrocarbons • Chester and Cherokee shales provide a stratigraphic top seal • Proven oil and gas development with historic production in the Sooner Trend Production Potential • Thick, 500’ - 650’ oil-saturated hydrocarbon column • Geological model and trap provides higher oil saturations • 30 - 50% oil of total produced fluid • Multiple targets including Oswego, Meramec, Osage and Woodford • Complex carbonate-silt-shale stratigraphy conducive to horizontal drilling Chaparral Acreage Chaparral Acreage N e m a h a R i d g e STACK
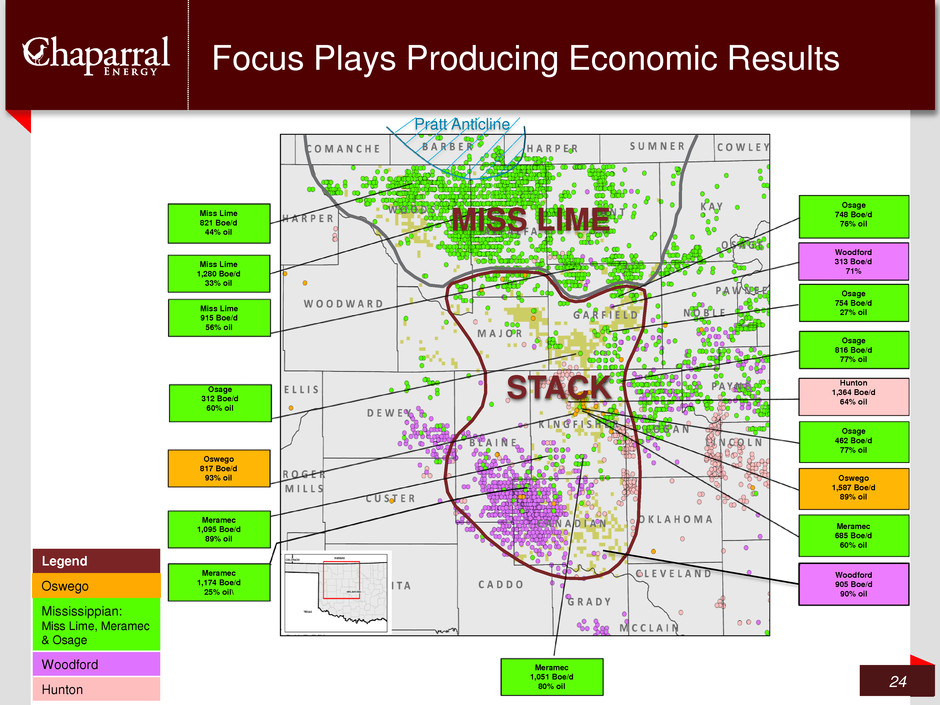
Focus Plays Producing Economic Results 24 Miss Lime 821 Boe/d 44% oil Miss Lime 915 Boe/d 56% oil Hunton 1,364 Boe/d 64% oil Woodford 313 Boe/d 71% Osage 754 Boe/d 27% oil Oswego 1,587 Boe/d 89% oil Osage 816 Boe/d 77% oil Miss Lime 1,280 Boe/d 33% oil Osage 462 Boe/d 77% oil Pratt Anticline Meramec 685 Boe/d 60% oil Osage 748 Boe/d 76% oil Woodford 905 Boe/d 90% oil Meramec 1,174 Boe/d 25% oil\ Meramec 1,095 Boe/d 89% oil MISS LIME STACK Osage 312 Boe/d 60% oil Legend Oswego Mississippian: Miss Lime, Meramec & Osage Woodford Hunton Meramec 1,051 Boe/d 80% oil Oswego 817 Boe/d 93% oil
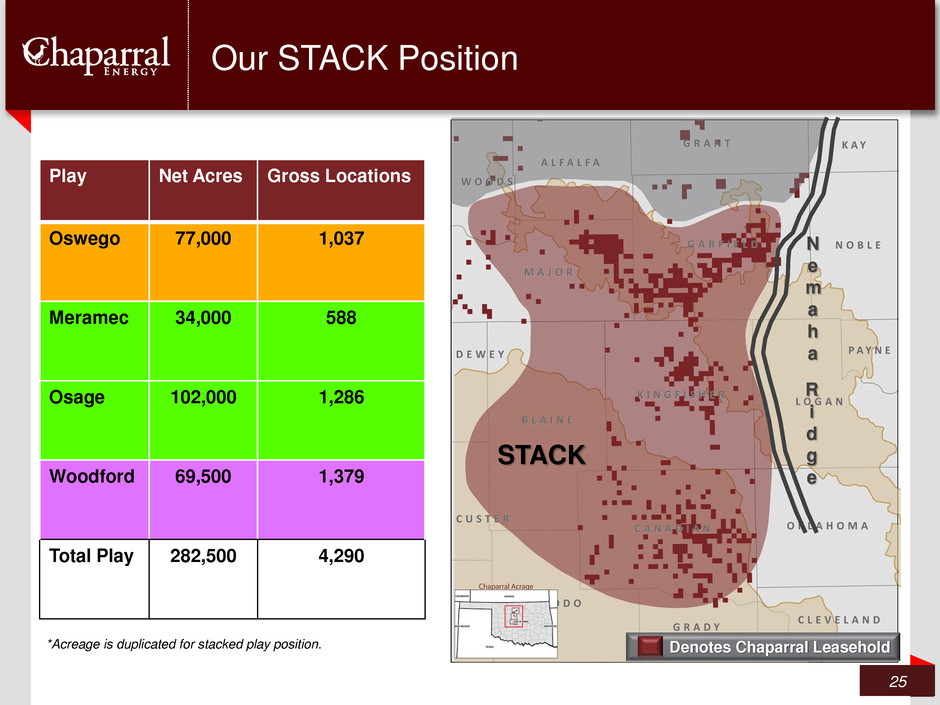
Our STACK Position 25 Play Net Acres Gross Locations Oswego 77,000 1,037 Meramec 34,000 588 Osage 102,000 1,286 Woodford 69,500 1,379 Total Play 282,500 4,290 Denotes Chaparral Leasehold *Acreage is duplicated for stacked play position. N e m a h a R i d g e STACK
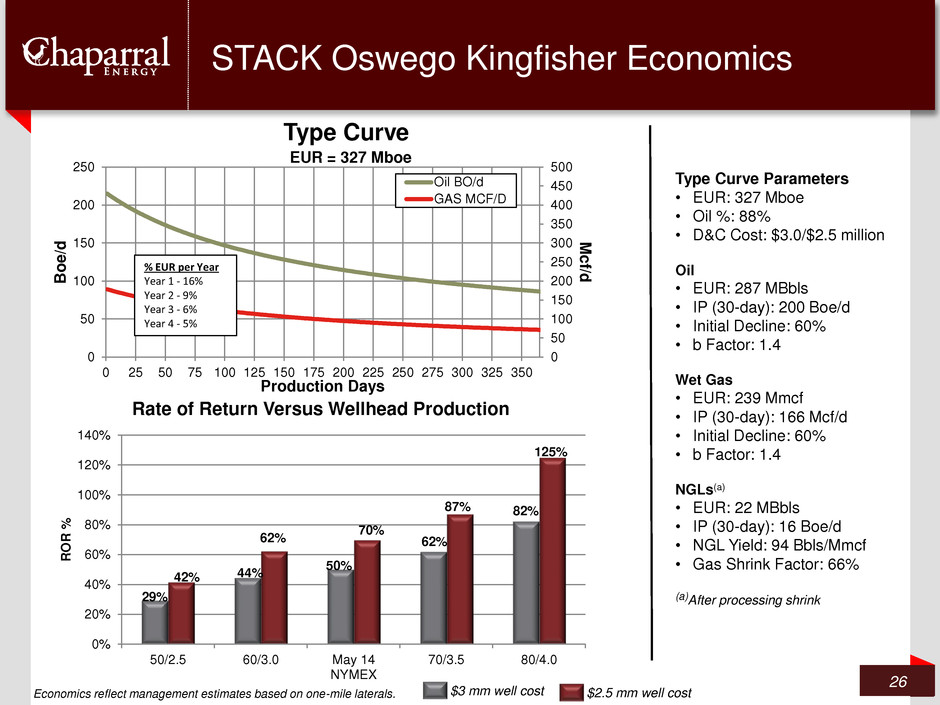
0 50 100 150 200 250 300 350 400 450 500 0 50 100 150 200 250 0 25 50 75 100 125 150 175 200 225 250 275 300 325 350 M c f/ d Boe /d Production Days Type Curve Oil BO/d GAS MCF/D EUR = 327 Mboe STACK Oswego Kingfisher Economics 26 Type Curve Parameters • EUR: 327 Mboe • Oil %: 88% • D&C Cost: $3.0/$2.5 million Oil • EUR: 287 MBbls • IP (30-day): 200 Boe/d • Initial Decline: 60% • b Factor: 1.4 Wet Gas • EUR: 239 Mmcf • IP (30-day): 166 Mcf/d • Initial Decline: 60% • b Factor: 1.4 NGLs(a) • EUR: 22 MBbls • IP (30-day): 16 Boe/d • NGL Yield: 94 Bbls/Mmcf • Gas Shrink Factor: 66% (a)After processing shrink % EUR per Year Year 1 - 16% Year 2 - 9% Year 3 - 6% Year 4 - 5% $3 mm well cost $2.5 mm well cost 29% 44% 50% 62% 82% 0% 20% 40% 60% 80% 100% 120% 140% 50/2.5 60/3.0 May 14 NYMEX 70/3.5 80/4.0 R O R % Rate of Return Versus Wellhead Production 125% 87% 70% 62% 42% Economics reflect management estimates based on one-mile laterals.
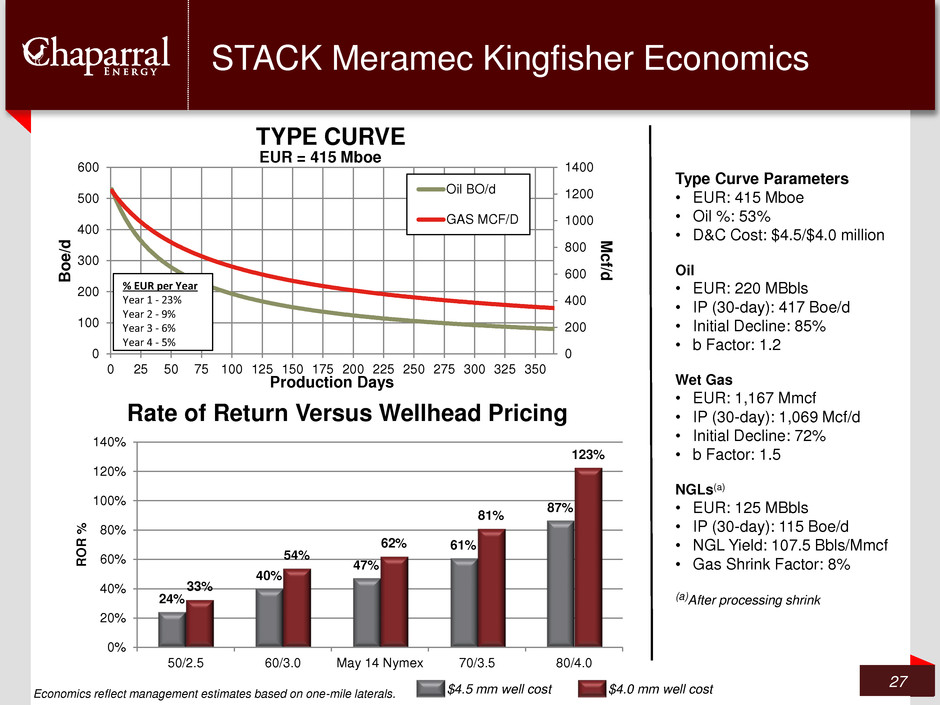
STACK Meramec Kingfisher Economics 27 0 200 400 600 800 1000 1200 1400 0 100 200 300 400 500 600 0 25 50 75 100 125 150 175 200 225 250 275 300 325 350 M c f/ d Boe /d Production Days TYPE CURVE Oil BO/d GAS MCF/D EUR = 415 Mboe % EUR per Year Year 1 - 23% Year 2 - 9% Year 3 - 6% Year 4 - 5% Type Curve Parameters • EUR: 415 Mboe • Oil %: 53% • D&C Cost: $4.5/$4.0 million Oil • EUR: 220 MBbls • IP (30-day): 417 Boe/d • Initial Decline: 85% • b Factor: 1.2 Wet Gas • EUR: 1,167 Mmcf • IP (30-day): 1,069 Mcf/d • Initial Decline: 72% • b Factor: 1.5 NGLs(a) • EUR: 125 MBbls • IP (30-day): 115 Boe/d • NGL Yield: 107.5 Bbls/Mmcf • Gas Shrink Factor: 8% (a)After processing shrink $4.5 mm well cost $4.0 mm well cost 24% 40% 47% 61% 87% 33% 54% 62% 81% 123% 0% 20% 40% 60% 80% 100% 120% 140% 50/2.5 60/3.0 May 14 Nymex 70/3.5 80/4.0 R O R % Rate of Return Versus Wellhead Pricing Economics reflect management estimates based on one-mile laterals.
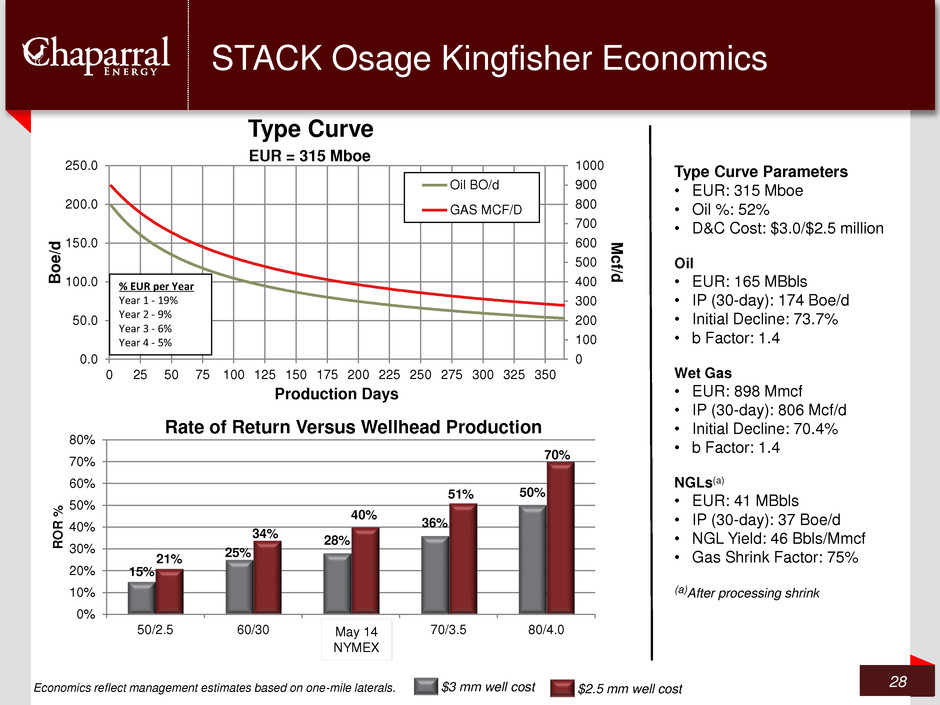
0 100 200 300 400 500 600 700 800 900 1000 0.0 50.0 100.0 150.0 200.0 250.0 0 25 50 75 100 125 150 175 200 225 250 275 300 325 350 M c f/ d Boe /d Production Days Type Curve Oil BO/d GAS MCF/D EUR = 315 Mboe 21% 34% 40% 51% 70% STACK Osage Kingfisher Economics 28 Type Curve Parameters • EUR: 315 Mboe • Oil %: 52% • D&C Cost: $3.0/$2.5 million Oil • EUR: 165 MBbls • IP (30-day): 174 Boe/d • Initial Decline: 73.7% • b Factor: 1.4 Wet Gas • EUR: 898 Mmcf • IP (30-day): 806 Mcf/d • Initial Decline: 70.4% • b Factor: 1.4 NGLs(a) • EUR: 41 MBbls • IP (30-day): 37 Boe/d • NGL Yield: 46 Bbls/Mmcf • Gas Shrink Factor: 75% (a)After processing shrink % EUR per Year Year 1 - 19% Year 2 - 9% Year 3 - 6% Year 4 - 5% $3 mm well cost $2.5 mm well cost 15% 25% 28% 36% 50% 0% 10% 20% 30% 40% 50% 60% 70% 80% 50/2.5 60/30 May 15 NYMEX 70/3.5 80/4.0 R O R % Rate of Return Versus Wellhead Production Economics reflect management estimates based on one-mile laterals. May 14 NYMEX
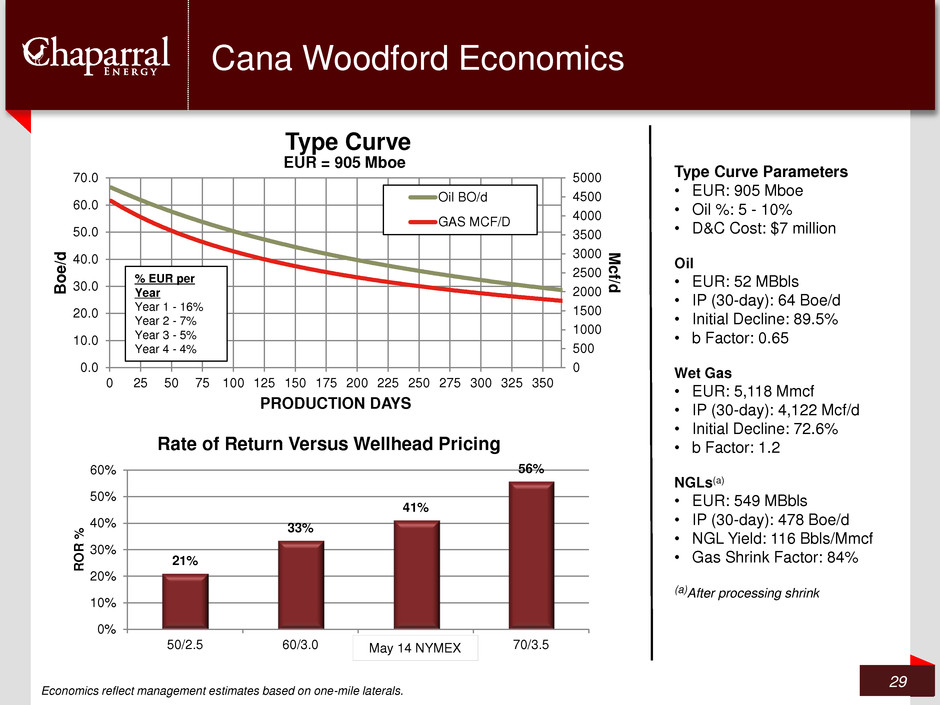
0 500 1000 1500 2000 2500 3000 3500 4000 4500 5000 0.0 10.0 20.0 30.0 40.0 50.0 60.0 70.0 0 25 50 75 100 125 150 175 200 225 250 275 300 325 350 M c f/ d Boe /d PRODUCTION DAYS Type Curve Oil BO/d GAS MCF/D EUR = 905 Mboe Cana Woodford Economics 29 Type Curve Parameters • EUR: 905 Mboe • Oil %: 5 - 10% • D&C Cost: $7 million Oil • EUR: 52 MBbls • IP (30-day): 64 Boe/d • Initial Decline: 89.5% • b Factor: 0.65 Wet Gas • EUR: 5,118 Mmcf • IP (30-day): 4,122 Mcf/d • Initial Decline: 72.6% • b Factor: 1.2 NGLs(a) • EUR: 549 MBbls • IP (30-day): 478 Boe/d • NGL Yield: 116 Bbls/Mmcf • Gas Shrink Factor: 84% (a)After processing shrink % EUR per Year Year 1 - 16% Year 2 - 7% Year 3 - 5% Year 4 - 4% Economics reflect management estimates based on one-mile laterals. 21% 33% 41% 56% 0% 10% 20% 30% 40% 50% 60% 50/2.5 60/3.0 May 15 Nymex 70/3.5 R O R % Rate of Return Versus Wellhead Pricing ay 14 NYMEX
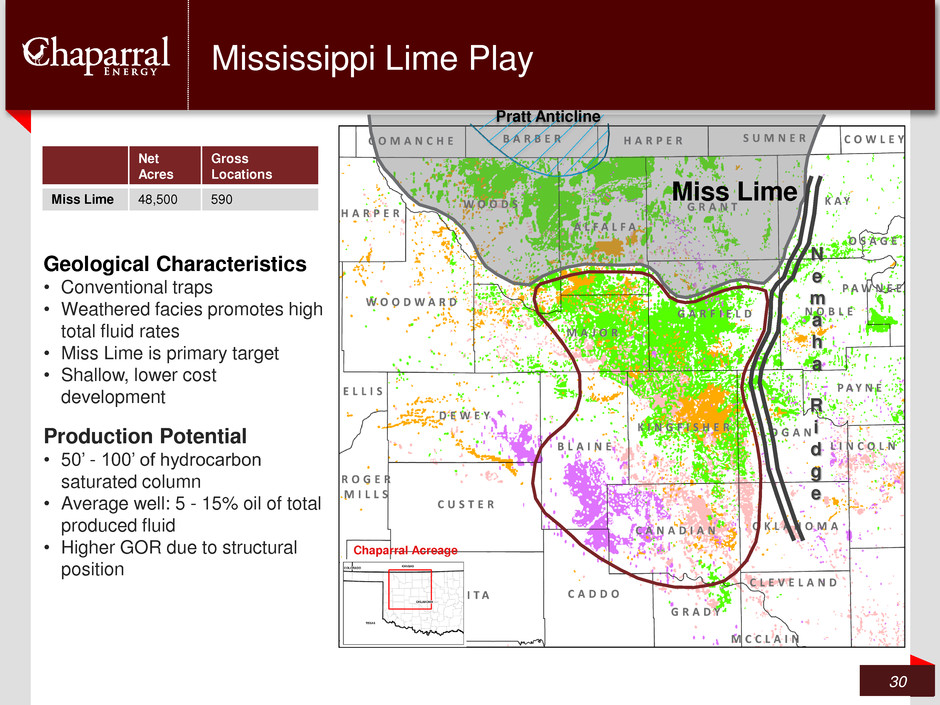
Mississippi Lime Play 30 Net Acres Gross Locations Miss Lime 48,500 590 Geological Characteristics • Conventional traps • Weathered facies promotes high total fluid rates • Miss Lime is primary target • Shallow, lower cost development Production Potential • 50’ - 100’ of hydrocarbon saturated column • Average well: 5 - 15% oil of total produced fluid • Higher GOR due to structural position N e m a h a R i d g e Miss Lime Chaparral Acreage Pratt Anticline
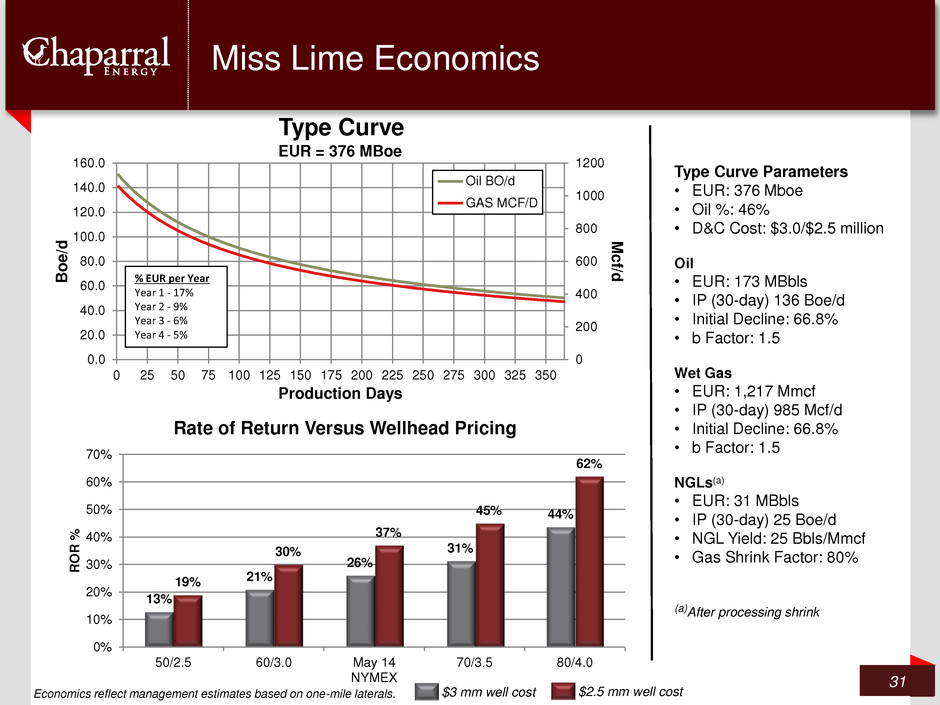
0 200 400 600 800 1000 1200 0.0 20.0 40.0 60.0 80.0 100.0 120.0 140.0 160.0 0 25 50 75 100 125 150 175 200 225 250 275 300 325 350 M c f/ d Boe /d Production Days Type Curve Oil BO/d GAS MCF/D EUR = 376 MBoe Miss Lime Economics 31 Type Curve Parameters • EUR: 376 Mboe • Oil %: 46% • D&C Cost: $3.0/$2.5 million Oil • EUR: 173 MBbls • IP (30-day) 136 Boe/d • Initial Decline: 66.8% • b Factor: 1.5 Wet Gas • EUR: 1,217 Mmcf • IP (30-day) 985 Mcf/d • Initial Decline: 66.8% • b Factor: 1.5 NGLs(a) • EUR: 31 MBbls • IP (30-day) 25 Boe/d • NGL Yield: 25 Bbls/Mmcf • Gas Shrink Factor: 80% (a)After processing shrink % EUR per Year Year 1 - 17% Year 2 - 9% Year 3 - 6% Year 4 - 5% $3 mm well cost $2.5 mm well cost 13% 21% 26% 31% 44% 19% 30% 37% 45% 62% 0% 10% 20% 30% 40% 50% 60% 70% 50/2.5 60/3.0 May 14 NYMEX 70/3.5 80/4.0 R O R % Rate of Return Versus Wellhead Pricing Economics reflect management estimates based on one-mile laterals.
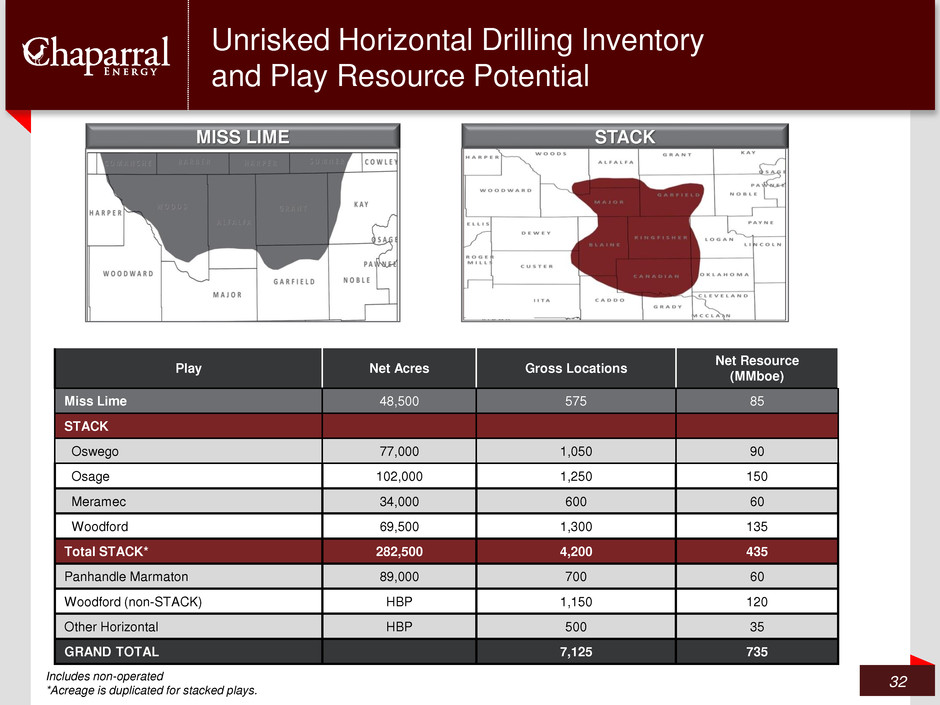
Play Net Acres Gross Locations Net Resource (MMboe) Miss Lime 48,500 575 85 STACK Oswego 77,000 1,050 90 Osage 102,000 1,250 150 Meramec 34,000 600 60 Woodford 69,500 1,300 135 Total STACK* 282,500 4,200 435 Panhandle Marmaton 89,000 700 60 Woodford (non-STACK) HBP 1,150 120 Other Horizontal HBP 500 35 GRAND TOTAL 7,125 735 Unrisked Horizontal Drilling Inventory and Play Resource Potential 32 Includes non-operated *Acreage is duplicated for stacked plays. STACK MISS LIME
CO2 EOR – Major Part of Growth Story
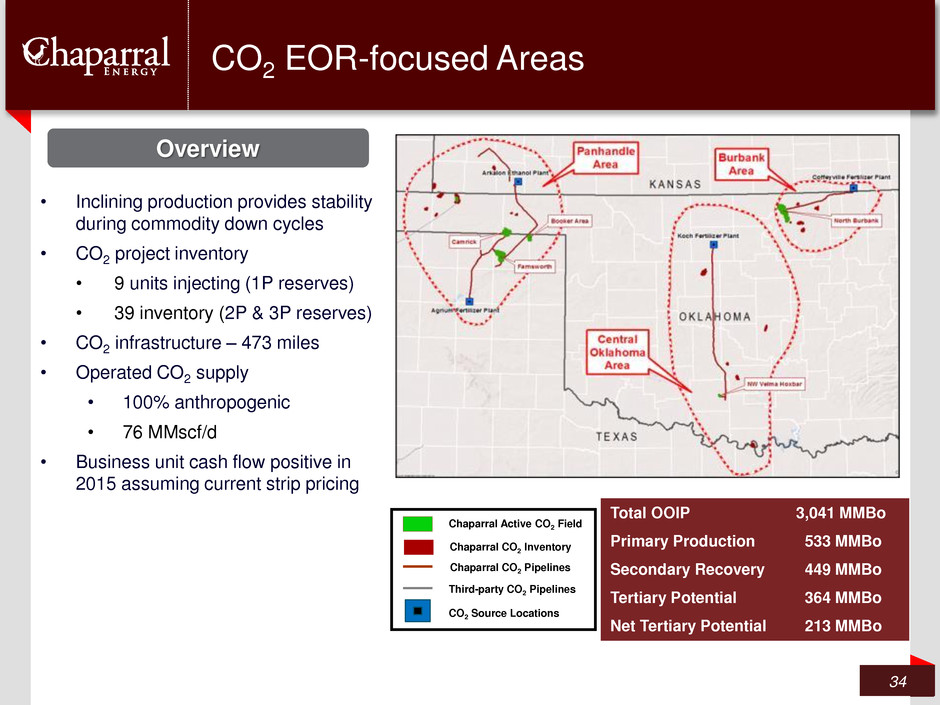
CO2 EOR-focused Areas 34 • Inclining production provides stability during commodity down cycles • CO2 project inventory • 9 units injecting (1P reserves) • 39 inventory (2P & 3P reserves) • CO2 infrastructure – 473 miles • Operated CO2 supply • 100% anthropogenic • 76 MMscf/d • Business unit cash flow positive in 2015 assuming current strip pricing Overview Total OOIP 3,041 MMBo Primary Production 533 MMBo Secondary Recovery 449 MMBo Tertiary Potential 364 MMBo Net Tertiary Potential 213 MMBo Chaparral Active CO2 Field Chaparral CO2 Pipelines Third-party CO2 Pipelines CO2 Source Locations Chaparral CO2 Inventory
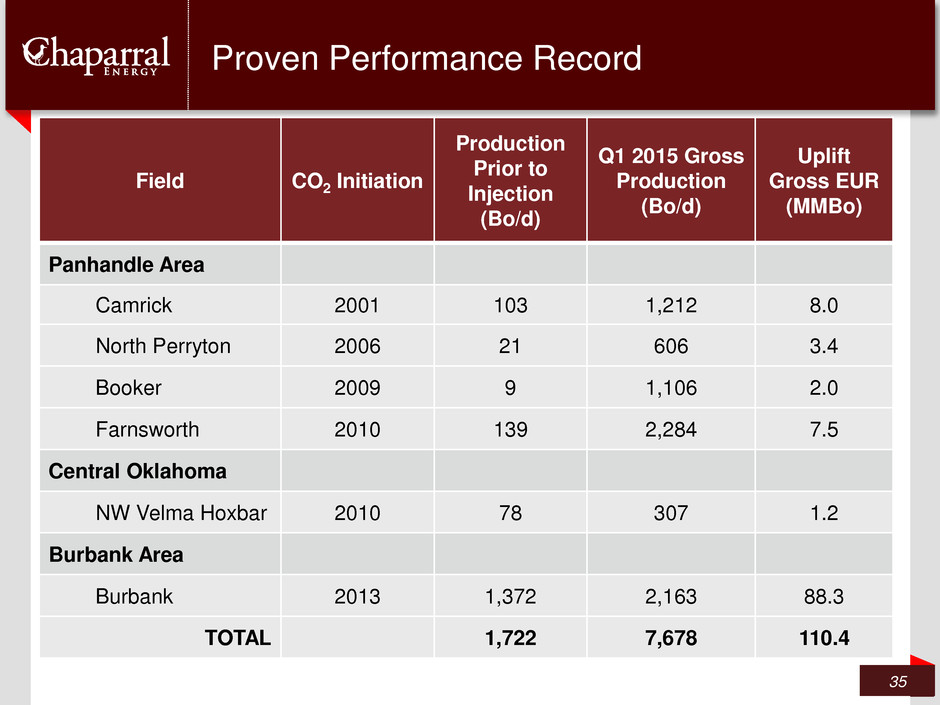
Proven Performance Record 35 Field CO2 Initiation Production Prior to Injection (Bo/d) Q1 2015 Gross Production (Bo/d) Uplift Gross EUR (MMBo) Panhandle Area Camrick 2001 103 1,212 8.0 North Perryton 2006 21 606 3.4 Booker 2009 9 1,106 2.0 Farnsworth 2010 139 2,284 7.5 Central Oklahoma NW Velma Hoxbar 2010 78 307 1.2 Burbank Area Burbank 2013 1,372 2,163 88.3 TOTAL 1,722 7,678 110.4
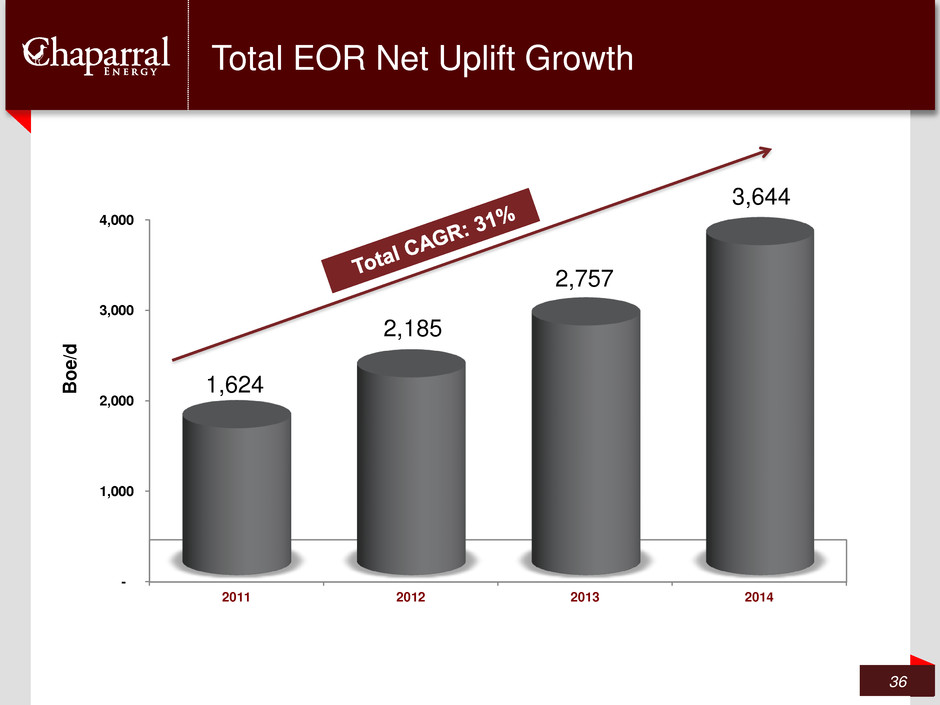
Total EOR Net Uplift Growth 36 - 1,000 2,000 3,000 4,000 2011 2012 2013 2014 1,624 2,185 2,757 3,644 B o e/ d
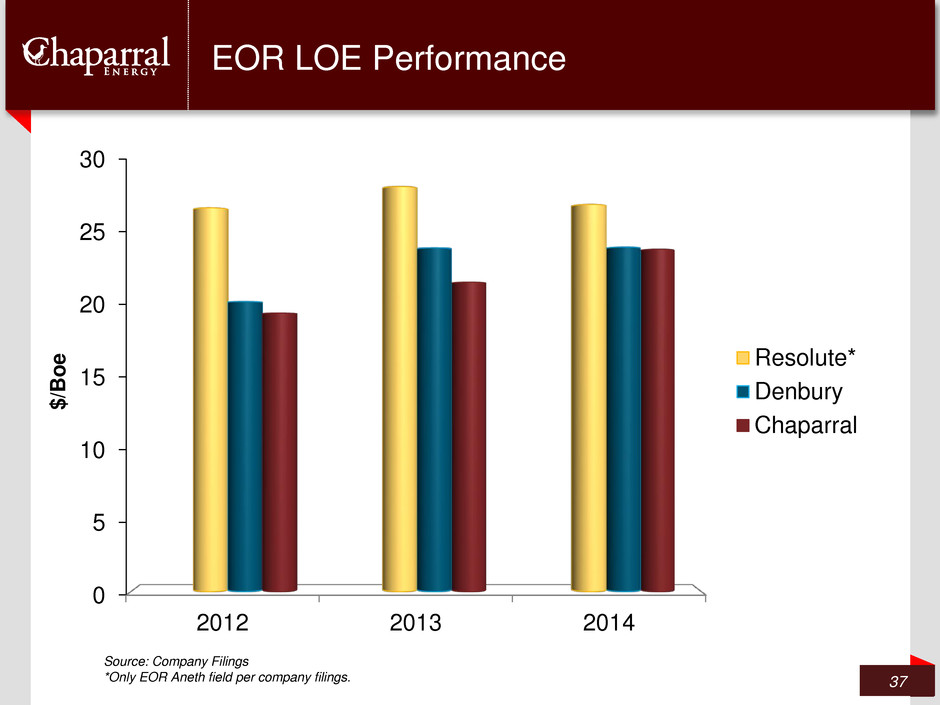
EOR LOE Performance 37 0 5 10 15 20 25 30 2012 2013 2014 Resolute* Denbury Chaparral Source: Company Filings *Only EOR Aneth field per company filings. $/B o e
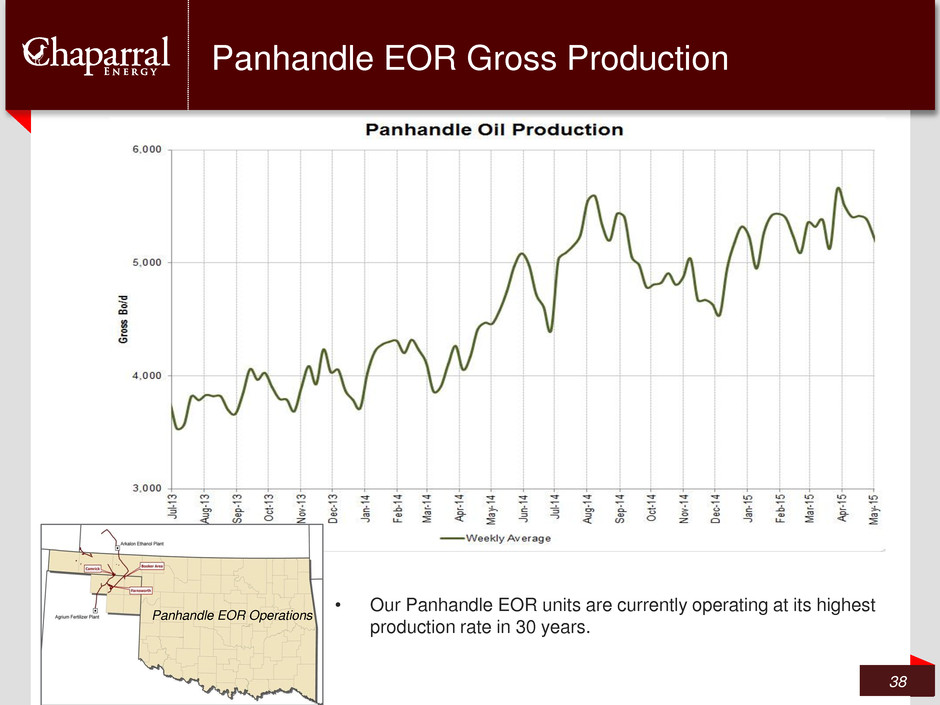
Panhandle EOR Gross Production 38 Panhandle EOR Operations • Our Panhandle EOR units are currently operating at its highest production rate in 30 years.
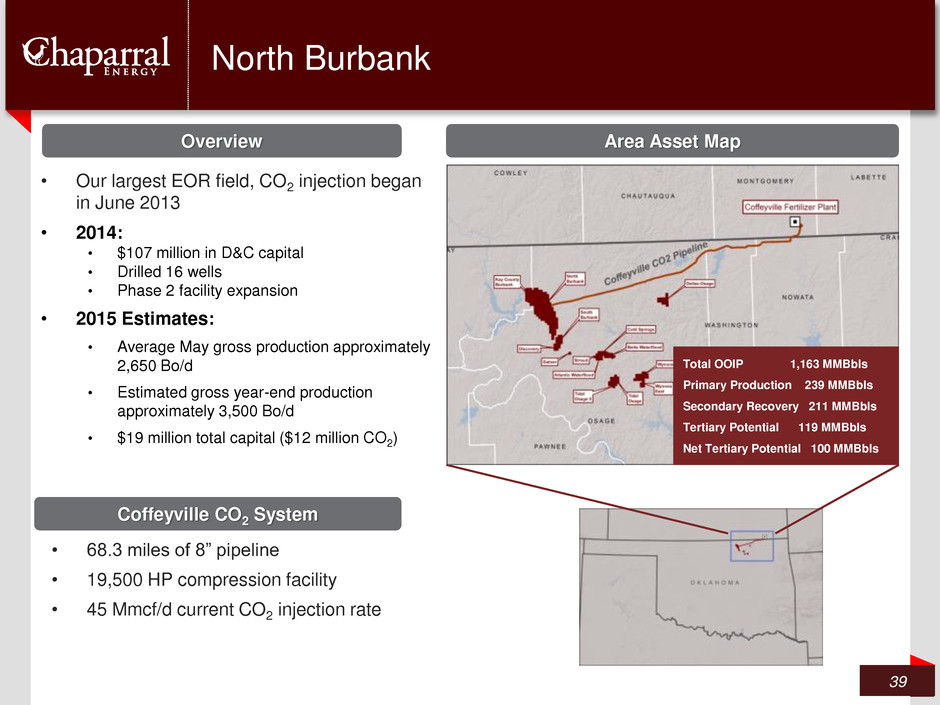
North Burbank 39 • Our largest EOR field, CO2 injection began in June 2013 • 2014: • $107 million in D&C capital • Drilled 16 wells • Phase 2 facility expansion • 2015 Estimates: • Average May gross production approximately 2,650 Bo/d • Estimated gross year-end production approximately 3,500 Bo/d • $19 million total capital ($12 million CO2) Overview Area Asset Map • 68.3 miles of 8” pipeline • 19,500 HP compression facility • 45 Mmcf/d current CO2 injection rate Coffeyville CO2 System Total OOIP 1,163 MMBbls Primary Production 239 MMBbls Secondary Recovery 211 MMBbls Tertiary Potential 119 MMBbls Net Tertiary Potential 100 MMBbls
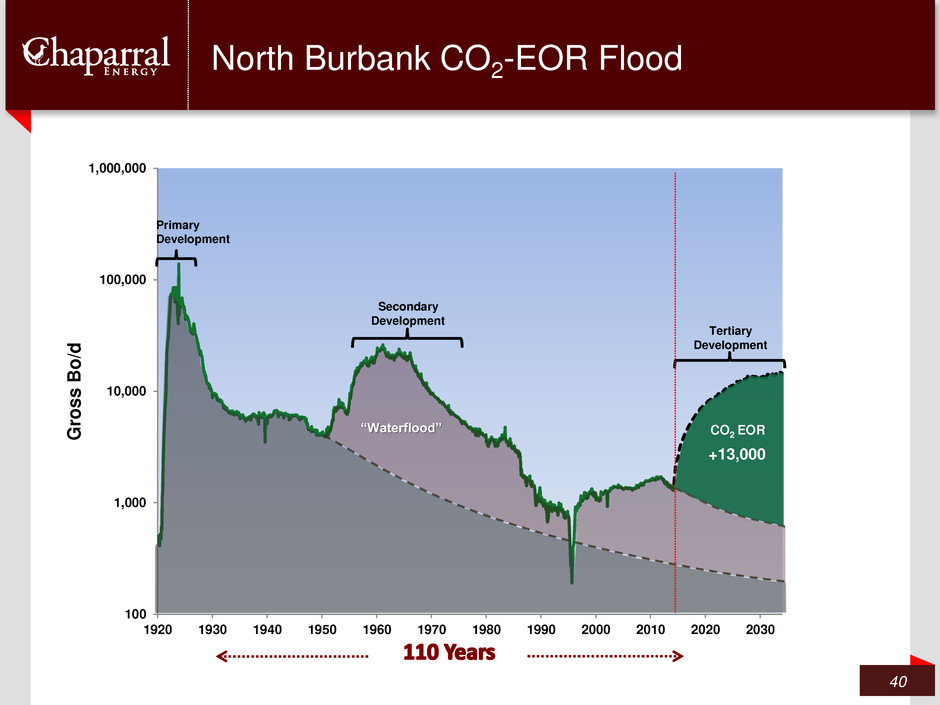
100 1,000 10,000 100,000 1,000,000 100 1,000 10,000 100,000 1,000,000 1920 1930 1940 1950 1960 1970 1980 1990 2000 2010 2020 2030 G ro ss B o /d Primary Development Secondary Development Tertiary Development North Burbank CO2-EOR Flood 40 +13,000 “Waterflood” CO2 EOR
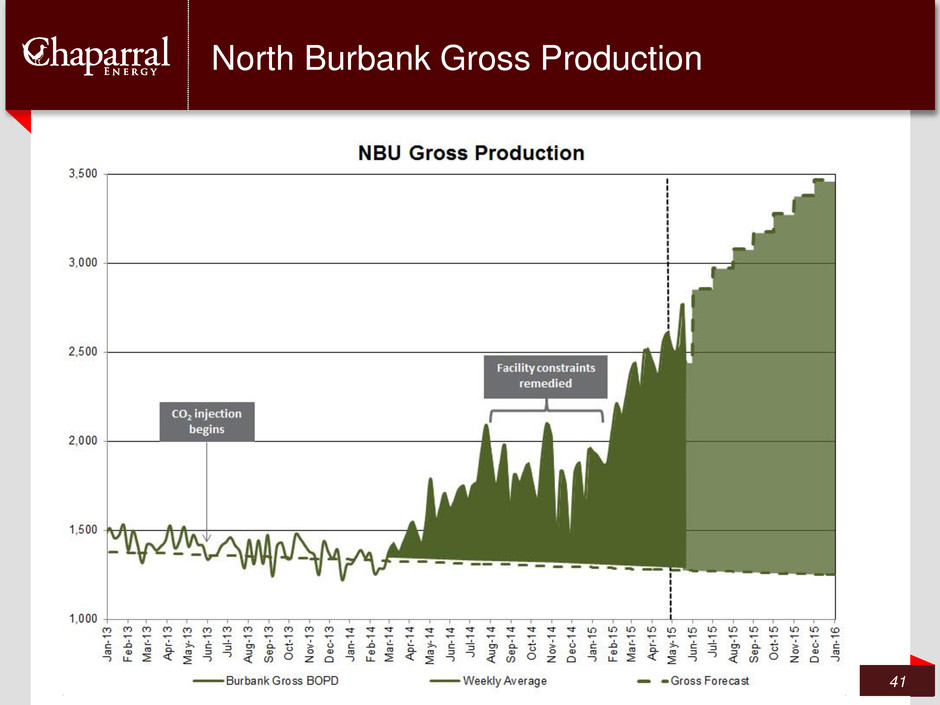
North Burbank Gross Production 41
Financial Overview 42
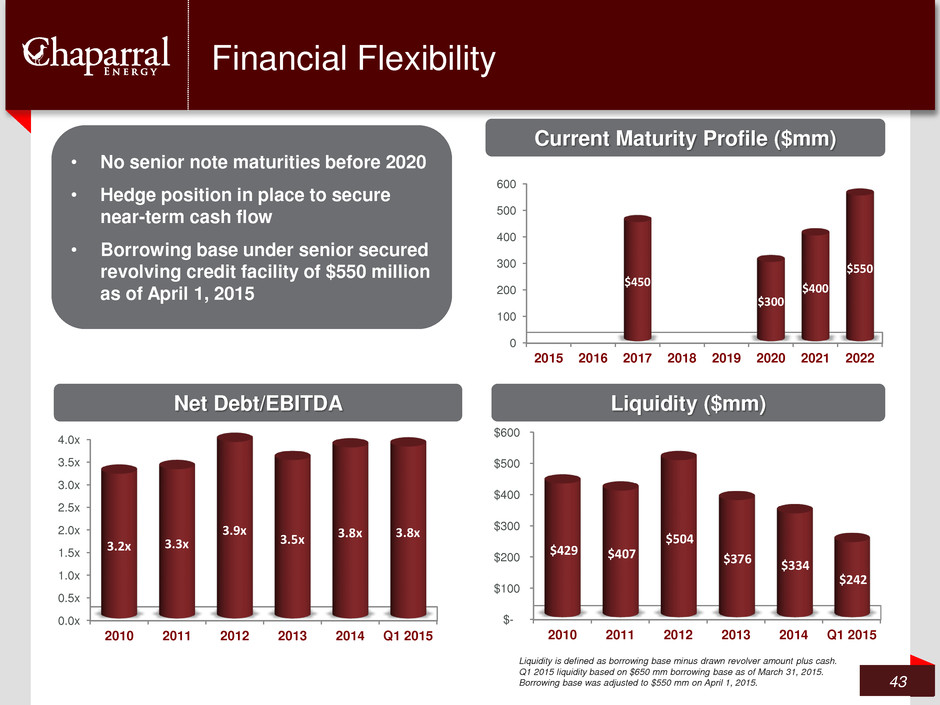
Financial Flexibility 43 • No senior note maturities before 2020 • Hedge position in place to secure near-term cash flow • Borrowing base under senior secured revolving credit facility of $550 million as of April 1, 2015 Current Maturity Profile ($mm) Liquidity ($mm) Net Debt/EBITDA $- $100 $200 $300 $400 $500 $600 2010 2011 2012 2013 2014 Q1 2015 $429 $407 $504 $376 $334 $242 0 100 200 300 400 500 600 2015 2016 2017 2018 2019 2020 2021 2022 $450 $300 $400 $550 0.0x 0.5x 1.0x 1.5x 2.0x 2.5x 3.0x 3.5x 4.0x 2010 2011 2012 2013 2014 Q1 2015 3.2x 3.3x 3.9x 3.5x 3.8x 3.8x Liquidity is defined as borrowing base minus drawn revolver amount plus cash. Q1 2015 liquidity based on $650 mm borrowing base as of March 31, 2015. Borrowing base was adjusted to $550 mm on April 1, 2015.
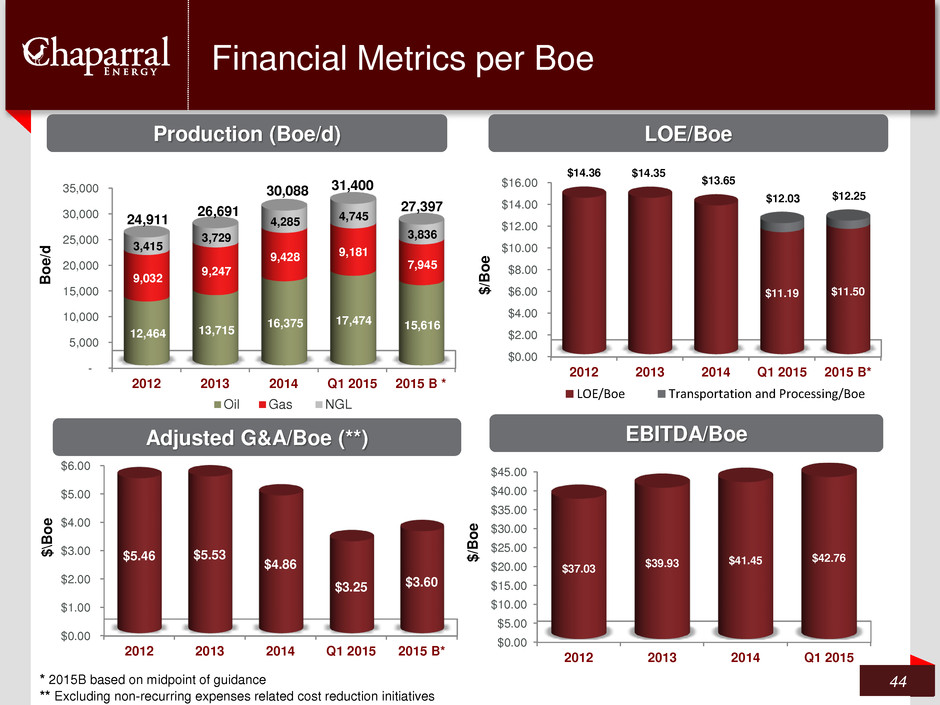
Financial Metrics per Boe 44 Production (Boe/d) LOE/Boe $0.00 $2.00 $4.00 $6.00 $8.00 $10.00 $12.00 $14.00 $16.00 2012 2013 2014 Q1 2015 2015 B* $14.36 $14.35 $13.65 $11.19 $11.50 $/B o e LOE/Boe Transportation and Processing/Boe $0.00 $1.00 $2.00 $3.00 $4.00 $5.00 $6.00 2012 2013 2014 Q1 2015 2015 B* $5.46 $5.53 $4.86 $3.25 $3.60 $ \B o e $0.00 $5.00 $10.00 $15.00 $20.00 $25.00 $30.00 $35.00 $40.00 $45.00 2012 2013 2014 Q1 2015 $37.03 $39.93 $41.45 $42.76 $/B o e - 5,000 10,000 15,000 20,000 25,000 30,000 35,000 2012 2013 2014 Q1 2015 2015 B * 12,464 13,715 16,375 17,474 15,616 9,032 9,247 9,428 9,181 7,945 3,415 3,729 4,285 4,745 3,836 B o e /d Oil Gas NGL 24,911 26,691 30,088 31,400 EBITDA/Boe Adjusted G&A/Boe (**) 27,397 * 2015B based on midpoint of guidance ** Excluding non-recurring expenses related cost reduction initiatives $$12.03 $12.25
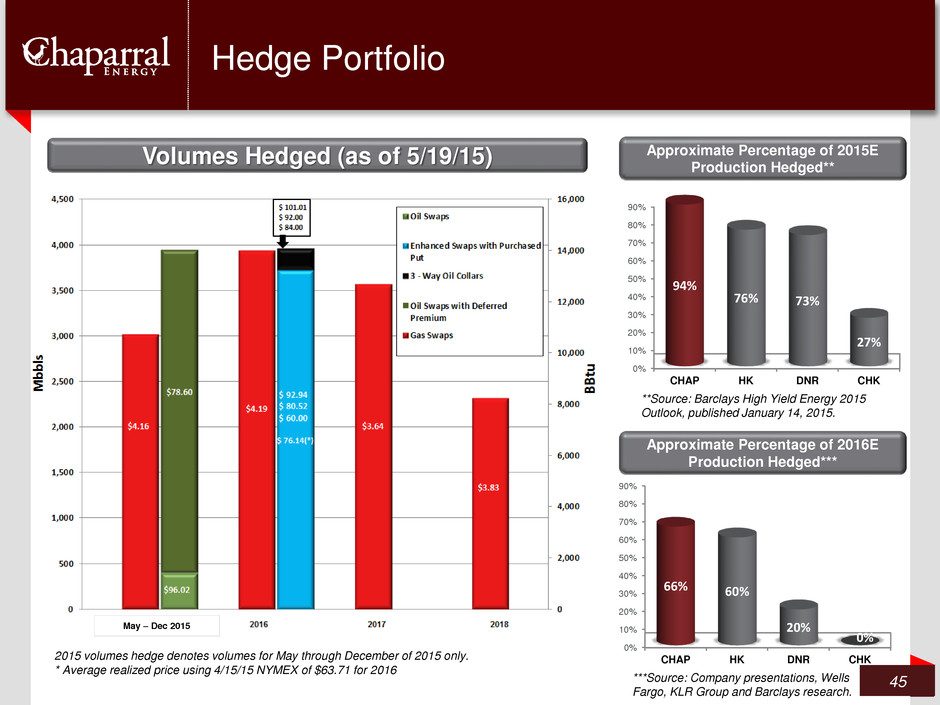
Hedge Portfolio 45 Approximate Percentage of 2015E Production Hedged** 0% 10% 20% 30% 40% 50% 60% 70% 80% 90% CHAP HK DNR CHK 94% 76% 73% 27% Volumes Hedged (as of 5/19/15) Approximate Percentage of 2016E Production Hedged*** **Source: Barclays High Yield Energy 2015 Outlook, published January 14, 2015. 2015 volumes hedge denotes volumes for May through December of 2015 only. * Average realized price using 4/15/15 NYMEX of $63.71 for 2016 May – Dec 2015 0% 10% 20% 30% 40% 50% 60% 70% 80% 90% CHAP HK DNR CHK 66% 60% 20% 0% ***Source: Company presentations, Wells Fargo, KLR Group and Barclays research.
• Strong, pure play Mid-Continent E&P company • Focused operations in the EOR and the core of the core in the STACK and Miss Lime • Proven record of execution • Proactive resetting of cost structure • Operations aligned with cash flow • Well-hedged position Summary 46
Thank you © 2014 Chaparral Energy Energizing America’s Heartland 5
