Attached files
| file | filename |
|---|---|
| EXCEL - IDEA: XBRL DOCUMENT - STERIS CORP | Financial_Report.xls |
| EX-32.1 - EXHIBIT 32.1 - STERIS CORP | ste03312015ex321.htm |
| EX-24.1 - EXHIBIT 24.1 - STERIS CORP | ste03312015ex241.htm |
| EX-21.1 - EXHIBIT 21.1 - STERIS CORP | ste03312015ex211.htm |
| EX-23.1 - EXHIBIT 23.1 - STERIS CORP | ste03312015ex231.htm |
| EX-31.2 - EXHIBIT 31.2 - STERIS CORP | ste03312015ex312.htm |
| EX-31.1 - EXHIBIT 31.1 - STERIS CORP | ste03312015ex311.htm |
United States Securities and Exchange Commission
Washington, D. C. 20549
___________________________________________________________________
FORM 10-K
x Annual Report Pursuant to Section 13 OR 15(d) of The Securities Exchange Act of 1934
For the fiscal year ended March 31, 2015
OR
o Transition Report Pursuant to Section 13 OR 15(d) of The Securities Exchange Act of 1934
For the transition period from to
Commission file number 1-14643
STERIS Corporation
(Exact name of registrant as specified in its charter)
Ohio | 34-1482024 | |
(State or other jurisdiction of incorporation or organization) | (IRS Employer Identification No.) | |
5960 Heisley Road, Mentor, Ohio (Address of principal executive offices) | 44060-1834 (Zip Code) | 440-354-2600 (Registrant’s telephone number including area code) |
SECURITIES REGISTERED PURSUANT TO SECTION 12(B) OF THE ACT:
Title of each class | Name of Exchange on Which Registered |
Common Shares, without par value | New York Stock Exchange |
SECURITIES REGISTERED PURSUANT TO SECTION 12(G) OF THE ACT:
None
Indicate by check mark if the Registrant is a well-known seasoned issuer, as defined in Rule 405 of the Securities Act. Yes x No o
Indicate by check mark if the Registrant is not required to file reports pursuant to Section 13 or Section 15(d) of the Act. Yes o No x
Indicate by check mark whether the Registrant (1) has filed all reports required to be filed by Section 13 or 15(d) of the Securities Exchange Act of 1934 during the preceding 12 months (or for such shorter period that the Registrant was required to file such reports), and (2) has been subject to such filing requirements for the past 90 days. Yes x No o
Indicate by check mark whether the registrant has submitted electronically and posted on its corporate Web site, if any, every Interactive Data File required to be submitted and posted pursuant to Rule 405 of Regulation S-T (§ 229.405 of this chapter) during the preceding 12 months (or for such shorter period that the registrant was required to submit and post such files). Yes x No o
Indicate by check mark if disclosure of delinquent filers pursuant to Item 405 of Regulation S-K is not contained herein, and will not be contained, to the best of the Registrant’s knowledge, in definitive proxy or information statements incorporated by reference in Part III of this Form 10-K or any amendment to this Form 10-K. x
Indicate by check mark whether the registrant is a large accelerated filer, an accelerated filer, a non-accelerated filer, or a smaller reporting company. See the definitions of “large accelerated filer,” “accelerated filer,” and “smaller reporting company” in Rule 12b-2 of the Exchange Act.
Large Accelerated Filer x | Accelerated Filer o | |
Non-Accelerated Filer o (Do not check if a smaller reporting company) | Smaller Reporting Company o | |
Indicate by check mark whether the Registrant is a shell company (as defined in Rule 12b-2 of the Exchange Act). Yes o No x
The aggregate market value of the voting stock held by non-affiliates of the Registrant, computed by reference to the closing price of such stock as of September 30, 2014: 3,117,279,156
The number of Common Shares outstanding as of May 22, 2015: 59,724,004
DOCUMENTS INCORPORATED BY REFERENCE
None
1
STERIS Corporation and Subsidiaries
Table of Contents
Page | |||
Part I | |||
Item 1 | |||
Item 1A | |||
Item 1B | |||
Item 2 | |||
Item 3 | |||
Item 4 | |||
Part II | |||
Item 5 | |||
Item 6 | |||
Item 7 | |||
General Overview and Executive Summary | |||
Item 7A | |||
Item 8 | |||
Item 9 | |||
Item 9A | |||
Item 9B | |||
Part III | |||
Item 10 | |||
Item 11 | |||
Item 12 | |||
Item 13 | |||
Item 14 | |||
Part IV | |||
Item 15 | |||
2
PART I
Throughout this Annual Report, STERIS Corporation and its subsidiaries together are called “STERIS,” “the Company,” “we,” “us,” or “our,” unless otherwise noted. References in this Annual Report to a particular “year” or “year-end” mean our fiscal year, which ends on March 31. For example, fiscal year 2015 ended on March 31, 2015.
ITEM 1. | BUSINESS |
INTRODUCTION
STERIS Corporation is a leading provider of infection prevention and other procedural products and services, focused primarily on healthcare, pharmaceutical and research. Our mission is to help our Customers create a healthier and safer world by providing innovative healthcare and life science product and service solutions around the globe. We offer our Customers a unique mix of innovative capital equipment products, such as sterilizers and surgical tables, and connectivity solutions such as operating room (“OR”) integration; consumable products, such as detergents and skin care products, gastrointestinal ("GI") endoscopy accessories, and other products; services, including equipment installation and maintenance; and microbial reduction of medical devices, instrument and scope repair solutions, and laboratory testing services.
We were founded as Innovative Medical Technologies in Ohio in 1985, and renamed STERIS Corporation in 1987. However, some of our businesses that have been acquired and integrated into STERIS, notably American Sterilizer Company, have much longer operating histories. With global headquarters in Mentor, Ohio, we have approximately 7,600 employees worldwide and operate in more than 60 countries.
We operate in three reportable business segments: Healthcare, Life Sciences, and STERIS Isomedix Services. Corporate and other, which is presented separately, contains the Defense and Industrial business unit plus costs that are associated with being a publicly traded company and certain other corporate costs. These costs include executive office costs, Board of Directors compensation, shareholder services and investor relations, external audit fees, and legacy pension and post-retirement benefit costs.
In our largest segment, Healthcare, we make a difference for our Customers and their patients by providing innovative surgical, sterile processing, infection prevention and gastrointestinal solutions. We provide support directly to the operating room, as well as to the sterile processing functions where instruments are reprocessed between surgeries and gastrointestinal procedures. Our integrated offering of capital equipment, consumables and services used throughout healthcare facilities enables Customers to reduce costs and improve outcomes.
Our second largest segment, Life Sciences, primarily serves pharmaceutical manufacturers and research organizations by providing decontamination and sterilization technologies, products and services that help support the safety and effectiveness of the products they produce.
Our Isomedix services segment (“Isomedix”) provides gamma irradiation and ethylene oxide services on a contract basis through a network of facilities in North America, where we process medical devices and other products as designated by our Customers' specifications prior to their delivery to the end user. We also offer an array of laboratory testing services.
The bulk of our revenues are derived from the healthcare and pharmaceutical industries. Much of the growth in these industries is driven by the aging of the population throughout the world, as an increasing number of individuals are entering their prime healthcare consumption years, and is dependent upon advancement in healthcare delivery, acceptance of new technologies, government policies, and general economic conditions. The pharmaceutical industry has been impacted by increased FDA scrutiny of cleaning and validation processes, mandating that manufacturers improve their processes. Within healthcare, there is increased concern regarding the level of hospital acquired infections around the world; increased demand for medical procedures, including preventative screenings such as endoscopies and colonoscopies; and a desire by our Customers to operate more efficiently, all which are driving increased demand for many of our products and services.
INFORMATION RELATED TO BUSINESS SEGMENTS
Our chief operating decision maker is our President and Chief Executive Officer (“CEO”). The CEO is responsible for performance assessment and resource allocation. The CEO regularly receives discrete financial information about each reportable segment, and uses this information to assess performance and allocate resources. The accounting policies of the reportable segments are the same as those described in note 1 to the Consolidated Financial Statements titled, “Nature of Operations and Summary of Significant Accounting Policies,” of this Annual Report. Segment performance information for fiscal years 2015, 2014, and 2013 is presented in note 12 to our Consolidated Financial Statements titled, “Business Segment
3
Information” and in Item 7 titled, “Management’s Discussion and Analysis of Financial Condition and Results of Operations” (“MD&A”), of this Annual Report.
HEALTHCARE SEGMENT
Description of Business. Our Healthcare segment manufactures and sells capital equipment, accessory, consumables, information support and service solutions to healthcare providers, including acute care hospitals and surgery and gastrointestinal ("GI") centers. These solutions aid our Customers in improving the safety, quality, productivity, and utility consumption of their surgical, sterile processing, gastrointestinal, and emergency environments.
Products Offered. These perioperative solutions include:
• | Steam, vaporized hydrogen peroxide and ethylene oxide (“EO”) sterilizers, as well as liquid chemical sterilant processing systems, that allow Customers to meet rigorous standards and regulations and assist in the safe and effective re-use of medical equipment and devices. |
• | Automated washer/disinfector systems that clean and disinfect a wide range of items from rolling instrument carts and other large healthcare equipment to small surgical instruments. |
• | General and specialty surgical tables, surgical and examination lights, equipment management systems, operating room storage cabinets, warming cabinets, scrub sinks, and other complementary products and accessories for use in hospitals and other ambulatory surgery sites. |
• | Gastrointestinal endoscopy accessories for a variety of GI procedure areas including bleed management and procedure irrigation, foreign body retrieval, polypectomy, and tissue acquisition. |
• | Connectivity solutions such as operating room (“OR”) integration, OR and sterile processing department ("SPD") workflow, patient tracking and instrument management that allow for high quality transfer of information and images throughout the hospital and between hospitals throughout the world. |
• | Cleaning chemistries and sterility assurance products used in instrument cleaning and decontamination systems. |
• | Cleansing products, including hard surface disinfectants, skin care and hand hygiene solutions, for use by care-givers and patients throughout healthcare institutions. |
Significant brand names for these products include SYSTEM 1E®, Amsco®, Hamo®, Reliance®, Cmax®, Harmony®, Kindest Kare®, Alcare®, Verify®, Cal Stat®, Roth Net®, Little Sister ®, and T-Series®.
Services Offered. Our Healthcare segment provides various preventive maintenance programs and repair services to support the effective operation of capital equipment over its lifetime. We offer these corrective and preventive service solutions to Customers who have internal clinical/biomedical engineering departments and Customers who rely on us to provide those services. Field service personnel install, maintain, upgrade, repair, and troubleshoot equipment throughout the world. We also offer comprehensive sterilization and surgical management consulting services allowing healthcare facilities to achieve safety, quality, and productivity improvements in the perioperative loop that flows between and among surgical suites and the SPD. We offer remote equipment monitoring technology to anticipate potential failure modes and take corrective action thereby improving Customers' equipment uptime.
In addition, we offer comprehensive instrument and endoscope repair solutions to Customers, either on site or at one of our dedicated repair facilities. These solutions extend instrument and endoscope life and reduce Customer's replacement costs. Finally, our Healthcare segment provides other support services such as construction and facility planning, engineering support, device testing, Customer education, hand hygiene process excellence, asset management/planning, and the sale of replacement parts. These solutions also include information management and decision support solutions to operating room and central sterilization managers to help in managing these environments and identifying opportunities to improve performance.
Customer Concentration. Our Healthcare segment sells capital equipment, consumables, and services to Customers in the United States and many other countries throughout the world. For the year ended March 31, 2015, no Customer represented more than 10% of the Healthcare segment's total revenues and the loss of any single Customer is not expected to have a material impact on the segment's results of operations or cash flows.
Competition. We compete with a number of large companies that have significant product portfolios and global reach, as well as a number of small companies with very limited product offerings and operations in one or a limited number of countries. On a product basis, competitors include 3M, Belimed, Cantel Medical, Ecolab, Getinge, Go Jo, Johnson & Johnson, Kimberly-Clark, Skytron, and Stryker.
4
LIFE SCIENCES SEGMENT
Description of Business. Our Life Sciences segment manufactures and sells a broad range of capital equipment, formulated cleaning chemistries, and service solutions to pharmaceutical companies and private and public research facilities around the globe.
Products Offered. These capital equipment and formulated cleaning chemistries include:
• | Formulated cleaning chemistries that are used to prevent biological and chemical contamination and to monitor sterilization and decontamination processes, including products used to clean components used in manufacturing, decontaminate systems, and disinfect or sterilize hard surfaces. |
• | Vaporized Hydrogen Peroxide (“VHP”®) generators used to decontaminate many high value spaces, from small isolators to large pharmaceutical processing and laboratory animal rooms. |
• | High-purity water equipment, which generates water for injection and pure steam. |
• | Sterilizers used in the manufacture of pharmaceuticals and biopharmaceuticals as well as sterilizers for equipment and instruments used in research studies, mitigating the risk of contamination. |
• | Washer/disinfectors that decontaminate various large and small components in pharmaceutical and industrial manufacturing processes and in research labs, such as glassware, vessels, equipment parts, drums, hoses, and animal cages. |
Significant brand names for these products include Amsco®, Reliance®, Finn-Aqua®, VHP®, and the CIP® Products.
Services Offered. Our Life Sciences segment offers various preventive maintenance programs and repair services to support the effective operation of capital equipment over its lifetime. Field service personnel install, maintain, upgrade, repair, and troubleshoot equipment throughout the world. We utilize remote equipment monitoring technology to improve Customers’ equipment uptime. We also offer consulting services and technical support to architecture and engineering firms and laboratory planners. Our services deliver expertise in decontamination and infection control technologies and processes to end users. Our service personnel also provide higher-end validation services in support of our pharmaceutical Customers.
Customer Concentration. Our Life Sciences segment sells capital equipment, consumables, and services to Customers in the United States and many other countries throughout the world. For the year ended March 31, 2015, no Customer represented more than 10% of the Life Sciences segment’s total revenues and the loss of any single Customer is not expected to have a material impact on the segment’s results of operations or cash flows.
Competition. Our Life Sciences segment operates in highly regulated environments where the most intense competition results from technological innovations, product performance, convenience and ease of use, and overall cost-effectiveness. In recent years, our pharmaceutical Customer base has also undergone consolidation and reduced capital spending, resulting in fewer project opportunities. We compete for pharmaceutical, research and industrial Customers with a number of large companies that have significant product portfolios and global reach, as well as a number of small companies with very limited product offerings and operations in one or a limited number of countries. Competitors include Belimed, Ecolab, Fedegari, Getinge, MECO, Stilmas, and Techniplast.
ISOMEDIX SERVICES SEGMENT
Description of Business. Our Isomedix segment operates through a network of 19 facilities located in North America. We sell a comprehensive array of contract processing services using gamma irradiation (“Gamma”) and ethylene oxide (“EO”) technologies as well as an array of laboratory testing services. We offer microbial reduction services based on Customer specifications to companies that supply products to the healthcare, industrial, and consumer product industries.
Services Offered. We use Gamma and EO technologies to provide a wide range of processing services at our facilities. Gamma is an irradiation process which utilizes cobalt-60. EO is a gaseous process. In addition, we offer an array of laboratory testing services that complements the manufacturing of terminally sterilized products. Our locations are in major population centers and core distribution corridors throughout North America, primarily in the Northeast, Midwest, Southwest, and southern California. We adapt to increasing imports and changes in manufacturing points-of-origin by monitoring trends in supply chain management. Demographics partially drive this segment's growth. The aging population and rising life expectancy increase the demand for surgical procedures, which increases the consumption of medical devices and surgical kits. Our technical services group supports Customers in all phases of product development, materials testing, and process validation.
Customer Concentration. Our Isomedix segment’s services are offered to Customers throughout the footprint of its North American network. For the year ended March 31, 2015, no Customer represented more than 10% of the segment’s revenues.
Because of a largely fixed cost structure, the loss of a single Customer could have a material impact on the segment’s results of operations or cash flows but would not be expected to have a material impact on STERIS.
5
Competition. Isomedix operates in a highly regulated industry and competes in North America with Sterigenics International, Inc., and other smaller contract sterilization companies and manufacturers that sterilize products in-house.
INFORMATION WITH RESPECT TO OUR BUSINESS IN GENERAL
Sources and Availability of Raw Materials. We purchase raw materials, sub-assemblies, components, and other supplies needed in our operations from numerous suppliers in the United States and internationally. The principal raw materials and supplies used in our operations include stainless steel, organic and inorganic chemicals, fuel, and plastic components. These raw materials and supplies are generally available from several suppliers and in sufficient quantities that we do not currently expect any significant sourcing problems in fiscal 2016. We have longer-term supply contracts for certain materials for which there are few suppliers. There is currently only a single supplier for ethylene oxide and radioisotope (cobalt-60) used by the Isomedix segment, although we do have a longer-term supply contract for the latter.
Intellectual Property. We protect our technology and products by, among other means, obtaining United States and foreign patents. There can be no assurance, however, that any patent will provide adequate protection for the technology, system, product, service, or process it covers. In addition, the process of obtaining and protecting patents can be long and expensive. We also rely upon trade secrets, technical know-how, and continuing technological innovation to develop and maintain our competitive position.
As of March 31, 2015, we held 376 United States patents and 970 foreign patents and had 71 United States patent applications and 316 foreign patent applications pending. Patents for individual products extend for varying periods according to the date of filing or grant and legal term of patents in various countries where a patent is obtained. The actual protection a patent provides, which can vary from country to country, depends upon the type of patent, the scope of its coverage, and the availability of legal remedies in each country.
Our products are sold around the world under various brand names and trademarks. We consider our brand names and trademarks to be valuable in the marketing of our products. As of March 31, 2015, we had a total of 1,336 trademark registrations in the United States and in various foreign countries.
Research and Development. Research and development is an important factor in our long-term strategy. For the years ended March 31, 2015, 2014, and 2013, research and development expenses were $54.1 million, $48.6 million, and $41.3 million, respectively. We incurred these expenses primarily for the research and development of commercial products.
We are focused on introducing products that increase efficiencies for our Customers. We have new products throughout our portfolio to facilitate growth in healthcare, including a new smaller footprint V-PRO 60® Low Temperature Sterilization System and accessories, Harmony AIR ™ Surgical Lighting System and Harmony AIR™ Equipment Booms and Accessories and a number of new products in US Endoscopy.
Quality Assurance. We manufacture, assemble, and package products in the United States and other countries. Each of our production facilities are dedicated to particular processes and products. Our success depends upon Customer confidence in the quality of our production process and the integrity of the data that supports our product safety and effectiveness. We have implemented quality assurance procedures to support the quality and integrity of scientific information and production processes. All of our manufacturing and contract sterilization facilities throughout the world are ISO9001 or ISO13485 certified, with the exception of a small recently acquired entity.
Government Regulation. Our business is subject to various degrees of governmental regulation in the countries in which we operate. In the United States, the United States Food and Drug Administration (“FDA”), the United States Environmental Protection Agency (“EPA”), the United States Nuclear Regulatory Commission (“NRC”), and other governmental authorities regulate the development, manufacture, sale, and distribution of our products and services. Our international operations also are subject to a significant amount of government regulation, including country-specific rules and regulations and U.S. regulations applicable to our international operations. Government regulations include detailed inspection of, and controls over, research and development, clinical investigations, product approvals and manufacturing, marketing and promotion, sampling, distribution, record-keeping, storage, and disposal practices.
Compliance with applicable regulations is a significant expense for us. Past, current or future regulations, their interpretation, or their application could have a material adverse impact on our operations. Also, additional governmental regulation may be passed that could prevent, delay, revoke, or result in the rejection of regulatory clearance of our products. We cannot predict the effect on our operations resulting from current or future governmental regulation or the interpretation or application of these regulations.
If we fail to comply with any applicable regulatory requirements, sanctions could be imposed on us. For more information about the risks we face regarding regulatory requirements, see Part I, Item 1A of this Annual Report titled, “Risk Factors, We are subject to extensive regulatory requirements and must receive and maintain regulatory clearance or approval for many
6
products and operation. Failure to receive or maintain, or delays in receiving, clearance or approvals may hurt our revenues, profitability, financial condition, or value."
We have received warning letters, paid civil penalties, conducted product recalls and field corrections, and been subject to other regulatory sanctions. At the beginning of fiscal 2011 a consent decree, the terms of which had been previously agreed to by the FDA and us, was approved by the Federal District Court for the Northern District of Ohio concerning our SYSTEM 1 processing system. See Part I, Item 1A of this Annual Report titled, “Risk Factors, We may be adversely affected by product liability claims or other legal actions or regulatory or compliance matters, including the Consent Decree,” and “Risk Factors, Compliance with the Consent Decree may be more costly and burdensome than anticipated" and note 11 of our consolidated financial statements titled, "Commitments and Contingencies" for further information on SYSTEM 1 and other regulatory issues and their potential impact. We believe that we are currently compliant in all material respects with applicable regulatory requirements. However, there can be no assurance that future or current regulatory, governmental, or private action will not have a material adverse affect on us or on our performance, results, or financial condition.
Environmental Matters. We are subject to various laws and governmental regulations concerning environmental matters and employee safety and health in the United States and in other countries. We have made, and continue to make, significant investments to comply with these laws and regulations. We cannot predict the future capital expenditures or operating costs required to comply with environmental laws and regulations. We believe that we are currently compliant with applicable environmental, health, and safety requirements in all material respects. However, we cannot assure you that future or current regulatory, governmental, or private action will not have a material adverse affect on our performance, results, or financial condition. Please refer to note 11 of our consolidated financial statements titled, "Commitments and Contingencies" for further information.
In the future, if a loss contingency related to environmental matters, employee safety, health or conditional asset retirement obligations is significantly greater than the current estimated amount, we would record a liability for the obligation and it may result in a material impact on net income for the annual or interim period during which the liability is recorded. The investigation and remediation of environmental obligations generally occur over an extended period of time, and therefore we do not know if these events would have a material adverse affect on our financial condition, liquidity, or cash flow, nor can we assure you that such liabilities would not have a material adverse affect on our performance, results, or financial condition.
Competition. The markets in which we operate are highly competitive and generally highly regulated. Competition is intense in all of our business segments and includes many large and small competitors. Brand, design, quality, safety, ease of use, serviceability, price, product features, warranty, delivery, service, and technical support are important competitive factors to us. We expect to face continued competition in the future as new infection prevention, sterile processing, contamination control, gastrointestinal and surgical support products and services enter the market. We believe many organizations are working with a variety of technologies and sterilizing agents. Also, a number of companies have developed disposable medical instruments and other devices designed to address the risk of contamination.
We believe that our long-term competitive position depends on our success in discovering, developing, and marketing innovative, cost-effective products and services. We devote significant resources to research and development efforts and we believe STERIS is positioned as a global competitor in the search for technological innovations. In addition to research and development, we invest in quality control, Customer programs, distribution systems, technical services, and other information services.
We cannot assure you that we will develop significant new products or services, or that new products or services we provide or develop in the future will be more commercially successful than those provided or developed by our competitors. In addition, some of our existing or potential competitors may have greater resources than us. Therefore, a competitor may succeed in developing and commercializing products more rapidly than we do. Competition, as it relates to our business segments and product categories, is discussed in more detail in the section above titled, “Information Related to Business Segments.”
Employees. As of March 31, 2015, we had approximately 7,600 employees throughout the world. We believe we have good relations with our employees.
Methods of Distribution. Sales and service activities are supported by a staff of regionally based clinical specialists, system planners, corporate account managers, and in-house Customer service and field support departments. We also contract with distributors and dealers in select markets.
Customer training is important to our business. We provide a variety of courses at Customer locations, at our training and education centers, and over the internet. Our training programs help Customers understand the science, technology, and operation of our products and services. Many of our operator training programs are approved by professional certifying organizations and offer continuing education credits to eligible course participants.
7
Seasonality. Our financial results have been, from time to time, subject to seasonal patterns. We cannot assure you that these patterns will continue.
International Operations. We believe we have opportunity to expand internationally, as we currently serve a small portion of the world that could benefit from our products. Through our subsidiaries, we operate in various international locations within the same business segments as in the United States. International revenues have recently represented approximately one-fourth of our total revenues. Revenues from Europe, Middle East and Africa ("EMEA"), Canada, and the Asia Pacific and Latin American regions were 51%, 18%, 22%, and 9%, respectively, of our total international revenues for the year ended March 31, 2015.
Also see note 12 to our Consolidated Financial Statements titled, “Business Segment Information,” and Item 7, “MD&A”, for a geographic presentation of our revenues for the three years ended March 31, 2015, 2014 and 2013.
We conduct manufacturing in the United States, Canada, Mexico, Brazil, China and various European countries. International cost of revenues have represented approximately one-fourth of our total cost of revenues. There are, in varying degrees, a number of inherent risks to our international operations. We describe some of these risks in Part I, Item 1A of this Annual Report titled, “Risk Factors". We conduct manufacturing, sales, and distribution operations on a worldwide basis and are subject to a variety of risk associated with doing business outside the United States.
Fluctuations in the exchange rate of the U.S. dollar relative to the currencies of foreign countries in which we operate can also increase or decrease our reported net assets and results of operations. During fiscal 2015, revenues were unfavorably impacted by $10.4 million, or 0.6%, and income before taxes was favorably impacted by $10.8 million, or 5.4%, as a result of foreign currency movements relative to the U.S. dollar. We cannot predict future changes in foreign currency exchange rates or the effect they will have on our operations.
Backlog. We define backlog as the amount of unfilled capital equipment purchase orders at a point in time. At March 31, 2015, we had a backlog of $143.2 million. Of this amount, $97.7 million and $45.5 million related to our Healthcare and Life Sciences segments, respectively. At March 31, 2014, we had backlog orders of $154.7 million. Of this amount $110.3 million and $44.4 million related to our Healthcare and Life Sciences segments, respectively. A significant portion of the backlog orders at March 31, 2015, is expected to ship in the next fiscal year.
Proposed Combination with Synergy Health plc. On October 13, 2014, we announced that we were commencing a “recommended offer” under U.K. law to acquire all outstanding shares of Synergy Health plc (“Synergy”) in a cash and stock transaction valued at £19.50 ($31.35) per Synergy share, or a total of approximately $1.9 billion based on STERIS’s closing stock price of $56.38 per share on October 10, 2014, through a newly formed U.K. entity that also would indirectly acquire all of the outstanding stock of STERIS (the “Combination”). Based on STERIS’s closing stock price of $67.00 and exchange rates as of February 3, 2015, the total value of the cash and stock transaction is approximately $2.1 billion or £23.42 ($35.52) per Synergy share. The Combination is subject to certain customary closing conditions, including approvals by STERIS and Synergy shareholders as well as regulatory approvals by the U.S. Federal Trade Commission (“FTC”), which is currently reviewing the Combination. Both companies have entered into a timing agreement with the FTC under the terms of which the companies have agreed not to close the Combination before June 2, 2015 unless the FTC first closes its investigation. Both companies are cooperating with the FTC staff in the review of the Combination. No assurance can be provided as to when or if the transaction will be completed.
Availability of Securities and Exchange Commission Filings. We make available free of charge on or through our website our Annual Reports on Form 10-K, Quarterly Reports on Form 10-Q, and Current Reports on Form 8-K, and amendments to these reports, as soon as reasonably practicable after we electronically file such material with, or furnish such material to the Securities and Exchange Commission (“SEC”). You may access these documents, as well as other SEC filings related to the Company, on the Investor Relations page of our website at http://www.steris-ir.com. You may also obtain copies of these documents by visiting the SEC’s Public Reference Room at 100 F Street, NE, Washington, D.C. 20549 or by accessing the SEC’s website at http://www.sec.gov. You may obtain information on the Public Reference Room by calling the SEC at 1-800-SEC-0330. The content on any website referred to in this Annual Report on Form 10-K is not incorporated by reference into this Form 10-K unless expressly noted.
We also make available free of charge on our website our Corporate Governance Guidelines, our Director Code of Ethics, and our Code of Business Conduct, as well as the Charters of the Audit Committee, the Compensation Committee, the Nominating and Governance Committee, and the Compliance Committee of the Company’s Board of Directors.
ITEM 1A. | RISK FACTORS |
This item describes certain risk factors that could affect our business, financial condition and results of operations. You should consider these risk factors when evaluating the forward-looking statements contained in this Annual Report on Form 10-K, because our actual results and financial condition might differ materially from those projected in the forward-looking
8
statements should these risks occur. We face other risks besides those highlighted below. These other risks include additional uncertainties not presently known to us or that we currently believe are immaterial, but may ultimately have a significant impact. Should any of these risks, described below or otherwise, actually occur, our business, financial condition, performance, prospects, value, or results of operations could be negatively affected.
The economic climate may adversely affect us.
Adverse economic cycles or conditions and Customer, regulatory or government response to those cycles or conditions, could affect our results of operations. There can be no assurance when these cycles or conditions will occur or when they will begin to improve after they occur. There also can be no assurance as to the strength or length of any recovery from a business downturn or recession. United States and worldwide financial and business conditions are uncertain, and recovery has been slow from the recent severe recession, which had a significant adverse effect on U.S. and global economies.
Credit and liquidity problems may make it difficult for some businesses to access credit markets and obtain financing and may cause some businesses to curtail spending to conserve cash in anticipation of persistent business slowdowns and liquidity needs. If our Customers have difficulty financing their purchases due to tight credit markets or related factors or because of other operational or utilization problems they may be experiencing or otherwise decide to curtail their purchases, our business could be adversely affected. Our exposure to bad debt losses could also increase if Customers are unable to pay for products previously ordered and delivered.
Global economic conditions, in Europe in particular, may have adverse effects on our business and financial condition. Many of our global Customers are governmental entities or other entities that rely on government healthcare systems or government funding. If government funding for healthcare becomes limited or restricted in countries in which we operate, our Customers may be unable to pay their obligations on a timely basis or to make payment in full and it may become necessary to increase reserves. In addition, there can be no assurance that there will not be an increase in collection difficulties. Prospectively, additional adverse effects resulting from these conditions may include decreased healthcare utilization, further pricing pressure on our products, and/or weaker overall demand for our products and services, particularly capital products. Should the current economic conditions continue or worsen, our business, performance, prospects, value, financial condition, bad debt expense or results of operations may be adversely affected.
In addition, economic conditions and market volatility impact the investment portfolio of our legacy defined benefit pension plan. Because the values of the pension plan investments have and will fluctuate in response to changing market conditions and the values of liabilities are determined on the basis of interest rates, the amount of gains or losses that will be recognized in subsequent periods and the impact on the funded status of the plan and future minimum required contributions, if any, might have a material adverse effect on our liquidity, value, financial conditions or result of operations.
Our businesses are highly competitive, and if we fail to compete successfully, our revenues and results of operations may be hurt.
We operate in a highly competitive global environment. Our businesses compete with other broad line manufacturers, as well as many smaller businesses specializing in particular products or services, primarily on the basis of brand, design, quality, safety, ease of use, serviceability, price, product features, warranty, delivery, service, and technical support. We face increased competition from new infection prevention, sterile processing, contamination control, surgical support, cleaning consumables, gastrointestinal endoscopy accessories, contract sterilization, and other products and services entering the market. Competitors and potential competitors also are attempting to develop alternate technologies and sterilizing agents, as well as disposable medical instruments and other devices designed to address the risk of contamination. If our products, services, support, distribution and/or cost structure do not enable us to compete successfully, our business, performance, prospects, value, financial condition, and results of operations may be adversely affected.
Our success depends, in part, on our ability to design, manufacture, distribute, and achieve market acceptance of, new products with higher functionality and lower costs.
Many of our Customers operate businesses characterized by technological change, product innovation and evolving industry standards. Price is a key consideration in their purchasing decisions. To successfully compete, we must continue to design, develop, and improve innovative products. We also must achieve market acceptance of and effectively distribute those products, and reduce production costs. Our business, performance, prospects, value, financial condition, and results of operations might be adversely effected if our competitors' product development capabilities become more effective, if they introduce new or improved products that displace our products or gain market acceptance, or if they produce and sell products at lower prices.
Decreased availability or increased costs of raw materials or energy supplies or other supplies might increase our production costs or limit our production capabilities or curtail our operations.
9
We purchase raw materials, fabricated and other components, and energy supplies from a variety of suppliers. Key materials include stainless steel, organic and inorganic chemicals, fuel, cobalt-60, ethylene oxide, and plastic components. The availability and prices of raw materials and energy supplies are subject to volatility and are influenced by worldwide economic conditions, speculative action, world supply and demand balances, inventory levels, availability of substitute materials, currency exchange rates, anticipated or perceived shortages, and other factors. In some situations, we may be able to temporarily limit price increases or support availability through supply agreements. Otherwise, raw material prices and availability are subject to numerous factors outside of our control, including those described above. Increases in prices or decreases in availability of raw materials and oil and gas might impair our procurement of necessary materials or our product production, or might increase production costs. In addition, energy costs impact our transportation and distribution and other supply and sales costs. Also, a number of our key materials and components have a limited number of suppliers. Some are single-sourced, such as cobalt-60 and ethylene oxide, which are necessary to our Isomedix operations; the unavailability or short supply of these products might disrupt or cause shutdowns of portions of our Isomedix operations or have other adverse consequences. Shortages in supply, regulatory or security requirements, or increases in the price of raw materials, components and energy supplies may adversely impact our business, performance, prospects, value, financial condition, or results of operations.
Our operations, and those of our suppliers, are subject to a variety of business continuity hazards and risks, any of which could interrupt production or operations or otherwise adversely affect our performance, results, or value.
Business continuity hazards and other risks include:
• | explosions, fires, earthquakes, inclement weather, and other disasters; |
• | utility or other mechanical failures; |
• | unscheduled downtime; |
• | labor difficulties; |
• | inability to obtain or maintain any required licenses or permits; |
• | disruption of communications; |
• | data security, preservation and redundancy disruptions; |
• | inability to hire or retain key management or employees; |
• | disruption of supply or distribution; and |
• | regulation of the safety, security or other aspects of our operations. |
The occurrence of any of these or other events might disrupt or shut down operations, or otherwise adversely impact the production or profitability of a particular facility, or our operations as a whole. Certain casualties also might cause personal injury and loss of life, or severe damage to or destruction of property and equipment, and for casualties occurring at our facilities, result in liability claims against us. Although we maintain property and casualty insurance and liability and similar insurance of the types and in the amounts that we believe are customary for our industries, our insurance coverages have limits and we are not fully insured against all potential hazards and risks incident to our business. Should any of the hazards or risks occur, or should our insurance coverage be inadequate or unavailable, our business, performance, prospects, value, financial condition, and results of operations might be adversely affected, both during and after the event.
We conduct manufacturing, sales and distribution operations on a worldwide basis and are subject to a variety of risks associated with doing business outside the United States.
We maintain significant international operations, including operations in Canada, Mexico, Europe, Asia Pacific and Latin America. As a result, we are subject to a number of risks and complications associated with international manufacturing, sales, services, and other operations. These include:
• | risks associated with foreign currency exchange rate fluctuations; |
• | difficulties in enforcing agreements and collecting receivables through some foreign legal systems; |
• | enhanced credit risks in certain European countries as well as emerging market regions; |
• | foreign Customers with longer payment cycles than Customers in the United States; |
• | tax rates in certain foreign countries that exceed those in the United States, and foreign earnings subject to withholding tax requirements; |
• | tax laws that restrict our ability to use tax credits, offset gains, or repatriate funds; |
• | tariffs, exchange controls or other trade restrictions including transfer pricing restrictions when products produced in one country are sold to an affiliated entity in another country; |
• | general economic and political conditions in countries where we operate or where end users of our products are situated; |
• | difficulties associated with managing a large organization spread throughout various countries; |
• | difficulties in enforcing intellectual property rights or weaker intellectual property right protections in some countries; and |
10
• | difficulties associated with compliance with a variety of laws and regulations governing international trade, including the Foreign Corrupt Practices Act. |
Implementation and achievement of international growth objectives also may be impeded by political, social, and economic uncertainties or unrest in countries in which we conduct operations or market or distribute our products. In addition, compliance with multiple, and potentially conflicting, international laws and regulations, import and export limitations, anti-corruption laws, and exchange controls may be difficult, burdensome or expensive.
For example, we are subject to compliance with various laws and regulations, including the Foreign Corrupt Practices Act and similar anti-bribery laws, which generally prohibit companies and their intermediaries from making improper payments to officials for the purpose of obtaining or retaining business. While our employees and agents are required to comply with these laws, we cannot assure you that our internal policies and procedures will always protect us from violations of these laws, despite our commitment to legal compliance and corporate ethics. The occurrence or allegation of these types of events may adversely affect our business, performance, prospects, value, financial condition, and results of operations.
Consolidations among our healthcare and pharmaceutical Customers may result in a loss of Customers or more significant pricing pressures.
A number of our Customers have consolidated. These consolidations are due in part to healthcare cost reduction measures initiated by competitive pressures as well as legislators, regulators and third-party payors. In an effort to attract Customers, some of our competitors have also reduced production costs and lowered prices. This has resulted in greater pricing pressures on us and in some cases loss of Customers. Additional consolidations could result in a loss of Customers or more significant pricing pressures. Additional consolidations and pricing pressures also may occur as a result of recent healthcare legislation and economic conditions. A loss of Customers or more significant pricing pressure also could have an adverse effect on our business, performance, prospects, value, financial conditions or results of operations.
Changes in healthcare laws or government and other third-party payor reimbursement levels to healthcare providers, or failure to meet healthcare reimbursement or other requirements might negatively impact our business.
We sell many of our products to hospitals and other healthcare providers and pharmaceutical manufacturers. Many of these Customers are subject to or supported by government programs or receive reimbursement for services from third-party payors, such as government programs, including Medicare and Medicaid, private insurance plans, and managed care programs. In the United States, many of these programs set maximum reimbursement levels for these healthcare services and can have complex reimbursement requirements. Outside the United States, reimbursement systems vary significantly by country. However, government-managed healthcare systems control reimbursement for healthcare services in many foreign countries. In these countries, as well as in the United States, public budgetary constraints may significantly impact the ability of hospitals, pharmaceutical manufacturers, and other Customers supported by such systems to purchase our products. If government or other third-party payors deny or change coverage, reduce their current levels of reimbursement for healthcare services, or otherwise implement measures to regulate pricing or contain costs or if our costs increase more rapidly than reimbursement level or permissible pricing increases or we do not satisfy the standards or requirements for reimbursement, our revenues or profitability may suffer and our business, performance, value, prospects, financial condition or results of operations may be adversely affected.
In addition, the U.S. Patient Protection and Affordable Care Act, as amended by the Health Care and Education Affordability Reconciliation Act, contains provisions that could have a material impact on our business. Among other provisions, this legislation imposes an excise tax on medical devices manufactured or offered for sale in the United States. We incurred $7.9 million and $7.4 million in medical device excise taxes for fiscal 2015 and fiscal 2014, respectively. In addition, we have been required to commit significant resources to “Sunshine Act” compliance. Various health care reform proposals have also emerged at the state level, and we are unable to predict which, if any, of those proposals will be enacted. However, the ultimate effect of health care reform legislation or any future legislation or regulation could have a material adverse affect on our business, performance, value, prospects, financial condition or results of operation.
We are subject to extensive regulatory requirements and must receive and maintain regulatory clearance or approval for many products and operations. Failure to receive or maintain, or delays in receiving, clearance or approvals may hurt our revenues, profitability, financial condition, or value.
Our operations are subject to extensive regulation in both the United States and in other countries where we do business. In the U.S, our products and services are regulated by the FDA and other regulatory authorities. In many foreign countries, sales of our products are subject to extensive regulations that may or may not be comparable to those of the FDA. In Europe, our products are regulated primarily by country and community regulations of those countries within the European Economic Area and must conform to the requirements of those authorities.
Government regulation applies to nearly all aspects of testing, manufacturing, safety, labeling, storing, recordkeeping, reporting, promoting, distributing, and importing or exporting of medical devices, products, and services. In general, unless an
11
exemption applies, a sterilization, decontamination or medical device or product or service must receive regulatory approval or clearance before it can be marketed or sold. Modifications to existing products or the marketing of new uses for existing products also may require regulatory approvals, approval supplements or clearances. If we are unable to obtain any required approvals, approval supplements or clearances for any modification to a previously cleared or approved device, we may be required to cease manufacturing and sale, or recall or restrict the use of such modified device, pay fines, or take other action until such time as appropriate clearance or approval is obtained.
Regulatory agencies may refuse to grant approval or clearance, or review and disagree with our interpretation of approvals or clearances, or with our decision that regulatory approval is not required or has been maintained. Regulatory submissions may require the provision of additional data and may be time consuming and costly, and their outcome is uncertain. Regulatory agencies may also change policies, adopt additional regulations, or revise existing regulations, each of which could prevent or delay approval or clearance of devices, or could impact our ability to market a previously cleared, approved, or unregulated device. Our failure to comply with the regulatory requirements of the FDA or other applicable regulatory requirements in the United States or elsewhere might subject us to administratively or judicially imposed sanctions. These sanctions include, among others, warning letters, fines, civil penalties, criminal penalties, injunctions, debarment, product seizure or detention, product recalls and total or partial suspension of production, sale and/or promotion. The failure to receive or maintain, or delays in the receipt of, relevant United States or international qualifications could have a material adverse affect on our business, performance, prospects, value, financial condition or results of operations.
Refer also for further information to the “Risk Factor” below titled, “We may be adversely affected by product liability claims or other legal actions or regulatory or compliance matters, including the Consent Decree” and the “Risk Factor” below titled “Compliance with the Consent Decree may be more costly and burdensome than anticipated" and note 11 of our consolidated financial statements titled, "Commitments and Contingencies".
Our products are subject to recalls and restrictions, even after receiving United States or foreign regulatory clearance or approval.
Ongoing medical device reporting regulations require that we report to appropriate governmental authorities in the United States and/or other countries when our products cause or contribute to a death or serious injury or malfunction in a way that would be reasonably likely to contribute to a death or serious injury if the malfunction were to recur. Governmental authorities can require product recalls or impose restrictions for product design, manufacturing, labeling, clearance, or other issues. For the same reasons, we may voluntarily elect to recall or restrict the use of a product. Any recall or restriction could divert managerial and financial resources and might harm our reputation among our Customers and other healthcare professionals who use or recommend the products. Product recalls, restrictions, suspensions, re-labeling, or other change might have a material adverse affect on our business, performance, prospects, value, financial condition, or results of operations.
We may be adversely affected by product liability claims or other legal actions or regulatory or compliance matters, including the Consent Decree (as defined below).
We face an inherent business risk of exposure to product liability claims and other legal and regulatory actions. A significant increase in the number, severity, amount, or scope of these claims and actions may result in substantial costs and harm our reputation or otherwise adversely affect product sales and our business. Product liability claims and other legal and regulatory actions may also distract management from other business responsibilities.
We are also subject to a variety of other types of claims, proceedings, investigations, and litigation initiated by government agencies or third parties and other potential risks and liabilities. These include compliance matters, product regulation or safety, taxes, employee benefit plans, employment discrimination, health and safety, environmental, antitrust, customs, import/export, government contract compliance, financial controls or reporting, intellectual property, allegations of misrepresentation, false claims or false statements, commercial claims, claims regarding promotion of our products and services, or other similar or different matters. Any such claims, proceedings, investigations or litigation, regardless of the merits, might result in substantial costs, restrictions on product use or sales, or otherwise injure our business.
Administratively or judicially imposed or agreed sanctions might include warning letters, fines, civil penalties, criminal penalties, loss of tax benefits, injunctions, product seizure, recalls, suspensions or restrictions, re-labeling, detention, and/or debarment. We also might be required to take actions such as payment of substantial amounts, or revision of financial statements, or to take the following types of actions with respect to our products, services, or business:
• | redesign, re-label, restrict, or recall products; |
• | cease manufacturing and selling products; |
• | seizure of product inventory; |
• | comply with a court injunction restricting or prohibiting further marketing and sale of products or services; |
• | comply with a consent decree, which could result in further regulatory constraints; |
12
• | dedication of significant internal and external resources and costs to respond to and comply with legal and regulatory issues and constraints; |
• | respond to claims, litigation, and other proceedings brought by Customers, users, governmental agencies, and others; |
• | disruption of product improvements and product launches; |
• | discontinuation of certain product lines or services; or |
• | other restrictions or limitations on product sales, use or operation, or other activities or business practices. |
Some product replacements or substitutions may not be possible or may be prohibitively costly or time consuming.
Examples of the types of matters described above are the warning letter we received from the FDA on May 16, 2008 regarding our SYSTEM 1 sterile processing system, and the Consent Decree entered into on April 20, 2010. In summary, the warning letter outlined the FDA's assertion that significant changes or modifications had been made in the design, components, method of manufacture or intended use of the device, beyond the FDA's 1988 clearance of the device, such that the FDA asserted a new premarket notification submission was required. After extensive discussion, negotiation and interaction between FDA and us, a consent decree was agreed upon and approved by the Federal District Court for the Northern District of Ohio on April 20, 2010 (the “Consent Decree”). As a consequence of these interactions and the Consent Decree, there are numerous restrictions on us with respect to SYSTEM 1 and other liquid chemical sterilizing and disinfecting devices, components and accessories. For example, we have discontinued all sales of our SYSTEM 1 processor and the provision of service, parts, accessories and sterilant for the processor to U.S. Customers. As a result of these current and future restrictions and commitments, our revenues, earnings, business, performance, prospects or value may be negatively impacted. The Consent Decree also prohibits the sale of liquid chemical sterilizing or disinfecting products that do not have FDA clearance, describes various process and compliance issues, and defines penalties for non-compliance. (For more information regarding this warning letter and the Consent Decree, see the “Risk Factor” titled “Compliance with the Consent Decree may be more costly and burdensome than anticipated” and note 11 of our consolidated financial statements titled, "Commitments and Contingencies"). The Consent Decree, claims by Customers and other parties, and other events or impact associated with these matters could materially affect our business, performance, prospects, value, financial condition, or results of operations.
The ongoing impact of the Consent Decree, or the impact of any legal, regulatory, or compliance claims, proceeding, investigation, or litigation, is difficult to predict. The occurrence of any new legal, regulatory or compliance claim or problem respecting any of our significant products, particularly should such events occur in the near term, could adversely affect our reputation with current and prospective Customers and could otherwise materially and adversely affect our business, performance, prospects, value, financial condition, or results of operations.
We maintain product liability and other insurance with coverages believed to be adequate. However, product liability or other claims may exceed insurance coverage limits, fines, penalties and regulatory sanctions may not be covered by insurance, or insurance may not continue to be available or available on commercially reasonable terms. Additionally, our insurers might deny claim coverage for valid or other reasons or may become insolvent.
Compliance with the Consent Decree may be more costly and burdensome than anticipated.
The Consent Decree contains numerous requirements that could create significant costs and compliance risks. The Consent Decree, which continues to remain in force, includes provisions permitting the government to take corrective actions against us if it determines we have violated the Consent Decree, including the right to issue an order requiring cessation of production or take other corrective action, and in some cases we may be required to implement the order before bringing the matter before a court. Failures to comply with the Consent Decree or FDA regulations respecting liquid chemical sterilizing or disinfecting devices also may result in liquidated damages specified in the Consent Decree of up to ten million dollars per calendar year. If costs associated with compliance with the Consent Decree significantly exceed the amounts anticipated, or if we violate the terms of the Consent Decree, our business, performance, value, financial condition, prospects or results of operations may be adversely affected.
We engage in acquisitions and affiliations, divestitures, and other business arrangements. Our growth may be adversely affected if we are unable to successfully identify, price, and integrate strategic business candidates or otherwise optimize our business portfolio.
Our success depends, in part, on strategic acquisitions and joint ventures, which are intended to complement or expand our businesses, divestiture of non-strategic businesses, and other actions to optimize our portfolio of businesses. This strategy depends upon our ability to identify, appropriately price, and complete these types of business development transactions or arrangements and to obtain any necessary financing. In fiscal 2013 we consummated three such acquisitions: United States Endoscopy Group, Inc., Spectrum Surgical Instruments Corp., and Total Repair Express, as well as buying out the interest of our joint venture partner in VTS Medical Systems, LLC. In fiscal 2014 we acquired the assets of Florida Surgical Repair, Inc., and Life Systems, Inc., and purchased the shares of Eschmann Holdings Ltd. In fiscal 2015 we acquired the shares of Integrated Medical Systems International, Inc., and made other fiscal 2015 purchases as described in the "General Overview and Executive Summary" of Item 7. Our success will also depend on our ability to integrate the businesses acquired, retain key
13
personnel and otherwise execute our strategies. Our success will also depend on our ability to develop satisfactory working arrangements with our strategic partners in joint ventures or other affiliations, or to divest or realign businesses. Competition for strategic business candidates may result in increases in costs and price for acquisition candidates and market valuation issues may reduce the value available for divestiture of non-strategic businesses. These types of transactions are also subject to a number of other risks and uncertainties, including:
• | delays in realizing or failure to realize anticipated benefits of the transactions; |
• | diversion of management's time and attention from other business concerns; |
• | difficulties in retaining key employees, Customers, or suppliers of the acquired or divested businesses; |
• | difficulties in maintaining uniform standards, controls, procedures and policies, or other integration or divestiture difficulties; |
• | adverse effects on existing business relationships with suppliers or Customers; |
• | other events contributing to difficulties in generating future cash flows; |
• | risks associated with the assumption of contingent or other liabilities of acquisition targets or retention of liabilities for divested businesses; and |
• | difficulties in obtaining financing. |
If we are unable to realize the anticipated operating efficiencies and synergies or other expected transaction benefits, our business, prospects, performance, value, financial condition or results of operation may be adversely impacted.
Our acquisition activity and ability to grow organically may be adversely affected if we are unable to continue to access the financial markets.
The Company’s recent acquisitions have been financed largely through borrowings under the Company’s bank credit facilities and private placements. Future acquisitions or other capital requirements, including cash needed for the Combination, will necessitate additional cash. To the extent our existing sources of cash are insufficient to fund these or other future activities, we may need to raise additional funds through new or expanded borrowing arrangements or the sale of equity securities. There can be no assurance that we will be able to obtain additional funds beyond existing bank credit facilities on terms favorable to us, or at all.
If our cost reduction and restructuring efforts are ineffective, our profitability may be hurt or our business otherwise might be adversely affected.
We have undertaken various cost reduction and restructuring activities, including the targeted restructuring activities announced in March 2014. This latter restructuring involves primarily the closure of our Hopkins Production Facility in Mentor, Ohio and the transfer of the System 1E manufacturing operations conducted there to other North American manufacturing facilities. The Company has recorded a $20 million charge for the restructuring. These efforts may not produce the full efficiencies and cost reduction benefits we expect or efficiencies and benefits might be delayed. Implementation costs also might exceed expectations and further cost reduction measures might become necessary, resulting in additional future charges. If these cost reduction and restructuring efforts are not properly implemented or are unsuccessful, we might experience business disruptions or our business otherwise might be adversely affected.
If our continuing efforts to create a Lean business and in-source production to reduce costs are not successful, our profitability may be hurt or our business otherwise might be adversely affected.
We have undertaken various activities to create a Lean business. One of those activities is in-sourcing. We have major projects underway to in-source production that is currently provided by third parties. We have made investments during fiscal 2013, 2014 and 2015. There have been delays in the in-sourcing projects and, as a result, the expected savings have been delayed due to a variety of reasons. These activities may not produce the full efficiencies and cost reduction benefits that we expect or efficiencies and benefits might be further delayed. Implementation costs also might exceed expectations. If these in-sourcing or other Lean activities are not properly implemented or are unsuccessful, we might experience business disruptions, unanticipated additional expense or our business otherwise might be adversely affected.
Our business and results of operations may be adversely affected if we are unable to recruit and retain qualified management and other personnel, or if the Consent Decree or other compliance matters adversely impact our personnel.
Our continued success depends, in large part, on our ability to hire and retain highly qualified people and if we are unable to do so, our business and operations may be impaired or disrupted. Competition for highly qualified people is intense and there is no assurance that we will be successful in attracting or retaining replacements to fill vacant positions, successors to fill retirements or employees moving to new positions, or other highly qualified personnel. Our CEO is a party to the Consent Decree, and other officers and directors are also subject to its terms. If the Consent Decree or other legal, regulatory or compliance matters create significant distraction or diversion of significant or unanticipated resources or attention, that could have a material adverse effect on the responsibilities and retention of these persons, and on our business, performance, prospects, value, financial condition or results of operation.
14
Our business and financial condition could be adversely affected by difficulties in acquiring or maintaining a proprietary intellectual ownership position.
To maintain our competitive position, we need to obtain patent or other proprietary rights for new and improved products and to maintain and enforce our existing patents and other proprietary rights. We typically apply for patents in the United States and in strategic foreign countries. We may also acquire patents through acquisitions. A 2007 United States Supreme Court decision increases the difficulty of obtaining patent protection in the United States.
We rely on a combination of patents, trade secrets, know-how, and confidentiality agreements to protect the proprietary aspects of our technology. These measures afford only limited protection, and competitors may gain access to our intellectual property and proprietary information. Litigation may be necessary to enforce or defend our intellectual property rights, to protect our trade secrets, and to determine the validity and scope of our proprietary rights. Litigation may also be brought against us claiming that we have violated the intellectual property rights of others. Litigation may be costly and may divert management's attention from other matters. Additionally, in some foreign countries with weaker intellectual property rights, it may be difficult to maintain and enforce patents and other proprietary rights or defend against claims of infringement. If we are unable to obtain necessary patents, our patents and other proprietary rights are successfully challenged, or competitors independently develop substantially equivalent information and technology or otherwise gain access to our proprietary technology, our business, performance, value, financial condition, or results of operations may be adversely affected.
The following risk factors relate to the proposed Combination. Additional Synergy transaction-related risk factors are set forth in the Company’s Proxy Statement relating to the special meeting of shareholders that was scheduled for March 12, 2015, filed with the SEC February 9, 2015 (the “Proxy Statement”), a copy of which may be found at http://www.steris.com/synergy.
Risks Relating to the Combination
STERIS must obtain required approvals and governmental and regulatory consents to consummate the Combination, which, if delayed, not granted or granted with unacceptable conditions, may delay or jeopardize the completion of the Combination, result in additional expenditures of money and resources and/or reduce the anticipated benefits of the Combination. Consummation of the Combination is also conditioned on the approval by STERIS shareholders, Synergy shareholders and the approval of the High Court of Justice in England and Wales (the “Court”).
The completion of the Combination is conditioned on, among other things, the clearance by antitrust and competition authorities in the United States. The responsible governmental authorities have broad discretion in administering the governing regulations. STERIS can provide no assurance that all required approvals and consents will be obtained. Moreover, as a condition to their approval of the Combination, agencies may impose requirements, limitations or costs or require divestitures or place restrictions on the conduct of the business of New STERIS Limited ("New STERIS") (which, if the Combination is completed, will become the parent company of STERIS and of which current STERIS shareholders will become shareholders, after the closing). These requirements, limitations, costs, divestitures or restrictions could jeopardize or delay the completion of the Combination or reduce the anticipated benefits of the Combination. Further, no assurance can be given that the required shareholder approvals will be obtained or that the required closing conditions will be satisfied, and, if all required consents and approvals are obtained and the closing conditions are satisfied, no assurance can be given as to the terms, conditions and timing of the approvals. If STERIS and Synergy agree to any material requirements, limitations, costs, divestitures or restrictions in order to obtain any approvals required to consummate the Combination, these requirements, limitations, costs, divestitures or restrictions could adversely affect New STERIS’s ability to integrate Synergy’s operations with STERIS’s operations and/or reduce the anticipated benefits of the Combination. This could have a material adverse effect on New STERIS’s business and results of operations.
The Combination remains subject to other conditions that STERIS cannot control.
The Combination is subject to other conditions, including the approval of the scheme of arrangement proposed to be made under Part 26 of the Companies Act between Synergy and the Synergy shareholders (the “Scheme”), with or subject to any modification, addition or condition approved or imposed by the Synergy shareholders, the sanction of the Scheme by the Court, the adoption of a proposed merger agreement by the affirmative vote of the holders of a majority of the outstanding STERIS shares, the Scheme becoming effective by July 12, 2015 (or such later date (if any) as may be agreed by STERIS and Synergy and (if required) the consent of the U.K. Panel on Takeovers and Mergers (the “Takeover Panel”) and the Court), the Registration Statement on Form S-4 not having been the subject of any stop order suspending its effectiveness and no proceedings seeking any such stop order having been initiated or threatened by the SEC, and the NYSE having authorized the listing of the New STERIS ordinary shares upon official notice of issuance and not having withdrawn such authorization. Additional conditions are set out in Appendix 2 to the Rule 2.7 Announcement entitled “Conditions to and Certain Further Terms of the Combination,” which is attached as Annex B to the Proxy Statement. No assurance can be given that all of the
15
conditions to the Combination will be satisfied, or if they are, as to the timing of such satisfaction. If the conditions to the Combination are not satisfied, then the Combination may not be consummated.
While the Combination is pending, STERIS will be subject to business uncertainties that could adversely affect its business.
Uncertainty about the effect of the Combination on employees, Customers and suppliers may have an adverse effect on STERIS and, consequently, on New STERIS. These uncertainties may impair STERIS’s ability to attract, retain and motivate key personnel until the Combination is consummated and for a period of time thereafter, and could cause Customers, suppliers and others who deal with STERIS to seek to change existing business relationships with STERIS. Employee retention may be particularly challenging during the pendency of the Combination because employees may experience uncertainty about their future roles with New STERIS. If, despite STERIS’s retention efforts, key employees depart because of issues relating to the uncertainty and difficulty of integration or a desire not to remain with New STERIS, New STERIS’s business could be harmed.
In certain circumstances STERIS may not be able to invoke the transaction conditions and terminate the Combination, which could reduce the value of New STERIS shares.
The Takeover Code provides that certain conditions may only be invoked where the circumstances underlying the failure of the condition are of material significance to STERIS in the context of the Combination. Therefore, with the exceptions of certain antitrust conditions as described in the Section of the Proxy Statement entitled “Regulatory Approvals” and certain conditions relating to (i) the approval of the Scheme by Synergy shareholders and the Court, (ii) the approval of the Merger Agreement by STERIS shareholders and (iii) the listing of New STERIS ordinary shares on the NYSE, STERIS may be required to obtain agreement of the Takeover Panel that the circumstances giving rise to the right to invoke the condition were of material significance to STERIS in the context of the Combination before STERIS would be permitted to rely on that condition.
If a material adverse change affecting Synergy occurs and the Takeover Panel does not allow STERIS to invoke a condition to cause the Combination not to proceed, the market price of STERIS shares may decline or STERIS’s business or STERIS’s financial condition may be materially adversely affected. As a result, the value of the New STERIS ordinary shares received by STERIS shareholders may be reduced and/or the business or financial condition of New STERIS may be adversely affected.
The Takeover Code may limit STERIS’s ability to cause Synergy to consummate the transaction and may otherwise limit the relief STERIS may obtain in the event Synergy’s board withdraws its support of the Scheme.
The Takeover Code limits the contractual commitments that may be obtained from Synergy to take actions in furtherance of the Combination, and the Synergy Board may, if its fiduciary and other directors’ duties so require, withdraw its recommendation in support for the Scheme, and withdraw the Scheme itself, at any time before the Court hearing to approve the reduction of Synergy’s share capital provided for as part of the Scheme. The Takeover Code does not permit Synergy to pay any break fee if it does so, nor can it be subject to any restrictions on soliciting or negotiating other offers or transactions involving Synergy other than the restrictions against undertaking actions or entering into agreements which are similar to or have a similar effect to “poison pills” and which might frustrate STERIS’s offer for Synergy.
STERIS shareholders will have a reduced ownership and voting interest after the Combination and may exercise less influence over management in New STERIS than they currently have in STERIS.
Upon the completion of the Combination, a STERIS shareholder will hold a percentage ownership of New STERIS that is smaller than such shareholder’s current percentage ownership of STERIS as it exists today. It is currently expected that the former shareholders of STERIS as a group will receive shares in the Combination constituting approximately 70% of the outstanding New STERIS ordinary shares immediately after the consummation of the Combination. Because of this, current STERIS shareholders may have less influence on the management and policies of New STERIS than they currently have on the management and policies of STERIS.
ITEM 1B.UNRESOLVED STAFF COMMENTS
None.
ITEM 2. PROPERTIES
16
The following table sets forth the principal plants and other materially important properties of the Company and its subsidiaries as of March 31, 2015. The Company believes that its facilities are adequate for operations and are maintained in good condition. The Company is confident that, if needed, it will be able to acquire additional facilities at commercially reasonable rates.
In the table below, “Contract Sterilization” refers to locations of the Isomedix segment. “Manufacturing,” “Warehousing,” “Operations,” or “Sales Offices” refer to locations serving both the Healthcare and Life Sciences segments.
United States (U.S.) Locations (including Puerto Rico) and International Locations (INTL) | ||||||
Location | U.S./INTL | Use | Owned/Leased | |||
Montgomery, AL | U.S. | Manufacturing | Owned | |||
Ontario, CA | U.S. | Contract Sterilization | Owned | |||
San Diego, CA | U.S. | Contract Sterilization | Owned | |||
Temecula, CA | U.S. | Contract Sterilization | Owned | |||
Libertyville, IL (2 locations) | U.S. | Contract Sterilization | Owned | |||
Northborough, MA | U.S. | Contract Sterilization | Owned | |||
Brooklyn Park, MN | U.S. | Contract Sterilization | Owned | |||
St. Louis, MO | U.S. | Manufacturing | Owned | |||
South Plainfield, NJ | U.S. | Contract Sterilization | Owned | |||
Whippany, NJ | U.S. | Contract Sterilization | Owned | |||
Chester, NY | U.S. | Contract Sterilization | Owned | |||
Groveport, OH | U.S. | Contract Sterilization | Owned | |||
Mentor, OH (11 locations) | U.S. | Corporate Headquarters | Owned | |||
U.S. | Sales/Marketing Offices | Owned | ||||
U.S. | Administrative Offices | Owned | ||||
U.S. | Manufacturing/Warehousing | Owned | ||||
U.S. | Manufacturing/Operations | Owned | ||||
U.S. | Research and Development | Owned | ||||
U.S. | Lobby, Showroom and Customer Service | Owned | ||||
U.S. | Education Center | Owned | ||||
Spartanburg, SC | U.S. | Contract Sterilization | Owned | |||
El Paso, TX (2 locations) | U.S. | Contract Sterilization | Owned | |||
Grand Prairie, TX | U.S. | Contract Sterilization | Owned | |||
Sandy, UT | U.S. | Contract Sterilization | Owned | |||
Minneapolis, MN (2 locations) | U.S. | Contract Sterilization | Owned | |||
Birmingham, AL (4 locations) | U.S. | Manufacturing/ Office Space/ Warehouse | Owned | |||
Vega Alta, PR | INTL | Contract Sterilization | Owned | |||
Bordeaux, France | INTL | Manufacturing/Sales Office/Showroom | Owned | |||
Quebec City, Canada | INTL | Manufacturing | Owned | |||
Whitby, Canada | INTL | Contract Sterilization | Owned | |||
Leicester, England | INTL | Manufacturing | Owned | |||
Mogi das Cruzes, Brazil | INTL | Manufacturing/Sales Office | Owned | |||
Tuusula, Finland | INTL | Manufacturing/Sales Office | Owned | |||
Lancing, England | INTL | Manufacturing/Administration Offices | Owned | |||
St. Louis, MO | U.S. | Warehousing/Distribution | Leased | |||
Reno, NV | U.S. | Warehousing | Leased | |||
Mentor, OH (2 locations) | U.S. | Administrative Offices | Leased | |||
Stow, OH (2 locations) | U.S. | Sales/Administration Offices | Leased | |||
17
United States (U.S.) Locations (including Puerto Rico) and International Locations (INTL) | ||||||
Location | U.S./INTL | Use | Owned/Leased | |||
Hillsborough, NJ | U.S. | Sales/Administration Offices | Leased | |||
Keller, TX | U.S. | Sales/Administration Offices | Leased | |||
Houston, TX | U.S. | Sales/Administration Offices | Leased | |||
Tustin, CA | U.S. | Sales/Administration Offices | Leased | |||
Montgomery Village, MD | U.S. | Sales/Administration Offices | Leased | |||
Melville, NY | U.S. | Sales/Administration Offices | Leased | |||
Santa Clara, CA | U.S. | Sales Office | Leased | |||
Chesterfield, MO | U.S. | Sales/Administration Offices | Leased | |||
Homewood, AL (3 locations) | U.S. | Administration Offices | Leased | |||
Cooper City, FL | U.S. | R&D, Engineering, Repair | Leased | |||
Rockville, MD | U.S. | Repair Lab | Leased | |||
Charlotte, NC | U.S. | Administration Offices | Leased | |||
Springdale, OH | U.S. | Instrument Repair Lab | Leased | |||
Tampa, FL | U.S. | Instrument Repair Lab | Leased | |||
Stone Mountain, GA | U.S. | Instrument Repair Lab | Leased | |||
Longwood, FL | U.S. | Sales/Administration Offices | Leased | |||
Franklin Park, IL | U.S. | Manufacturing/ Administration Offices | Leased | |||
Bensenville, IL | U.S. | Offices/ Warehouse/ Lab | Leased | |||
Montgomery, AL | U.S. | Warehouse | Leased | |||
Antwerpen, Belgium | INTL | Sales Office/Service | Leased | |||
Sao Paulo, Brazil | INTL | Sales Office | Leased | |||
Mississauga, Canada | INTL | Sales Office/Warehousing | Leased | |||
Beijing, China | INTL | Sales Office | Leased | |||
Guangzhou, China | INTL | Sales/Administration Offices/ Assembly | Leased | |||
Shanghai, China | INTL | Sales Office/ Manufacturing | Leased | |||
Basingstoke, England | INTL | Sales Office | Leased | |||
Leicester, England | INTL | Warehousing | Leased | |||
La Chapelle St. Mesmin, France | INTL | Sales Office | Leased | |||
Orleans, France | INTL | Showroom | Leased | |||
Saint Jean d'illac, France | INTL | Warehousing | Leased | |||
Paris, France | INTL | Sales Office | Leased | |||
Toussieu, France | INTL | Warehousing | Leased | |||
Cologne, Germany | INTL | Sales Office | Leased | |||
Gokul Nagar, India | INTL | Sales Office | Leased | |||
Segrate, Italy | INTL | Sales Office | Leased | |||
Tokyo, Japan | INTL | Sales Office | Leased | |||
Petaling Jaya, Malaysia | INTL | Sales Office | Leased | |||
Guadalupe, Mexico | INTL | Manufacturing | Leased | |||
Moscow, Russia | INTL | Sales Office | Leased | |||
Singapore (3 locations) | INTL | Sales Office, Warehousing | Leased | |||
Madrid, Spain | INTL | Sales Office | Leased | |||
United Arab Emirates | INTL | Sales Office | Leased | |||
ITEM 3. | LEGAL PROCEEDINGS |
18
Information regarding our commitments and contingencies is included in Item 7, "MD&A" and note 11 of our consolidated financial statements titled, "Commitments and Contingencies".
ITEM 4. MINE SAFETY DISCLOSURES
None.
19
PART II
ITEM 5. | MARKET FOR REGISTRANT’S COMMON EQUITY, RELATED SHAREHOLDER MATTERS AND ISSUER PURCHASES OF EQUITY SECURITIES |
Market Information. Our common shares are traded on the New York Stock Exchange under the symbol “STE.” The following table presents, for the quarters ending on the dates indicated, the high and low sales prices for our common shares.
Quarters Ended | March 31 | December 31 | September 30 | June 30 | |||||||||||
Fiscal 2015 | |||||||||||||||
High | $ | 70.65 | $ | 68.04 | $ | 57.72 | $ | 55.36 | |||||||
Low | 62.56 | 52.29 | 49.78 | 47.24 | |||||||||||
Fiscal 2014 | |||||||||||||||
High | $ | 49.92 | $ | 48.50 | $ | 46.10 | $ | 46.59 | |||||||
Low | 39.90 | 42.74 | 40.46 | 38.85 | |||||||||||
Holders. As of March 31, 2015, there were approximately 1,287 holders of record of our common shares. However, we believe that we have a significantly larger number of beneficial holders of common shares.
Dividend Policy. The Company’s Board of Directors decides the timing and amount of any dividends we may pay. During fiscal 2015, we paid cash dividends totaling $0.90 per outstanding common share ($0.21 per outstanding common share to common shareholders of record on June 5, 2014, and $0.23 per outstanding common share to common shareholders of record on the following dates: August 26, 2014, November 26, 2014 and February 25, 2015). During fiscal 2014, we paid cash dividends totaling $0.82 per outstanding common share ($0.19 per outstanding common share to common shareholders of record on June 4, 2013, and $0.21 per outstanding common share to common shareholders of record on the following dates: August 28, 2013, November 20, 2013 and February 26, 2014).
Recent Sales of Unregistered Securities. None.
Purchases of Equity Securities by the Issuer and Affiliated Purchasers. The following table presents information with respect to purchases STERIS made of its shares of common stock during the fourth quarter of the 2015 fiscal year:
(a) Total Number of Shares Purchased | (b) Average Price Paid Per Share | (c) Total Number of Shares Purchased as Part of Publicly Announced Plans (2) | (d) Maximum Dollar Value of Shares that May Yet Be Purchased Under the Plans at Period End (dollars in thousands) | |||||||||||
January 1-31 | — | $ | — | — | $ | 86,939 | ||||||||
February 1-28 | — | — | — | 86,939 | ||||||||||
March 1-31 | — | — | — | 86,939 | ||||||||||
Total | — | (1) | $ | — | (1) | — | $ | 86,939 | ||||||
(1) | Does not include 56 shares purchased during the quarter at an average price of $66.04 per share by the STERIS Corporation 401(k) Plan on behalf of certain executive officers of the Company who may be deemed to be affiliated purchasers. |
(2) | On March 14, 2008 we announced that, the Board of Directors had authorized the repurchase of up to $300.0 million of our common shares. As of March 31, 2015, $86.9 million remained authorized for repurchase of our common shares under the current share repurchase authorization. This authorization does not have a stated maturity date. We provide information about our full year fiscal 2015 share repurchase activity in note 14 to our consolidated financial statements titled, “Repurchases of Common Shares.” |
20
ITEM 6. SELECTED FINANCIAL DATA
Years Ended March 31, | |||||||||||||||||||
(in thousands, except per share data) | 2015 (1) | 2014 (1) | 2013(1)(2) | 2012(2) | 2011(2) | ||||||||||||||
Statements of Income Data: | |||||||||||||||||||
Revenues | $ | 1,850,263 | $ | 1,622,252 | $ | 1,501,902 | $ | 1,406,810 | $ | 1,207,448 | |||||||||
Gross profit | 774,301 | 649,622 | 621,263 | 568,465 | 446,162 | ||||||||||||||
Restructuring expenses | (391 | ) | 13,204 | (565 | ) | 644 | 1,202 | ||||||||||||
Income from continuing operations | 227,211 | 206,807 | 242,829 | 222,316 | 85,212 | ||||||||||||||
Income taxes | 73,756 | 58,934 | 67,121 | 74,993 | 22,554 | ||||||||||||||
Net income | $ | 135,064 | $ | 129,442 | $ | 159,977 | $ | 136,115 | $ | 51,265 | |||||||||
Basic income per common share: | |||||||||||||||||||
Net income | $ | 2.27 | $ | 2.20 | $ | 2.74 | $ | 2.33 | $ | 0.86 | |||||||||
Shares used in computing net income per common share – basic | 59,413 | 58,966 | 58,305 | 58,367 | 59,306 | ||||||||||||||
Diluted income per common share: | |||||||||||||||||||
Net income | $ | 2.25 | $ | 2.17 | $ | 2.72 | $ | 2.31 | $ | 0.85 | |||||||||
Shares used in computing net income per common share – diluted | 60,045 | 59,745 | 58,884 | 58,963 | 60,148 | ||||||||||||||
Dividends per common share | $ | 0.90 | $ | 0.82 | $ | 0.74 | $ | 0.66 | $ | 0.56 | |||||||||
Balance Sheets Data: | |||||||||||||||||||
Working capital | $ | 437,101 | $ | 420,239 | $ | 395,103 | $ | 373,488 | $ | 361,060 | |||||||||
Total assets | 2,099,466 | 1,887,162 | 1,761,109 | 1,405,696 | 1,426,685 | ||||||||||||||
Long-term indebtedness | 623,250 | 493,480 | 492,290 | 210,000 | 210,000 | ||||||||||||||
Total liabilities | 1,025,820 | 845,916 | 814,129 | 583,032 | 638,020 | ||||||||||||||
Total shareholders’ equity | 1,071,632 | 1,038,705 | 944,942 | 821,401 | 787,569 | ||||||||||||||
(1) | See “Management’s Discussion and Analysis of Financial Condition and Results of Operations.” |
(2) | Presented amounts include the impact of the SYSTEM 1 Rebate Program and the SYSTEM 1 class action settlement. |
21
ITEM 7. | MANAGEMENT’S DISCUSSION AND ANALYSIS OF FINANCIAL CONDITION AND RESULTS OF OPERATIONS |
INTRODUCTION
In Management’s Discussion and Analysis (“MD&A”), we explain the general financial condition and the results of operations for STERIS and its subsidiaries including:
• | what factors affect our business; |
• | what our earnings and costs were; |
• | why those earnings and costs were different from the year before; |
• | where our earnings came from; |
• | how this affects our overall financial condition; |
• | what our expenditures for capital projects were; and |
• | where cash will come from to fund future debt principal repayments, growth outside of core operations, repurchase common shares, pay cash dividends and fund future working capital needs. |
The MD&A also analyzes and explains the annual changes in the specific line items in the Consolidated Statements of Income. As you read the MD&A, it may be helpful to refer to information in Item 1, “Business,” Item 6, “Selected Financial Data,” and our consolidated financial statements, which present the results of our operations for fiscal 2015, 2014 and 2013, as well as Part I, Item 1A, “Risk Factors” and note 11 of our consolidated financial statements titled, "Commitments and Contingencies", for a discussion of some of the matters that can adversely affect our business and results of operations. This information, discussion, and disclosure may be important to you in making decisions about your investments in STERIS.
FINANCIAL MEASURES
In the following sections of the MD&A, we may, at times, refer to financial measures that are not required to be presented in the consolidated financial statements under U.S. GAAP. We sometimes use the following financial measures in the context of this report: backlog; debt-to-total capital; net debt-to-total capital; and days sales outstanding. We define these financial measures as follows:
• | Backlog – We define backlog as the amount of unfilled capital equipment purchase orders at a point in time. We use this figure as a measure to assist in the projection of short-term financial results and inventory requirements. |
• | Debt-to-total capital – We define debt-to-total capital as total debt divided by the sum of total debt and shareholders’ equity. We use this figure as a financial liquidity measure to gauge our ability to borrow and fund growth. |
• | Net debt-to-total capital – We define net debt-to-total capital as total debt less cash (“net debt”) divided by the sum of net debt and shareholders’ equity. We also use this figure as a financial liquidity measure to gauge our ability to borrow and fund growth. |
• | Days sales outstanding (“DSO”) – We define DSO as the average collection period for accounts receivable. It is calculated as net accounts receivable divided by the trailing four quarters’ revenues, multiplied by 365 days. We use this figure to help gauge the quality of accounts receivable and expected time to collect. |
We, at times, may also refer to financial measures which are considered to be “non-GAAP financial measures” under SEC rules. We have presented these financial measures because we believe that meaningful analysis of our financial performance is enhanced by an understanding of certain additional factors underlying that performance. These financial measures should not be considered an alternative to measures required by accounting principles generally accepted in the United States. Our calculations of these measures may differ from calculations of similar measures used by other companies and you should be careful when comparing these financial measures to those of other companies. Additional information regarding these financial measures, including reconciliations of each non- GAAP financial measure, is available in the subsection of MD&A titled, "Non-GAAP Financial Measures."
REVENUES– DEFINED
As required by Regulation S-X, we separately present revenues generated as either product revenues or service revenues on our Consolidated Statements of Income for each period presented. When we discuss revenues, we may, at times, refer to revenues summarized differently than the Regulation S-X requirements. The terminology, definitions, and applications of terms
22
that we use to describe revenues may be different from terms used by other companies. We use the following terms to describe revenues:
• | Revenues – Our revenues are presented net of sales returns and allowances. |
• | Product Revenues – We define product revenues as revenues generated from sales of consumable and capital equipment products. |
• | Service Revenues – We define service revenues as revenues generated from parts and labor associated with the maintenance, repair, and installation of our capital equipment, instrument and endoscope repair services, and revenues generated from contract sterilization offered through our Isomedix segment. |
• | Capital Revenues – We define capital revenues as revenues generated from sales of capital equipment, which includes steam sterilizers, low temperature liquid chemical sterilant processing systems, including SYSTEM 1 and 1E, washing systems, VHP® technology, water stills, and pure steam generators; surgical lights and tables; and integrated OR. |
• | Consumable Revenues – We define consumable revenues as revenues generated from sales of the consumable family of products, which includes SYSTEM 1 and 1E consumables, V-Pro consumables, gastrointestinal endoscopy accessories, sterility assurance products, skin care products, cleaning consumables, and surgical instruments. |
• | Recurring Revenues – We define recurring revenues as revenues generated from sales of consumable products and service revenues. |
GENERAL OVERVIEW AND EXECUTIVE SUMMARY
Our Business. Our mission is to help our Customers create a healthier and safer world by providing innovative healthcare and life science product and service solutions around the globe. Our dedicated employees around the world work together to supply a broad range of solutions by offering a combination of capital equipment, consumables, and services to healthcare, pharmaceutical, industrial, and governmental Customers.
The bulk of our revenues are derived from the healthcare and pharmaceutical industries. Much of the growth in these industries is driven by the aging of the population throughout the world, as an increasing number of individuals are entering their prime healthcare consumption years, and is dependent upon advancement in healthcare delivery, acceptance of new technologies, government policies, and general economic conditions. The pharmaceutical industry has been impacted by increased FDA scrutiny of cleaning and validation processes, mandating that manufacturers improve their processes. Within healthcare, there is increased concern regarding the level of hospital acquired infections around the world; increased demand for medical procedures, including preventative screenings such as endoscopies and colonoscopies; and a desire by our Customers to operate more efficiently, all which are driving increased demand for many of our products and services.
We are also investing in several manufacturing in-sourcing projects for the purpose of improving quality, cost and delivery of our products to our Customers.
Highlights. During fiscal year 2015, we continued to invest in new products and in quality processes to defend and grow our core business. Simultaneously, we continued the execution of our strategy to expand into adjacent markets with acquisitions in the Healthcare and Life Sciences segments. On May 9, 2014, the Company acquired Integrated Medical Systems International, Inc. ("IMS"). IMS has facilities located in Alabama, Florida and Maryland and provides a variety of services, including: endoscope repair, surgical instrument management and sterile processing consulting. IMS has been integrated into our Healthcare segment as part of our Specialty Services reporting unit. On December 31, 2014, a newly formed subsidiary of the Company acquired the assets of and assumed certain liabilities of AGAPE Instruments Service, Inc. ("AGAPE"), a provider of certification services located near Cincinnati, Ohio. AGAPE will be integrated into our Life Sciences business segment. On March 9, 2015 the Company purchased all the outstanding shares of capital stock of Dana Products, Inc. ("Dana"), a manufacturer of chemical indicators located near Chicago, Illinois. Dana will be integrated into our Healthcare segment as part of our Healthcare business.
On October 13, 2014, we announced that we were commencing a “recommended offer” under U.K. law to acquire all outstanding shares of Synergy Health plc ("Synergy") in a cash and stock transaction valued at £19.50 ($31.35) per Synergy share, or a total of approximately $1.9 billion based on STERIS’s closing stock price of $56.38 per share on October 10, 2014, through a newly formed U.K. entity that also would indirectly acquire all of the outstanding stock of STERIS (the “Combination”). Based on STERIS’s closing stock price of $67.00 and exchange rates as of February 3, 2015, the total value of the cash and stock transaction is approximately $2.1 billion or £23.42 ($35.52) per Synergy share. The Combination is subject to certain customary closing conditions, including approvals by STERIS and Synergy shareholders as well as regulatory approvals by the U.S. Federal Trade Commission (“FTC”), which is currently reviewing the Combination. Both companies have entered into a timing agreement with the FTC under the terms of which the companies have agreed not to close the Combination before June 2, 2015 unless the FTC first closes its investigation. Both companies are cooperating with the FTC staff in the review of the Combination. No assurance can be provided as to when or if the transaction will be completed.
23
Revenues increased $228.0 million, or 14.1%, to $1,850.3 million for the year ended March 31, 2015, as compared to $1,622.3 million for the year ended March 31, 2014, reflecting growth within all three business segments.
Fiscal 2015 operating income was $227.2 million, an increase of 9.9% over the fiscal 2014 operating income of $206.8 million. This increase in operating income is primarily attributable to the higher gross margin attainment as well as the increase in volume in fiscal 2015 over fiscal 2014.
Net cash flows from operations were $246.0 million and free cash flow was $161.6 million (see subsection of MD&A titled, "Non-GAAP Financial Measures" for additional information and related reconciliation of non-GAAP financial measures to the most comparable GAAP measures). As a result of the acquisition activity, we increased our leverage by borrowing under our revolving credit facility. With this additional leverage, our debt-to-total capital ratio was 36.8% at March 31, 2015. We increased our dividend double digits for the ninth consecutive year to $0.23 per share per quarter.
Outlook. Fluctuations in foreign currency rates can impact revenues and costs outside of the United States, creating variability in our results for fiscal 2016 and beyond.
In fiscal 2016 and beyond, we expect to continue to manage our costs, grow our business with internal product development, invest in greater capacity, and augment these value creating methods with acquisitions of adjacent products and services. We plan to continue our efforts to in-source some of the production that we have traditionally out-sourced.
MATTERS AFFECTING COMPARABILITY
SYSTEM 1 Rebate Program and class action settlement. In April 2010, we introduced the SYSTEM 1 Rebate Program ("Rebate Program") to Customers as a component of our Transition Plan for SYSTEM 1. Generally, U.S. Customers that purchased SYSTEM 1 processors directly from us or who were current users of SYSTEM 1 and who returned their units had the option of either a pro-rated cash value or rebate toward the future purchase of new STERIS capital equipment or consumable products. In addition, we provided credits for SYSTEM 1 service contracts and consumables in unbroken packaging.
During the first quarter of fiscal 2011, we recorded a pre-tax liability related to the SYSTEM 1 Rebate Program. Of the $110.0 million recorded, $102.3 million was attributable to the Customer Rebate portion of the Program and was recorded as a reduction to revenue, and $7.7 million was attributable to the disposal liability of the SYSTEM 1 units to be returned and was recorded in cost of revenues.
During fiscal 2012 and fiscal 2013, based on the actual experience at the time, we adjusted a portion of the original estimated liability related to the Rebate Program. The total fiscal 2012 pre-tax adjustment was $17.4 million, of which $15.3 million was recorded as an increase to revenue for the Customer rebate portion, and $2.1 million was recorded as a reduction in cost of revenues related to the disposal liability. The total fiscal 2013 pre-tax adjustments amounted to $23.7 million, of which $22.4 million was recorded as increases to revenue for the Customer rebate portion, and $1.3 million was recorded as reductions to cost of revenues related to the disposal portion of the liability. These adjustments resulted primarily from a lower number of eligible Customers electing to participate in the Rebate Program than previously estimated.
In fiscal 2011 we recorded a pre-tax charge of $19.8 million related to the initial recognition of the settlement of SYSTEM 1 class action litigation. The impact of the charge was a reduction in net income of $13.1 million (after tax of $6.7 million). As a result of the passage of the claim submission deadline during fiscal 2013, we adjusted the liability related to the SYSTEM 1 class action settlement by $16.8 million based on actual claims submitted.
International Operations. Since we conduct operations outside of the United States using various foreign currencies, our operating results are impacted by foreign currency movements relative to the U.S. dollar. During fiscal 2015, our revenues were unfavorably impacted by $10.4 million, or 0.6%, and income before taxes was favorably impacted by $10.8 million, or 5.4%, as a result of foreign currency movements relative to the U.S. dollar.
NON-GAAP FINANCIAL MEASURES
We, at times, refer to financial measures which are considered to be “non-GAAP financial measures” under SEC rules. We, at times, also refer to our results of operations excluding certain transactions or amounts that are non-recurring or are not indicative of future results, in order to provide meaningful comparisons between the periods presented.
These non-GAAP financial measures are not intended to be, and should not be, considered separately from or as an alternative to the most directly comparable GAAP financial measures.
24
These non-GAAP financial measures are presented with the intent of providing greater transparency to supplemental financial information used by management and the Board of Directors in their financial analysis and operational decision-making. These amounts are disclosed so that the reader has the same financial data that management uses with the belief that it will assist investors and other readers in making comparisons to our historical operating results and analyzing the underlying performance of our operations for the periods presented.
We believe that the presentation of these non-GAAP financial measures, when considered along with our GAAP financial measures and the reconciliation to the corresponding GAAP financial measures, provide the reader with a more complete understanding of the factors and trends affecting our business than could be obtained absent this disclosure. It is important for the reader to note that the non-GAAP financial measure used may be calculated differently from, and therefore may not be comparable to, a similarly titled measure used by other companies.
We define free cash flow as net cash provided by operating activities as presented in the Consolidated Statements of Cash Flows less purchases of property, plant, equipment, and intangibles plus proceeds from the sale of property, plant, equipment, and intangibles, which are also presented in the Consolidated Statements of Cash Flows. We use this as a measure to gauge our ability to fund future debt principal repayments and growth outside of core operations, repurchase common shares, and pay cash dividends. The following table summarizes the calculation of our free cash flow for the years ended March 31, 2015, 2014 and 2013:
Years Ended March 31, | |||||||||||
(dollars in thousands) | 2015 | 2014 | 2013 | ||||||||
Net cash flows provided by operating activities | $ | 246,040 | $ | 209,631 | $ | 227,815 | |||||
Purchases of property, plant, equipment and intangibles, net | (85,255 | ) | (86,367 | ) | (87,412 | ) | |||||
Proceeds from the sale of property, plant, equipment and intangibles | 829 | 4,774 | 34 | ||||||||
Free cash flow | $ | 161,614 | $ | 128,038 | $ | 140,437 | |||||
To supplement our financial results presented in accordance with GAAP, we have sometimes referred to certain measures of revenues, gross profit, gross profit percentage, and the Healthcare segment results of operations in the section of MD&A titled, "Results of Operations" excluding the impact of adjustments recorded in connection with the SYSTEM 1 Rebate Program and the SYSTEM 1 class action settlement. These items had a significant impact on the fiscal 2013 measures and the corresponding trend in each of these measures. We provide adjusted measures to give the reader a more complete understanding of the factors and trends affecting our business than could be obtained absent this disclosure. These measures are used by management and the Board of Directors in making comparisons to our historical operating results and analyzing the underlying performance of our operations. The tables below provide a reconciliation of each of these measures to its most directly comparable GAAP financial measure.
Years Ended March 31, | |||||||||
(dollars in thousands) | 2015 | 2014 | 2013 | ||||||
Reported revenues | $ | 1,850,263 | $ | 1,622,252 | $ | 1,501,902 | |||
Impact of the SYSTEM 1 Rebate Program | — | — | (22,367 | ) | |||||
Adjusted revenues | $ | 1,850,263 | $ | 1,622,252 | $ | 1,479,535 | |||
Reported capital equipment revenues | $ | 597,809 | $ | 603,579 | $ | 613,378 | |||
Impact of the SYSTEM 1 Rebate Program | — | — | (22,367 | ) | |||||
Adjusted capital equipment revenues | $ | 597,809 | $ | 603,579 | $ | 591,011 | |||
Reported United States revenues | $ | 1,449,223 | $ | 1,244,730 | $ | 1,141,633 | |||
Impact of the SYSTEM 1 Rebate Program | — | — | (22,367 | ) | |||||
Adjusted United States Revenues | $ | 1,449,223 | $ | 1,244,730 | $ | 1,119,266 | |||
Reported Healthcare revenues | $ | 1,391,874 | $ | 1,180,051 | $ | 1,074,790 | |||
Impact of the SYSTEM 1 Rebate Program | — | — | (22,367 | ) | |||||
25
Adjusted Healthcare revenues | $ | 1,391,874 | $ | 1,180,051 | $ | 1,052,423 | |||
Healthcare capital revenues | $ | 517,007 | $ | 515,380 | $ | 521,806 | |||
Impact of SYSTEM 1 Rebate Program | — | — | (22,367 | ) | |||||
Adjusted Healthcare capital revenues | $ | 517,007 | $ | 515,380 | $ | 499,439 | |||
Reported gross profit | $ | 774,301 | $ | 649,622 | $ | 621,263 | |||
Impact of the SYSTEM 1 Rebate Program | — | — | (23,640 | ) | |||||
Adjusted gross profit | $ | 774,301 | $ | 649,622 | $ | 597,623 | |||
Reported gross profit percentage | 41.8 | % | 40.0 | % | 41.4 | % | |||
Impact of the SYSTEM 1 Rebate Program | — | % | — | % | (1.0 | )% | |||
Adjusted gross profit percentage | 41.8 | % | 40.0 | % | 40.4 | % | |||
Reported operating income | $ | 227,211 | $ | 206,807 | $ | 242,829 | |||
Impact of the SYSTEM 1 Rebate Program and class action settlement | — | — | (40,422 | ) | |||||
Adjusted operating income | $ | 227,211 | $ | 206,807 | $ | 202,407 | |||
Reported Healthcare operating income | $ | 125,505 | $ | 109,714 | $ | 153,343 | |||
Impact of the SYSTEM 1 Rebate Program and class action settlement | — | — | (40,422 | ) | |||||
Adjusted Healthcare operating income | $ | 125,505 | $ | 109,714 | $ | 112,921 | |||
Reported income tax expense | $ | 73,756 | $ | 58,934 | $ | 67,121 | |||
Impact of the SYSTEM 1 Rebate Program and class action settlement | — | — | (15,765 | ) | |||||
Adjusted income tax expense | $ | 73,756 | $ | 58,934 | $ | 51,356 | |||
Reported selling, general and administrative | $ | 493,342 | $ | 380,970 | $ | 337,694 | |||
Impact of the SYSTEM 1 class action settlement | — | — | 16,782 | ||||||
Adjusted selling, general and administrative | $ | 493,342 | $ | 380,970 | $ | 354,476 | |||
Reported effective income tax rate | 35.3 | % | 31.3 | % | 29.6 | % | |||
Impact of the SYSTEM 1 Rebate Program and class action settlement | — | % | — | % | (2.1 | )% | |||
Adjusted effective income tax rate | 35.3 | % | 31.3 | % | 27.5 | % | |||
RESULTS OF OPERATIONS
In the following subsections, we discuss our earnings and the factors affecting them. We begin with a general overview of our operating results and then separately discuss earnings for our operating segments.
26
FISCAL 2015 AS COMPARED TO FISCAL 2014
Revenues. The following table compares our revenues, in total and by type and geography, for the year ended March 31, 2015 to the year ended March 31, 2014:
Years Ended March 31, | Percent | |||||||||||||
(dollars in thousands) | 2015 | 2014 | Change | Change | ||||||||||
Total revenues | $ | 1,850,263 | $ | 1,622,252 | $ | 228,011 | 14.1 | % | ||||||
Revenues by type: | ||||||||||||||
Capital equipment revenues | 597,809 | 603,579 | (5,770 | ) | (1.0 | )% | ||||||||
Consumable revenues | 449,996 | 407,883 | 42,113 | 10.3 | % | |||||||||
Service revenues | 802,458 | 610,790 | 191,668 | 31.4 | % | |||||||||
Revenues by geography: | ||||||||||||||
United States revenues | 1,449,223 | 1,244,730 | 204,493 | 16.4 | % | |||||||||
International revenues | 401,040 | 377,522 | 23,518 | 6.2 | % | |||||||||
Revenues increased $228.0 million, or 14.1%, to $1,850.3 million for the year ended March 31, 2015, as compared to $1,622.3 million for the year ended March 31, 2014. This increase is primarily attributable to our recent acquisitions and growth within all three business segments.
Capital equipment revenues decreased by $5.8 million, or 1.0%, to $597.8 million, during fiscal 2015 as compared to fiscal 2014. Growth within the Europe, Middle East, and Africa ("EMEA") and Asia Pacific regions was more than offset by declines within the North American and Latin American regions. Consumable revenues increased $42.1 million, or 10.3%, during fiscal 2015 from fiscal 2014. This increase was driven by growth within the Healthcare and Life Sciences business segments and reflects growth in all regions. Service revenues for fiscal 2015 increased $191.7 million, or 31.4%, over fiscal 2014 primarily driven by the fiscal 2015 acquisition of IMS, other service offerings, and growth of $11.5 million, or 5.9%, within the Isomedix segment in fiscal 2015 over fiscal 2014. Isomedix revenues were favorably impacted by increased demand from our medical device Customers.
United States revenues for fiscal 2015 were $1,449.2 million, an increase of $204.5 million, or 16.4%, over fiscal 2014 revenues of $1,244.7 million. This increase is primarily attributable to the fiscal 2015 acquisition of IMS but also reflects growth in other service revenues in all three business segments, growth in capital equipment revenues within the Life Science business segment and growth in consumable revenues within the Healthcare and Life Science business segments.
International revenues for fiscal 2015 were $401.0 million, an increase of 6.2% over the fiscal 2014 revenues of $377.5 million. This increase reflects revenue growth in the EMEA and Asia Pacific regions, partially offset by declines in Canada and the Latin American region.
Gross Profit. The following table compares our gross profit for the year ended March 31, 2015 to the year ended March 31, 2014:
Years Ended March 31, | Change | Percent Change | ||||||||||||
(dollars in thousands) | 2015 | 2014 | ||||||||||||
Gross profit: | ||||||||||||||
Product | $ | 463,595 | $ | 425,286 | $ | 38,309 | 9.0 | % | ||||||
Service | 310,706 | 224,336 | 86,370 | 38.5 | % | |||||||||
Total gross profit | $ | 774,301 | $ | 649,622 | $ | 124,679 | 19.2 | % | ||||||
Gross profit percentage: | ||||||||||||||
Product | 44.2 | % | 42.0 | % | ||||||||||
Service | 38.7 | % | 36.7 | % | ||||||||||
Total gross profit percentage | 41.8 | % | 40.0 | % | ||||||||||
27
Our gross profit is affected by the volume, pricing and mix of sales of our products and services, as well as the costs associated with the products and services that are sold. Our gross profit increased $124.7 million and gross profit percentage increased 180 basis points to 41.8% for fiscal 2015 as compared to 40.0% for fiscal 2014. Our gross profit percentage was impacted by the positive impact of foreign currency (60 basis points) and favorable product mix and other (160 basis points). Although our recent acquisitions added value in terms of dollars, they negatively impacted our gross margin percentage by approximately 10 basis points. Rising material costs (10 basis points) and inflation (20 basis points) negatively impacted our gross margin percentage.
Operating Expenses. The following table compares our operating expenses for the year ended March 31, 2015 to the year ended March 31, 2014:
Years Ended March 31, | Change | Percent Change | |||||||||||||
(dollars in thousands) | 2015 | 2014 | |||||||||||||
Operating expenses: | |||||||||||||||
Selling, general, and administrative | $ | 493,342 | $ | 380,970 | $ | 112,372 | 29.5 | % | |||||||
Research and development | 54,139 | 48,641 | 5,498 | 11.3 | % | ||||||||||
Restructuring expenses | (391 | ) | 13,204 | (13,595 | ) | NM | |||||||||
Total operating expenses | $ | 547,090 | $ | 442,815 | $ | 104,275 | 23.5 | % | |||||||
NM - Not meaningful
Significant components of total selling, general, and administrative expenses (“SG&A”) are compensation and benefit costs, fees for professional services, travel and entertainment, facilities costs, and other general and administrative expenses. SG&A increased 29.5% during fiscal 2015 over fiscal 2014. This increase is primarily attributable to the addition of operating expenses incurred within our recently acquired businesses and costs of approximately $22.2 million incurred in connection with the proposed Combination of Synergy. For additional information regarding this proposed transaction see note 3 of our consolidated financial statements titled, "Business Acquisitions". Also, during the second quarter of fiscal 2015, SG&A was impacted by the adoption of a new branding strategy as part of the integration of IMS into the Specialty Services reporting unit for surgical instrument and endoscope repair services. This strategy resulted in the reduction in the carrying value of the Spectrum Surgical Instruments Corp. ("Spectrum") trade-name which will be used solely for Specialty Services product revenues going forward. We have estimated the fair value of the Spectrum trade-name using the relief from royalty method and concluded that the carrying value of the trade-name exceeded its fair value. As a result, an impairment charge of approximately $5.6 million was recorded to reduce the carrying value of the intangible asset.
Research and development expenses increased $5.5 million during fiscal 2015, as compared to fiscal 2014. The increase in the fiscal 2015 period is primarily attributable to additional spending in connection with the development of surgical products and accessories. Research and development expenses are influenced by the number and timing of in-process projects and labor hours and other costs associated with these projects. Our research and development initiatives continue to emphasize new product development, product improvements, and the development of new technological platform innovations. During fiscal 2015, our investments in research and development continued to be focused on, but were not limited to, enhancing capabilities of sterile processing combination technologies, surgical products and accessories, and devices and support accessories used in gastrointestinal endoscopy procedures.
Restructuring Expenses. We recognize restructuring expenses as they are incurred. We also evaluate the inventory and property, plant and equipment associated with our restructuring actions for impairment. Asset impairment and accelerated depreciation expenses primarily relate to inventory write-downs for rationalized products and adjustments in the carrying value of the closed facilities to their estimated fair value. In addition, the remaining useful lives of other property, plant and equipment associated with the related operations were re-evaluated based on the respective plan, resulting in the acceleration of depreciation and amortization of certain assets.
Fiscal 2014 Restructuring Plan. During the fourth quarter of fiscal 2014, we adopted and announced a targeted restructuring plan primarily focused on the closure of the Hopkins manufacturing facility located in Mentor, Ohio (the “Fiscal 2014 Restructuring Plan”). As a result of this plan we will transfer operations located at Hopkins to other North American locations. We believe that by closing the operations at Hopkins we will more effectively utilize our existing North American manufacturing network while reducing operating costs. We have incurred pre-tax expenses totaling $19.5 million related to these actions, of which $11.7 million was recorded as restructuring expenses and $7.8 million was recorded in cost of revenues, with restructuring expenses of $17.4 million, $0.8 million, and $1.3 million related to the Healthcare, Life Sciences and Isomedix segments, respectively.
28
Fiscal 2010 Restructuring Plan. During the fourth quarter of fiscal 2010 we adopted a restructuring plan primarily related to the transfer of the remaining operations in our Erie, Pennsylvania facility to the U.S. headquarters in Mentor, Ohio and the consolidation of our European Healthcare manufacturing operations into two central locations within Europe (the “Fiscal 2010 Restructuring Plan”). In addition, we rationalized certain products and eliminated certain positions. Since the inception of the Fiscal 2010 Restructuring Plan, we have incurred pre-tax expenses totaling $9.3 million related to these actions, of which $8.2 million was recorded as restructuring expenses and $1.1 million was recorded in cost of revenues. We do not expect to incur any significant additional restructuring expenses related to this plan. These actions are intended to enhance profitability and improve efficiencies.
For more information regarding our Restructuring activities please refer to note 2 of our consolidated financial statements titled, "Restructuring".
Non-Operating Expenses, Net. Non-operating expense (income), net consists of interest expense on debt, offset by interest earned on cash, cash equivalents, short-term investment balances, and other miscellaneous expense. The following table compares our non-operating expense (income), net for the year ended March 31, 2015 to the year ended March 31, 2014:
Years Ended March 31, | ||||||||||||
(dollars in thousands) | 2015 | 2014 | Change | |||||||||
Non-operating expenses, net: | ||||||||||||
Interest expense | $ | 19,187 | $ | 18,770 | $ | 417 | ||||||
Interest income and miscellaneous expense | (796 | ) | (339 | ) | (457 | ) | ||||||
Non-operating expenses, net | $ | 18,391 | $ | 18,431 | $ | (40 | ) | |||||
Interest expense essentially remained flat in fiscal 2015 over fiscal 2014. Interest income and miscellaneous expense are immaterial.
Additional information regarding our outstanding debt is included in note 7 to our consolidated financial statements titled, “Debt,” and in the subsection of MD&A titled, “Liquidity and Capital Resources.”
Income Tax Expense. The following table compares our income tax expense and effective income tax rates for the years ended March 31, 2015 and March 31, 2014:
Years Ended March 31, | Change | Percent Change | ||||||||||||
(dollars in thousands) | 2015 | 2014 | ||||||||||||
Income tax expense | $ | 73,756 | $ | 58,934 | $ | 14,822 | 25.2% | |||||||
Effective income tax rate | 35.3 | % | 31.3 | % | ||||||||||
The effective income tax rate for fiscal 2015 was 35.3% as compared to 31.3% for fiscal 2014. The effective tax rate in 2014 includes the benefit from the recognition of previously unrecognized tax benefits due to the settlement of a federal tax examination. Additional information regarding our income tax expense is included in note 9 to our consolidated financial statements titled, “Income Taxes.”
Business Segment Results of Operations. We operate in three reportable business segments: Healthcare, Life Sciences, and Isomedix. Corporate and other, which is presented separately, contains the Defense and Industrial business unit plus costs that are associated with being a publicly traded company and certain other corporate costs. These costs include executive office costs, Board of Directors compensation, shareholder services and investor relations, external audit fees, and legacy pension and post-retirement benefit costs. Note 12 to our consolidated financial statements titled “Business Segment Information,” and Item 1, “Business,” provide detailed information regarding each business segment. The following table compares business segment and Corporate and other revenues for the year ended March 31, 2015 to the year ended March 31, 2014:
29
(dollars in thousands) | Years Ended March 31, | Change | Percent Change | ||||||||||||
2015 | 2014 | ||||||||||||||
Revenues: | |||||||||||||||
Healthcare | $ | 1,391,874 | $ | 1,180,051 | $ | 211,823 | 18.0 | % | |||||||
Life Sciences | 250,845 | 246,122 | 4,723 | 1.9 | % | ||||||||||
Isomedix | 205,675 | 194,183 | 11,492 | 5.9 | % | ||||||||||
Total reportable segments | 1,848,394 | 1,620,356 | 228,038 | 14.1 | % | ||||||||||
Corporate and other | 1,869 | 1,896 | (27 | ) | (1.4 | )% | |||||||||
Total Revenues | $ | 1,850,263 | $ | 1,622,252 | $ | 228,011 | 14.1 | % | |||||||
Healthcare segment revenues increased $211.8 million, or 18.0% to $1,391.9 million for the year ended March 31, 2015, as compared to $1,180.1 million for the prior fiscal year. The addition of service revenues from our recent acquisition of IMS combined with growth in other product and service offerings drove total growth in capital equipment, consumable and service revenues of 0.3%, 10.4% and 52.0%, respectively. At March 31, 2015, the Healthcare segment’s backlog amounted to $97.7 million, decreasing $12.7 million, or 11.5%, compared to the backlog of $110.3 million at March 31, 2014. This decrease is partially the result of our success in reducing our manufacturing lead times allowing us to fulfill orders on a timelier basis. In addition, replacement orders represent a larger percentage of our order pattern and pipeline, and those orders tend to be filled quicker and reside in backlog for less time.
Life Science segment revenues increased $4.7 million or 1.9% to $250.8 million for the year ended March 31, 2015, as compared to the prior fiscal year, driven by growth in consumable and service revenues of 10.1% and 5.0%, respectively, which was offset by a 8.4% decline in capital equipment revenues. At March 31, 2015, the Life Sciences segment’s backlog amounted to $45.5 million, decreasing $1.1 million, or 2.4%, compared to the backlog of $44.4 million at March 31, 2014. The March 31, 2015 backlog is consistent with historic levels.
Isomedix segment revenues increased $11.5 million or 5.9% to $205.7 million for the year ended March 31, 2015, as compared to the prior fiscal year. Revenues were favorably impacted by increased demand from our medical device Customers.
The following tables compare our business segment and Corporate and other operating results for the year ended March 31, 2015 to the year ended March 31, 2014:
Years Ended March 31, | Change | Percent Change | |||||||||||||
(dollars in thousands) | 2015 | 2014 | |||||||||||||
Operating income (loss): | |||||||||||||||
Healthcare | $ | 125,505 | $ | 109,714 | $ | 15,791 | 14.4 | % | |||||||
Life Sciences | 55,723 | 50,049 | 5,674 | 11.3 | % | ||||||||||
Isomedix | 55,524 | 55,186 | 338 | 0.6 | % | ||||||||||
Total reportable segments | 236,752 | 214,949 | 21,803 | 10.1 | % | ||||||||||
Corporate and other | (9,541 | ) | (8,142 | ) | (1,399 | ) | 17.2 | % | |||||||
Total operating income (loss) | $ | 227,211 | $ | 206,807 | $ | 20,404 | 9.9 | % | |||||||
Segment operating income is calculated as the segment’s gross profit less direct expenses and indirect cost allocations, which results in the full allocation of all distribution and research and development expenses, and the partial allocation of corporate costs. Corporate cost allocations are based on each segment’s percentage of revenues, headcount, or other variables in relation to those of the total Company. In addition, the Healthcare segment is responsible for the management of all but one manufacturing facility and uses standard cost to sell products to the Life Sciences segment. Corporate and other includes the revenues, gross profit and direct expenses of the Defense and Industrial business unit, as well as certain unallocated corporate costs related to being a publicly traded company and legacy pension and post-retirement benefits, as previously discussed.
The Healthcare segment's operating income increased $15.8 million, or 14.4% to $125.5 million for the year ended March 31, 2015, as compared to $109.7 million for the prior fiscal year. The increase in operating income in fiscal 2015 over fiscal 2014 was driven by our recent acquisition of IMS, increased volume, favorable foreign currency, and favorable product mix. These increases were somewhat offset by the Spectrum trade name impairment, rising material costs and the Medical Device Excise Tax.
The Life Science segment's operating income increased $5.7 million, or 11.3% to $55.7 million for the year ended March 31, 2015, as compared to $50.0 million for the prior fiscal year. The segment's operating margins were 22.2% and
30
20.3%, respectively, for the years ended March 31, 2015 and March 31, 2014. The improvement was primarily attributable to higher revenues, favorable foreign currency and favorable product mix.
The Isomedix segment's operating income increased $0.3 million or 0.6% to $55.5 million for the year ended March 31, 2015, as compared to $55.2 million for the prior fiscal year, reflecting the benefits of increased revenues. The segment's operating margins were 27.0% and 28.4%, respectively, for the years ended March 31, 2015 and March 31, 2014. The operating margin decline is primarily due to higher regulatory costs.
FISCAL 2014 AS COMPARED TO FISCAL 2013
Revenues. The following table compares our revenues, in total and by type and geography, for the year ended March 31, 2014 to the year ended March 31, 2013:
Years Ended March 31, | Percent | |||||||||||||
(dollars in thousands) | 2014 | 2013 | Change | Change | ||||||||||
Total revenues | $ | 1,622,252 | $ | 1,501,902 | $ | 120,350 | 8.0 | % | ||||||
Revenues by type: | ||||||||||||||
Capital equipment revenues | 603,579 | 613,378 | (9,799 | ) | (1.6 | )% | ||||||||
Consumable revenues | 407,883 | 353,984 | 53,899 | 15.2 | % | |||||||||
Service revenues | 610,790 | 534,540 | 76,250 | 14.3 | % | |||||||||
Revenues by geography: | ||||||||||||||
United States revenues | 1,244,730 | 1,141,633 | 103,097 | 9.0 | % | |||||||||
International revenues | 377,522 | 360,269 | 17,253 | 4.8 | % | |||||||||
Revenues increased $120.4 million, or 8.0%, to $1,622.3 million for the year ended March 31, 2014, as compared to $1,501.9 million for the year ended March 31, 2013. Fiscal 2014 revenues increased $142.8 million, or 9.7%, over adjusted revenues for fiscal 2013, which exclude the impact of the $22.4 million SYSTEM 1 Rebate Program adjustments (see subsection of MD&A titled, "Non-GAAP Financial Measures" for additional information and related reconciliation of non-GAAP financial measures to the most comparable GAAP measures). The increase reflects growth in all three business segments.
Capital equipment revenues decreased by $9.8 million, or 1.6%, to $603.6 million, during fiscal 2014 as compared to fiscal 2013. Capital equipment revenues for the fiscal year ended 2013 were favorably impacted by adjustments related to the SYSTEM 1 Rebate Program of $22.4 million (see subsection of MD&A titled, "Non-GAAP Financial Measures" for additional information and related reconciliation of non-GAAP financial measures to the most comparable GAAP measures). Fiscal 2014 capital equipment revenues increased $12.6 million, or 2.1% over fiscal 2013 adjusted capital equipment revenues of $591.0 million (see subsection of MD&A titled, "Non-GAAP Financial Measures" for additional information and related reconciliation of non-GAAP financial measures to the most comparable GAAP measures). This increase was primarily driven by growth in the U.S. and the EMEA region, offset by declines in other international regions. Consumable revenues increased $53.9 million, or 15.2%, during fiscal 2014 from fiscal 2013. This increase was driven by growth within the Healthcare segment due in large part to our recent acquisitions, and growth within the Life Sciences business segment and reflects growth in all regions. Service revenues for fiscal 2014 increased $76.3 million, or 14.3%, over fiscal 2013 primarily driven by the recent acquisitions of the instrument repair businesses, other service offerings, and growth of $14.6 million, or 8.1%, within the Isomedix segment in fiscal 2014 over fiscal 2013. Isomedix revenues were favorably impacted by increased demand from our medical device Customers and the filling of recently added capacity.
United States revenues for fiscal 2014 were $1,244.7 million, an increase of $103.1 million, or 9.0%, over fiscal 2013 revenues of $1,141.6 million. The fiscal 2013 period was favorably impacted by the SYSTEM 1 Rebate Program adjustments of $22.4 million. United States revenues for fiscal 2014 increased $125.5 million, or 11.2%, over the adjusted United States revenues for fiscal 2013 of $1,119.3 million (see subsection of MD&A titled, "Non-GAAP Financial Measures" for additional information and related reconciliation of non-GAAP financial measures to the most comparable GAAP measures). The increase is driven by higher consumable and service revenues attributable, in part, to our recent acquisitions but also attributable to increased revenues from other products. These results reflect growth in all three business segments.
31
International revenues for fiscal 2014 were $377.5 million, an increase of 4.8% over the fiscal 2013 revenues of $360.3 million. This increase reflects revenue growth in the Latin American and EMEA regions, partially offset by declines in Canada and the Asia Pacific regions.
Gross Profit. The following table compares our gross profit for the year ended March 31, 2014 to the year ended March 31, 2013:
Years Ended March 31, | Change | Percent Change | ||||||||||||
(dollars in thousands) | 2014 | 2013 | ||||||||||||
Gross profit: | ||||||||||||||
Product | $ | 425,286 | $ | 416,463 | $ | 8,823 | 2.1 | % | ||||||
Service | 224,336 | 204,800 | 19,536 | 9.5 | % | |||||||||
Total gross profit | $ | 649,622 | $ | 621,263 | $ | 28,359 | 4.6 | % | ||||||
Gross profit percentage: | ||||||||||||||
Product | 42.0 | % | 43.1 | % | ||||||||||
Service | 36.7 | % | 38.3 | % | ||||||||||
Total gross profit percentage | 40.0 | % | 41.4 | % | ||||||||||
Our gross profit is affected by the volume, pricing and mix of sales of our products and services, as well as the costs associated with the products and services that are sold. Our gross profit increased $28.4 million and gross profit percentage decreased to 40.0% for fiscal 2014 as compared to 41.4% for fiscal 2013. Our gross profit increased $52.0 million, or 8.7% over our adjusted fiscal 2013 gross margin, which excludes the $23.6 million impact of the SYSTEM 1 Rebate Program (see subsection of MD&A titled "Non-GAAP Financial Measures" for additional information and related reconciliation of non-GAAP financial measures to the most comparable GAAP measures). Other key factors impacting gross margin and the gross margin percentage for fiscal 2014 include the negative impact of restructuring (50 basis points), inflation (80 basis points), and the Medical Device Excise Tax (40 basis points), and the positive impact of the following: pricing (40 basis points), volume (40 basis points) and our recent acquisitions.
Operating Expenses. The following table compares our operating expenses for the year ended March 31, 2014 to the year ended March 31, 2013:
Years Ended March 31, | Change | Percent Change | |||||||||||||
(dollars in thousands) | 2014 | 2013 | |||||||||||||
Operating expenses: | |||||||||||||||
Selling, general, and administrative | $ | 380,970 | $ | 337,694 | $ | 43,276 | 12.8 | % | |||||||
Research and development | 48,641 | 41,305 | 7,336 | 17.8 | % | ||||||||||
Restructuring expenses | 13,204 | (565 | ) | 13,769 | NM | ||||||||||
Total operating expenses | $ | 442,815 | $ | 378,434 | $ | 64,381 | 17.0 | % | |||||||
NM - Not meaningful
Significant components of total selling, general, and administrative expenses (“SG&A”) are compensation and benefit costs, fees for professional services, travel and entertainment, facilities costs, and other general and administrative expenses. SG&A increased 12.8% during fiscal 2014 over fiscal 2013. During fiscal 2013, we adjusted the liability related to the SYSTEM 1 class action settlement. The pre-tax adjustment of $16.8 million was recorded as a reduction to operating expenses. Adjusted SG&A expenses, excluding the impact of the SYSTEM 1 class action settlement for fiscal 2013 were $354.5 million (see subsection of MD&A titled, "Non-GAAP Financial Measures" for additional information and related reconciliation of non-GAAP financial measures to the most comparable GAAP measures). The impact of the class action settlement aside, the increase in SG&A in fiscal 2014 over fiscal 2013 is primarily attributable to the addition of operating expenses incurred with our acquired businesses. In addition, we recorded a fair value adjustment of $1.0 million related to a deferred payment of purchase price for the 2012 purchase of Sercon Industria E Comercio De Aparelhos Medicos Hospitalares LTDA (“Sercon”).
Research and development expenses increased $7.3 million during fiscal 2014, as compared to fiscal 2013. The majority of the increase is attributable to expenses for research and development incurred within the operations of the businesses acquired in fiscal 2013 and fiscal 2014. Research and development expenses are influenced by the number and timing of in-process projects and labor hours and other costs associated with these projects. During fiscal 2014, our investments in research and
32
development continued to be focused on, but were not limited to, enhancing capabilities of sterile processing combination technologies, surgical products and accessories, and devices and support accessories used in gastrointestinal endoscopy procedures.
Restructuring Expenses. We recognize restructuring expenses as they are incurred. We also evaluate the inventory and property, plant and equipment associated with our restructuring actions for impairment. Asset impairment and accelerated depreciation expenses primarily relate to inventory write-downs for rationalized products and adjustments in the carrying value of the closed facilities to their estimated fair value. In addition, the remaining useful lives of other property, plant and equipment associated with the related operations were re-evaluated based on the respective plan, resulting in the acceleration of depreciation and amortization of certain assets.
Fiscal 2014 Restructuring Plan. During the fourth quarter of fiscal 2014, we adopted and announced a targeted restructuring plan primarily focused on the closure of the Hopkins manufacturing facility located in Mentor, Ohio (the “Fiscal 2014 Restructuring Plan”). As a result of this plan we will transfer operations located at Hopkins to other North American locations. We believe that by closing the operations at Hopkins we will more effectively utilize our existing North American manufacturing network while reducing operating costs. The plan also includes the rationalization of certain products and the elimination of certain positions across our operations impacting approximately 150 employees. These actions resulted in the impairment of related assets and inventory and severance and outplacement costs. We have incurred pre-tax expenses totaling $20.2 million related to these actions, of which $12.1 million was recorded as restructuring expenses and $8.1 million was recorded in cost of revenues, with restructuring expenses of $18.2 million, $0.6 million, and $1.4 million related to the Healthcare, Life Sciences and Isomedix segments, respectively. We do not expect to incur any significant additional restructuring expenses related to this plan. These actions are intended to enhance profitability and improve efficiencies.
Fiscal 2010 Restructuring Plan. During the fourth quarter of fiscal 2010 we adopted a restructuring plan primarily related to the transfer of the remaining operations in our Erie, Pennsylvania facility to the U.S. headquarters in Mentor, Ohio and the consolidation of our European Healthcare manufacturing operations into two central locations within Europe (the “Fiscal 2010 Restructuring Plan”). In addition, we rationalized certain products and eliminated certain positions.Since the inception of the Fiscal 2010 Restructuring Plan, we have incurred pre-tax expenses totaling $9.3 million related to these actions, of which $8.2 million was recorded as restructuring expenses and $1.1 million was recorded in cost of revenues. We do not expect to incur any significant additional restructuring expenses related to this plan. These actions are intended to enhance profitability and improve efficiencies.
For more information regarding our restructuring activities please refer to note 2 titled, "Restructuring".
Non-Operating Expenses, Net. Non-operating expense (income), net consists of interest expense on debt, offset by interest earned on cash, cash equivalents, short-term investment balances, and other miscellaneous expense. The following table compares our non-operating expense (income), net for the year ended March 31, 2014 to the year ended March 31, 2013:
Years Ended March 31, | ||||||||||||
(dollars in thousands) | 2014 | 2013 | Change | |||||||||
Non-operating expenses, net: | ||||||||||||
Interest expense | $ | 18,770 | $ | 15,675 | $ | 3,095 | ||||||
Interest income and miscellaneous expense | (339 | ) | 56 | (395 | ) | |||||||
Non-operating expenses, net | $ | 18,431 | $ | 15,731 | $ | 2,700 | ||||||
Interest expense during fiscal 2014 increased due to higher outstanding borrowings due to acquisitions. Interest income and miscellaneous expense are immaterial.
Additional information regarding our outstanding debt is included in note 7 to our consolidated financial statements titled, “Debt,” and in the subsection of MD&A titled, “Liquidity and Capital Resources.”
Income Tax Expense. The following table compares our income tax expense and effective income tax rates for the years ended March 31, 2014 and March 31, 2013:
Years Ended March 31, | Change | Percent Change | ||||||||||||
(dollars in thousands) | 2014 | 2013 | ||||||||||||
Income tax expense | $ | 58,934 | $ | 67,121 | $ | (8,187 | ) | (12.2)% | ||||||
Effective income tax rate | 31.3 | % | 29.6 | % | ||||||||||
33
The effective income tax rate for fiscal 2014 was 31.3% as compared to 29.6% for fiscal 2013. The effective tax rate in fiscal 2013 was impacted by a U.S. tax benefit resulting from European restructuring. Specifically, a U.S. tax deduction was taken relating to the rationalization of operations in Switzerland. The effective tax rate in 2014 includes the benefit from the recognition of previously unrecognized tax benefits due to the settlement of a federal tax examination. Additional information regarding our income tax expense is included in note 9 to our consolidated financial statements titled, “Income Taxes.”
Business Segment Results of Operations. We operate in three reportable business segments: Healthcare, Life Sciences, and Isomedix. Corporate and other, which is presented separately, contains the Defense and Industrial business unit plus costs that are associated with being a publicly traded company and certain other corporate costs. These costs include executive office costs, Board of Directors compensation, shareholder services and investor relations, external audit fees, and legacy pension and post-retirement benefit costs. Note 12 to our consolidated financial statements titled “Business Segment Information,” and Item 1, “Business,” provide detailed information regarding each business segment. The following table compares business segment and Corporate and other revenues for the year ended March 31, 2014 to the year ended March 31, 2013:
(dollars in thousands) | Years Ended March 31, | Change | Percent Change | ||||||||||||
2014 | 2013 | ||||||||||||||
Revenues: | |||||||||||||||
Healthcare | $ | 1,180,051 | $ | 1,074,790 | $ | 105,261 | 9.8 | % | |||||||
Life Sciences | 246,122 | 244,421 | 1,701 | 0.7 | % | ||||||||||
Isomedix | 194,183 | 179,550 | 14,633 | 8.1 | % | ||||||||||
Total reportable segments | 1,620,356 | 1,498,761 | 121,595 | 8.1 | % | ||||||||||
Corporate and other | 1,896 | 3,141 | (1,245 | ) | (39.6 | )% | |||||||||
Total Revenues | $ | 1,622,252 | $ | 1,501,902 | $ | 120,350 | 8.0 | % | |||||||
Healthcare segment revenues increased $105.3 million, or 9.8% to $1,180.1 million for the year ended March 31, 2014, as compared to $1,074.8 million for the prior fiscal year. Healthcare revenues for fiscal 2014 increased $127.7 million, or 12.1%, compared to adjusted Healthcare revenues for fiscal 2013, which exclude the impact of the $22.4 million adjustment related to the SYSTEM 1 Rebate Program (see subsection of MD&A titled, "Non-GAAP Financial Measures" for additional information and related reconciliation of non-GAAP financial measures to the most comparable GAAP measures). The addition of consumable and service revenues from our recent acquisitions combined with growth in other product and service offerings drove total growth in capital equipment, consumable and service revenues of 3.2%, 17.1% and 23.3%, respectively. At March 31, 2014, the Healthcare segment’s backlog amounted to $110.3 million, increasing $5.1 million, or 4.9%, compared to the backlog of $105.2 million at March 31, 2013.
Life Science segment revenues increased $1.7 million or 0.7% to $246.1 million for the year ended March 31, 2014, as compared to the prior fiscal year, driven by growth in consumable revenues of 8.4%, which was offset by declines in capital equipment and service revenues of 3.7% and 1.7%, respectively. At March 31, 2014, the Life Sciences segment’s backlog amounted to $44.4 million, decreasing $4.0 million, or 8.3%, compared to the backlog of $48.4 million at March 31, 2013. The March 31, 2014 backlog is consistent with historic levels.
Isomedix segment revenues increased $14.6 million or 8.1% to $194.2 million for the year ended March 31, 2014, as compared to the prior fiscal year. Revenues were favorably impacted by increased demand from our medical device Customers and positive churn.
The following tables compare our business segment and Corporate and other operating results for the year ended March 31, 2014 to the year ended March 31, 2013:
Years Ended March 31, | Change | Percent Change | |||||||||||||
(dollars in thousands) | 2014 | 2013 | |||||||||||||
Operating income (loss): | |||||||||||||||
Healthcare | $ | 109,714 | $ | 153,343 | $ | (43,629 | ) | (28.5 | )% | ||||||
Life Sciences | 50,049 | 47,453 | 2,596 | 5.5 | % | ||||||||||
Isomedix | 55,186 | 51,455 | 3,731 | 7.3 | % | ||||||||||
Total reportable segments | 214,949 | 252,251 | (37,302 | ) | (14.8 | )% | |||||||||
Corporate and other | (8,142 | ) | (9,422 | ) | 1,280 | (13.6 | )% | ||||||||
Total operating income (loss) | $ | 206,807 | $ | 242,829 | $ | (36,022 | ) | (14.8 | )% | ||||||
34
Segment operating income is calculated as the segment’s gross profit less direct expenses and indirect cost allocations, which results in the full allocation of all distribution and research and development expenses, and the partial allocation of corporate costs. Corporate cost allocations are based on each segment’s percentage of revenues, headcount, or other variables in relation to those of the total Company. In addition, the Healthcare segment is responsible for the management of all but one manufacturing facility and uses standard cost to sell products to the Life Sciences segment. Corporate and other includes the revenues, gross profit and direct expenses of the Defense and Industrial business unit, as well as certain unallocated corporate costs related to being a publicly traded company and legacy pension and post-retirement benefits, as previously discussed.
The Healthcare segment's operating income decreased $43.6 million, or 28.5% to $109.7 million for the year ended March 31, 2014, as compared to $153.3 million for the prior fiscal year. The Healthcare segment’s operating income for fiscal 2014 decreased $3.2 million, or 2.8%, compared to adjusted fiscal 2013 Healthcare operating income of $112.9 million, which excludes the $40.4 million impact of the adjustment related to the SYSTEM 1 Rebate Program and class action settlement (see subsection of MD&A titled, "Non-GAAP Financial Measures" for additional information and related reconciliation of non-GAAP financial measures to the most comparable GAAP measures). The decline in adjusted Healthcare operating income reflects the negative impact of the Fiscal 2014 Restructuring Plan, the Medical Device Excise Tax and investments in in-sourcing. Healthcare operating income was favorably impacted by increased revenues driven largely by our recent acquisitions and a reduction in warranty costs.
The Life Science segment's operating income increased $2.6 million, or 5.5% to $50.0 million for the year ended March 31, 2014, as compared to $47.5 million for the prior fiscal year. The segment's operating margins were 20.3% and 19.4%, respectively, for the years ended March 31, 2014 and March 31, 2013. The improvement was primarily attributable to higher revenues and favorable product mix.
The Isomedix segment's operating income increased $3.7 million or 7.3% to $55.2 million for the year ended March 31, 2014, as compared to $51.5 million for the prior fiscal year, reflecting the benefits of increased revenues. The segment's operating margins were 28.4% and 28.7%, respectively, for the years ended March 31, 2014 and March 31, 2013.
35
LIQUIDITY AND CAPITAL RESOURCES
The following table summarizes significant components of our cash flows for the years ended March 31, 2015, 2014 and 2013:
Years Ended March 31, | ||||||||||||
(dollars in thousands) | 2015 | 2014 | 2013 | |||||||||
Net cash provided by operating activities | $ | 246,040 | $ | 209,631 | $ | 227,815 | ||||||
Net cash used in investing activities | $ | (283,769 | ) | $ | (148,652 | ) | $ | (487,054 | ) | |||
Net cash provided by (used in) in financing activities | $ | 69,750 | $ | (54,206 | ) | $ | 254,246 | |||||
Debt-to-total capital ratio | 36.8 | % | 32.2 | % | 34.3 | % | ||||||
Free cash flow | $ | 161,614 | $ | 128,038 | $ | 140,437 | ||||||
Net Cash Provided By Operating Activities –The net cash provided by our operating activities was $246.0 million for the year ended March 31, 2015 compared to $209.6 million for the year ended March 31, 2014 and $227.8 million for the year ended March 31, 2013. The following discussion summarizes the significant changes in our operating cash flows for the years ended March 31, 2015, 2014 and 2013:
• | Net cash provided by operating activities increased 17.4% in fiscal 2015 compared to fiscal 2014. The increase in net cash provided by operating activities in fiscal 2015 is primarily due to increased net income and working capital improvements. |
• | Net cash provided by operating activities decreased 8.0% in fiscal 2014 compared to fiscal 2013. The decrease is primarily attributable to payments made in connection with our annual incentive compensation program which did not occur in fiscal 2013. In addition, the fiscal 2013 period reflected strong improvements in working capital management. |
Net Cash Used In Investing Activities – The net cash used in our investing activities was $283.8 million for the year ended March 31, 2015, compared to $148.7 million for the year ended March 31, 2014 and $487.1 million for the year ended March 31, 2013. The following discussion summarizes the significant changes in our investing cash flows for the years ended March 31, 2015, 2014 and 2013:
• | Purchases of property, plant, equipment, and intangibles, net – Capital expenditures totaled $85.3 million during fiscal 2015, $86.4 million during fiscal 2014 and $87.4 million during fiscal 2013. |
• | Proceeds from the sale of property, plant, equipment, and intangibles – During the third quarter of fiscal 2014 we sold our former Pieterlen, Switzerland manufacturing facility in conjunction with our 2010 Restructuring Plan. Total proceeds and net loss on the sale were $4.7 million and $0.8 million, respectively. Proceeds from fiscal 2015 and 2013 proceeds relate to minor disposals. |
• | Purchases of investments– During the third quarter of fiscal 2015, we invested $4.7 million in common stock of Servizi Italia, S.p.A., a leading provider of integrated linen washing and outsourced sterile processing services to hospital Customers. |
• | Investments in business, net of cash acquired – During fiscal 2015, we used $173.6 million of cash for the acquisition of IMS and related real estate. We also used $3.4 million of cash for the acquisition of the assets of AGAPE and $11.9 million for the acquisition of Dana. For more information on acquisitions refer to note 3 to our consolidated financial statements titled, "Business Acquisitions". During the first quarter of fiscal 2015, we also paid a working capital settlement of $0.8 million and deferred consideration of $5.0 million for the acquisition of Eschmann Holdings Ltd ("Eschmann") which occurred in fiscal 2014. During fiscal 2014, we used $64.4 million of cash for the acquisitions of the assets of Florida Surgical Repair, Inc. ("FSR") and Life Systems, Inc. ("LSI"), and the capital stock of Eschmann. For more information on these acquisitions refer to note 3 to our consolidated financial statements titled, "Business Acquisitions". During fiscal 2014, we also used $3.2 million in cash for a deferred purchase price payment related to the fiscal 2012 acquisition of the stock of a privately held company with operations located near Sao Paulo, Brazil which designs and manufactures small, medium, and large sterilizers used by public hospitals, clinics, dental offices and industrial companies (e.g., research laboratories and pharmaceutical research and production companies). During fiscal 2013, we used $399.7 million of cash for the acquisitions of the capital stock of United States Endoscopy Group Inc., and Spectrum Surgical Instruments Corp, the assets of Total Repair Express ("TRE"), and the remaining VTS Medical Systems, LLC interests not already owned by us. |
36
Net Cash Provided By (Used In) Financing Activities – Net cash provided by financing activities was $69.8 million for the year ended March 31, 2015, compared to net cash used by financing activities of $54.2 million, and net cash provided by financing activities of $254.2 million for the years ended March 31, 2014 and March 31, 2013, respectively. The following discussion summarizes the significant changes in our financing cash flows for the years ended March 31, 2015, 2014 and 2013:
• | Proceeds from the issuance of long-term obligations – During fiscal year 2013 we issued $200 million of senior notes in a private placement, which are long-term obligations. We provide additional information about our debt structure in note 7 to our consolidated financial statements titled, “Debt,” and in this section of the MD&A titled, “Liquidity and Capital Resources” in the subsection titled, “Sources of Credit.” |
• | Payments on long term obligations- During the second quarter of fiscal 2014 we repaid $30.0 million for the senior notes issued in August 2008, which matured in August 2013. During the third quarter of fiscal 2014 we repaid $40.0 million for the senior notes issued in December 2003, which matured in December 2013. |
• | Proceeds under credit facilities, net – At the end of fiscal 2015, $283.3 million of debt was outstanding under our credit facilities. |
• | Repurchases of common shares – During fiscal 2015, we obtained common shares in connection with our stock-based compensation award programs in the amount $30.7 million. During fiscal 2014, we paid for the repurchase of 565,887 common shares at an average purchase price of $43.63 and obtained common shares in connection with our stock-based compensation award programs in the amount of $0.8 million. During fiscal 2013, we paid for the repurchase of 204,349 common shares at an average purchase price of $33.42 and obtained common shares in connection with our stock-based compensation award programs in the amount of $1.2 million. We provide additional information about our common share repurchases in note 14 to our consolidated financial statements titled, “Repurchases of Common Shares.” |
• | Deferred financing fees and debt issuance costs- During fiscal 2015, we paid $14.4 million in financing fees and debt issuance costs related to our Credit Agreement and Bridge Credit Agreement and Private Placement debt. For more information on this agreement refer to note 7 to our consolidated financial statements titled, "Debt". |
• | Cash dividends paid to common shareholders – During fiscal 2015, we paid cash dividends totaling $53.5 million or $0.90 per outstanding common share. During fiscal 2014, we paid cash dividends totaling $48.4 million or $0.82 per outstanding common share. During fiscal 2013, we paid cash dividends totaling $43.2 million, or $0.74 per outstanding common share. |
• | Stock option and other equity transactions, net – We receive cash for issuing common shares under our various employee stock option programs. During fiscal 2015, fiscal 2014 and fiscal 2013, we received cash proceeds totaling $28.3 million $14.2 million, and $23.0 million, respectively, under these programs. In fiscal 2014, we also issued $1.5 million of STERIS restricted stock in conjunction with the LSI acquisition. |
• | Excess tax benefit from share-based compensation – For the years ended March 31, 2015, 2014 and 2013, our income taxes were reduced by $11.5 million, $2.8 million, and $2.1 million, respectively, as a result of excess deductions allowed for stock options exercised. The increase in fiscal 2015 was primarily due to an increase in both the quantity and value of restricted shares vesting and stock options exercised. |
Cash Flow Measures. Free cash flow was $161.6 million in fiscal 2015 compared to $128.0 million in fiscal 2014. Our free cash flow increased in fiscal 2015 primarily due to working capital improvements (see subsection of MD&A titled, "Non-GAAP Financial Measures", for additional information and related reconciliation of non-GAAP financial measures to the most comparable GAAP measures). Our debt-to-total capital ratio was 36.8% at March 31, 2015 and 32.2% at March 31, 2014.
Cash Requirements. We intend to use our existing cash and cash equivalent balances and cash generated from operations for short-term and long-term capital expenditures and our other liquidity needs. In addition, in light of cash needs relating to our proposed Combination with Synergy (see "Proposed Combination with Synergy Health plc" under "General Overview and Executive Summary"), and other cash requirements, it was necessary to replace our existing bank credit facilities with an expanded bank credit facility providing for additional credit availability and to obtain additional debt. Our capital requirements depend on many uncertain factors, including our rate of sales growth, our Customers’ acceptance of our products and services, the costs of obtaining adequate manufacturing capacities, the timing and extent of our research and development projects, changes in our operating expenses and other factors. To the extent that existing and anticipated sources of cash are not sufficient to fund our future activities, we may need to raise additional funds through additional borrowings or the sale of equity securities. We have a bridge facility available to us should the referenced Combination close without or with insufficient permanent financing in place. There can be no assurance that the foregoing financing arrangements will provide us with sufficient additional funds or that we will be able to obtain any additional funds we may need on terms favorable to us or at all.
37
At March 31, 2015, approximately 94% of our consolidated cash and cash equivalents were held in locations outside of the United States. These funds are considered indefinitely reinvested to be used to expand operations either organically or through acquisitions outside the United States. We do not intend to repatriate any significant amounts of cash in the foreseeable future.
Sources of Credit. Our sources of credit as of March 31, 2015 are summarized in the following table:
(dollars in thousands) | Maximum Amounts Available | Reductions in Available Credit Facility for Other Financial Instruments | March 31, 2015 Amounts Outstanding | March 31, 2015 Amounts Available | |||||||||||
Sources of Credit | |||||||||||||||
Private placement | $ | 340,000 | $ | — | 340,000 | — | |||||||||
Credit Agreement (1) | 500,000 | — | 283,250 | 216,750 | |||||||||||
Bridge Agreement (2) | 1,033,331 | — | — | 1,033,331 | |||||||||||
Total Sources of Credit | $ | 1,873,331 | $ | — | $ | 623,250 | $ | 1,250,081 | |||||||
(1) | Our $500.0 million revolving credit facility contains a sub-limit that reduces the maximum amount available to us for borrowings by letters of credit outstanding. |
(2) | The Bridge Agreement contains a USD commitment of $530.0 million and a GBP commitment of £340.0 million (approximately $503.3 million USD equivalent at March 31, 2015). No funds are available under the Bridge Credit Agreement unless the Combination (see "Proposed Combination with Synergy Health plc" under "General Overview and Executive Summary"), occurs and in that event there are limitations on the use and timing of borrowings. |
Our sources of funding from credit as of March 31, 2015 are summarized below:
• | In December 2003, we issued $100.0 million of senior notes, of which $20.0 million currently remain outstanding, in a private placement to certain institutional investors in an offering that was exempt from the registration requirements of the Securities Act of 1933. The remaining $20.0 million have a maturity of 12 years from issuance at an annual interest rate of 5.38%. The agreements governing these notes and the notes were amended and restated in their entirety on March 31, 2015. The amended and restated agreements, which have been consolidated into a single agreement, contain leverage and interest coverage covenants. |
• | On August 15, 2008, we issued $150.0 million of senior notes, of which $120.0 million currently remain outstanding, in a private placement to certain institutional investors in an offering that was exempt from the registration requirements of the Securities Act of 1933. Of the outstanding notes $85.0 million have a maturity of 10 years from issuance at an annual interest rate of 6.33%, and the remaining $35.0 million have a maturity of 12 years from issuance at an annual interest rate of 6.43%. The agreements governing these notes and the notes were amended and restated in their entirety on March 31, 2015. The amended and restated agreements, which have been consolidated into a single agreement, contain leverage and interest coverage covenants. |
• | In December 2012, we issued $100.0 million of senior notes in a private placement to certain institutional investors in an offering that was exempt from the registration requirements of the Securities Act of 1933. Of the $100.0 million of notes, $47.5 million have a maturity of 10 years from issuance at an annual interest rate of 3.20%, an additional $40.0 million have a maturity of 12 years from issuance at an annual interest rate of 3.35%, and the remaining $12.5 million have a maturity of 15 years from issuance at an annual interest rate of 3.55%. The agreements governing these notes and the notes were amended and restated in their entirety on March 31, 2015. The amended and restated agreements, which have been consolidated into a single agreement, contain leverage and interest coverage covenants. |
• | In February 2013, we issued $100.0 million of senior notes in a private placement to certain institutional investors in an offering that was exempt from the registration requirements of the Securities Act of 1933. Of the $100.0 million of notes, $47.5 million have a maturity of nine years and 10 months from issuance at an annual interest rate of 3.20%, an additional $40.0 million have a maturity of 11 years and 10 months from issuance at an annual interest rate of 3.35%, and the remaining $12.5 million have a maturity of 14 years and 10 months from issuance at an annual interest rate of 3.55%. The agreements governing these notes and the notes were amended and restated in their entirety on March 31, 2015. The amended and restated agreements, which have been consolidated into a single agreement, contain leverage and interest coverage covenants. |
38
• | On March 31, 2015 we entered into a Credit Agreement (the "Credit Agreement") with various financial institutions as lenders, and JPMorgan Chase Bank, N.A., as Administrative Agent. The Credit Agreement replaced the Company’s Third Amended and Restated Credit Agreement dated April 13, 2012 with KeyBank National Association, as Administrative Agent, and the other lenders party thereto, as amended, and the Company’s Swing Line Facility (Committed Line of Credit) with PNC Bank, National Association, which agreements were terminated and all outstanding borrowings thereunder were repaid on March 31, 2015. The Credit Agreement provides $1,250 million of credit, in the form of a $850.0 million revolver facility, which may be utilized for revolving credit borrowings, swing line borrowings and letters of credit, with sublimits for swing line borrowings and letters of credit. The Credit Agreement also contains a $400.0 million term loan facility. The revolver and term loan facilities may be increased in specified circumstances by up to $500.0 million. The term loan facility may not be utilized unless, among other conditions, the Combination is consummated, and will terminate if not used at that time. Likewise only $500.0 million of the revolver may be utilized unless and until the Combination is consummated. For more information on the Combination see "Proposed Combination with Synergy Health plc" under "General Overview and Executive Summary" and note 3 to our consolidated financial statements titled, "Business Acquisitions". Term loans are repayable quarterly pursuant to a specified amortization schedule, with principal payments increasing from 1.25% to 2.50% over the term, and with a balloon payment for the remaining unpaid balance at maturity. The Credit Agreement will mature on March 31, 2020, and all unpaid borrowings, together with accrued and unpaid interest thereon, are repayable on that date. The Credit Agreement contains leverage and interest coverage covenants. |
• | On March 31, 2015, the Bridge Credit Agreement we had obtained on October 13, 2014 with various financial institutions as lenders and Bank of America N.A. as Administrative Agent, was amended and restated in its entirety (as so amended and restated, the “Amended Bridge Credit Agreement”). Under the Amended Bridge Credit Agreement, the lenders have agreed to provide senior unsecured debt financing, to consist of up to £340.0 million of commitments, and up to $1,050 million of commitments. Proceeds of borrowings under the Amended Bridge Credit Agreement may be used to (i) finance the payment of the cash consideration for the Combination, and related fees and expenses and (ii) to pay or refinance our existing debt and Synergy debt. Per the terms of the Amended Bridge Credit Agreement and as a result of the execution of the Credit Agreement and of the effectiveness of the amendment of certain of our private placement notes and note purchase agreements, the Commitments of the lenders under the Amended Bridge Credit Agreement were reduced by an aggregate of $520.0 million on March 31, 2015. This resulted in an outstanding USD commitment of $530.0 million and a GBP commitment of £340.0 million under the Amended Bridge Credit Agreement. The foregoing reduction treatment also would have applied under the Bridge Credit Agreement. The Amended Bridge Credit Agreement will mature on the 364th day after the Combination closing, and all unpaid borrowings, together with accrued and unpaid interest thereon, are repayable on that date. The Amended Bridge Credit Agreement contains leverage and interest coverage covenants. For more information on the Combination see "Proposed Combination with Synergy Health plc" under "General Overview and Executive Summary" and note 3 to our consolidated financial statements titled, "Business Acquisitions". |
At March 31, 2015, we had $216.8 million of funding available under the Credit Agreement. The Credit Agreement includes a sub-limit that reduces the maximum amount available to us by letters of credit outstanding. At March 31, 2015, there were no letters of credit outstanding under the Credit Agreement.
At March 31, 2015, we were in compliance with all financial covenants associated with our indebtedness. We provide additional information regarding our debt structure and payment obligations in the section of the MD&A titled, “Liquidity and Capital Resources” in the subsection titled, “Contractual and Commercial Commitments” and in note 7 to our consolidated financial statements titled, “Debt.”
CAPITAL EXPENDITURES
Our capital expenditure program is a component of our long-term strategy. This program includes, among other things, investments in new and existing facilities, business expansion projects, radioisotope (cobalt-60) and information technology enhancements and research and development advances. During fiscal 2015, our capital expenditures amounted to $85.3 million. We use cash provided by operating activities and our cash and cash equivalent balances to fund capital expenditures. We expect fiscal 2016 capital expenditures to increase by approximately $20.0 million as compared to fiscal 2015 levels, with continued investment in projects intended to improve quality, provide expansion, reduce operating costs and add value to the current product offering.
CONTRACTUAL AND COMMERICAL COMMITMENTS
At March 31, 2015, we had commitments under non-cancelable operating leases totaling $47.7 million.
39
Our contractual obligations and commercial commitments as of March 31, 2015 are presented in the following tables. Commercial commitments include standby letters of credit, letters of credit required as security under our self-insured risk retention policies, and other potential cash outflows resulting from events that require us to fulfill commitments.
Payments due by March 31, | |||||||||||||||||||||||
(in thousands) | 2016 | 2017 | 2018 | 2019 | 2020 and thereafter | Total | |||||||||||||||||
Contractual Obligations: | |||||||||||||||||||||||
Debt | $ | 20,000 | $ | — | $ | — | $ | 85,000 | $ | 518,250 | $ | 623,250 | |||||||||||
Operating leases | 16,411 | 12,428 | 9,149 | 5,419 | 4,273 | 47,680 | |||||||||||||||||
Purchase obligations | 12,557 | 12,935 | 9,913 | — | — | 35,405 | |||||||||||||||||
Benefit payments under defined benefit plans | 56,612 | — | — | — | — | 56,612 | |||||||||||||||||
Trust assets available for benefit payments under defined benefit plans | (56,612 | ) | — | — | — | — | (56,612 | ) | |||||||||||||||
Benefit payments under other post-retirement welfare benefit plans | 2,790 | 2,457 | 2,206 | 1,915 | 8,444 | 17,812 | |||||||||||||||||
Other obligations | 170 | 167 | — | — | — | 337 | |||||||||||||||||
Total Contractual Obligations | $ | 51,928 | $ | 27,987 | $ | 21,268 | $ | 92,334 | $ | 530,967 | $ | 724,484 | |||||||||||
The table above includes only the principal amounts of our contractual obligations. We provide information about the interest component of our long-term debt in the subsection of MD&A titled, “Liquidity and Capital Resources,” and in note 7 to our consolidated financial statements titled, “Debt.”
Purchase obligations shown in the table above relate to minimum purchase commitments with suppliers for materials purchases.
The table above excludes contributions we make to our defined contribution plan. Our future contributions to this plan depend on uncertain factors, such as the amount and timing of employee contributions and discretionary employer contributions. The table above reflects the use of all assets of the defined benefit pension plan to fully settle the plan obligation as anticipated by the plan termination actions initiated during fiscal 2015. We provide additional information about our defined benefit pension plan, defined contribution plan, and other post-retirement medical benefit plan in note 10 to our consolidated financial statements titled, “Benefit Plans.”
Amount of Commitment Expiring March 31, | |||||||||||||||||||||||
(in thousands) | 2016 | 2017 | 2018 | 2019 | 2020 and thereafter | Totals | |||||||||||||||||
Commercial Commitments: | |||||||||||||||||||||||
Performance and surety bonds | $ | 30,487 | $ | 2,586 | $ | 28 | $ | 186 | $ | 760 | $ | 34,047 | |||||||||||
Letters of credit as security for self-insured risk retention policies | 5,961 | — | — | — | — | 5,961 | |||||||||||||||||
Total Commercial Commitments | $ | 36,448 | $ | 2,586 | $ | 28 | $ | 186 | $ | 760 | $ | 40,008 | |||||||||||
CRITICAL ACCOUNTING POLICIES, ESTIMATES, AND ASSUMPTIONS
The following subsections describe our most critical accounting policies, estimates, and assumptions. Our accounting policies are more fully described in note 1 to our consolidated financial statements titled, “Nature of Operations and Summary of Significant Accounting Policies.”
Estimates and Assumptions. Our discussion and analysis of financial condition and results of operations is based on our consolidated financial statements that were prepared in accordance with United States generally accepted accounting principles. We make certain estimates and assumptions that we believe to be reasonable when preparing these financial statements. These estimates and assumptions involve judgments with respect to numerous factors that are difficult to predict and are beyond management’s control. As a result, actual amounts could be materially different from these estimates. We periodically review these critical accounting policies, estimates, assumptions, and the related disclosures with the Audit Committee of the Company’s Board of Directors.
Revenue Recognition. We recognize revenue for products when ownership passes to the Customer, which is based on contract or shipping terms and for services when the service is provided to the Customer. Our Customers include end users as well as
40
dealers and distributors who market and sell our products. Our revenue is not contingent upon resale by the dealer or distributor. We have no further obligations related to bringing about resale, and our standard return and restocking fee policies are applied.
We also have individual Customer contracts that offer extended payment terms and/or discounted pricing. Dealers and distributors may be offered sales incentives in the form of rebates. We reduce revenue for discounts and estimated returns, rebates, and other similar allowances in the same period the related revenues are recorded. Returns, rebates, and similar allowances are estimated based on historical experience and trend analysis.
In transactions that contain multiple elements, such as when products, maintenance services, and other services are combined, we recognize revenue as each product is delivered or service is provided to the Customer. We allocate the total arrangement consideration to each element based on its relative fair value, based on the price for the product or service when it is sold separately.
We offer preventative maintenance agreements to our Customers with contract terms that range from one to five years, which require us to maintain and repair our products during this time. Amounts received under these Customer contracts are initially recorded as deferred service revenues and then recognized as service revenues ratably over the contract term.
We classify shipping and handling amounts billed to Customers in sales transactions as revenues.
Allowance for Doubtful Accounts Receivable. We maintain an allowance for uncollectible accounts receivable for estimated losses in the collection of amounts owed by Customers. We estimate the allowance based on analyzing a number of factors, including amounts written off historically, Customer payment practices, and general economic conditions. We also analyze significant Customer accounts on a regular basis and record a specific allowance when we become aware of a specific Customer’s inability to pay. As a result, the related accounts receivable are reduced to an amount that we reasonably believe is collectible. These analyses require a considerable amount of judgment. If the financial condition of our Customers worsens, or economic conditions change, we may be required to make changes to our allowance for doubtful accounts receivable.
Allowance for Sales Returns. We maintain an allowance for sales returns based upon known returns and estimated returns for both capital equipment and consumables. We estimate returns of capital equipment and consumables based upon historical experience less the estimated inventory value of the returned goods.
Inventories and Reserves. Inventories are stated at the lower of their cost or market value. We determine cost based upon a combination of the last-in, first-out (“LIFO”) and first-in, first-out (“FIFO”) cost methods. We determine the LIFO inventory value at the end of the year based on inventory levels and costs at that time. For inventories valued using the LIFO method, we believe that the use of the LIFO method results in a matching of current costs and revenues. Inventories valued using the LIFO method represented approximately 35.9% and 34.6% of total inventories at March 31, 2015 and 2014, respectively. Inventory costs include material, labor, and overhead. If we had used only the FIFO method of inventory costing, inventories would have been $19.1 million and $19.5 million higher than those reported at March 31, 2015 and 2014, respectively.
We review the net realizable value of inventory on an ongoing basis, considering factors such as deterioration, obsolescence, and other items. We record an allowance for estimated losses when the facts and circumstances indicate that particular inventories will not be usable. If future market conditions vary from those projected, and our estimates prove to be inaccurate, we may be required to write-down inventory values and record an adjustment to cost of revenues.
Asset Impairment Losses. Property, plant, equipment, and identifiable intangible assets are reviewed for impairment when events and circumstances indicate that the carrying value of such assets may not be recoverable. Impaired assets are recorded at the lower of carrying value or estimated fair value. We conduct this review on an ongoing basis and, if impairment exists, we record the loss in the Consolidated Statements of Income during that period.
When we evaluate assets for impairment, we make certain judgments and estimates, including interpreting current economic indicators and market valuations, evaluating our strategic plans with regards to operations, historical and anticipated performance of operations, and other factors. If we incorrectly anticipate these factors, or unexpected events occur, our operating results could be materially affected.
Asset Retirement Obligations. Beginning in fiscal year 2016 and thereafter, we expect to incur retirement obligations for assets associated with our Isomedix business segment. The initial fair values of these obligations are recorded as liabilities on a discounted basis. The costs associated with these liabilities are capitalized (as part of the related assets) and depleted over time and the liabilities are accreted for the change in their present value over time. We use various assumptions and judgments to estimate the cost of disposing these assets including: discount rates, removal rates and timing of removal. If we incorrectly anticipate these factors, or unexpected events occur, our operating results could be materially affected.
Restructuring. We have recorded specific accruals in connection with plans for restructuring elements of our business. These accruals include estimates principally related to employee separation costs, the closure and/or consolidation of facilities, and contractual obligations. Actual amounts could differ from the original estimates.
41
We review our restructuring-related accruals on a quarterly basis and changes to plans are appropriately recognized in the Consolidated Statements of Income in the period the change is identified. Note 2 to our consolidated financial statements titled, “Restructuring,” summarizes our restructuring plans.
Purchase Accounting and Goodwill. Assets and liabilities of the business acquired are accounted for at their estimated fair values as of the acquisition date. Any excess of the cost of the acquisition over the fair value of the net tangible and intangible assets acquired is recorded as goodwill. We supplement management expertise with valuation specialists in performing appraisals to assist us in determining the fair values of assets acquired and liabilities assumed. These valuations require us to make estimates and assumptions, especially with respect to intangible assets. We generally amortize our intangible assets over their useful lives with the exception of indefinite lived intangible assets. We do not amortize goodwill, but we evaluate it annually for impairment. Therefore, the allocation of acquisition costs to intangible assets and goodwill has a significant impact on future operating results.
We evaluate the recoverability of recorded goodwill amounts annually, or when evidence of potential impairment exists. We may consider qualitative indicators of the fair value of a reporting unit when it is unlikely that a reporting unit has impaired goodwill. We may also utilize a discounted cash flow analysis that requires certain assumptions and estimates be made regarding market conditions and our future profitability. In those circumstances we test goodwill for impairment by reviewing the book value compared to the fair value at the reporting unit level. We calculate the fair value of our reporting units based on the present value of estimated future cash flows. Considerable management judgment is necessary to evaluate the impact of operating and macroeconomic changes and to estimate future cash flows to measure fair value. Assumptions used in our impairment evaluations, such as forecasted growth rates and cost of capital, are consistent with internal projections and operating plans. We believe such assumptions and estimates are also comparable to those that would be used by other marketplace participants.
We performed our annual goodwill and indefinite lived intangible asset impairment evaluation as of October 31, 2014. Based on this evaluation, we determined that there was no impairment of the recorded amounts and we do not believe that any of our reporting units are at a significant risk of failing goodwill impairment testing.
We evaluate indefinite lived intangible assets annually, or when evidence of potential impairment exists. We evaluate several qualitative indicators and assumptions, and trends that influence the valuation of the assets to determine if any evidence of potential impairment exists.
Income Taxes. Our provision for income taxes is based on our current period income, changes in deferred income tax assets and liabilities, income tax rates, changes in uncertain tax benefits, and tax planning opportunities available to us in the various jurisdictions in which we operate. Tax laws are complex and subject to different interpretations by the taxpayer and the respective governmental taxing authorities. We use significant judgment in determining our annual effective income tax rate and evaluating our tax positions. We prepare and file tax returns based on our interpretation of tax laws and regulations, and we record estimates based on these judgments and interpretations. We cannot be sure that the tax authorities will agree with all of the tax positions taken by us. The actual income tax liability for each jurisdiction in any year can, in some instances, be ultimately determined several years after the tax return is filed and the financial statements are published.
We evaluate our tax positions using the recognition threshold and measurement attribute in accordance with current accounting guidance. We determine whether it is more-likely-than-not that a tax position will be sustained upon examination, including resolution of related appeals or litigation processes, based on the technical merits of the position. In evaluating whether a tax position has met the more-likely-than-not recognition threshold, we presume that the position will be examined by the appropriate taxing authority and that the taxing authority will have full knowledge of all relevant information. A tax position that meets the more-likely-than-not recognition threshold is measured at the largest amount of benefit that is greater than 50 percent likely of being realized upon ultimate settlement. The appropriate unit of account for determining what constitutes an individual tax position, and whether the more-likely-than-not recognition threshold is met for a tax position, is a matter of judgment based on the individual facts and circumstances of that position evaluated in light of all available evidence. We review and adjust our tax estimates periodically because of ongoing examinations by and settlements with the various taxing authorities, as well as changes in tax laws, regulations and precedent.
We recognize deferred tax assets and liabilities based on the differences between the financial statement carrying amounts and the tax basis of assets and liabilities. We regularly review our deferred tax assets for recoverability and establish a valuation allowance based on historical taxable income, projected future taxable income, the expected timing of the reversals of existing temporary differences, and the implementation of tax planning strategies. If we are unable to generate sufficient future taxable income in certain tax jurisdictions, or if there is a material change in the effective income tax rates or time period within which the underlying temporary differences become taxable or deductible, we could be required to increase our valuation allowance, which would increase our effective income tax rate and could result in an adverse impact on our consolidated financial position, results of operations, or cash flows.
42
We believe that adequate accruals have been made for income taxes. Differences between the estimated and actual amounts determined upon ultimate resolution, individually or in the aggregate, are not expected to have a material adverse effect on our consolidated financial position, but could possibly be material to our consolidated results of operations or cash flow for any one period.
Additional information regarding income taxes is included in note 9 to our consolidated financial statements titled, “Income Taxes.”
SYSTEM 1 Rebate Program and Class Action Settlement. The SYSTEM 1 Rebate Program (the “Rebate Program”) was initially recognized during the first quarter of fiscal 2011. The rebate portion of the Rebate Program was recognized as contra-revenue consistent with other returns and allowances offered to Customers. The estimated costs to facilitate the disposal of the returned SYSTEM 1 processors portion of the Rebate Program were recognized as cost of revenues. Both components were recorded as current liabilities. The key assumptions involved in the estimates associated with the Rebate Program included: the number and age of SYSTEM 1 processors eligible for rebates under the Rebate Program, the number of Customers that would elect to participate in the Rebate Program, the proportion of Customers that would choose each rebate option, and the estimated per unit costs of disposal.
The Rebate Program ended August 2, 2012. Customers utilized rebates totaling approximately $66.6 million on orders placed since the initiation of the Rebate Program. The costs associated with the Rebate Program were lower than originally estimated because fewer Customers elected to participate in the Rebate Program than anticipated.
The SYSTEM 1 class action settlement was initially recognized during the third quarter of fiscal 2011. The claim submission deadline was December 31, 2012. As a result, during fiscal 2013 we reduced the liability related to the SYSTEM 1 class action settlement by $16.8 million. The adjustment was recorded as a reduction to operating expenses.
Self-Insurance Liabilities. We record a liability for self-insured risks that we retain for general and product liabilities, workers’ compensation, and automobile liabilities based on actuarial calculations. We use our historical loss experience and actuarial methods to calculate the estimated liability. This liability includes estimated amounts for both losses and incurred but not reported claims. We review the assumptions used to calculate the estimated liability at least annually to evaluate the adequacy of the amount recorded. We maintain insurance policies to cover losses greater than our estimated liability, which are subject to the terms and conditions of those policies. The obligation covered by insurance contracts will remain on the balance sheet as we remain liable to the extent insurance carriers do not meet their obligation. Estimated amounts receivable under the contracts are included in the "Prepaid expenses and other current assets" line, and the "Other assets" line of our consolidated balance sheets. Our accrual for self-insured risk retention as of March 31, 2015 and 2014 was $18.1 million and $14.4 million, respectively.
We are also self-insured for employee medical claims. We estimate a liability for incurred but not reported claims based upon recent claims experience.
Our self-insured liabilities contain uncertainties because management must make assumptions and apply judgments to estimate the ultimate cost to settle reported claims and claims incurred but not reported as of the balance sheet date. If actual results are not consistent with these assumptions and judgments, we could be exposed to additional costs in subsequent periods.
Warranty Reserves. We generally offer a limited one-year parts and labor warranty on our capital equipment. The specific terms and conditions of warranties may vary depending on the product sold and the country where we conduct business. We record a liability for the estimated cost of product warranties in the period revenues are recognized. We estimate warranty expenses based primarily on historical warranty claim experience. While we have extensive quality programs and processes and actively monitor and evaluate the quality of suppliers, actual warranty experience could be different from our estimates. If actual product failure rates, material usage, or service costs are different from our estimates, we may have to record an adjustment to the estimated warranty liability. As of March 31, 2015 and 2014, we had accrued $5.6 million and $7.8 million, respectively, for warranty exposures.
Contingencies. We are, and will likely continue to be, involved in a number of legal proceedings, government investigations, and claims, which we believe generally arise in the course of our business, given our size, history, complexity, and the nature of our business, products, Customers, regulatory environment, and industries in which we participate. These legal proceedings, investigations and claims generally involve a variety of legal theories and allegations, including, without limitation, personal injury (e.g., slip and falls, burns, vehicle accidents), product liability or regulation (e.g., based on product operation or claimed malfunction, failure to warn, failure to meet specification, or failure to comply with regulatory requirements), product exposure (e.g., claimed exposure to chemicals, asbestos, contaminants, radiation), property damage (e.g., claimed damage due to leaking equipment, fire, vehicles, chemicals), commercial claims (e.g., breach of contract, economic loss, warranty, misrepresentation), financial (e.g., taxes, reporting), employment (e.g., wrongful termination, discrimination, benefits matters), and other claims for damage and relief.
43
We record a liability for such contingencies to the extent we conclude that their occurrence is both probable and estimable. We consider many factors in making these assessments, including the professional judgment of experienced members of management and our legal counsel. We have made estimates as to the likelihood of unfavorable outcomes and the amounts of such potential losses. In our opinion, the ultimate outcome of these proceedings and claims is not anticipated to have a material adverse affect on our consolidated financial position, results of operations, or cash flows. However, the ultimate outcome of proceedings, government investigations, and claims is unpredictable and actual results could be materially different from our estimates. We record expected recoveries under applicable insurance contracts when we are assured of recovery. Refer to note 11 of our consolidated financial statements titled, "Commitments and Contingencies" for additional information.
We are subject to taxation from United States federal, state and local, and foreign jurisdictions. Tax positions are settled primarily through the completion of audits within each individual tax jurisdiction or the closing of a statute of limitation. Changes in applicable tax law or other events may also require us to revise past estimates. The IRS routinely conducts audits of our federal income tax returns.
Additional information regarding our commitments and contingencies is included in note 11 to our consolidated financial statements titled, “Commitments and Contingencies.”
Benefit Plans. We provide defined benefit pension plans for certain former manufacturing and plant administrative personnel as determined by collective bargaining agreements or employee benefit standards set at the time of acquisition of certain businesses. As of March 31, 2015, we sponsored a defined benefit pension plan for eligible participants in the United States. In addition, as of March 31, 2015, we sponsored an unfunded post-retirement welfare benefits plan for two groups of United States retirees, including the same retirees who receive pension benefits under the United States defined benefit pension plan. Benefits under this plan include retiree life insurance and retiree medical insurance, including prescription drug coverage.
Employee pension and post-retirement welfare benefits plans are a cost of conducting business and represent obligations that will be settled in the future and therefore, require us to use estimates and make certain assumptions to calculate the expense and liabilities related to the plans. Changes to these estimates and assumptions can result in different expense and liability amounts. Future actual experience may be significantly different from our current expectations. We believe that the most critical assumptions used to determine net periodic benefit costs and projected benefit obligations are the expected long-term rate of return on plan assets and the discount rate. A summary of significant assumptions used to determine the March 31, 2015 projected benefit obligations and the fiscal 2015 net periodic benefit costs is as follows:
U.S. Defined Benefit Pension Plan | Other Post- Retirement Plan | ||||
Funding Status | Funded | Unfunded | |||
Assumptions used to determine March 31, 2015 | |||||
Benefit obligations: | |||||
Discount rate | 2.46 | % | 3.00 | % | |
Assumptions used to determine fiscal 2015 | |||||
Net periodic benefit costs: | |||||
Discount rate | 4.00 | % | 3.50 | % | |
Expected return on plan assets | 6.75 | % | n/a | ||
NA – Not applicable.
We develop our expected long-term rate of return on plan assets assumptions by evaluating input from third-party professional advisors, taking into consideration the asset allocation of the portfolios, and the long-term asset class return expectations. Generally, net periodic benefit costs increase as the expected long-term rate of return on plan assets assumption decreases. Holding all other assumptions constant, lowering the expected long-term rate of return on plan assets assumption for our funded defined benefit pension plans by 50 basis points would have increased the fiscal 2015 benefit costs by $0.2 million.
We develop our discount rate assumptions by evaluating input from third-party professional advisors, taking into consideration the current yield on country specific investment grade long-term bonds which provide for similar cash flow streams as our projected benefit obligations. Generally, the projected benefit obligations and the net periodic benefit costs both increase as the discount rate assumption decreases. Holding all other assumptions constant, lowering the discount rate assumption for our defined benefit pension plans and for the other post-retirement plan by 50 basis points would have decreased the fiscal 2015 net periodic benefit costs by approximately $0.05 million and would have increased the projected benefit obligations by approximately $3.8 million at March 31, 2015.
44
We have made assumptions regarding healthcare costs in computing our other post-retirement benefit obligation. The assumed rates of increase generally decline ratably over a five year-period from the assumed current year healthcare cost trend rate of 7% to the assumed long-term healthcare cost trend rate. A 100 basis point change in the assumed healthcare cost trend rate (including medical, prescription drug, and long-term rates) would have had the following effect at March 31, 2015:
100 Basis Point | |||||||
(dollars in thousands) | Increase | Decrease | |||||
Effect on total service and interest cost components | $ | 2 | $ | (2 | ) | ||
Effect on postretirement benefit obligation | 68 | (64 | ) | ||||
We recognize an asset for the overfunded status or a liability for the underfunded status of defined benefit pension and post-retirement benefit plans in our balance sheets. This amount is measured as the difference between the fair value of plan assets and the benefit obligation (the projected benefit obligation for pension plans and the accumulated post-retirement benefit obligation for other post-retirement benefit plans). Changes in the funded status of the plans are recorded in other comprehensive income in the year they occur. We measure plan assets and obligations as of the balance sheet date. Note 10 to our consolidated financial statements titled, “Benefit Plans,” contains additional information about our pension and other post-retirement welfare benefits plans.
Share-Based Compensation. We measure the estimated fair value for share-based compensation awards, including grants of employee stock options at the grant date and recognize the related compensation expense over the period in which the share-based compensation vests. We selected the Black-Scholes-Merton option pricing model as the most appropriate method for determining the estimated fair value of our share-based stock option compensation awards. This model involves assumptions that are judgmental and affect share-based compensation expense.
Share-based compensation expense was $14.9 million in fiscal 2015, $11.1 million in fiscal 2014 and $8.9 million in fiscal 2013. Note 15 to our consolidated financial statements titled, “Share-Based Compensation,” contains additional information about our share-based compensation plans.
RECENTLY ISSUED ACCOUNTING STANDARDS IMPACTING THE COMPANY
Recently issued accounting standards that are relevant to us are presented in note 1 to our consolidated financial statements titled, “Nature of Operations and Summary of Significant Accounting Policies.”
INFLATION
Our business has not been significantly impacted by the overall effects of inflation. We monitor the prices we charge for our products and services on an ongoing basis and plan to adjust those prices to take into account future changes in the rate of inflation. However, we may not be able to completely offset the impact of inflation.
FORWARD-LOOKING STATEMENTS
This Form 10-K may contain statements concerning certain trends, expectations, forecasts, estimates, or other forward-looking information affecting or relating to Synergy Health plc (“Synergy”) or STERIS or its industry, products or activities that are intended to qualify for the protections afforded "forward-looking statements" under the Private Securities Litigation Reform Act of 1995 and other laws and regulations. Forward-looking statements speak only as to the date of this report, and may be identified by the use of forward-looking terms such as "may," "will," "expects," "believes," "anticipates," "plans," "estimates," "projects," "targets," "forecasts," "outlook," "impact," "potential," "confidence," "improve," "optimistic," "deliver," "comfortable," "trend", and "seeks," or the negative of such terms or other variations on such terms or comparable terminology. Many important factors could cause actual results to differ materially from those in the forward-looking statements including, without limitation, disruption of production or supplies, changes in market conditions, political events, pending or future claims or litigation, competitive factors, technology advances, actions of regulatory agencies, and changes in laws, government regulations, labeling or product approvals or the application or interpretation thereof. Other risk factors are described herein and in STERIS and Synergy's other securities filings, including Item 1A of this Annual Report on Form 10-K, and in Synergy's annual report and accounts for the year ended 30 March 2014 (section headed "principal risks and uncertainties"). Many of these important factors are outside STERIS's or Synergy's control. No assurances can be provided as to any result or the timing of any outcome regarding matters described herein or otherwise with respect to any regulatory action, administrative proceedings, government investigations, litigation, warning letters, consent decree, cost reductions, business strategies, earnings or revenue trends or future financial results. References to products and the consent decree are summaries only and should not be considered the specific terms of the decree or product clearance or literature. Unless legally required, STERIS and Synergy do not undertake to update or revise any forward-looking statements even if events make clear that any projected
45
results, express or implied, will not be realized. Other potential risks and uncertainties that could cause actual results to differ materially from those in the forward-looking statements include, without limitation, (a) the potential for increased pressure on pricing or costs that leads to erosion of profit margins, (b) the possibility that market demand will not develop for new technologies, products or applications or services, or business initiatives will take longer, cost more or produce lower benefits than anticipated, (c) the possibility that application of or compliance with laws, court rulings, certifications, regulations, regulatory actions, including without limitation those relating to FDA warning notices or letters, government investigations, the outcome of any pending FDA requests, inspections or submissions, or other requirements or standards may delay, limit or prevent new product introductions, affect the production and marketing of existing products or services or otherwise affect Company or Synergy's performance, results, prospects or value, (d) the potential of international unrest, economic downturn or effects of currencies, tax assessments, adjustments or anticipated rates, raw material costs or availability, benefit or retirement plan costs, or other regulatory compliance costs, (e) the possibility of reduced demand, or reductions in the rate of growth in demand, for Company or Synergy products and services, (f) the possibility that anticipated growth, cost savings, new product acceptance, performance or approvals, or other results may not be achieved, or that transition, labor, competition, timing, execution, regulatory, governmental, or other issues or risks associated with STERIS and Synergy's businesses, industry or initiatives including, without limitation, the consent decree or those matters described in STERIS's Form 10-K for the year ended March 31, 2015 and other securities filings, may adversely impact Company performance, results, prospects or value, (g) the possibility that anticipated financial results or benefits of recent acquisitions, or of STERIS's restructuring efforts will not be realized or will be other than anticipated, (h) the effects of the contractions in credit availability, as well as the ability of STERIS and Synergy's Customers and suppliers to adequately access the credit markets when needed, (i) the receipt of approval of both STERIS's shareholders and Synergy's shareholders for the proposed transaction with Synergy (the “Synergy transaction”), (j) the regulatory approvals required for the Synergy transaction not being obtained on the terms expected or on the anticipated schedule, (k) the parties’ ability to meet expectations regarding the timing, completion and accounting and tax treatments of the Synergy transaction, (l) the possibility that the parties may be unable to achieve expected synergies and operating efficiencies in connection with the Synergy transaction within the expected time-frames or at all and to successfully integrate Synergy’s operations into those of STERIS, (m) the integration of Synergy’s operations into those of STERIS being more difficult, time-consuming or costly than expected, (n) operating costs, Customer loss and business disruption (including, without limitations, difficulties in maintaining relationships with employees, Customers, clients or suppliers) being greater than expected following the Synergy transaction, (o) the retention of certain key employees of Synergy being difficult, (p) changes in tax laws or interpretations that could increase the consolidated tax liabilities of Synergy and STERIS, including, if the transaction is consummated, changes in tax laws that would result in the new parent UK holding company being treated as a domestic corporation for United States federal tax purposes, and (q) those risks described in this Annual Report on Form 10-K for the year ended March 31, 2015, and other securities filings.
46
ITEM 7A. | QUANTITATIVE AND QUALITATIVE DISCLOSURES ABOUT MARKET RISK |
In the ordinary course of business, we are exposed to various risks, including, but not limited to, interest rate, foreign currency, and commodity risks. These risks are described in the sections that follow.
INTEREST RATE RISK
As of March 31, 2015, we had $340.0 million in fixed rate senior notes outstanding. As of March 31, 2015, we had $283.3 million in outstanding borrowings under our Credit Agreement. Borrowings under the Credit Agreement are exposed to changes in interest rates. We monitor our interest rate risk, but do not engage in any hedging activities using derivative financial instruments. For additional information regarding our debt structure, refer to note 7 to our Consolidated Financial Statements titled, “Debt.”
FOREIGN CURRENCY RISK
We are exposed to the impact of foreign currency exchange fluctuations. This foreign currency exchange risk arises when we conduct business in a currency other than the U.S. dollar. For most international operations, local currencies have been determined to be the functional currencies. The financial statements of international subsidiaries are translated to their U.S. dollar equivalents at end-of-period exchange rates for assets and liabilities and at average currency exchange rates for revenues and expenses. Translation adjustments for international subsidiaries whose local currency is their functional currency are recorded as a component of accumulated other comprehensive income (loss) within shareholders’ equity. Note 19 to our consolidated financial statements titled, “Accumulated Other Comprehensive Income (Loss),” contains additional information about the impact of translation on accumulated other comprehensive income (loss) and shareholders’ equity. Transaction gains and losses arising from fluctuations in currency exchange rates on transactions denominated in currencies other than the functional currency are recognized in the Consolidated Statements of Income. Since we operate internationally and approximately one-fourth of our revenues and one-fourth of our cost of revenues are generated outside the United States, foreign currency exchange rate fluctuations can significantly impact our financial position, results of operations, and competitive position.
We enter into foreign currency forward contracts to hedge assets and liabilities denominated in foreign currencies, including inter-company transactions. We do not use derivative financial instruments for speculative purposes. At March 31, 2015, we held foreign currency forward contracts to buy 68 million Mexican pesos, 8 million Canadian dollars and 2.5 million British pounds sterling.
COMMODITY RISK
We are dependent on basic raw materials, sub-assemblies, components, and other supplies used in our operations. Our financial results could be affected by the availability and changes in prices of these materials. Some of these materials are sourced from a limited number of suppliers or only a single supplier. These materials are also key source materials for our competitors. Therefore, if demand for these materials rises, we may experience increased costs and/or limited or unavailable supplies. As a result, we may not be able to acquire key production materials on a timely basis, which could impact our ability to produce products and satisfy incoming sales orders on a timely basis. In addition, the costs of these materials can rise suddenly and result in significantly higher costs of production. We believe that we have adequate sources of supply for many of our key materials and energy sources. Where appropriate, we enter into long-term supply contracts as a basis to guarantee a reliable supply. We may also enter into commodity swap contracts to hedge price changes in a certain commodity that impacts raw materials included in our cost of revenues. At March 31, 2015, we held commodity swap contracts to buy 586,500 pounds of nickel.
47
ITEM 8. | FINANCIAL STATEMENTS AND SUPPLEMENTARY DATA |
INDEX TO FINANCIAL STATEMENTS AND FINANCIAL STATEMENT SCHEDULE
Page | ||
Consolidated Financial Statements: | ||
Financial Statement Schedule: | ||
48
REPORT OF INDEPENDENT REGISTERED PUBLIC ACCOUNTING FIRM
Board of Directors and Shareholders
STERIS Corporation
We have audited the accompanying consolidated balance sheets of STERIS Corporation and subsidiaries as of March 31, 2015 and 2014, and the related consolidated statements of income, comprehensive income, shareholders' equity, and cash flows for each of the three years in the period ended March 31, 2015. Our audits also included the financial statement schedule listed in the Index at Item 15(a). These financial statements and schedule are the responsibility of the Company’s management. Our responsibility is to express an opinion on these financial statements and schedule based on our audits.
We conducted our audits in accordance with the standards of the Public Company Accounting Oversight Board (United States). Those standards require that we plan and perform the audit to obtain reasonable assurance about whether the financial statements are free of material misstatement. An audit includes examining, on a test basis, evidence supporting the amounts and disclosures in the financial statements. An audit also includes assessing the accounting principles used and significant estimates made by management, as well as evaluating the overall financial statement presentation. We believe that our audits provide a reasonable basis for our opinion.
In our opinion, the financial statements referred to above present fairly, in all material respects, the consolidated financial position of STERIS Corporation and subsidiaries at March 31, 2015 and 2014, and the consolidated results of their operations and their cash flows for each of the three years in the period ended March 31, 2015, in conformity with U.S. generally accepted accounting principles. Also, in our opinion, the related financial statement schedule, when considered in relation to the basic financial statements taken as a whole, presents fairly in all material respects the information set forth therein.
We also have audited, in accordance with the standards of the Public Company Accounting Oversight Board (United States), STERIS Corporation and subsidiaries’ internal control over financial reporting as of March 31, 2015, based on criteria established in Internal Control-Integrated Framework issued by the Committee of Sponsoring Organizations of the Treadway Commission (2013 framework), and our report dated May 27, 2015 expressed an unqualified opinion thereon.
/s/ ERNST & YOUNG LLP
Cleveland, Ohio
May 27, 2015
49
STERIS CORPORATION AND SUBSIDIARIES
CONSOLIDATED BALANCE SHEETS
(in thousands)
March 31, | 2015 | 2014 | ||||||
Assets | ||||||||
Current assets: | ||||||||
Cash and cash equivalents | $ | 167,689 | $ | 152,802 | ||||
Accounts receivable (net of allowances of $9,415 and $10,922, respectively) | 325,289 | 313,686 | ||||||
Inventories, net | 160,818 | 155,146 | ||||||
Deferred income taxes, net | 31,629 | 16,084 | ||||||
Prepaid expenses and other current assets | 35,007 | 37,027 | ||||||
Total current assets | 720,432 | 674,745 | ||||||
Property, plant, and equipment, net | 493,053 | 454,410 | ||||||
Goodwill and intangibles, net | 860,645 | 747,715 | ||||||
Other assets | 25,336 | 10,292 | ||||||
Total assets | $ | 2,099,466 | $ | 1,887,162 | ||||
Liabilities and equity | ||||||||
Current liabilities: | ||||||||
Accounts payable | $ | 99,340 | $ | 102,430 | ||||
Accrued income taxes | 7,154 | — | ||||||
Accrued payroll and other related liabilities | 74,805 | 58,774 | ||||||
Accrued expenses and other | 102,032 | 93,302 | ||||||
Total current liabilities | 283,331 | 254,506 | ||||||
Long-term indebtedness | 623,250 | 493,480 | ||||||
Deferred income taxes, net | 71,905 | 59,053 | ||||||
Other liabilities | 47,334 | 38,877 | ||||||
Total liabilities | $ | 1,025,820 | $ | 845,916 | ||||
Commitments and contingencies (see note 11) | ||||||||
Serial preferred shares, without par value; 3,000 shares authorized; no shares issued or outstanding | — | — | ||||||
Common shares, without par value; 300,000 shares authorized; 70,040 shares issued; 59,675 and 58,968 shares outstanding, respectively | 264,853 | 246,186 | ||||||
Common shares held in treasury, 10,364 and 11,072 shares, respectively | (320,343 | ) | (324,202 | ) | ||||
Retained earnings | 1,193,791 | 1,112,240 | ||||||
Accumulated other comprehensive (loss) income | (66,669 | ) | 4,481 | |||||
Total shareholders’ equity | 1,071,632 | 1,038,705 | ||||||
Noncontrolling interest | 2,014 | 2,541 | ||||||
Total equity | 1,073,646 | 1,041,246 | ||||||
Total liabilities and equity | $ | 2,099,466 | $ | 1,887,162 | ||||
See notes to consolidated financial statements.
50
STERIS CORPORATION AND SUBSIDIARIES
CONSOLIDATED STATEMENTS OF INCOME
(in thousands, except per share amounts)
Years Ended March 31, | 2015 | 2014 | 2013 | |||||||||
Revenues: | ||||||||||||
Product | $ | 1,047,805 | $ | 1,011,462 | $ | 967,362 | ||||||
Service | 802,458 | 610,790 | 534,540 | |||||||||
Total revenues | 1,850,263 | 1,622,252 | 1,501,902 | |||||||||
Cost of revenues: | ||||||||||||
Product | 584,210 | 586,176 | 550,899 | |||||||||
Service | 491,752 | 386,454 | 329,740 | |||||||||
Total cost of revenues | 1,075,962 | 972,630 | 880,639 | |||||||||
Gross profit | 774,301 | 649,622 | 621,263 | |||||||||
Operating expenses: | ||||||||||||
Selling, general, and administrative | 493,342 | 380,970 | 337,694 | |||||||||
Research and development | 54,139 | 48,641 | 41,305 | |||||||||
Restructuring expenses | (391 | ) | 13,204 | (565 | ) | |||||||
Total operating expenses | 547,090 | 442,815 | 378,434 | |||||||||
Income from operations | 227,211 | 206,807 | 242,829 | |||||||||
Non-operating expenses, net: | ||||||||||||
Interest expense | 19,187 | 18,770 | 15,675 | |||||||||
Interest income and miscellaneous expense | (796 | ) | (339 | ) | 56 | |||||||
Total non-operating expenses, net | 18,391 | 18,431 | 15,731 | |||||||||
Income before income tax expense | 208,820 | 188,376 | 227,098 | |||||||||
Income tax expense | 73,756 | 58,934 | 67,121 | |||||||||
Net income | $ | 135,064 | $ | 129,442 | $ | 159,977 | ||||||
Net income per common share | ||||||||||||
Basic | $ | 2.27 | $ | 2.20 | $ | 2.74 | ||||||
Diluted | $ | 2.25 | $ | 2.17 | $ | 2.72 | ||||||
Cash dividends declared per common share outstanding | $ | 0.90 | $ | 0.82 | $ | 0.74 | ||||||
See notes to consolidated financial statements.
51
STERIS CORPORATION AND SUBSIDIARIES
CONSOLIDATED STATEMENTS OF COMPREHENSIVE INCOME
(in thousands)
Years Ended March 31, | 2015 | 2014 | 2013 | |||||||||
Net income | $ | 135,064 | $ | 129,442 | 159,977 | |||||||
Unrealized gain on available for sale securities, net of taxes of $85, $0 and $0, respectively | 507 | 275 | 112 | |||||||||
Amortization of pension and postretirement benefit plans costs, net of taxes of $4,007, ($1,798), $2,706 and respectively | (6,461 | ) | 2,756 | (4,082 | ) | |||||||
Change in cumulative foreign currency translation adjustment | (65,196 | ) | 5,538 | (13,745 | ) | |||||||
Total other comprehensive income (loss) | (71,150 | ) | 8,569 | (17,715 | ) | |||||||
Comprehensive income | $ | 63,914 | $ | 138,011 | $ | 142,262 | ||||||
See notes to consolidated financial statements.
52
STERIS CORPORATION AND SUBSIDIARIES
CONSOLIDATED STATEMENTS OF CASH FLOWS
(in thousands)
Years Ended March 31, | 2015 | 2014 | 2013 | |||||||||
Operating activities: | ||||||||||||
Net income | $ | 135,064 | $ | 129,442 | $ | 159,977 | ||||||
Adjustments to reconcile net income to net cash provided by operating activities: | ||||||||||||
Depreciation, depletion, and amortization | 91,541 | 75,649 | 69,035 | |||||||||
Deferred income taxes | (4,916 | ) | 15,176 | 23,751 | ||||||||
Share-based compensation expense | 14,921 | 11,100 | 8,917 | |||||||||
Loss on the disposal of property, plant, equipment, and intangibles, net | (151 | ) | 5,279 | 294 | ||||||||
Excess tax benefit from share-based compensation | (11,526 | ) | (2,841 | ) | (2,058 | ) | ||||||
Other items | (9,238 | ) | (66 | ) | (4,120 | ) | ||||||
Changes in operating assets and liabilities, net of effects of acquisitions: | ||||||||||||
Accounts receivable, net | (2,774 | ) | (28,794 | ) | 21,866 | |||||||
Inventories, net | (9,902 | ) | 2,767 | 28,015 | ||||||||
Other current assets | 2,089 | (5,482 | ) | (8,889 | ) | |||||||
Accounts payable | (3,146 | ) | 19,377 | (12,536 | ) | |||||||
Accrued SYSTEM 1 Rebate Program and class action settlement | — | (245 | ) | (68,812 | ) | |||||||
Accruals and other, net | 44,078 | (11,731 | ) | 12,375 | ||||||||
Net cash provided by operating activities | 246,040 | 209,631 | 227,815 | |||||||||
Investing activities: | ||||||||||||
Purchases of property, plant, equipment, and intangibles, net | (85,255 | ) | (86,367 | ) | (87,412 | ) | ||||||
Proceeds from the sale of property, plant, equipment, and intangibles | 829 | 4,774 | 34 | |||||||||
Purchases of investments | (4,681 | ) | — | — | ||||||||
Acquisition of business, net of cash acquired | (194,662 | ) | (67,059 | ) | (399,676 | ) | ||||||
Net cash used in investing activities | (283,769 | ) | (148,652 | ) | (487,054 | ) | ||||||
Financing activities: | ||||||||||||
Proceeds from the issuance of long-term obligations | — | — | 200,000 | |||||||||
Payments on long-term obligations | — | (70,000 | ) | — | ||||||||
Proceeds under credit facilities, net | 129,770 | 71,190 | 82,290 | |||||||||
Deferred financing fees and debt issuance costs | (14,370 | ) | (43 | ) | (1,924 | ) | ||||||
Acquisition related contingent consideration | (1,250 | ) | — | — | ||||||||
Repurchases of common shares | (30,687 | ) | (25,469 | ) | (8,002 | ) | ||||||
Cash dividends paid to common shareholders | (53,513 | ) | (48,385 | ) | (43,195 | ) | ||||||
Stock option and other equity transactions, net | 28,274 | 15,660 | 23,019 | |||||||||
Excess tax benefit from share-based compensation | 11,526 | 2,841 | 2,058 | |||||||||
Net cash provided by (used in) financing activities | 69,750 | (54,206 | ) | 254,246 | ||||||||
Effect of exchange rate changes on cash and cash equivalents | (17,134 | ) | 4,021 | (3,820 | ) | |||||||
Increase (decrease) in cash and cash equivalents | 14,887 | 10,794 | (8,813 | ) | ||||||||
Cash and cash equivalents at beginning of period | 152,802 | 142,008 | 150,821 | |||||||||
Cash and cash equivalents at end of period | $ | 167,689 | $ | 152,802 | $ | 142,008 | ||||||
See notes to consolidated financial statements.
53
STERIS CORPORATION AND SUBSIDIARIES
CONSOLIDATED STATEMENTS OF SHAREHOLDERS’ EQUITY
(in thousands)
Common Shares | Treasury Shares | Retained Earnings | Accumulated Other Comprehensive Income (Loss) | Non-controlling Interest | Total Equity | ||||||||||||||||||||||||
Number | Amount | Number | Amount | ||||||||||||||||||||||||||
Balance at March 31, 2012 | 57,733 | $ | 244,091 | 12,307 | $ | (350,718 | ) | $ | 914,401 | $ | 13,627 | $ | 1,263 | $ | 822,664 | ||||||||||||||
Comprehensive income: | |||||||||||||||||||||||||||||
Net income | — | — | — | — | 159,977 | — | — | 159,977 | |||||||||||||||||||||
Other comprehensive loss | — | — | — | — | — | (17,715 | ) | — | (17,715 | ) | |||||||||||||||||||
Repurchases of common shares | (257 | ) | — | 257 | (8,002 | ) | — | — | — | (8,002 | ) | ||||||||||||||||||
Equity compensation programs | 1,283 | (6,501 | ) | (1,283 | ) | 36,919 | — | — | — | 30,418 | |||||||||||||||||||
Tax benefit of stock options exercised | — | 2,058 | — | — | — | — | — | 2,058 | |||||||||||||||||||||
Cash dividends – $0.74 per common share | — | — | — | — | (43,195 | ) | — | — | (43,195 | ) | |||||||||||||||||||
Change in noncontrolling interest | — | — | — | — | — | — | 775 | 775 | |||||||||||||||||||||
Balance at March 31, 2013 | 58,759 | $ | 239,648 | 11,281 | $ | (321,801 | ) | $ | 1,031,183 | $ | (4,088 | ) | $ | 2,038 | $ | 946,980 | |||||||||||||
Comprehensive income: | |||||||||||||||||||||||||||||
Net income | — | — | — | — | 129,442 | — | — | 129,442 | |||||||||||||||||||||
Other comprehensive loss | — | — | — | — | — | 8,569 | — | 8,569 | |||||||||||||||||||||
Repurchases of common shares | (624 | ) | — | 624 | (25,469 | ) | — | — | — | (25,469 | ) | ||||||||||||||||||
Equity compensation programs | 833 | 3,697 | (833 | ) | 23,068 | — | — | — | 26,765 | ||||||||||||||||||||
Tax benefit of stock options exercised | — | 2,841 | — | — | — | — | — | 2,841 | |||||||||||||||||||||
Cash dividends – $0.82 per common share | — | — | — | — | (48,385 | ) | — | — | (48,385 | ) | |||||||||||||||||||
Change in noncontrolling interest | — | — | — | — | — | — | 503 | 503 | |||||||||||||||||||||
Balance at March 31, 2014 | 58,968 | $ | 246,186 | 11,072 | $ | (324,202 | ) | $ | 1,112,240 | $ | 4,481 | $ | 2,541 | $ | 1,041,246 | ||||||||||||||
Comprehensive income: | |||||||||||||||||||||||||||||
Net income | — | — | — | — | 135,064 | — | — | 135,064 | |||||||||||||||||||||
Other comprehensive income | — | — | — | — | — | (71,150 | ) | — | (71,150 | ) | |||||||||||||||||||
Repurchases of common shares | (542 | ) | — | 542 | (30,687 | ) | — | — | — | (30,687 | ) | ||||||||||||||||||
Equity compensation programs and other | 1,249 | 7,141 | (1,250 | ) | 34,546 | — | — | — | 41,687 | ||||||||||||||||||||
Tax benefit of stock options exercised | — | 11,526 | — | — | — | — | — | 11,526 | |||||||||||||||||||||
Cash dividends – $0.90 per common share | — | — | — | — | (53,513 | ) | — | — | (53,513 | ) | |||||||||||||||||||
Change in noncontrolling interest | — | — | — | — | — | — | (527 | ) | (527 | ) | |||||||||||||||||||
Balance at March 31, 2015 | 59,675 | $ | 264,853 | 10,364 | $ | (320,343 | ) | $ | 1,193,791 | $ | (66,669 | ) | $ | 2,014 | $ | 1,073,646 | |||||||||||||
See notes to consolidated financial statements.
54
STERIS CORPORATION AND SUBSIDIARIES
NOTES TO CONSOLIDATED FINANCIAL STATEMENTS
(dollars in thousands, except per share amounts)
1. NATURE OF OPERATIONS AND SUMMARY OF SIGNIFICANT ACCOUNTING POLICIES
Nature of Operations. STERIS Corporation, an Ohio corporation, together with its subsidiaries, develops, manufactures, and markets infection prevention, contamination control, microbial reduction, and procedural support products and services for healthcare, pharmaceutical, scientific, research, industrial, and governmental Customers throughout the world. As used in this annual report, STERIS Corporation and its subsidiaries together are called “STERIS,” the “Company,” “we,” “us,” or “our,” unless otherwise noted.
We operate in three reportable business segments: Healthcare, Life Sciences, and STERIS Isomedix Services (“Isomedix”). We describe our operating segments in note 12 titled, "Business Segment Information". Our fiscal year ends on March 31. References in this Annual Report to a particular “year” or “year-end” mean our fiscal year. The significant accounting policies applied in preparing the accompanying consolidated financial statements of the Company are summarized below:
Principles of Consolidation. The accompanying consolidated financial statements include the accounts of the Company and its wholly-owned and majority-owned subsidiaries. We eliminate inter-company accounts and transactions when we consolidate these accounts. Income attributable to non-controlling interests is reported in the "Interest income and miscellaneous expense" line of our Consolidated Statements of Income and is not material.
Use of Estimates. The preparation of financial statements in conformity with U.S. generally accepted accounting principles requires management to make estimates and assumptions that affect the amounts reported in the consolidated financial statements and related notes to financial statements. Actual results could differ from those estimates. On an ongoing basis, we revise the estimates and assumptions as new information becomes available.
Cash Equivalents and Supplemental Cash Flow Information. Cash equivalents are all highly liquid investments with a maturity of three months or less when purchased. We invest our excess cash in short-term instruments including money market funds and time deposits with major banks and financial institutions. We select investments in accordance with the criteria established in our investment policy. Our investment policy specifies, among other things, maturity, credit quality and concentration restrictions with the objective of preserving capital and maintaining adequate liquidity.
Information supplementing our Consolidated Statements of Cash Flows is as follows:
Years Ended March 31, | 2015 | 2014 | 2013 | ||||||||
Cash paid during the year for: | |||||||||||
Interest | $ | 19,124 | $ | 19,268 | $ | 14,115 | |||||
Income taxes | 52,707 | 52,888 | 38,475 | ||||||||
Cash received during the year for income tax refunds | 2,405 | 3,076 | 1,096 | ||||||||
Revenue Recognition. We recognize revenue for products when ownership passes to the Customer, which is based on contract or shipping terms and for services when the service is provided to the Customer. Our Customers include end users as well as dealers and distributors who market and sell our products. Our revenue is not contingent upon resale by the dealer or distributor. We have no further obligations related to bringing about resale and our standard return and restocking fee policies are applied. Revenues are reported net of sales and value-added taxes collected from Customers.
We also have individual Customer contracts that offer discounted pricing. Dealers and distributors may be offered sales incentives in the form of rebates. We reduce revenue for discounts and estimated returns, rebates, and other similar allowances in the same period the related revenues are recorded. Returns, rebates, and similar allowances are estimated based on historical experience and trend analysis.
In transactions that contain multiple elements, such as when products, maintenance services, and other services are combined, we recognize revenue as each product is delivered or service is provided to the Customer. We allocate the total arrangement consideration to each element based on its relative fair value, based on the price for the product or service when it is sold separately.
55
STERIS CORPORATION AND SUBSIDIARIES
NOTES TO CONSOLIDATED FINANCIAL STATEMENTS
(dollars in thousands, except per share amounts)
We offer preventative maintenance agreements to our Customers with contract terms of one to five years which require us to maintain and repair our products during this time. Amounts received under these Customer contracts are initially recorded as deferred service revenues and then recognized as service revenues ratably over the contract term.
Accounts Receivable. Accounts receivable are presented at their face amount, less allowances for sales returns and uncollectible accounts. Accounts receivable consist of amounts billed and currently due from Customers and amounts earned but unbilled. We generally obtain and perfect security interest in products sold in the United States when we have a concern with the Customer's risk profile.
We maintain an allowance for uncollectible accounts receivable for estimated losses in the collection of amounts owed by Customers. We estimate the allowance based on analyzing a number of factors, including amounts written off historically, Customer payment practices, and general economic conditions. We also analyze significant Customer accounts on a regular basis and record a specific allowance when we become aware of a specific Customer’s inability to pay. As a result, the related accounts receivable are reduced to an amount that we reasonably believe is collectible.
We maintain an allowance for sales returns based upon known returns and estimated returns for both capital equipment and consumables. We estimate returns of capital equipment and consumables based upon recent historical experience less the estimated inventory value of the returned goods.
Inventories, net. Inventories are stated at the lower of their cost or market value. We determine cost based upon a combination of the last-in, first-out (“LIFO”) and first-in, first-out (“FIFO”) cost methods. For inventories valued using the LIFO method, we believe that the use of the LIFO method results in a matching of current costs and revenues. Inventories valued using the LIFO method represented approximately 35.9% and 34.6% of total inventories at March 31, 2015 and 2014, respectively. Inventory costs include material, labor, and overhead. If we had used only the FIFO method of inventory costing, inventories would have been $19,071 and $19,450 higher than those reported at March 31, 2015 and 2014, respectively.
We review the net realizable value of inventory on an ongoing basis, considering factors such as deterioration, obsolescence, and other items. We record an allowance for estimated losses when the facts and circumstances indicate that particular inventories will not be usable. If future market conditions vary from those projected, and our estimates prove to be inaccurate, we may be required to write-down inventory values and record an adjustment to cost of revenues.
Property, Plant, and Equipment. Our property, plant, and equipment consists of land and land improvements, buildings and leasehold improvements, machinery and equipment, information systems, radioisotope (cobalt-60), and construction in progress. Property, plant, and equipment are presented at cost less accumulated depreciation and depletion. We capitalize additions and improvements. Repairs and maintenance are charged to expense as they are incurred.
Land is not depreciated and construction in progress is not depreciated until placed in service. Depreciation of most assets is computed on the cost less the estimated salvage value by using the straight-line method over the estimated remaining useful lives. Depletion of radioisotope is computed using the annual decay factor of the material, which is similar to the sum-of-the-years-digits method.
We generally depreciate or deplete property, plant, and equipment over the useful lives presented in the following table:
Asset Type | Useful Life (years) | |
Land improvements | 3-40 | |
Buildings and leasehold improvements | 2-50 | |
Machinery and equipment | 2-20 | |
Information Systems | 2-20 | |
Radioisotope (cobalt-60) | 20 | |
When we sell, retire, or dispose of property, plant, and equipment, we remove the asset’s cost and accumulated depreciation from our Consolidated Balance Sheets. We recognize the net gain or loss on the sale or disposition in the Consolidated Statements of Income in the period when the transaction occurs.
Interest. We capitalize interest costs incurred during the construction of long-lived assets. We capitalized interest costs of $174 and $415 for the years ended March 31, 2015 and 2014, respectively.
56
STERIS CORPORATION AND SUBSIDIARIES
NOTES TO CONSOLIDATED FINANCIAL STATEMENTS
(dollars in thousands, except per share amounts)
Total interest expense for the years ended March 31, 2015, 2014, and 2013 was $19,187, $18,770, and $15,675, respectively.
Identifiable Intangible Assets. Our identifiable intangible assets include product technology rights, trademarks, licenses, and Customer relationships. We record these assets at cost, or when acquired as part of a business acquisition, at estimated fair value. We generally amortize identifiable intangible assets over periods ranging from 5 to 20 years using the straight-line method. Our intangible assets also include indefinite lived assets including certain trademarks and tradenames that were acquired in fiscal years 2015, 2014 and 2013. These assets are tested at least annually for impairment.
Investments. Investments in marketable securities are stated at fair value and are included in "Other assets" on the Consolidated Balance Sheets. Unrealized gains and losses on marketable securities classified as available-for-sale are recorded in Accumulated Other Comprehensive Income (Loss).
Asset Impairment Losses. Property, plant, equipment, and identifiable intangible assets are reviewed for impairment when indicators of impairment exist and circumstances indicate that the carrying value of such assets may not be recoverable. Impaired assets are recorded at the lower of carrying value or estimated fair value. We conduct this review on an ongoing basis and, if an impairment exists, we record the loss in the Consolidated Statements of Income during that period.
Asset Retirement Obligations. Beginning in fiscal year 2016 and thereafter, we expect to incur retirement obligations for certain assets. As a result we have recorded an initial liability for the asset retirement obligations (ARO) at fair value. Recognition of the ARO will include: the present value of a liability and offsetting asset, the subsequent accretion of that liability and depletion of the asset, and the periodic review of the ARO liability estimates and discount rates used in the analysis.
We provide additional information about our asset retirement obligations in note 6 to our consolidated financial statements titled, “Property, Plant and Equipment.”
Acquisitions of Business. Assets acquired and liabilities assumed in a business combination are accounted for at fair value on the date of acquisition. Costs related to the acquisition are expensed as incurred.
Goodwill. We perform our annual impairment test for goodwill in the third quarter of each year. We may consider qualitative indicators of the fair value of a reporting unit when it is unlikely that a reporting unit has impaired goodwill. We may also utilize a discounted cash flow analysis that requires certain assumptions and estimates be made regarding market conditions and our future profitability. In those circumstances we test goodwill for impairment by reviewing the book value compared to the fair value at the reporting unit level. We calculate the fair value of our reporting units based on the present value of estimated future cash flows. Considerable management judgment is necessary to evaluate the impact of operating and macroeconomic changes and to estimate future cash flows to measure fair value. Assumptions used in our impairment evaluations, such as forecasted growth rates and cost of capital, are consistent with internal projections and operating plans. We believe such assumptions and estimates are also comparable to those that would be used by other marketplace participants.
SYSTEM 1 Rebate Program. The Accrued SYSTEM 1 Rebate Program (the “Rebate Program”), initially recognized during the first quarter of fiscal 2011, was based upon the quantity of SYSTEM 1 processors eligible for rebates and the estimated value of rebates to be provided upon their return. The rebate portion of the Rebate Program was recognized as contra-revenue consistent with other returns and allowances offered to Customers. The estimated costs to facilitate the disposal of the returned SYSTEM 1 processors was recognized as cost of revenues. Both components were recorded as current liabilities. The key assumptions involved in the estimates associated with the Rebate Program included: the number and age of SYSTEM 1 processors eligible for rebates under the Rebate Program, the number of Customers that would elect to participate in the Rebate Program, the proportion of Customers that would choose each rebate option, and the estimated per unit costs of disposal.
The Rebate Program ended August 2, 2012. Customers utilized rebates totaling approximately $66,600 on orders placed since the initiation of the Rebate Program. The costs associated with the Rebate Program were lower than originally estimated because fewer Customers elected to participate in the Rebate Program than anticipated.
Self-Insurance Liabilities. We record a liability for self-insured risks that we retain for general and product liabilities, workers’ compensation, and automobile liabilities based on actuarial calculations. We use our historical loss experience and actuarial methods to calculate the liability. This liability includes estimates for both losses and incurred but not reported claims. We review the assumptions used to calculate the estimated liability at least annually to evaluate the adequacy of the amount recorded. We maintain insurance policies to cover losses greater than our estimated liability, which are subject to the terms and conditions of those policies.
57
STERIS CORPORATION AND SUBSIDIARIES
NOTES TO CONSOLIDATED FINANCIAL STATEMENTS
(dollars in thousands, except per share amounts)
We are also self-insured for employee medical claims. We estimate a liability for incurred but not reported claims based upon recent claims experience.
Benefit Plans. We sponsor defined benefit pension and other post-retirement welfare benefit plans for certain former employees. We determine our costs and obligations related to these plans by evaluating input from third-party professional advisors. These costs and obligations are affected by assumptions including the discount rate, expected long-term rate of return on plan assets, the annual rate of change in compensation for eligible employees, estimated changes in costs of healthcare benefits, and other factors. We review the assumptions used on an annual basis.
We recognize an asset for the overfunded status or a liability for the underfunded status of defined benefit pension and post-retirement benefit plans in our consolidated balance sheets. This amount is measured as the difference between the fair value of plan assets and the benefit obligation (the projected benefit obligation for pension plans and the accumulated post-retirement benefit obligation for other post-retirement benefit plans). Changes in the funded status of the plans are recorded in other comprehensive income in the year they occur. We measure plan assets and obligations as of the balance sheet date.
We provide additional information about our pension and other post-retirement welfare benefits plans in note 10 to our consolidated financial statements titled, “Benefit Plans.”
Fair Value of Financial Instruments. Except for long-term debt, our financial instruments are highly liquid or have short-term maturities.
We provide additional information about the fair value of our financial instruments in note 18 titled, “Fair Value Measurements.”
Foreign Currency Translation. Most of our operations use their local currency as their functional currency. Financial statements of international subsidiaries are translated into U.S. dollars using the exchange rate at each balance sheet date for assets and liabilities and a weighted average exchange rate for each period for revenues, expenses, gains and losses. Translation adjustments for international subsidiaries whose local currency is their functional currency are recorded as a component of accumulated other comprehensive income (loss) within shareholders’ equity. Transaction gains and losses resulting from fluctuations in currency exchange rates on transactions denominated in currencies other than the functional currency are recognized as incurred in the accompanying Consolidated Statements of Income, except for certain inter-company balances designated as long-term investments.
Forward and Swap Contracts. We enter into foreign currency forward contracts to hedge assets and liabilities denominated in foreign currencies, including inter-company transactions. We do not use derivative financial instruments for speculative purposes. These contracts are marked to market, with gains and losses recognized within “Selling, general, and administrative expenses” or "Cost of revenues" in the accompanying Consolidated Statements of Income.
Warranty. Warranties are provided on the sale of certain of our products and services and an accrual for estimated future claims is recorded at the time revenue is recognized. We estimate warranty expense based primarily on historical warranty claim experience.
Shipping and Handling. We record shipping and handling costs in costs of revenues. Shipping and handling costs charged to Customers are recorded as revenues in the period the product revenues are recognized.
Advertising Expenses. Costs incurred for communicating, advertising and promoting our products are generally expensed when incurred as a component of Selling, General and Administrative Expense. We incurred $9,732, $8,606, and $6,880 of advertising costs during the years ended March 31, 2015, 2014, and 2013, respectively.
Research and Development. We incur research and development costs associated with commercial products and expense these costs as incurred. If a Customer reimburses us for research and development costs, the costs are charged to the related contracts as costs of revenues.
Income Taxes. Our income tax expense includes United States federal, state and local, and foreign income taxes, and is based on reported pre-tax income. We defer income taxes for all temporary differences between pre-tax financial and taxable income and between the book and tax basis of assets and liabilities. We record valuation allowances to reduce net deferred tax assets to an amount that we expect will more-likely-than-not be realized. In making such a determination, we consider all available information, including scheduled reversals of deferred tax liabilities, projected future taxable income, tax planning strategies, and recent financial operations. In the event we were to determine that we would be able to realize our deferred income tax assets in the future in excess of their net recorded amount, we would make an adjustment to the valuation allowance which would reduce the provision for income taxes and the effective tax rate.
58
STERIS CORPORATION AND SUBSIDIARIES
NOTES TO CONSOLIDATED FINANCIAL STATEMENTS
(dollars in thousands, except per share amounts)
We evaluate uncertain tax positions in accordance with a two-step process. The first step is recognition: The determination of whether or not it is more-likely-than-not that a tax position will be sustained upon examination, including resolution of any related appeals or litigation processes, based on the technical merits of the position. In evaluating whether a tax position has met the more-likely-than-not recognition threshold, we presume that the position will be examined by the appropriate tax authority and that the tax authority will have full knowledge of all relevant information. The second step is measurement: A tax position that meets the more-likely-than-not threshold is measured to determine the amount of benefit to recognize in the financial statements. The measurement process requires the determination of the range of possible settlement amounts and the probability of achieving each of the possible settlements. The tax position is measured at the largest amount of benefit that is greater than fifty percent likely of being realized upon ultimate settlement. No tax benefits are recognized for positions that do not meet the more-likely-than-not threshold. Tax positions that previously failed to meet the more-likely-than-not threshold should be recognized in the first subsequent financial reporting period in which that threshold is met. Previously recognized tax positions that no longer meet the more-likely-than-not recognition threshold should be derecognized in the first subsequent financial reporting period in which the threshold is no longer met.
We describe income taxes further in note 9 to our consolidated financial statements titled, “Income Taxes.”
Medical Device Excise Tax. The Medical Device Excise Tax became effective January 1, 2013. The excise tax was mandated by the 2010 health care reform legislation and assesses a 2.3% tax on the sale or use of certain medical devices that are sold or manufactured in the United States. Many of our products are subject to the excise tax. The tax is included in cost of revenues in the period of sale. We incurred Medical Device Excise taxes of $7,917 and $7,390 during fiscal years 2015 and 2014, respectively.
Share-Based Compensation. We describe share-based compensation in note 15 to our consolidated financial statements titled, “Share-Based Compensation.” We measure the cost of employee services received in exchange for an award of equity instruments based on the grant-date fair value of the award. We record liability awards at fair value each reporting period and the change in fair value is reflected as share-based compensation expense in our Consolidated Statements of Income. The expense is classified as cost of goods sold, selling, general and administrative expenses or research and development expenses in a manner consistent with the employee’s compensation and benefits. These costs are recognized in the Consolidated Statement of Income over the period during which an employee is required to provide service in exchange for the award. Excess tax benefits realized from the exercise of stock options are reported as a financing cash inflow.
Restructuring. We recognize restructuring expenses as incurred. Asset impairment and accelerated depreciation expenses primarily relate to inventory write-downs for rationalized products and adjustments in the carrying value of the related facilities and machinery and equipment to their estimated fair value. In addition, the remaining useful lives of other property, plant, and equipment associated with the related operations are reevaluated based on the respective restructuring plan, which may result in the acceleration of depreciation and amortization of certain assets.
59
STERIS CORPORATION AND SUBSIDIARIES
NOTES TO CONSOLIDATED FINANCIAL STATEMENTS
(dollars in thousands, except per share amounts)
Recently Issued Accounting Standards Impacting the Company
Recently Issued Accounting Standards Impacting the Company are presented in the following table:
Standard | Date of Issuance | Description | Date of Adoption | Effect on the financial statements or other significant matters | ||||
Standards that have not yet adopted | ||||||||
ASU 2014-09, "Revenue from Contracts with Customers" | May 2014 | The standard will replace existing revenue recognition standards and significantly expand the disclosure requirements for revenue arrangements. It may be adopted either retrospectively or on a modified retrospective basis to new contracts and existing contracts with remaining performance obligations as of the effective date. The standard update is effective for annual periods beginning after December 15, 2016 and interim periods within that period, early adoption is not permitted. | N/A | We are currently in the process of evaluating the impact that the standard will have on our consolidated financial position, results of operations and cash flow. | ||||
2. RESTRUCTURING
The following summarizes our restructuring plans announced in current and prior fiscal years. We recognize restructuring expenses as incurred. In addition, we assess the property, plant and equipment associated with the related facilities for impairment.
Fiscal 2014 Restructuring Plan. During the fourth quarter of fiscal 2014, we adopted and announced a targeted restructuring plan primarily focused on the closure of the Hopkins manufacturing facility located in Mentor, Ohio (the “Fiscal 2014 Restructuring Plan”). As a result of this plan we will transfer operations located at Hopkins to other North American locations. We believe that by closing the operations at Hopkins we will more effectively utilize our existing North American manufacturing network while reducing operating costs.
We have incurred pre-tax expenses totaling $19,472 related to these actions, of which $11,696 was recorded as restructuring expenses and $7,776 was recorded in cost of revenues, with restructuring expenses of $17,376, $796, and $1,300 related to the Healthcare, Life Sciences and Isomedix segments, respectively.
Fiscal 2010 Restructuring Plan. During the fourth quarter of fiscal 2010 we adopted a restructuring plan primarily related to the transfer of the remaining operations in our Erie, Pennsylvania facility to the U.S. headquarters in Mentor, Ohio and the consolidation of our European Healthcare manufacturing operations into two central locations within Europe (the “Fiscal 2010 Restructuring Plan”). In addition, we rationalized certain products and eliminated certain positions.
Since the inception of the Fiscal 2010 Restructuring Plan, we have incurred pre-tax expenses totaling $9,294 related to these actions, of which $8,190 was recorded as restructuring expenses and $1,104 was recorded in cost of revenues. We do not expect to incur any significant additional restructuring expenses related to this plan. These actions are intended to enhance profitability and improve efficiencies.
The following tables summarize our total pre-tax restructuring expenses for fiscal 2015, fiscal 2014 and fiscal 2013:
60
STERIS CORPORATION AND SUBSIDIARIES
NOTES TO CONSOLIDATED FINANCIAL STATEMENTS
(dollars in thousands, except per share amounts)
Year Ended March 31, 2015 | Fiscal 2014 Restructuring Plan (1) | ||
Severance and other compensation related costs | $ | (616 | ) |
Product rationalization | (368 | ) | |
Asset impairment and accelerated depreciation | (38 | ) | |
Lease termination obligation and other | 263 | ||
Total restructuring (benefit) charges | $ | (759 | ) |
(1) | Includes $(368) in charges recorded in cost of revenues on Consolidated Statements of Income. |
Year Ended March 31, 2014 | Fiscal 2014 Restructuring Plan (1) | Fiscal 2010 Restructuring Plan | Total | ||||||
Severance and other compensation related costs | $ | 7,363 | $ | 127 | $ | 7,490 | |||
Asset impairment and accelerated depreciation | 3,621 | 990 | 4,611 | ||||||
Lease termination obligation and other | 1,103 | — | 1,103 | ||||||
Product rationalization | 8,144 | — | 8,144 | ||||||
Total restructuring charges | $ | 20,231 | $ | 1,117 | $ | 21,348 | |||
(1) | Includes $8,144 in charges recorded in cost of revenues on Consolidated Statements of Income. |
Year Ended March 31, 2013 | Fiscal 2010 Restructuring Plan | ||
Severance and other compensation related costs | $ | (918 | ) |
Lease termination obligation and other | 353 | ||
Total restructuring (benefit) charges | $ | (565 | ) |
Liabilities related to restructuring activities are recorded as current liabilities on the accompanying Consolidated Balance Sheets within “Accrued payroll and other related liabilities” and “Accrued expenses and other.” The following tables summarizes our restructuring liability balances and activity:
Fiscal 2014 Restructuring Plan | ||||||||||||||||
Fiscal 2015 | ||||||||||||||||
March 31, 2014 | Provision (1) | Payments/ Impairments | March 31, 2015 | |||||||||||||
Severance and termination benefits | $ | 6,389 | $ | (616 | ) | $ | (3,242 | ) | $ | 2,531 | ||||||
Lease termination obligations | 1,589 | 18 | (1,251 | ) | 356 | |||||||||||
Total | $ | 7,978 | $ | (598 | ) | $ | (4,493 | ) | $ | 2,887 | ||||||
(1) Certain amounts reported include the impact of foreign currency movements relative to the U.S. dollar.
61
STERIS CORPORATION AND SUBSIDIARIES
NOTES TO CONSOLIDATED FINANCIAL STATEMENTS
(dollars in thousands, except per share amounts)
Fiscal 2014 Restructuring Plan | ||||||||||||||||
Fiscal 2014 | ||||||||||||||||
March 31, 2013 | Provision | Payments/ Impairments (1) | March 31, 2014 | |||||||||||||
Severance and termination benefits | $ | — | $ | 6,429 | $ | (40 | ) | $ | 6,389 | |||||||
Lease termination obligations and other | — | 1,589 | — | 1,589 | ||||||||||||
Total | $ | — | $ | 8,018 | $ | (40 | ) | $ | 7,978 | |||||||
(1) Certain amounts reported include the impact of foreign currency movements relative to the U.S. dollar.
3. BUSINESS ACQUISITIONS
Proposed Combination with Synergy Health plc
On October 13, 2014, we announced that we were commencing a “recommended offer” under U.K. law to acquire all outstanding shares of Synergy Health plc (“Synergy”) in a cash and stock transaction valued at £19.50 ($31.35) per Synergy share, or a total of approximately $1.9 billion based on STERIS’s closing stock price of $56.38 per share on October 10, 2014, through a newly formed U.K. entity that also would indirectly acquire all of the outstanding stock of STERIS (the “Combination”). Based on STERIS’s closing stock price of $67.00 and exchange rates as of February 3, 2015, the total value of the cash and stock transaction is approximately $2.1 billion or £23.42 ($35.52) per Synergy share. The Combination is subject to certain customary closing conditions, including approvals by STERIS and Synergy shareholders as well as regulatory approvals by the U.S. Federal Trade Commission (“FTC”), which is currently reviewing the Combination. Both companies have entered into a timing agreement with the FTC under the terms of which the companies have agreed not to close the Combination before June 2, 2015 unless the FTC first closes its investigation. Both companies are cooperating with the FTC staff in the review of the Combination. No assurance can be provided as to when or if the transaction will be completed.
Total costs of approximately $22,181 before tax, were incurred in fiscal year 2015 related to the Combination and are reported in selling, general and administrative expense.
Fiscal Year 2015
Dana Products, Inc.
On March 9, 2015 the Company purchased all the outstanding shares of capital stock of Dana Products, Inc. ("Dana"), an Illinois manufacturer of chemical indicators used in steam sterilizers.
The purchase price was approximately $12,002, subject to a customary working capital adjustment. Dana will be integrated into the Healthcare business segment. The purchase price has been preliminarily allocated to the net assets acquired based on fair values at the acquisition date.
We anticipate that the acquisition of Dana will qualify for a joint election tax benefit under Section 338(h)(10) of the Internal Revenue Code, which allows goodwill and intangibles to be fully deductible for tax purposes. Intangible assets acquired consist of product names and patents, which will be amortized on a straight line basis over their useful lives of up to ten years. Acquisition related costs were insignificant.
AGAPE Instruments Service, Inc.
On December 31, 2014, a newly formed subsidiary of the Company purchased the assets and assumed certain liabilities of AGAPE Instruments Service, Inc. ("AGAPE"), an Ohio based provider of certification services.
The purchase price was approximately $3,415, including a customary working capital adjustment. The AGAPE business will be integrated into the Life Sciences business segment. The purchase price has been allocated to the net assets acquired based on fair values at the acquisition date.
Intangible assets acquired consist of Customer relationships, which will be amortized on a straight line basis over seven years. Acquisition related costs were insignificant.
Integrated Medical Systems International, Inc.
62
STERIS CORPORATION AND SUBSIDIARIES
NOTES TO CONSOLIDATED FINANCIAL STATEMENTS
(dollars in thousands, except per share amounts)
On May 9, 2014, we completed the previously announced acquisition of all the outstanding shares of capital stock of Integrated Medical Systems International, Inc. ("IMS") pursuant to a Stock Purchase Agreement dated March 31, 2014. The purchase price was approximately $165,000, subject to a customary working capital adjustment. In addition, we purchased certain real estate used in the IMS business for approximately $10,000. IMS has facilities located in Alabama, Florida and Maryland and provides a variety of services including: endoscope repair, surgical instrument management and sterile processing consulting. IMS has been integrated into our Healthcare segment as part of our Specialty Services reporting unit.
We recorded acquisition related costs of $3,208, before tax, which are reported in selling, general and administrative expense. We anticipate that the acquisition of IMS will qualify for a joint election tax benefit under Section 338(h)(10) of the Internal Revenue Code, which allows goodwill and intangibles to be fully deductible for tax purposes. Intangible assets acquired consist of trade names and Customer relationships, which are being amortized on a straight line basis over their useful lives of up to nine years, with the exception of the IMS trade name which has an indefinite life.
Fiscal Year 2014
Florida Surgical Repair, Inc.
On December 31, 2013, we purchased the assets and assumed certain liabilities of Florida Surgical Repair, Inc. ("FSR"), a provider of surgical instrument and surgical equipment repair services to hospitals and surgery centers in Florida. The purchase price was approximately $5,779, subject to a customary working capital adjustment. FSR has been integrated into the Healthcare business segment. The purchase price has been allocated to the net assets acquired based on fair values at the acquisition date.
The intangible assets acquired consist of Customer relationships, which are being amortized on a straight line basis over nine years. Acquisition related costs were insignificant.
Life Systems, Inc.
On February 4, 2014, we purchased the assets and assumed certain liabilities of Life Systems, Inc. ("LSI"), a provider of sales and service in the endoscope repair and certified pre-owned equipment markets, located in St. Louis, Missouri.
The purchase price was approximately $24,500, subject to a customary working capital adjustment, which included $1,500 in restricted stock granted to one of the sellers. LSI has been integrated into the Healthcare business segment. The purchase price has been allocated to the net assets acquired based on fair values at the acquisition date.
We recorded acquisition related costs of approximately $311, before tax, which are reported in selling, general and administrative expenses.The intangible assets acquired consist of Customer relationships, which are being amortized on a straight line basis over thirteen years.
Eschmann Holdings Ltd.
On February 10, 2014, we purchased the capital stock of Eschmann Holdings Ltd. ("Eschmann"), a provider of surgical and infection prevention solutions and services used primarily in hospitals, surgery centers and dental offices in the United Kingdom.
The purchase price was approximately £25 million British pounds sterling (approximately $41,645 at the acquisition date). We paid £22 million British pounds sterling at the closing date and paid an additional £3 million British pounds sterling of deferred consideration in the first quarter of fiscal 2015. We also paid a customary working capital adjustment of £0.5 million British pounds sterling in the first quarter of fiscal 2015. Eschmann has been integrated into the Healthcare business segment. The purchase price has been allocated to the net assets acquired based on fair values at the acquisition date.
We recorded acquisition related costs of approximately $754, before tax, which are reported in selling, general and administrative expenses. The intangible assets acquired consist of tradenames, developed technology, and Customer relationships, which are being amortized on a straight line basis over six to thirteen years, with the exception of the Eschmann tradename which has an indefinite life.
Each of these fiscal 2015 and fiscal 2014 acquisitions were funded with cash on hand and/or credit facility borrowings. The Consolidated Financial Statements include the operating results of each acquisition from the respective acquisition dates. Pro-forma results of operations for fiscal 2015 and fiscal 2014 periods have not been presented because the effects of the acquisitions were not material to our financial results.
The table below summarizes the allocation of the purchase price to the net assets acquired based on fair values at the acquisition dates for our fiscal 2015 and fiscal 2014 acquisitions.
63
STERIS CORPORATION AND SUBSIDIARIES
NOTES TO CONSOLIDATED FINANCIAL STATEMENTS
(dollars in thousands, except per share amounts)
Fiscal Year 2015 | Fiscal Year 2014 | |||||||||||||||||||||
Dana (1) | AGAPE | IMS | FSR | LSI | Eschmann | |||||||||||||||||
Cash | $ | 135 | $ | — | $ | — | $ | — | $ | — | $ | 2,545 | ||||||||||
Accounts receivable | 617 | 342 | 16,594 | 388 | 2,341 | 5,336 | ||||||||||||||||
Inventory | 388 | — | 8,478 | 402 | 2,727 | 10,017 | ||||||||||||||||
Property, plant and equipment | 400 | — | 15,074 | 98 | 301 | 6,262 | ||||||||||||||||
Other assets | — | — | 842 | 11 | 117 | 475 | ||||||||||||||||
Intangible assets | 6,363 | 1,200 | 62,000 | 2,765 | 4,462 | 21,128 | ||||||||||||||||
Goodwill | 4,242 | 1,899 | 81,587 | 2,131 | 16,230 | 14,274 | ||||||||||||||||
Total Assets | 12,145 | 3,441 | 184,575 | 5,795 | 26,178 | 60,037 | ||||||||||||||||
Accounts payable | (99 | ) | (26 | ) | (4,833 | ) | (16 | ) | (1,649 | ) | (2,507 | ) | ||||||||||
Current liabilities | (44 | ) | — | (6,837 | ) | — | (29 | ) | (11,850 | ) | ||||||||||||
Non-current liabilities | — | — | — | — | — | (4,035 | ) | |||||||||||||||
Total Liabilities | (143 | ) | (26 | ) | (11,670 | ) | (16 | ) | (1,678 | ) | (18,392 | ) | ||||||||||
Net Assets | $ | 12,002 | $ | 3,415 | $ | 172,905 | $ | 5,779 | $ | 24,500 | $ | 41,645 | ||||||||||
(1) Purchase price allocation is still preliminary as of March 31, 2015, as valuations have not been finalized.
4. GOODWILL AND INTANGIBLE ASSETS
Goodwill is tested annually for impairment. Further, goodwill is reviewed for impairment whenever events or changes in circumstances indicate there may be a possible permanent loss of value. We performed our annual impairment tests for goodwill and indefinite life intangible assets during the third quarter of fiscal 2015. These tests confirmed that the fair value of STERIS’s reporting units and indefinite life intangible assets exceed their respective carrying values and that no impairment loss was required to be recognized in fiscal 2015 or for any prior periods.
However, during the second quarter of fiscal 2015, a new branding strategy was adopted as part of the integration of IMS into the Specialty Services reporting unit, which operates under our Healthcare segment, for surgical instrument and endoscope repair services. This strategy resulted in a reduction in the carrying value of the Spectrum trade-name which will be used solely for Specialty Services product revenues going forward. We have estimated the fair value of the Spectrum trade-name using the relief from royalty method and concluded that the carrying value of the trade-name exceeded its fair value. As a result, an impairment charge of approximately $5,561 was recorded to reduce the carrying value of the intangible asset. The impairment charge is reported in the selling, general and administrative expense line of the Consolidated Statements of Income.
Our fiscal 2014 and fiscal 2015 acquisitions are described in note 3 to our consolidated financial statements titled, "Business Acquisitions".
Future impairment tests of goodwill and indefinite life intangible assets will be performed annually in the fiscal third quarter, or sooner if a triggering event occurs.
Changes to the carrying amount of goodwill for the years ended March 31, 2015 and 2014 were as follows:
64
STERIS CORPORATION AND SUBSIDIARIES
NOTES TO CONSOLIDATED FINANCIAL STATEMENTS
(dollars in thousands, except per share amounts)
Healthcare Segment | Life Sciences Segment | STERIS Isomedix Services Segment | Total | ||||||||||||
Balance at March 31, 2013 | $ | 373,668 | $ | 32,763 | $ | 83,035 | $ | 489,466 | |||||||
Goodwill acquired or allocated | 22,783 | — | — | 22,783 | |||||||||||
Foreign currency translation adjustments | 3,215 | 1,547 | — | 4,762 | |||||||||||
Balance at March 31, 2014 | 399,666 | 34,310 | 83,035 | 517,011 | |||||||||||
Goodwill acquired or allocated | 87,175 | 1,899 | — | 89,074 | |||||||||||
Foreign currency translation adjustments | (11,124 | ) | (2,320 | ) | — | (13,444 | ) | ||||||||
Balance at March 31, 2015 | $ | 475,717 | $ | 33,889 | $ | 83,035 | $ | 592,641 | |||||||
The fiscal 2015 increase in goodwill associated with the Healthcare segment resulted from the acquisitions of the capital stock of IMS and Dana and foreign currency fluctuations. The increase associated with the Life Science segment resulted from the acquisition of the assets of AGAPE, and foreign currency fluctuations. Our fiscal 2015 acquisitions are described in note 3 to our consolidated financial statements titled, "Business Acquisitions".
The fiscal 2014 increase in goodwill associated with the Healthcare segment resulted from the acquisitions of the assets of FSR and LSI, and the capital stock of Eschmann, as described in note 3 to our consolidated financial statements titled, "Business Acquisitions", and foreign currency fluctuations. The increase associated with the Life Sciences segment resulted from foreign currency fluctuations.
Information regarding our intangible assets is as follows:
March 31, 2015 | March 31, 2014 | ||||||||||||||
Gross Carrying Amount | Accumulated Amortization | Gross Carrying Amount | Accumulated Amortization | ||||||||||||
Customer relationships | $ | 134,014 | $ | 35,516 | $ | 87,747 | $ | 26,808 | |||||||
Non-compete agreements | 3,654 | 3,377 | 3,766 | 3,315 | |||||||||||
Patents and technology | 178,290 | 56,861 | 173,287 | 46,111 | |||||||||||
Trademarks and tradenames | 61,896 | 14,096 | 55,006 | 12,868 | |||||||||||
Other | 10 | 10 | 13 | 13 | |||||||||||
Total | $ | 377,864 | $ | 109,860 | $ | 319,819 | $ | 89,115 | |||||||
Certain trademarks and tradenames acquired in fiscal 2015, 2014 and 2013 are indefinite-lived assets. Approximate carrying value of these assets at March 31, 2015 was $35,490. Total amortization expense for finite-lived intangible assets was $24,500, $18,612, and $13,068 for the years ended March 31, 2015, 2014, and 2013, respectively. Based upon the current amount of intangible assets subject to amortization, the amortization expense for each of the five succeeding fiscal years is estimated to be as follows:
2016 | 2017 | 2018 | 2019 | 2020 and thereafter | |||||||||||||||
Estimated amortization expense | $ | 25,233 | $ | 24,651 | $ | 24,580 | $ | 24,495 | $ | 23,553 | |||||||||
The estimated annual amortization expense presented in the preceding table has been calculated based upon March 31, 2015 foreign currency exchange rates.
65
STERIS CORPORATION AND SUBSIDIARIES
NOTES TO CONSOLIDATED FINANCIAL STATEMENTS
(dollars in thousands, except per share amounts)
5. INVENTORIES, NET
Inventories, net consisted of the following:
March 31, | 2015 | 2014 | ||||||
Raw materials | $ | 67,095 | $ | 61,197 | ||||
Work in process | 22,696 | 24,454 | ||||||
Finished goods | 107,695 | 104,931 | ||||||
LIFO reserve | (19,071 | ) | (19,450 | ) | ||||
Reserve for excess and obsolete inventory | (17,597 | ) | (15,986 | ) | ||||
Inventories, net | $ | 160,818 | $ | 155,146 | ||||
6. PROPERTY, PLANT AND EQUIPMENT
Information related to the major categories of our depreciable assets is as follows:
March 31, | 2015 | 2014 | ||||||
Land and land improvements (1) | $ | 40,668 | $ | 33,601 | ||||
Buildings and leasehold improvements | 263,007 | 256,879 | ||||||
Machinery and equipment | 375,555 | 360,977 | ||||||
Information systems | 104,049 | 100,349 | ||||||
Radioisotope | 289,778 | 258,547 | ||||||
Construction in progress (1) | 47,690 | 35,016 | ||||||
Total property, plant, and equipment | 1,120,747 | 1,045,369 | ||||||
Less: accumulated depreciation and depletion | (627,694 | ) | (590,959 | ) | ||||
Property, plant, and equipment, net | $ | 493,053 | $ | 454,410 | ||||
(1) | Land is not depreciated. Construction in progress is not depreciated until placed in service. |
Depreciation and depletion expense were $61,481, $57,037 and $55,085, for the years ended March 31, 2015, 2014, and 2013, respectively.
Rental expense for operating leases was $18,602, $17,643, and $15,664 for the years ended March 31, 2015, 2014, and 2013, respectively. Operating leases relate to manufacturing, warehouse and office space, service facilities, vehicles, equipment, and communication systems. Certain lease agreements grant us varying renewal and purchase options.
Future minimum annual rentals payable under noncancelable operating lease agreements at March 31, 2015 were as follows:
Operating Leases | |||
2016 | $ | 16,411 | |
2017 | 12,428 | ||
2018 | 9,149 | ||
2019 | 5,419 | ||
2020 and thereafter | 4,273 | ||
Total Minimum Lease Payments | $ | 47,680 | |
In the preceding table, the future minimum annual rentals payable under noncancelable leases denominated in foreign currencies have been calculated based upon March 31, 2015 foreign currency exchange rates.
66
STERIS CORPORATION AND SUBSIDIARIES
NOTES TO CONSOLIDATED FINANCIAL STATEMENTS
(dollars in thousands, except per share amounts)
Asset Retirement Obligations
We provide contract sterilization services including gamma irradiation which utilizes cobalt-60 in the form of cobalt pencils. Prior to fiscal 2016, the removal and disposal of depleted cobalt pencils was provided by our cobalt vendors for no charge or an immaterial charge. Beginning in fiscal 2016 and thereafter, we expect to incur costs associated with the disposal of these depleted assets. As a result we have recorded an initial liability for the asset retirement obligations (ARO) at fair value. Recognition of the ARO will include: the present value of a liability and offsetting asset, the subsequent accretion of that liability and depletion of the asset, and the periodic review of the ARO liability estimates and discount rates used in the analysis.
The following table summarizes the activity in the liability for asset retirement obligations.
Asset Retirement Obligations | |||
Balance at March 31, 2014 | $ | — | |
Liabilities incurred during the period | 8,083 | ||
Liabilities settled during the period | — | ||
Accretion expense and other provisions | — | ||
Balance at March 31, 2015 | $ | 8,083 | |
7. DEBT
Indebtedness was as follows:
March 31, | 2015 | 2014 | ||||||
Private Placement | $ | 340,000 | $ | 340,000 | ||||
Credit Agreement and Swing Line Facility | 283,250 | 153,480 | ||||||
Total long term debt | $ | 623,250 | $ | 493,480 | ||||
In February 2013, we issued $100,000 of senior notes in a private placement to certain institutional investors in an offering that was exempt from the registration requirements of the Securities Act of 1933. Of the $100,000 of notes, $47,500 have a maturity of nine years and 10 months from issuance at an annual interest rate of 3.20%, an additional $40,000 have a maturity of 11 years and 10 months from issuance at an annual interest rate of 3.35%, and the remaining $12,500 have a maturity of 14 years and 10 months from issuance at an annual interest rate of 3.55%. These borrowings were used primarily for the repayment of then existing credit facility debt. The agreements governing these notes and the notes were amended and restated in their entirety on March 31, 2015. The amended and restated agreements, which have been consolidated into a single agreement, contain leverage and interest coverage covenants.
In December 2012, we issued $100,000 of senior notes in a private placement to certain institutional investors in an offering that was exempt from the registration requirements of the Securities Act of 1933. Of the $100,000 of notes, $47,500 have a maturity of 10 years from issuance at an annual interest rate of 3.20%, an additional $40,000 have a maturity of 12 years from issuance at an annual interest rate of 3.35%, and the remaining $12,500 have a maturity of 15 years from issuance at an annual interest rate of 3.55%. These borrowings were used primarily for the repayment of then existing credit facility debt. The agreements governing these notes and the notes were amended and restated in their entirety on March 31, 2015. The amended and restated agreements, which have been consolidated into a single agreement, contain leverage and interest coverage covenants.
On August 15, 2008, we issued $150,000 of senior notes, of which $120,000 currently remain outstanding, in a private placement to certain institutional investors in an offering that was exempt from the registration requirements of the Securities Act of 1933. Of the outstanding notes $85,000 have a maturity of 10 years from issuance at an annual interest rate of 6.33%, and the remaining $35,000 have a maturity of 12 years from issuance at an annual interest rate of 6.43%. The agreements governing these notes and the notes were amended and restated in their entirety on March 31, 2015. The amended and restated agreements, which have been consolidated into a single agreement, contain leverage and interest coverage covenants.
67
STERIS CORPORATION AND SUBSIDIARIES
NOTES TO CONSOLIDATED FINANCIAL STATEMENTS
(dollars in thousands, except per share amounts)
In December 2003, we issued $100,000 of senior notes, of which $20,000 currently remain outstanding, in a private placement to certain institutional investors in an offering that was exempt from the registration requirements of the Securities Act of 1933. The remaining $20,000 have a maturity of 12 years from issuance at an annual interest rate of 5.38%. The agreements governing these notes and the notes were amended and restated in their entirety on March 31, 2015. The amended and restated agreements, which have been consolidated into a single agreement, contain leverage and interest coverage covenants.
On March 31, 2015 we entered into a Credit Agreement (the "Credit Agreement") with various financial institutions as lenders, and JPMorgan Chase Bank, N.A., as Administrative Agent. The Credit Agreement replaced the Company’s Third Amended and Restated Credit Agreement dated April 13, 2012 with KeyBank National Association, as Administrative Agent, and the other lenders party thereto, as amended, and the Company’s Swing Line Facility (Committed Line of Credit) with PNC Bank, National Association, which agreements were terminated and all outstanding borrowings thereunder were repaid on March 31, 2015. The Credit Agreement provides $1,250,000 of credit, in the form of a $850,000 revolver facility, which may be utilized for revolving credit borrowings, swing line borrowings and letters of credit, with sublimits for swing line borrowings and letters of credit. The Credit Agreement also contains a $400,000 term loan facility. The revolver and term loan facilities may be increased in specified circumstances by up to $500,000. The term loan facility may not be utilized unless, among other conditions, the Combination is consummated, and will terminate if not used at that time. Likewise only $500,000 of the revolver may be utilized unless and until the Combination is consummated. For more information on the Combination refer to note 3 of our consolidated financial statements titled, "Business Acquisitions". Term loans are repayable quarterly pursuant to a specified amortization schedule, with principal payments increasing from 1.25% to 2.50% over the term, and with a balloon payment for the remaining unpaid balance at maturity. The Credit Agreement will mature on March 31, 2020, and all unpaid borrowings, together with accrued and unpaid interest thereon, are repayable on that date. The Credit Agreement contains leverage and interest coverage covenants.
On March 31, 2015, the Bridge Credit Agreement we had obtained on October 13, 2014 with various financial institutions as lenders and Bank of America N.A. as Administrative Agent, was amended and restated in its entirety (as so amended and restated, the “Amended Bridge Credit Agreement”). Under the Amended Bridge Credit Agreement, the lenders have agreed to provide senior unsecured debt financing, to consist of up to £340,000 of commitments, and up to $1,050,000 of commitments. Proceeds of borrowings under the Amended Bridge Credit Agreement may be used to (i) finance the payment of the cash consideration for the Combination, and related fees and expenses and (ii) to pay or refinance our existing debt and Synergy debt. Per the terms of the Amended Bridge Credit Agreement and as a result of the execution of the Credit Agreement and of the effectiveness of the amendment of certain of our private placement notes and note purchase agreements, the Commitments of the lenders under the Amended Bridge Credit Agreement were reduced by an aggregate of $520,000 on March 31, 2015. This resulted in an outstanding USD commitment of $530,000 and a GBP commitment of £340,000 under the Amended Bridge Credit Agreement. The foregoing reduction treatment also would have applied under the Bridge Credit Agreement. The Amended Bridge Credit Agreement will mature on the 364th day after the Combination closing, and all unpaid borrowings, together with accrued and unpaid interest thereon, are repayable on that date. The Amended Bridge Credit Agreement contains leverage and interest coverage covenants. For more information on the Combination refer to note 3 of our consolidated financial statements titled, "Business Acquisitions".
As of March 31, 2015, a total $283,250 of indebtedness was outstanding under the Credit Agreement.
At March 31, 2015, we were in compliance with all financial covenants associated with our indebtedness.
The combined annual aggregate amount of maturities of our outstanding debt by fiscal year is as follows:
2016 | $ | 20,000 | |
2017 | — | ||
2018 | — | ||
2019 | 85,000 | ||
2020 and thereafter | 518,250 | ||
Total | $ | 623,250 | |
68
STERIS CORPORATION AND SUBSIDIARIES
NOTES TO CONSOLIDATED FINANCIAL STATEMENTS
(dollars in thousands, except per share amounts)
8. ADDITIONAL CONSOLIDATED BALANCE SHEETS INFORMATION
Additional information related to our Consolidated Balance Sheets is as follows:
March 31, | 2015 | 2014 | ||||||
Accrued payroll and other related liabilities: | ||||||||
Compensation and related items | $ | 16,680 | $ | 19,418 | ||||
Accrued vacation/paid time off | 5,539 | 6,172 | ||||||
Accrued bonuses | 30,159 | 18,451 | ||||||
Accrued employee commissions | 12,842 | 11,322 | ||||||
Accrued pension | 6,186 | — | ||||||
Other postretirement benefit obligations-current portion | 2,789 | 2,950 | ||||||
Other employee benefit plans' obligations-current portion | 610 | 461 | ||||||
Total accrued payroll and other related liabilities | $ | 74,805 | $ | 58,774 | ||||
Accrued expenses and other: | ||||||||
Deferred revenues | $ | 34,910 | $ | 39,441 | ||||
Self-insured risk reserves-current portion | 6,897 | 4,656 | ||||||
Accrued dealer and distributor commissions, fees and rebates | 13,591 | 10,017 | ||||||
Accrued warranty | 5,579 | 7,765 | ||||||
Asset retirement obligation-current portion | 1,092 | — | ||||||
Other | 39,963 | 31,423 | ||||||
Total accrued expenses and other | $ | 102,032 | $ | 93,302 | ||||
Other liabilities: | ||||||||
Self-insured risk reserves-long-term portion | $ | 12,052 | $ | 10,689 | ||||
Other postretirement benefit obligations-long-term portion | 18,489 | 18,393 | ||||||
Defined benefit pension plans obligations-long-term portion | 119 | 691 | ||||||
Other employee benefit plans obligations-long-term portion | 6,634 | 6,013 | ||||||
Asset retirement obligation-long-term portion | 6,991 | — | ||||||
Other | 3,049 | 3,091 | ||||||
Total other liabilities | $ | 47,334 | $ | 38,877 | ||||
9. INCOME TAXES
Income from continuing operations before income taxes was as follows:
Years Ended March 31, | 2015 | 2014 | 2013 | ||||||||
United States operations | $ | 161,165 | $ | 122,245 | $ | 175,743 | |||||
Non-United States operations | 47,655 | 66,131 | 51,355 | ||||||||
$ | 208,820 | $ | 188,376 | $ | 227,098 | ||||||
69
STERIS CORPORATION AND SUBSIDIARIES
NOTES TO CONSOLIDATED FINANCIAL STATEMENTS
(dollars in thousands, except per share amounts)
The components of the provision for income taxes related to income from continuing operations consisted of the following:
Years Ended March 31, | 2015 | 2014 | 2013 | ||||||||
Current: | |||||||||||
United States federal | $ | 52,234 | $ | 24,016 | $ | 22,259 | |||||
United States state and local | 8,551 | 5,991 | 4,893 | ||||||||
Non-United States | 12,475 | 16,449 | 13,516 | ||||||||
73,260 | 46,456 | 40,668 | |||||||||
Deferred: | |||||||||||
United States federal | 1,436 | 10,501 | 26,550 | ||||||||
United States state and local | 214 | 1,473 | (10 | ) | |||||||
Non-United States | (1,154 | ) | 504 | (87 | ) | ||||||
496 | 12,478 | 26,453 | |||||||||
Total Provision for Income Taxes | $ | 73,756 | $ | 58,934 | $ | 67,121 | |||||
The total provision for income taxes can be reconciled to the tax computed at the United States federal statutory tax rate as follows:
Years Ended March 31, | 2015 | 2014 | 2013 | |||||
United States federal statutory tax rate | 35.0 | % | 35.0 | % | 35.0 | % | ||
Increase (decrease) in accruals for uncertain tax positions | — | % | (5.1 | )% | 3.6 | % | ||
State and local taxes, net of federal income tax benefit | 2.8 | % | 2.6 | % | 2.1 | % | ||
Increase in valuation allowances | 2.1 | % | 1.5 | % | 1.1 | % | ||
Foreign income tax credit | (1.0 | )% | (2.0 | )% | (0.5 | )% | ||
Difference in non-United States tax rates | (3.6 | )% | (0.1 | )% | (2.5 | )% | ||
U.S. manufacturing deduction | (1.6 | )% | (1.2 | )% | (1.3 | )% | ||
U.S. Tax Benefit resulting from European Restructuring | — | % | (0.6 | )% | (7.8 | )% | ||
Capitalized Acquisition Costs | 2.2 | % | — | % | — | % | ||
All other, net | (0.6 | )% | 1.2 | % | (0.1 | )% | ||
Total Provision for Income Taxes | 35.3 | % | 31.3 | % | 29.6 | % | ||
Unrecognized Tax Benefits. We classify uncertain tax positions and related interest and penalties as long-term liabilities within “Other liabilities” in our accompanying Consolidated Balance Sheets, unless they are expected to be paid within 12 months, in which case, the uncertain tax positions would be classified as current liabilities within “Accrued income taxes.” We recognize interest and penalties related to unrecognized tax benefits within “Income tax expense” in our accompanying Consolidated Statements of Income.
A reconciliation of the beginning and ending balances of the total amounts of unrecognized tax benefits is as follows:
70
STERIS CORPORATION AND SUBSIDIARIES
NOTES TO CONSOLIDATED FINANCIAL STATEMENTS
(dollars in thousands, except per share amounts)
Years Ended March 31, | 2014 | ||
Unrecognized Tax Benefits Balance at April 1 | $ | 9,362 | |
Increases for tax provisions of prior years | — | ||
Decreases for tax provisions of prior years | — | ||
Increases for tax provisions of current year | — | ||
Decreases for tax provisions of current year | — | ||
Settlements | (9,244 | ) | |
Lapse of statute of limitations | (118 | ) | |
Unrecognized Tax Benefits Balance at March 31 | $ | — | |
For the year ended March 31, 2015, no interest and penalties were recognized. For the year ended March 31, 2014, current income tax expense includes a benefit of $(276) for interest, and a benefit of $(31) for penalties. As of March 31, 2015 and 2014, we had no unrecognized tax benefits and have not recorded any liability for interest and penalties.
We operate in numerous taxing jurisdictions and are subject to regular examinations by various United States federal, state and local, as well as foreign jurisdictions. We are no longer subject to United States federal examinations for years before fiscal 2014 and, with limited exceptions, we are no longer subject to United States state and local, or non-United States, income tax examinations by tax authorities for years before fiscal 2010. We remain subject to tax authority audits in various jurisdictions wherever we do business. We do not expect the results of these examinations to have a material adverse effect on our consolidated financial statements.
Deferred Taxes. The significant components of the deferred tax assets and liabilities recorded in our accompanying balance sheets at March 31, 2015 and 2014 were as follows:
March 31, | 2015 | 2014 | |||||
Deferred Tax Assets: | |||||||
Post-retirement benefit accrual | $ | 8,130 | $ | 8,171 | |||
Compensation | 24,374 | 22,008 | |||||
Net operating loss carryforwards | 13,090 | 12,518 | |||||
Accrued expenses | 6,808 | 6,681 | |||||
Insurance | 4,071 | 3,689 | |||||
Deferred income | 6,148 | 5,265 | |||||
Bad debt | 1,941 | 2,191 | |||||
Pension | 2,781 | 408 | |||||
Other | 464 | 965 | |||||
Deferred Tax Assets | 67,807 | 61,896 | |||||
Less: Valuation allowance | 14,380 | 12,541 | |||||
Total Deferred Tax Assets | 53,427 | 49,355 | |||||
Deferred Tax Liabilities: | |||||||
Depreciation and depletion | 50,559 | 50,265 | |||||
Intangibles | 38,121 | 36,367 | |||||
Other | 3,710 | 5,692 | |||||
Total Deferred Tax Liabilities | 92,390 | 92,324 | |||||
Net Deferred Tax Assets (Liabilities) | $ | (38,963 | ) | $ | (42,969 | ) | |
At March 31, 2015, we had federal operating loss carryforwards of $635, which can be utilized subject to certain limitations, and foreign operating loss carry forwards of $45,454. The majority of the foreign carryforwards have a definite expiration period and will expire if unused between fiscal years 2016 and 2022. In addition, we have recorded tax benefits of
71
STERIS CORPORATION AND SUBSIDIARIES
NOTES TO CONSOLIDATED FINANCIAL STATEMENTS
(dollars in thousands, except per share amounts)
$1,107 related to state operating loss carryforwards. At March 31, 2015, we had $71 of tax credit carryforwards. These credit carryforwards expire between fiscal 2017 and fiscal 2026.
We review the need for a valuation allowance against our deferred tax assets. A valuation allowance of $14,380 has been applied to a portion of the net deferred tax assets because we do not believe it is more-likely-than-not that we will receive future benefit. The valuation allowance increased during fiscal 2015 by $1,839.
At March 31, 2015, cumulative undistributed earnings of international operations amounted to approximately $224,411. These earnings are indefinitely reinvested in international operations. Accordingly, no provision has been made for deferred taxes related to the future repatriation of such earnings, nor is it practicable to determine the amount of this liability.
At March 31, 2014, we had a current prepaid income tax position. This was mainly due to the timing of U.S. Federal income tax estimated payments and a prior year overpayment carryforward.
10. BENEFIT PLANS
We provide defined benefit pension plans for certain former manufacturing and plant administrative personnel as determined by collective bargaining agreements or employee benefit standards set at the time of acquisition of certain businesses. In addition to providing pension benefits to certain employees, we sponsor an unfunded post-retirement welfare benefits plan for two groups of United States retirees; including the same retirees who receive pension benefits under the United States defined benefit pension plan. Benefits under this plan include retiree life insurance and retiree medical insurance, including prescription drug coverage.
In July 2014, the Board of Directors of American Sterilizer Company (“AMSCO”) approved the termination of the American Sterilizer Company Retirement Income Plan (“Plan”) effective October 1, 2014. An Application for Determination to Terminate the Plan was filed with the Internal Revenue Service (IRS) on August 22, 2014. A Notice of Intent to Terminate was mailed to the affected parties on July 30, 2014, with a copy furnished to the Pension Benefit Guaranty Corporation (PBGC) on October 31, 2014, at the PBGC’s request, and a Form 500 Standard Termination Notice was filed with the PBGC on November 17, 2014. The 60-day PBGC waiting period lapsed without objection by the PBGC. Plan participants have been advised of the termination and the Plan assets have been largely de-risked. AMSCO and the Plan are awaiting receipt of a favorable determination from the IRS. Upon receipt of the determination, the Plan fiduciaries will solicit bids for the purchase of one or more annuity contracts from insurers to provide Plan benefits. Once an annuity provider or providers has been selected, Plan assets will be transferred to the provider and any additional sums necessary to purchase the contracts will be contributed. Once these actions have been completed, payment of Plan benefits and benefit administration will become the responsibility of the annuity provider(s). The assumptions used to measure the benefit obligation as of March 31, 2015 reflect this effort. In addition, the unfunded obligation has been classified as a current obligation assuming that the termination process will be completed during fiscal 2016.
During the second quarter of fiscal 2009, we amended our United States post-retirement welfare benefits plan, reducing the benefits to be provided to retirees under the plan and increasing their share of the costs. The amendments resulted in a decrease of $46,001 in the accumulated post-retirement benefit obligation. The impact of this change was recognized in our Consolidated Balance Sheets in fiscal 2009 and is being amortized as a component of the annual net periodic benefit cost over a period of approximately thirteen years.
A defined benefit pension plan was also provided to the employees of our former Pieterlen, Switzerland manufacturing facility. Restructuring actions related to the Pieterlen, Switzerland manufacturing facility were taken as part of the Fiscal 2010 Restructuring Plan. These actions resulted in workforce reductions that resulted in curtailments and settlement of the plan as the vested benefits of affected employees were substantially settled.
We recognize the funded status of our defined benefit pension and post-retirement benefit plans in our Consolidated Balance Sheets, with a corresponding adjustment to accumulated other comprehensive income, net of tax. The funded status is measured as of March 31 each year and is calculated as the difference between the fair value of plan assets and the benefit obligation (which is the projected benefit obligation for pension plans and the accumulated post-retirement benefit obligation for post-retirement benefit plans). Accumulated comprehensive income (loss) represents the net unrecognized actuarial losses and unrecognized prior service cost. These amounts will be recognized in net periodic benefit cost as they are amortized. We will recognize future changes to the funded status of these plans in the year the change occurs, through other comprehensive income.
72
STERIS CORPORATION AND SUBSIDIARIES
NOTES TO CONSOLIDATED FINANCIAL STATEMENTS
(dollars in thousands, except per share amounts)
Obligations and Funded Status. The following table reconciles the funded status of the defined benefit pension plans and the other post-retirement medical benefit plan to the amounts recorded on our Consolidated Balance Sheets at March 31, 2015 and 2014, respectively. Benefit obligation balances presented in the following table reflect the projected benefit obligations for our defined benefit pension plans and the accumulated other post-retirement benefit obligation for our post-retirement medical benefit plan. The measurement date of our defined benefit pension plans and other post-retirement medical benefit plan is March 31, for both periods presented.
Defined Benefit Pension Plan | Other Postretirement Benefits Plan | ||||||||||||||||
2015 | 2014 | 2015 | 2014 | ||||||||||||||
Change in Benefit Obligations: | |||||||||||||||||
Benefit Obligations at Beginning of Year | $ | 49,206 | $ | 53,433 | $ | 21,342 | $ | 24,548 | |||||||||
Service cost | 140 | 160 | — | — | |||||||||||||
Interest cost | 1,887 | 1,799 | 691 | 683 | |||||||||||||
Actuarial loss (gain) | 9,752 | (1,916 | ) | 2,327 | (654 | ) | |||||||||||
Benefits and expenses | (4,373 | ) | (4,270 | ) | (3,082 | ) | (3,235 | ) | |||||||||
Benefit Obligations at End of Year | 56,612 | 49,206 | 21,278 | 21,342 | |||||||||||||
Change in Plan Assets: | |||||||||||||||||
Fair Value of Plan Assets at Beginning of Year | 48,613 | 46,543 | — | — | |||||||||||||
Actual return on plan assets | 6,186 | 6,340 | — | — | |||||||||||||
Employer contributions | — | — | 3,082 | 3,235 | |||||||||||||
Employee contributions | — | — | — | — | |||||||||||||
Benefits and expenses paid | (4,373 | ) | (4,270 | ) | (3,082 | ) | (3,235 | ) | |||||||||
Fair Value of Plan Assets at End of Year | 50,426 | 48,613 | — | — | |||||||||||||
Funded Status of the Plans | $ | (6,186 | ) | $ | (593 | ) | $ | (21,278 | ) | $ | (21,342 | ) | |||||
Amounts recognized in the consolidated balance sheets consist of the following:
Pension Plan | Other Post-retirement Plan | |||||||||||||
2015 | 2014 | 2015 | 2014 | |||||||||||
Current liabilities | $ | (6,186 | ) | $ | — | $ | (2,789 | ) | $ | (2,949 | ) | |||
Noncurrent liabilities | — | (593 | ) | (18,489 | ) | (18,393 | ) | |||||||
$ | (6,186 | ) | $ | (593 | ) | $ | (21,278 | ) | $ | (21,342 | ) | |||
The pre-tax amount of unrecognized actuarial net loss and unamortized prior service cost included in accumulated other comprehensive (loss) income at March 31, 2015 was $(37,509) and $23,106, respectively. During fiscal 2016, we will amortize the following pre-tax amounts from accumulated other comprehensive income:
Other Post-retirement Benefit Plan | |||||||
U.S. Qualified Plan | |||||||
Actuarial loss | $ | 1,444 | $ | 828 | |||
Prior Service Cost | — | (3,263 | ) | ||||
73
STERIS CORPORATION AND SUBSIDIARIES
NOTES TO CONSOLIDATED FINANCIAL STATEMENTS
(dollars in thousands, except per share amounts)
Defined benefit plans with an accumulated benefit obligation exceeding the fair value of plan assets had the following plan assets and obligations at March 31, 2015 and 2014:
U.S. Qualified | |||||||
2015 | 2014 | ||||||
Aggregate fair value of plan assets | $ | 50,426 | $ | 48,613 | |||
Aggregate accumulated benefit obligations | 56,612 | 49,206 | |||||
Defined benefit plans with a projected benefit obligation exceeding the fair value of plan assets had the following plan assets and obligations at March 31, 2015 and 2014:
U.S. Qualified | |||||||
2015 | 2014 | ||||||
Aggregate fair value of plan assets | $ | 50,426 | $ | 48,613 | |||
Aggregate projected benefit obligations | 56,612 | 49,206 | |||||
Components of Net Periodic Benefit Cost and Other Amounts Recognized in Other Comprehensive Income. Components of the annual net periodic benefit cost of our defined benefit pension plans and our other post-retirement medical benefit plan were as follows:
Pension Plans | ||||||||||||||||||||||||||||
U.S. Qualified | International | Other Post-retirement Plan | ||||||||||||||||||||||||||
2015 | 2014 | 2013 | 2013 | 2015 | 2014 | 2013 | ||||||||||||||||||||||
Service cost | $ | 140 | $ | 160 | $ | 150 | $ | 84 | $ | — | $ | — | $ | — | ||||||||||||||
Interest cost | 1,887 | 1,799 | 2,092 | 76 | 691 | 683 | 867 | |||||||||||||||||||||
Expected return on plan assets | (3,139 | ) | (3,442 | ) | (3,337 | ) | (100 | ) | — | — | — | |||||||||||||||||
Prior service cost recognition | — | — | — | — | (3,263 | ) | (3,263 | ) | (3,263 | ) | ||||||||||||||||||
Net amortization and deferral | 1,106 | 1,458 | 1,333 | — | 721 | 891 | 725 | |||||||||||||||||||||
Net periodic benefit cost | (6 | ) | (25 | ) | 238 | 60 | (1,851 | ) | (1,689 | ) | (1,671 | ) | ||||||||||||||||
Curtailments/settlements | — | — | — | (982 | ) | — | — | — | ||||||||||||||||||||
Total benefit cost | $ | (6 | ) | $ | (25 | ) | $ | 238 | $ | (922 | ) | $ | (1,851 | ) | $ | (1,689 | ) | $ | (1,671 | ) | ||||||||
Recognized in other comprehensive loss (income) before tax: | ||||||||||||||||||||||||||||
Net loss (gain) occurring during year | $ | 6,706 | $ | (4,814 | ) | $ | 3,602 | $ | — | $ | 2,327 | $ | (654 | ) | $ | 2,140 | ||||||||||||
Amortization of prior service credit | — | — | — | — | 3,263 | 3,263 | 3,263 | |||||||||||||||||||||
Amortization of net loss | (1,106 | ) | (1,458 | ) | (1,333 | ) | (159 | ) | (721 | ) | (891 | ) | (725 | ) | ||||||||||||||
Total recognized in other comprehensive loss (income) | 5,600 | (6,272 | ) | 2,269 | (159 | ) | 4,869 | 1,718 | 4,678 | |||||||||||||||||||
Total recognized in total benefits cost and other comprehensive loss (income) | $ | 5,594 | $ | (6,297 | ) | $ | 2,507 | $ | (1,081 | ) | $ | 3,018 | $ | 29 | $ | 3,007 | ||||||||||||
Assumptions Used in Calculating Benefit Obligations and Net Periodic Benefit Cost. The following table presents significant assumptions used to determine the projected benefit obligations at March 31:
74
STERIS CORPORATION AND SUBSIDIARIES
NOTES TO CONSOLIDATED FINANCIAL STATEMENTS
(dollars in thousands, except per share amounts)
2015 | 2014 | ||||
Discount Rate: | |||||
U.S. qualified pension plan | 2.46 | % | 4.00 | % | |
Other post-retirement plan | 3.00 | % | 3.50 | % | |
The following table presents significant assumptions used to determine the net periodic benefit costs for the years ended March 31:
2015 | 2014 | 2013 | ||||||
Discount Rate: | ||||||||
U.S. qualified pension plan | 4.00 | % | 3.50 | % | 4.25 | % | ||
Switzerland pension plan | n/a | n/a | 2.25 | % | ||||
Other post-retirement plan | 3.50 | % | 3.00 | % | 3.75 | % | ||
Expected Return on Plan Assets: | ||||||||
U.S. qualified pension plan | 6.75 | % | 7.75 | % | 8.00 | % | ||
Switzerland pension plan | n/a | n/a | 3.25 | % | ||||
Rate of Compensation Increase: | ||||||||
Switzerland pension plan | n/a | n/a | 2.50 | % | ||||
The net periodic benefit cost and the actuarial present value of projected benefit obligations are based upon assumptions that we review on an annual basis. These assumptions may be revised annually based upon an evaluation of long-term trends, as well as market conditions that may have an impact on the cost of providing benefits.
We develop our expected long-term rate of return on plan assets assumptions by evaluating input from third-party professional advisors, taking into consideration the asset allocation of the portfolios and the long-term asset class return expectations.
We develop our discount rate assumptions by evaluating input from third-party professional advisors, taking into consideration the current yield on country specific investment grade long-term bonds which provide for similar cash flow streams as our projected obligations.
We have made assumptions regarding healthcare costs in computing our other post-retirement benefit obligation. The assumed rates of increase generally decline ratably over a five-year period from the assumed current year healthcare cost trend rate to the assumed long-term healthcare cost trend rate noted below.
2015 | 2014 | 2013 | ||||||
Healthcare cost trend rate – medical | 7.0 | % | 7.0 | % | 8.0 | % | ||
Healthcare cost trend rate – prescription drug | 7.0 | % | 7.0 | % | 7.0 | % | ||
Long-term healthcare cost trend rate | 4.5 | % | 4.5 | % | 4.5 | % | ||
To determine the healthcare cost trend rates, we evaluate a combination of information, including ongoing claims cost monitoring, annual statistical analyses of claims data, reconciliation of forecasted claims against actual claims, review of trend assumptions of other plan sponsors and national health trends, and adjustments for plan design changes, workforce changes, and changes in plan participant behavior.
A one-percentage-point change in assumed healthcare cost trend rates (including medical, prescription drug, and long-term rates) would have had the following effect at March 31, 2015:
75
STERIS CORPORATION AND SUBSIDIARIES
NOTES TO CONSOLIDATED FINANCIAL STATEMENTS
(dollars in thousands, except per share amounts)
One-Percentage Point | |||||||
Increase | Decrease | ||||||
Effect on total service and interest cost components | $ | 2 | $ | (2 | ) | ||
Effect on other post-retirement benefit obligation | 68 | (64 | ) | ||||
Plan Assets. Our United States defined benefit pension plan is funded. The following table presents the targeted asset allocation of plan assets at March 31, 2015 and the actual allocation of plan assets at March 31, 2015 and 2014 for this plan:
Long-Term Target Allocation Percentage | Percentage of Plan Assets March 31 | |||||||
2015 | 2014 | |||||||
U.S. Qualified Plan: | ||||||||
Equity securities | 15 | % | 14.4 | % | 34.1 | % | ||
Debt securities | 75 | % | 74.6 | % | 65.2 | % | ||
Cash | 10 | % | 11.0 | % | 0.7 | % | ||
Total | 100 | % | 100 | % | 100 | % | ||
The long-term target allocations in the preceding table reflect our asset class return expectations and tolerance for investment risk within the context of the pension plans’ long-term benefit obligations. Investment policies, strategies, and long-term target allocations are developed on a plan specific basis. We continually challenge the long-term target asset allocations and support the allocations by an analysis that incorporates historical and expected returns by asset class as well as volatilities across asset classes and our liability profile. The target allocations were modified in connection with the intention to terminate the Plan. Due to market conditions and other factors, actual asset allocations may vary from the long-term target allocations presented in the preceding table. Plan assets for our U.S. defined benefit plan are managed by outside investment managers pursuant to investment policy guidelines established by the Company for the plan. If asset allocations move outside of the target ranges, the portfolios may be rebalanced. For the purpose of the above analysis, debt and equity securities include fixed income and equity security mutual funds, respectively. At March 31, 2015 and 2014, the plan's assets did not include investments in STERIS common shares.
Financial instruments included in pension plan assets are categorized into three tiers. These tiers include a fair value hierarchy of three levels, based on the degree of subjectivity inherent in the valuation methodology as follows:
Level 1 - Quoted prices for identical assets in active markets.
Level 2 - Quoted prices for similar assets in active markets with inputs that are observable, either directly or indirectly.
Level 3 - Unobservable prices or inputs in which little or no market data exists.
The fair value of our pension benefits plan assets at March 31, 2015 and 2014 by asset category is as follows:
76
STERIS CORPORATION AND SUBSIDIARIES
NOTES TO CONSOLIDATED FINANCIAL STATEMENTS
(dollars in thousands, except per share amounts)
Fair Value Measurements at March 31, 2015 | Fair Value Measurements at March 31, 2014 | ||||||||||||||||||||||||||||||
U.S. Qualified Pension Plan | U.S. Qualified Pension Plan | ||||||||||||||||||||||||||||||
(In thousands) | Total | Quoted Prices in Active Markets for Identical Assets (Level 1) | Significant Other Observable Inputs (Level 2) | Significant Other Unobservable Inputs (Level 3) | Total | Quoted Prices in Active Markets for Identical Assets (Level 1) | Significant Other Observable Inputs (Level 2) | Significant Other Unobservable Inputs (Level 3) | |||||||||||||||||||||||
Cash and Short Term Securities (1) | $ | 5,538 | $ | 337 | $ | 5,201 | $ | — | $ | 339 | $ | — | $ | 339 | $ | — | |||||||||||||||
Equity Securities | |||||||||||||||||||||||||||||||
Mutual Funds | 7,271 | 7,271 | — | — | 16,596 | 16,596 | — | — | |||||||||||||||||||||||
Debt Securities | |||||||||||||||||||||||||||||||
Mutual Funds | 37,617 | 37,617 | — | — | 31,678 | 31,678 | — | — | |||||||||||||||||||||||
Total Plan Assets | $ | 50,426 | $ | 45,225 | $ | 5,201 | $ | — | $ | 48,613 | $ | 48,274 | $ | 339 | $ | — | |||||||||||||||
(1) Money market fund holdings are classified as level two as active market quoted prices are not available.
Cash Flows. We contribute amounts to our defined benefit pension plans at least equal to the minimum amounts required by applicable employee benefit laws and local tax laws. If the termination process of the Plan is completed during fiscal 2016 as anticipated, we expect to contribute an amount approximately equal to the unfunded obligation to purchase annuity contracts to settle the obligation in full.
Based upon the actuarial assumptions utilized to develop our benefit obligations at March 31, 2015, the following benefit payments are expected to be made to plan participants:
Defined Pension Plan | Other Post-Retirement Benefit Plan | ||||||
2016 | $ | 56,612 | $ | 2,790 | |||
2017 | — | 2,457 | |||||
2018 | — | 2,206 | |||||
2019 | — | 1,915 | |||||
2020 | — | 1,719 | |||||
2021-2026 | — | 6,725 | |||||
The Medicare Prescription Drug, Improvement and Modernization Act of 2003 (the “Act”) provides a prescription drug benefit for Medicare beneficiaries, a benefit we provide to Medicare eligible retirees covered by our post-retirement benefits plan. We have concluded that the prescription drug benefit provided in our post-retirement benefit plan is considered to be actuarially equivalent to the benefit provided under the Act and thus qualifies for the subsidy under the Act. Benefits are subject to a per capita per month cost cap and any costs above the cap become the responsibility of the retiree. The subsidy is applied to reduce the retiree responsibility. As a result, the expected future subsidy no longer reduces our accumulated post-retirement benefit obligation and net periodic benefit cost. We collected subsidies totaling approximately $457 and $316, during fiscal 2015 and fiscal 2014, respectively, which reduced the retiree responsibility for costs in excess of the caps established in the post-retirement benefit plan.
Defined Contribution Plans. We maintain a 401(k) defined contribution plan for eligible United States employees, a 401(k)defined contribution plan for eligible Puerto Rico employees and a similar savings plan for Canadian employees. We provide a match on a specified portion of an employee’s contribution. The United States plan assets are held in trust and invested as directed by the plan participants. The Canadian plan assets are held by insurance companies. The aggregate fair value of plan assets was $478,761 at March 31, 2015. At March 31, 2015, the U.S. plan held 685,823 STERIS common shares with a fair value of $48,193. We paid dividends of $606, $622, and $592 to the plan and participants on STERIS common stock held by
77
STERIS CORPORATION AND SUBSIDIARIES
NOTES TO CONSOLIDATED FINANCIAL STATEMENTS
(dollars in thousands, except per share amounts)
the plan for the years ended March 31, 2015, 2014, and 2013, respectively. We contributed $10,895, $9,956, and $7,974, to the defined contribution plans for the years ended March 31, 2015, 2014, and 2013, respectively.
We also maintain a domestic non-qualified deferred compensation plan covering certain employees, which formerly allowed for the deferral of compensation for an employee-specified term or until retirement or termination. There were no Employee contributions made to this plan in fiscal 2015, fiscal 2014 or 2013. The Plan was amended in fiscal 2012 to disallow deferrals of salary payable in 2012 and subsequent calendar years and of commissions and other incentive compensation payable in respect of the 2013 and subsequent fiscal years. We hold investments in mutual funds to satisfy future obligations of the plan. We account for these assets as available-for-sale securities and they are included in “Other assets” on our accompanying Consolidated Balance Sheets, with a corresponding liability for the plan’s obligation recorded in “Accrued expenses and other.” The aggregate value of the assets was $3,650 and $3,397 at March 31, 2015 and March 31, 2014, respectively. Realized gains and losses on these investments are recorded in “Interest and miscellaneous income” within “Non-operating expenses” on our accompanying Consolidated Statements of Income. Changes in the fair value of the assets are recorded in other comprehensive income on our accompanying balance sheets.
11. COMMITMENTS AND CONTINGENCIES
We are, and will likely continue to be, involved in a number of legal proceedings, government investigations, and claims, which we believe generally arise in the course of our business, given our size, history, complexity, and the nature of our business, products, Customers, regulatory environment, and industries in which we participate. These legal proceedings, investigations and claims generally involve a variety of legal theories and allegations, including, without limitation, personal injury (e.g., slip and falls, burns, vehicle accidents), product liability or regulation (e.g., based on product operation or claimed malfunction, failure to warn, failure to meet specification, or failure to comply with regulatory requirements), product exposure (e.g., claimed exposure to chemicals, asbestos, contaminants, radiation), property damage (e.g., claimed damage due to leaking equipment, fire, vehicles, chemicals), commercial claims (e.g., breach of contract, economic loss, warranty, misrepresentation), financial (e.g., taxes, reporting), employment (e.g., wrongful termination, discrimination, benefits matters), and other claims for damage and relief.
We believe we have adequately reserved for our current litigation and claims that are probable and estimable, and further believe that the ultimate outcome of these pending lawsuits and claims will not have a material adverse effect on our consolidated financial position or results of operations taken as a whole. Due to their inherent uncertainty, however, there can be no assurance of the ultimate outcome or effect of current or future litigation, investigations, claims or other proceedings (including without limitation the matters discussed below). For certain types of claims, we presently maintain insurance coverage for personal injury and property damage and other liability coverages in amounts and with deductibles that we believe are prudent, but there can be no assurance that these coverages will be applicable or adequate to cover adverse outcomes of claims or legal proceedings against us.
In April 2010, after ongoing discussions with the FDA regarding a 2008 warning letter relating to our SYSTEM 1® sterile processor and related sterilant, we reached agreement with the FDA on the terms of a consent decree (“Consent Decree”). The Consent Decree was approved the same month by the U.S. District Court for the Northern District of Ohio. In general, among other matters, the Consent Decree restricts further sales of SYSTEM 1 processors in the U.S., prohibits the sale of liquid chemical sterilization or disinfection products in the U.S. that do not have FDA clearance, describes various process and compliance matters, and defines penalties in the event of violation of the Consent Decree.
On May 31, 2012, our Albert Browne Limited subsidiary received a warning letter from the FDA regarding chemical indicators manufactured in the United Kingdom. These devices are intended for the monitoring of certain sterilization and other processes. The FDA warning letter states that the agency has concerns regarding operational business processes. We do not believe that the FDA's concerns are related to product performance, or that they result from Customer complaints. We have reviewed our processes with the agency and finalized our remediation measures, and are awaiting FDA reinspection. We do not currently believe that the impact of this event will have a material adverse effect on our financial results.
On May 23, 2014, the Company received a warning letter from the FDA regarding an inspection that the FDA concluded on January 8, 2014 at our STERIS Isomedix Services facility located in Libertyville, Illinois. The facility primarily provides microbial reduction services for certain medical device Customers. Among other matters, the FDA warning letter asserts that certain processes and procedures observed during the inspection did not conform to current Good Manufacturing Practices for medical devices as required by Title 21 CFR Part 820 and, as a result, that certain devices processed at the subject facility are adulterated within the meaning of the Federal Food, Drug and Cosmetic Act. Since the inspection, the Company has provided
78
STERIS CORPORATION AND SUBSIDIARIES
NOTES TO CONSOLIDATED FINANCIAL STATEMENTS
(dollars in thousands, except per share amounts)
detailed responses to the FDA regarding its corrective actions, and has continued to work diligently to remediate the FDA’s concerns. We do not believe that this inspection was a result of Customer complaints and there have been no reports of patient injury. We do not expect this situation to have a material adverse effect on our operations or financial condition.
Other civil, criminal, regulatory or other proceedings involving our products or services could possibly result in judgments, settlements or administrative or judicial decrees requiring us, among other actions, to pay damages or fines or effect recalls, or be subject to other governmental, Customer or other third party claims or remedies, which could materially effect our business, performance, prospects, value, financial condition, and results of operations.
For additional information regarding these matters, see the following portions of this Annual Report on Form 10-K: “Business - Information with respect to our Business in General - Government Regulation”, and the “Risk Factor” titled “We may be adversely affected by product liability claims or other legal actions or regulatory or compliance matters, including the Consent Decree” and the "Risk Factor” titled “Compliance with the Consent Decree may be more costly and burdensome than anticipated.”
On December 19, 2014, a stockholder derivative lawsuit was filed in the Court of Common Pleas, Cuyahoga County, Ohio, against the members of STERIS’s board of directors and its named executive officers, challenging the “excise tax make-whole payments” approved by STERIS’s board in connection with the proposed Synergy transaction. STERIS is named as a nominal defendant in the action. These payments are in respect of an excise tax that will be imposed, by virtue of the transaction, solely on the value of any outstanding stock compensation held by STERIS board members and executive officers, and are intended to place these individuals in the same excise tax-neutral position with respect to their STERIS equity awards after the transaction as before. The case is captioned St. Lucie County Fire District Firefighters’ Pension Trust Fund v. Rosebrough, Jr., et al., Case No. CV 14 837749. The complaint generally alleges that STERIS’s board breached their fiduciary duties by approving the excise tax make-whole payments, that the payments constitute corporate waste and that the payments are voidable under Ohio law. The complaint seeks among other things a declaration that the excise tax make-whole payments are invalid, damages, disgorgement of any excise tax make-whole payments and plaintiffs’ costs and disbursements in the action, including reasonable attorneys’ fees, expert fees, costs and expenses.
From time to time, STERIS is also involved in legal proceedings as a plaintiff involving contract, patent protection, and other claims asserted by us. Gains, if any, from these proceedings are recognized when they are realized.
We are subject to taxation from United States federal, state and local, and foreign jurisdictions. Tax positions are settled primarily through the completion of audits within each individual jurisdiction or the closing of statutes of limitation. Changes in applicable tax law or other events may also require us to revise past estimates. We describe income taxes further in note 9 to our consolidated financial statements titled, “Income Taxes” in this Annual Report on Form 10-K.
Additional information regarding our contingencies is included in Item 7 of Part II titled, “Management’s Discussion and Analysis of Financial Conditions and Results of Operations”.
As of March 31, 2015 and 2014, our commercial commitments totaled $40,008 and $49,585, respectively. Commercial commitments include standby letters of credit, letters of credit required as security under our self-insured risk retention policies, and other potential cash outflows resulting from an event that requires payment by us. Approximately $5,961 of the March 31, 2015 and 2014 totals relate to letters of credit required as security under our self-insured risk retention policies.
As of March 31, 2015 and 2014, we had minimum purchase commitments with suppliers for raw material purchases totaling $35,405 and $54,521, respectively.
12. BUSINESS SEGMENT INFORMATION
We operate and report in three business segments: Healthcare, Life Sciences, and Isomedix. Corporate and other, which is presented separately, contains the Defense and Industrial business unit plus costs that are associated with being a publicly traded company and certain other corporate costs.
Our Healthcare segment manufactures and sells capital equipment, accessory, consumable, and service solutions to healthcare providers, including acute care hospitals, surgery and gastrointestinal centers. These solutions aid our Customers in improving the safety, quality, and productivity of their surgical, sterile processing, gastrointestinal, and emergency environments.
Our Life Sciences segment manufactures and sells capital equipment, formulated cleaning chemistries, and service solutions to pharmaceutical companies, and private and public research facilities around the globe.
79
STERIS CORPORATION AND SUBSIDIARIES
NOTES TO CONSOLIDATED FINANCIAL STATEMENTS
(dollars in thousands, except per share amounts)
Our Isomedix segment operates through a network of facilities located in North America. We sell a comprehensive array of contract sterilization services using gamma irradiation and ethylene oxide (“EO”) technologies as well as an array of laboratory testing services. We provide microbial reduction services based on Customer specifications to companies that supply products to the healthcare, industrial, and consumer products industries.
Financial information for each of our segments is presented in the following table. Operating income (loss) for each segment is calculated as the segment’s gross profit less direct expenses and indirect cost allocations, which results in the full allocation of all distribution and research and development expenses, and the partial allocation of corporate costs. These allocations are based upon variables such as segment headcount and revenues. In addition, the Healthcare segment is responsible for the management of all but one manufacturing facility and uses standard cost to sell products to the Life Sciences segment. Corporate and other includes the gross profit and direct expenses of the Defense and Industrial business unit, as well as certain unallocated corporate costs related to being a publicly traded company and legacy pension and post-retirement benefits.
The accounting policies for reportable segments are the same as those for the consolidated Company. For the year ended March 31, 2015, revenues from a single Customer did not represent ten percent or more of any reportable segment’s revenues.
Years Ended March 31, | 2015 | 2014 | 2013 | ||||||||
Revenues: | |||||||||||
Healthcare (1) | $ | 1,391,874 | $ | 1,180,051 | $ | 1,074,790 | |||||
Life Sciences | 250,845 | 246,122 | 244,421 | ||||||||
Isomedix | 205,675 | 194,183 | 179,550 | ||||||||
Total reportable segments | 1,848,394 | 1,620,356 | 1,498,761 | ||||||||
Corporate and other | 1,869 | 1,896 | 3,141 | ||||||||
Total revenues (1) | $ | 1,850,263 | $ | 1,622,252 | $ | 1,501,902 | |||||
Operating income (loss): | |||||||||||
Healthcare (2) | $ | 125,505 | $ | 109,714 | $ | 153,343 | |||||
Life Sciences | 55,723 | 50,049 | 47,453 | ||||||||
Isomedix | 55,524 | 55,186 | 51,455 | ||||||||
Total reportable segments | 236,752 | 214,949 | 252,251 | ||||||||
Corporate and other | (9,541 | ) | (8,142 | ) | (9,422 | ) | |||||
Total operating income (2) | $ | 227,211 | $ | 206,807 | $ | 242,829 | |||||
(1) Includes an increase of $22,367 in fiscal 2013 resulting from the SYSTEM 1 Rebate Program.
(2) Includes an increase of $23,640 in fiscal 2013, resulting from SYSTEM 1 Rebate Program, and an increase of $16,782 in fiscal year 2013, resulting from the class action settlement.
For the year ended March 31, 2015, pre-tax restructuring expenses of $(871), $161, and $(49) are included in the operating results of the Healthcare, Life Sciences and Isomedix segments, respectively. For the years ended March 31, 2014, pre-tax restructuring expenses of $19,364, $635, and $1,349 are included in the operating results of the Healthcare, Life Sciences and Isomedix segments, respectively. For the year ended March 31, 2013, pre-tax restructuring expenses of $(565) are included in the operating results of the Healthcare segment.
Assets include the current and long-lived assets directly attributable to the segment based on the management of the location or on utilization. Certain corporate assets were allocated to the reportable segments based on revenues. Assets attributed to sales and distribution locations are only allocated to the Healthcare and Life Sciences segments. Corporate and other includes assets directly attributable to the Defense and Industrial business unit, as well as certain unallocated amounts related to being a publicly traded company. Total assets associated with the Healthcare segment have increased substantially during fiscal 2015, as a result of several business acquisitions as described in note 3 to our consolidated financial statements titled, "Business Acquisitions".
Individual facilities, equipment, and intellectual properties are utilized for production by both the Healthcare and Life Sciences segments at varying levels over time. As a result, an allocation of total assets, capital expenditures, and depreciation and amortization is not meaningful to the individual performance of the Healthcare and Life Sciences segments. Therefore, their respective amounts are reported together.
80
STERIS CORPORATION AND SUBSIDIARIES
NOTES TO CONSOLIDATED FINANCIAL STATEMENTS
(dollars in thousands, except per share amounts)
March 31, | 2015 | 2014 | |||||
Assets: | |||||||
Healthcare and Life Sciences | $ | 1,660,450 | $ | 1,476,471 | |||
Isomedix | 436,879 | 408,528 | |||||
Total reportable segments | 2,097,329 | 1,884,999 | |||||
Corporate and other | 2,137 | 2,163 | |||||
Total assets | $ | 2,099,466 | $ | 1,887,162 | |||
Years Ended March 31, | 2015 | 2014 | 2013 | ||||||||
Capital Expenditures: | |||||||||||
Healthcare and Life Sciences | $ | 36,952 | $ | 47,043 | $ | 44,201 | |||||
Isomedix | 48,286 | 39,310 | 43,198 | ||||||||
Total Reportable Segments | 85,238 | 86,353 | 87,399 | ||||||||
Corporate and other | 17 | 14 | 13 | ||||||||
Total Capital Expenditures | $ | 85,255 | $ | 86,367 | $ | 87,412 | |||||
Depreciation, Depletion, and Amortization: | |||||||||||
Healthcare and Life Sciences | $ | 61,156 | $ | 46,315 | $ | 41,622 | |||||
Isomedix | 30,370 | 29,318 | 27,396 | ||||||||
Total Reportable Segments | 91,526 | 75,633 | 69,018 | ||||||||
Corporate and other | 15 | 16 | 17 | ||||||||
Total Depreciation, Depletion, and Amortization | $ | 91,541 | $ | 75,649 | $ | 69,035 | |||||
Financial information for each of our United States and international geographic areas is presented in the following table. Revenues are based on the location of these operations and their Customers. Property, plant and equipment, net are those assets that are identified within the operations in each geographic area.
Years Ended March 31, | 2015 | 2014 | 2013 | ||||||||
Revenues: | |||||||||||
United States | $ | 1,449,223 | $ | 1,244,730 | $ | 1,141,633 | |||||
International | 401,040 | 377,522 | 360,269 | ||||||||
Total Revenues | $ | 1,850,263 | $ | 1,622,252 | $ | 1,501,902 | |||||
March 31, | 2015 | 2014 | |||||
Property, Plant, and Equipment, Net | |||||||
United States | $ | 440,872 | $ | 396,233 | |||
International | 52,181 | 58,177 | |||||
Property, Plant, and Equipment, Net | $ | 493,053 | $ | 454,410 | |||
13. COMMON SHARES
We calculate basic earnings per common share based upon the weighted average number of common shares outstanding. We calculate diluted earnings per share based upon the weighted average number of common shares outstanding plus the dilutive effect of common share equivalents calculated using the treasury stock method. The following is a summary of common shares and common share equivalents outstanding used in the calculations of basic and diluted earnings per share:
81
STERIS CORPORATION AND SUBSIDIARIES
NOTES TO CONSOLIDATED FINANCIAL STATEMENTS
(dollars in thousands, except per share amounts)
Years Ended March 31, | ||||||||
2015 | 2014 | 2013 | ||||||
Denominator (shares in thousands): | ||||||||
Weighted average common shares outstanding—basic | 59,413 | 58,966 | 58,305 | |||||
Dilutive effect of common share equivalents | 632 | 779 | 539 | |||||
Weighted average common shares outstanding and common share equivalents—diluted | 60,045 | 59,745 | 58,844 | |||||
Options to purchase the following number of common shares were outstanding but excluded from the computation of diluted earnings per share because the combined exercise prices, unamortized fair values, and assumed tax benefits upon exercise were greater than the average market price for the common shares during the periods, so including these options would be anti-dilutive:
Years Ended March 31, | |||||||||
2015 | 2014 | 2013 | |||||||
(shares in thousands) | |||||||||
Number of common share options | 342 | 327 | 649 | ||||||
14. REPURCHASES OF COMMON SHARES
In March 2008, we announced that the Company’s Board of Directors provided authorization to repurchase up to $300,000 of STERIS common shares. The March 2008 common share repurchase authorization does not have a stated maturity date. Under this authorization, we may purchase shares from time to time through open market purchases, including transactions pursuant to Rule 10b5-1 plans, or privately negotiated transactions.
We did not make any purchases during fiscal 2015 under the stock repurchase authorization provided by our Board of Directors. During fiscal 2014, we paid an aggregate amount of $24,691 for the repurchase of 565,887 of our common shares, representing an average price of $43.63 per common share. During fiscal 2013, we paid an aggregate amount of $6,830 for the repurchase of 204,349 of our common shares, representing an average price of $33.42 per common share. At March 31, 2015, $86,939 of STERIS common shares remained authorized for repurchase pursuant to the most recent Board approved repurchase authorization (the March 2008 Board Authorization). Also, 10,364,404 common shares were held in treasury at March 31, 2015.
We obtained 541,700 of our common shares during fiscal 2015 in the aggregate amount of $30,687 in connection with stock based compensation award programs. We obtained 58,529 of our common shares during fiscal 2014 in the aggregate amount of $778 in connection with these programs. We obtained 52,893 of our common shares during fiscal 2013 in the aggregate amount of $1,172 in connection with these programs.
15. SHARE-BASED COMPENSATION
We maintain a long-term incentive plan that makes available common shares for grants, at the discretion of the Compensation Committee of the Board of Directors, to officers, directors, and key employees in the form of stock options, restricted shares, restricted share units, stock appreciation rights, and common share grants. Stock options provide the right to purchase our common shares at the market price on the date of grant, subject to the terms of the option plans and agreements. Generally, one-fourth of the stock options granted become exercisable for each full year of employment following the grant date. Stock options granted generally expire 10 years after the grant date, or earlier if the option holder is no longer employed by us (subject to an extended exercise period in some cases for optionees who are age 55 and have at least five years of service). Restricted shares and restricted share units generally cliff vest after a four year period or vest in tranches of one-fourth of the number granted for each full year of employment after the grant date. As of March 31, 2015, 2,784,810 shares remained available for grant under the long-term incentive plan.
The fair value of share-based stock option compensation awards was estimated at their grant date using the Black-Scholes-Merton option pricing model. This model was developed for use in estimating the fair value of traded options that have no vesting restrictions and are fully transferable, characteristics that are not present in our option grants. If the model permitted consideration of the unique characteristics of employee stock options, the resulting estimate of the fair value of the stock options could be different. The value of the portion of the award that is ultimately expected to vest is recognized as expense
82
STERIS CORPORATION AND SUBSIDIARIES
NOTES TO CONSOLIDATED FINANCIAL STATEMENTS
(dollars in thousands, except per share amounts)
over the requisite service periods in our Consolidated Statements of Income. The expense is classified as cost of goods sold or selling, general and administrative expenses in a manner consistent with the employee’s compensation and benefits.
The following weighted-average assumptions were used for options granted during fiscal 2015, fiscal 2014 and fiscal 2013:
Fiscal 2015 | Fiscal 2014 | Fiscal 2013 | |||||||
Risk-free interest rate | 1.89 | % | .95 | % | 1.21 | % | |||
Expected life of options | 5.8 years | 5.7 years | 5.8 years | ||||||
Expected dividend yield of stock | 1.87 | % | 2.22 | % | 2.15 | % | |||
Expected volatility of stock | 29.86 | % | 31.22 | % | 31.24 | % | |||
The risk-free interest rate is based upon the U.S. Treasury yield curve. The expected life of options is reflective of historical experience, vesting schedules and contractual terms. The expected dividend yield of stock represents our best estimate of the expected future dividend yield. The expected volatility of stock is derived by referring to our historical stock prices over a time frame similar to that of the expected life of the grant. An estimated forfeiture rate of 1.46%, 1.44% and 1.83% was applied in fiscal 2015, 2014 and 2013, respectively. This rate is calculated based upon historical activity and represents an estimate of the granted options not expected to vest. If actual forfeitures differ from this calculated rate, we may be required to make additional adjustments to compensation expense in future periods. The assumptions used above are reviewed at the time of each significant option grant, or at least annually.
A summary of share option activity is as follows:
Number of Options | Weighted Average Exercise Price | Average Remaining Contractual Term | Aggregate Intrinsic Value | ||||||||||
Outstanding at March 31, 2014 | 2,396,986 | $ | 31.06 | ||||||||||
Granted | 384,532 | 53.40 | |||||||||||
Exercised | (979,838 | ) | 28.84 | ||||||||||
Forfeited | (33,528 | ) | 41.34 | ||||||||||
Canceled | (8,262 | ) | 20.69 | ||||||||||
Outstanding at March 31, 2015 | 1,759,890 | $ | 37.03 | 6.2 years | $ | 58,499 | |||||||
Exercisable at March 31, 2015 | 1,030,055 | $ | 30.50 | 4.6 years | $ | 40,962 | |||||||
We estimate that 721,833 of the non-vested stock options outstanding at March 31, 2015 will ultimately vest.
The aggregate intrinsic value in the table above represents the total pre-tax difference between the $70.27 closing price of our common shares on March 31, 2015 over the exercise prices of the stock options, multiplied by the number of options outstanding or outstanding and exercisable, as applicable. The aggregate intrinsic value is not recorded for financial accounting purposes and the value changes daily based on the daily changes in the fair market value of our common shares.
The total intrinsic value of stock options exercised during the years ended March 31, 2015, 2014 and 2013 was $31,555, $10,253 and $10,071, respectively. Net cash proceeds from the exercise of stock options were $28,274, $14,160 and $23,019 for the years ended March 31, 2015, 2014 and 2013, respectively. The tax benefit from stock option exercises was $11,526, $2,841 and $2,058 for the years ended March 31, 2015, 2014 and 2013, respectively.
The weighted average grant date fair value of stock option grants was $13.41, $10.59 and $7.32 for the years ended March 31, 2015, 2014 and 2013, respectively.
Stock appreciation rights (“SARS”) carry generally the same terms and vesting requirements as stock options except that they are settled in cash upon exercise and therefore, are classified as liabilities. The fair value of the outstanding SARS as of March 31, 2015 and 2014 was $2,294 and $1,432, respectively. The fair value of outstanding SARS is revalued at each reporting date and the related liability and expense are adjusted appropriately.
83
STERIS CORPORATION AND SUBSIDIARIES
NOTES TO CONSOLIDATED FINANCIAL STATEMENTS
(dollars in thousands, except per share amounts)
A summary of the non-vested restricted share activity is presented below:
Number of Restricted Shares | Number of Restricted Share Units | Weighted-Average Grant Date Fair Value | ||||||||
Non-vested at March 31, 2014 | 931,018 | 14,976 | $ | 36.60 | ||||||
Granted | 268,106 | 39,976 | 53.64 | |||||||
Vested | (299,486 | ) | (17,183 | ) | 34.37 | |||||
Canceled | (48,465 | ) | (4,969 | ) | 42.42 | |||||
Non-vested at March 31, 2015 | 851,173 | 32,800 | $ | 42.98 | ||||||
Restricted shares granted are valued based on the closing stock price at the grant date. The value of restricted shares that vested during fiscal 2015 was $10,004.
Restricted share units carry generally the same terms and vesting requirements as restricted stock except that they may be settled in stock or cash upon vesting. Those that are settled in cash are classified as liabilities. The fair value of outstanding cash-settled restricted share units as of March 31, 2015 and 2014 was $334 and $1,259, respectively. The fair value of each cash-settled restricted share unit is revalued at each reporting date and the related liability and expense are adjusted appropriately.
As of March 31, 2015, there was a total of $25,925 in unrecognized compensation cost related to non-vested share-based compensation granted under our share-based compensation plans. We expect to recognize the cost over a weighted average period of 2.19 years.
16. FINANCIAL AND OTHER GUARANTEES
We generally offer a limited parts and labor warranty on capital equipment. The specific terms and conditions of those warranties vary depending on the product sold and the countries where we conduct business. We record a liability for the estimated cost of product warranties at the time product revenues are recognized. The amounts we expect to incur on behalf of our Customers for the future estimated cost of these warranties are recorded as a current liability on the accompanying Consolidated Balance Sheets. Factors that affect the amount of our warranty liability include the number and type of installed units, historical and anticipated rates of product failures, and material and service costs per claim. We periodically assess the adequacy of our recorded warranty liabilities and adjust the amounts as necessary.
Changes in our warranty liability during the periods presented are as follows:
Years Ended March 31, | 2015 | 2014 | 2013 | ||||||
Balance, Beginning of Year | $ | 7,765 | $ | 12,734 | $ | 11,189 | |||
Warranties issued during the period | 7,604 | 3,538 | 16,111 | ||||||
Settlements made during the period | (9,790 | ) | (8,507 | ) | (14,566 | ) | |||
Balance, End of Year | $ | 5,579 | $ | 7,765 | $ | 12,734 | |||
We also sell product maintenance contracts to our Customers. These contracts range in terms from one to five years and require us to maintain and repair the product over the maintenance contract term. We initially record amounts due from Customers under these contracts as a liability for deferred service contract revenue on the accompanying Consolidated Balance Sheets within “Accrued expenses and other.” The liability recorded for such deferred service revenue was $30,720, $31,079 and $35,258 as of March 31, 2015, 2014 and 2013, respectively. Such deferred revenue is then amortized on a straight-line basis over the contract term and recognized as service revenue on our accompanying Consolidated Statements of Income. The activity related to the liability for deferred service contract revenues is excluded from the table presented above.
84
STERIS CORPORATION AND SUBSIDIARIES
NOTES TO CONSOLIDATED FINANCIAL STATEMENTS
(dollars in thousands, except per share amounts)
17. FORWARD AND SWAP CONTRACTS
From time to time, we enter into forward contracts to hedge potential foreign currency gains and losses that arise from transactions denominated in foreign currencies, including inter-company transactions. We may also enter into commodity swap contracts to hedge price changes in nickel that impacts raw materials included in our cost of revenues. We do not use derivative financial instruments for speculative purposes. These contracts are not designated as hedging instruments and do not receive hedge accounting treatment; therefore, changes in their fair value are not deferred but are recognized immediately in the Consolidated Statements of Income. At March 31, 2015, we held foreign currency forward contracts to buy 68 million Mexican pesos, 8 million Canadian dollars and 2.5 million British pounds sterling. At March 31, 2015, we held commodity swap contracts to buy 586,500 pounds of nickel.
Asset Derivatives | Liability Derivatives | |||||||||||||||
Fair Value at | Fair Value at | Fair Value at | Fair Value at | |||||||||||||
Balance Sheet Location | March 31, 2015 | March 31, 2014 | March 31, 2015 | March 31, 2014 | ||||||||||||
Prepaid & Other | $ | 12 | $ | 167 | $ | — | $ | — | ||||||||
Accrued expenses and other | $ | — | $ | — | $ | 616 | $ | 67 | ||||||||
The following table presents the impact of derivative instruments and their location within the Consolidated Statements of Income:
Location of (loss) gain recognized in income | Amount of (loss) gain recognized in income | |||||||||||||
Years Ended March 31, | ||||||||||||||
2015 | 2014 | 2013 | ||||||||||||
Foreign currency forward contracts | Selling, general and administrative | $ | (1,457 | ) | $ | (1,175 | ) | $ | 161 | |||||
Commodity swap contracts | Cost of revenues | $ | (373 | ) | $ | (57 | ) | $ | (217 | ) | ||||
18. FAIR VALUE MEASUREMENTS
Fair value is defined as the price that would be received to sell an asset or that would be paid to transfer a liability in an orderly transaction between market participants at the measurement date. We estimate the fair value of financial assets and liabilities using available market information and generally accepted valuation methodologies. The inputs used to measure fair value are classified into three tiers. These tiers include Level 1, defined as observable inputs such as quoted prices in active markets; Level 2, defined as inputs other than quoted prices in active markets that are either directly or indirectly observable; and Level 3, defined as unobservable inputs in which little or no market data exists, therefore requiring the entity to develop its own assumptions. The following table shows the fair value of our financial assets and liabilities at March 31, 2015 and March 31, 2014:
85
STERIS CORPORATION AND SUBSIDIARIES
NOTES TO CONSOLIDATED FINANCIAL STATEMENTS
(dollars in thousands, except per share amounts)
Fair Value Measurements at March 31, 2015 and March 31, 2014 Using | |||||||||||||||||||||||||||
Carrying Value | Quoted Prices in Active Markets for Identical Assets | Significant Other Observable Inputs | Significant Unobservable Inputs | ||||||||||||||||||||||||
Level 1 | Level 2 | Level 3 | |||||||||||||||||||||||||
2015 | 2014 | 2015 | 2014 | 2015 | 2014 | 2015 | 2014 | ||||||||||||||||||||
Assets: | |||||||||||||||||||||||||||
Cash and cash equivalents (1) | $ | 167,689 | $ | 152,802 | $ | 148,944 | $ | 137,189 | $ | 18,745 | $ | 15,613 | $ | — | $ | — | |||||||||||
Forward and swap contracts (2) | 12 | 167 | — | — | 12 | 167 | — | — | |||||||||||||||||||
Investments (3) | 8,332 | 3,397 | 8,332 | 3,397 | — | — | — | — | |||||||||||||||||||
Liabilities: | |||||||||||||||||||||||||||
Forward and swap contracts (2) | $ | 616 | $ | 67 | $ | — | $ | — | $ | 616 | $ | 67 | $ | — | $ | — | |||||||||||
Deferred compensation plans (3) | 3,757 | 3,495 | 3,757 | 3,495 | — | — | — | — | |||||||||||||||||||
Long term debt (4) | 623,250 | 493,480 | — | — | 641,131 | 511,690 | — | — | |||||||||||||||||||
Contingent consideration obligations (5) | 2,500 | 9,887 | — | — | — | — | 2,500 | 9,887 | |||||||||||||||||||
(1) Money market fund holdings are classified as level two as active market quoted prices are not available.
(2) The fair values of forward and swap contracts are based on period-end forward rates and reflect the value of the amount that we would pay or receive for the contracts involving the same notional amounts and maturity dates.
(3) We maintain a frozen domestic non-qualified deferred compensation plan covering certain employees, which allows for the deferral of payment of previously earned compensation for an employee-specified term or until retirement or termination. Amounts deferred can be allocated to various hypothetical investment options (compensation deferrals have been frozen under the plan). We hold investments to satisfy the future obligations of the plan. Changes in the value of the investment accounts are recognized each period based on the fair value of the underlying investments. Employees who made deferrals are entitled to receive distributions of their hypothetical account balances (amounts deferred, together with earnings (losses)). We also hold an investment in the common stock of Servizi Italia, S.p.A, a leading provider of integrated linen washing and outsourced sterile processing services to hospital Customers. Changes in the value of the investment are recognized each period based on the fair value of the investment.
(4) We estimate the fair value of our long-term debt using discounted cash flow analyses, based on our current incremental borrowing rates for similar types of borrowing arrangements.
(5) Contingent consideration obligations arise from prior business acquisitions. The fair values are based on discounted cash flow analyses reflecting the possible achievement of specified performance measures or events and captures the contractual nature of the contingencies, commercial risk, and the time value of money. Contingent consideration obligations are classified in the consolidated balance sheets as accrued expense (short-term) and other liabilities (long-term), as appropriate based on the contractual payment dates.
86
STERIS CORPORATION AND SUBSIDIARIES
NOTES TO CONSOLIDATED FINANCIAL STATEMENTS
(dollars in thousands, except per share amounts)
The changes in Level 3 assets and liabilities measured at fair value on a recurring basis at March 31, 2015 are summarized as follows:
Contingent Consideration | |||
Balance at March 31, 2013 | $ | 5,453 | |
Additions | 5,083 | ||
Deductions | (24 | ) | |
(Gains) losses | (374 | ) | |
Foreign currency translation adjustments (1) | (251 | ) | |
Balance at March 31, 2014 | $ | 9,887 | |
Additions | 1,586 | ||
Settlements | (8,320 | ) | |
Foreign currency translation adjustments (1) | (653 | ) | |
Balance at March 31, 2015 | $ | 2,500 | |
(1) Reported in other comprehensive income (loss).
Information regarding our investments is as follows:
Investments at March 31, 2015 and March 31, 2014 | ||||||||||||||||||||||||||||||||
Cost | Unrealized Gains (1) | Unrealized Losses (1) | Fair Value | |||||||||||||||||||||||||||||
2015 | 2014 | 2015 | 2014 | 2015 | 2014 | 2015 | 2014 | |||||||||||||||||||||||||
Available-for-sale securities: | ||||||||||||||||||||||||||||||||
Marketable equity securities | $ | 4,681 | $ | — | $ | — | $ | — | $ | — | $ | — | $ | 4,681 | $ | — | ||||||||||||||||
Mutual funds | 2,677 | 2,608 | 974 | 789 | — | — | 3,651 | 3,397 | ||||||||||||||||||||||||
Total available-for-sale securities | $ | 7,358 | $ | 2,608 | $ | 974 | $ | 789 | $ | — | $ | — | $ | 8,332 | $ | 3,397 | ||||||||||||||||
(1) Amounts reported include the impact of foreign currency movements relative to the U.S. dollar.
19. ACCUMULATED OTHER COMPREHENSIVE INCOME (LOSS)
Accumulated other comprehensive income (loss) shown in our Consolidated Statements of Shareholders' Equity consists of the following:
Year Ended March 31, | |||||||||
2015 | 2014 | 2013 | |||||||
Cumulative foreign currency translation adjustment | $ | (58,848 | ) | $ | 6,348 | $ | 810 | ||
Amortization of pension and postretirement benefit plans costs, net of taxes | (8,889 | ) | (2,428 | ) | (5,184 | ) | |||
Unrealized gain on available for sale securities | 1,068 | 561 | 286 | ||||||
Total | $ | (66,669 | ) | $ | 4,481 | $ | (4,088 | ) | |
87
STERIS CORPORATION AND SUBSIDIARIES
NOTES TO CONSOLIDATED FINANCIAL STATEMENTS
(dollars in thousands, except per share amounts)
20. RECLASSIFICATIONS OUT OF ACCUMULATED OTHER COMPREHENSIVE INCOME (LOSS)
Amounts in Accumulated Other Comprehensive Income (Loss) are presented net of the related tax. Foreign Currency Translation is not adjusted for income taxes. Changes in our Accumulated Other Comprehensive Income (Loss) balances, net of tax, for the years ended March 31, 2015 and March 31, 2014 were as follows:
Gain (Loss) on Available for Sale Securities (1) | Defined Benefit Plans (2) | Foreign Currency Translation (3) | Total Accumulated Other Comprehensive Income (Loss) | ||||||||||||||||||||||||||||
2015 | 2014 | 2015 | 2014 | 2015 | 2014 | 2015 | 2014 | ||||||||||||||||||||||||
Beginning Balance | $ | 561 | $ | 286 | $ | (2,428 | ) | $ | (5,184 | ) | $ | 6,348 | $ | 810 | $ | 4,481 | $ | (4,088 | ) | ||||||||||||
Other Comprehensive Income (Loss) before reclassifications | 391 | 143 | (4,585 | ) | 4,470 | (65,196 | ) | 5,901 | (69,390 | ) | 10,514 | ||||||||||||||||||||
Amounts reclassified from Accumulated Other Comprehensive Income (Loss) | 116 | 132 | (1,876 | ) | (1,714 | ) | — | (363 | ) | (1,760 | ) | (1,945 | ) | ||||||||||||||||||
Net current-period Other Comprehensive Income (Loss) | 507 | 275 | (6,461 | ) | 2,756 | (65,196 | ) | 5,538 | (71,150 | ) | 8,569 | ||||||||||||||||||||
Balance March 31, 2015 | $ | 1,068 | $ | 561 | $ | (8,889 | ) | $ | (2,428 | ) | $ | (58,848 | ) | $ | 6,348 | $ | (66,669 | ) | $ | 4,481 | |||||||||||
Details of amounts reclassified from Accumulated Other Comprehensive Income (Loss) are as follows:
(1) Realized gain (loss) on available for sale securities is reported in the interest income and miscellaneous expense line of the Consolidated Statements of Income.
(2) Amortization (gain) of defined benefit pension items is reported in the selling, general and administrative expense line of the Consolidated Statements of Income.
(3) Realized gain (loss) on intra-entity foreign currency transactions that are of long term investment nature are reported in the selling, general and administrative expense line of the Consolidated Statements of Income.
21. SUBSEQUENT EVENTS
On May 15, 2015, we issued $350,000 of senior notes, in a private placement to certain institutional investors in an offering that was exempt from the registration requirements of the Securities Act of 1933. Of the $350,000 in senior notes, $125,000 have a maturity of 10 years from the issue date at an annual interest rate of 3.45%, $125,000 have a maturity of 12 years from the issue date at an annual interest rate of 3.55% and $100,000 have a maturity of 15 years from the issue date at an annual interest rate of 3.70%. These borrowings will be used for repayment of credit facility debt and for other corporate purposes. The agreement governing these notes contains leverage and interest coverage covenants.
As a result of the issuance of the senior notes, under the terms of the Amended Bridge Credit Agreement, the commitments of the lenders under the Amended Bridge Credit Agreement were further reduced by $297,450, resulting in new Amended Bridge Credit Agreement commitments of $232,550 and £340,000.
88
STERIS CORPORATION AND SUBSIDIARIES
NOTES TO CONSOLIDATED FINANCIAL STATEMENTS
(dollars in thousands, except per share amounts)
22. QUARTERLY RESULTS (UNAUDITED)
Quarters Ended | March 31, | December 31, | September 30, | June 30, | |||||||||||
Fiscal 2015 | |||||||||||||||
Revenues: | |||||||||||||||
Product | $ | 293,235 | $ | 267,285 | $ | 256,845 | $ | 230,440 | |||||||
Service | 208,412 | 205,959 | 205,884 | 182,203 | |||||||||||
Total Revenues | 501,647 | 473,244 | 462,729 | 412,643 | |||||||||||
Cost of Revenues: | |||||||||||||||
Product | 161,080 | 150,164 | 142,991 | 129,975 | |||||||||||
Service | 127,507 | 125,924 | 125,746 | 112,575 | |||||||||||
Total Cost of Revenues | 288,587 | 276,088 | 268,737 | 242,550 | |||||||||||
Gross Profit | 213,060 | 197,156 | 193,992 | 170,093 | |||||||||||
Percentage of Revenues | 42.5 | % | 41.7 | % | 41.9 | % | 41.2 | % | |||||||
Restructuring Expenses | (381 | ) | (1,109 | ) | 1,271 | (172 | ) | ||||||||
Net Income | $ | 41,399 | $ | 38,124 | $ | 31,004 | $ | 24,537 | |||||||
Basic Income Per Common Share: | |||||||||||||||
Net income | $ | 0.69 | $ | 0.64 | $ | 0.52 | $ | 0.41 | |||||||
Diluted Income Per Common Share: | |||||||||||||||
Net income | $ | 0.69 | $ | 0.63 | $ | 0.52 | $ | 0.41 | |||||||
Fiscal 2014 | |||||||||||||||
Revenues: | |||||||||||||||
Product | $ | 300,609 | $ | 252,616 | $ | 235,309 | $ | 222,928 | |||||||
Service | 164,678 | 152,935 | 148,453 | 144,724 | |||||||||||
Total Revenues | 465,287 | 405,551 | 383,762 | 367,652 | |||||||||||
Cost of Revenues: | |||||||||||||||
Product | 178,125 | 144,884 | 133,629 | 129,538 | |||||||||||
Service | 102,667 | 96,892 | 95,627 | 91,268 | |||||||||||
Total Cost of Revenues | 280,792 | 241,776 | 229,256 | 220,806 | |||||||||||
Gross Profit | 184,495 | 163,775 | 154,506 | 146,846 | |||||||||||
Percentage of Revenues | 39.7 | % | 40.4 | % | 40.3 | % | 39.9 | % | |||||||
Restructuring Expenses | 12,326 | 808 | 18 | 52 | |||||||||||
Net Income | $ | 38,876 | $ | 28,506 | $ | 29,743 | $ | 32,317 | |||||||
Basic Income Per Common Share: | |||||||||||||||
Net income | $ | 0.66 | $ | 0.48 | $ | 0.50 | $ | 0.55 | |||||||
Diluted Income Per Common Share: | |||||||||||||||
Net income | $ | 0.65 | $ | 0.48 | $ | 0.50 | $ | 0.54 | |||||||
89
SCHEDULE II – VALUATION AND QUALIFYING ACCOUNTS
Description | Balance at Beginning of Period | Charges to Costs and Expenses | Charges to Other Accounts | Deductions | Balance at End of Period | ||||||||||||||||||||
(in thousands) | |||||||||||||||||||||||||
Year ended March 31, 2015 | |||||||||||||||||||||||||
Deducted from asset accounts: | |||||||||||||||||||||||||
Allowance for trade accounts receivable (1) | $ | 10,922 | $ | 1,415 | $ | 217 | (3 | ) | $ | (3,139 | ) | (4 | ) | $ | 9,415 | ||||||||||
Inventory valuation reserve | 15,986 | 77 | (2 | ) | 1,534 | (3 | ) | — | 17,597 | ||||||||||||||||
Deferred tax asset valuation allowance | 12,541 | 4,028 | (1,867 | ) | (322 | ) | 14,380 | ||||||||||||||||||
Recorded within liabilities: | |||||||||||||||||||||||||
Casualty loss reserves | $ | 14,444 | $ | 3,600 | $ | 2,112 | $ | (2,078 | ) | $ | 18,078 | ||||||||||||||
Accrued SYSTEM 1 Rebate Program and class action settlement | 8 | 18 | — | (10 | ) | 16 | |||||||||||||||||||
Year ended March 31, 2014 | |||||||||||||||||||||||||
Deducted from asset accounts: | |||||||||||||||||||||||||
Allowance for trade accounts receivable (1) | $ | 10,043 | $ | 3,266 | $ | (37 | ) | (3 | ) | $ | (2,350 | ) | (4 | ) | $ | 10,922 | |||||||||
Inventory valuation reserve | 11,985 | 3,944 | (2 | ) | 57 | (3 | ) | — | 15,986 | ||||||||||||||||
Deferred tax asset valuation allowance | 12,428 | 508 | 227 | (622 | ) | 12,541 | |||||||||||||||||||
Recorded within liabilities: | |||||||||||||||||||||||||
Casualty loss reserves | $ | 14,100 | $ | 4,000 | $ | (68 | ) | $ | (3,588 | ) | $ | 14,444 | |||||||||||||
Accrued SYSTEM 1 Rebate Program and class action settlement | 253 | — | — | (245 | ) | 8 | |||||||||||||||||||
Year ended March 31, 2013 | |||||||||||||||||||||||||
Deducted from asset accounts: | |||||||||||||||||||||||||
Allowance for trade accounts receivable (1) | $ | 11,428 | $ | (91 | ) | $ | (49 | ) | (3 | ) | $ | (1,245 | ) | (4 | ) | $ | 10,043 | ||||||||
Inventory valuation reserve | 15,313 | (3,140 | ) | (2 | ) | (188 | ) | (3 | ) | — | 11,985 | ||||||||||||||
Deferred tax asset valuation allowance | 11,842 | 3,279 | (569 | ) | (2,124 | ) | 12,428 | ||||||||||||||||||
Recorded within liabilities: | |||||||||||||||||||||||||
Casualty loss reserves | $ | 10,776 | $ | 2,387 | $ | 3,185 | $ | (2,248 | ) | $ | 14,100 | ||||||||||||||
Accrued SYSTEM 1 Rebate Program and class action settlement | 69,065 | (40,422 | ) | (5 | ) | — | (28,390 | ) | 253 | ||||||||||||||||
(1) | Net allowance for doubtful accounts and allowance for sales and returns. |
(2) | Provision for excess and obsolete inventory, net of inventory written off. |
(3) | Change in foreign currency exchange rates and acquired reserves. |
(4) | Uncollectible accounts written off, net of recoveries. |
(5) | Adjustments were classified as follows: $22,367 as an increase to revenues, $1,273 as a decrease to cost of revenues, and $16,782 as a decrease to selling, general and administrative expenses. |
90
ITEM 9. | CHANGES IN AND DISAGREEMENTS WITH ACCOUNTANTS ON ACCOUNTING AND FINANCIAL DISCLOSURE |
None.
ITEM 9A. | CONTROLS AND PROCEDURES |
EVALUATION OF DISCLOSURE CONTROLS AND PROCEDURES
Our management, including the Principal Executive Officer (“PEO”) and Principal Financial Officer (“PFO”), has evaluated the effectiveness of our disclosure controls and procedures, as defined in Exchange Act Rules 13a-15(e) and 15d-15(e), as of the end of the period covered by this Annual Report on Form 10-K. Based on this evaluation, the PEO and PFO have determined that, as of the end of the period covered by this Annual Report on Form 10-K, our disclosure controls and procedures were effective.
CHANGES IN INTERNAL CONTROLS
During the quarter ended March 31, 2015, there were no changes in our internal control over financial reporting that have materially affected, or are reasonably likely to materially affect, our internal control over financial reporting.
MANAGEMENT’S REPORT ON INTERNAL CONTROL OVER FINANCIAL REPORTING
Management is responsible for establishing and maintaining adequate internal control over financial reporting, as such term is defined in the Exchange Act Rules 13a-15(f). Under the supervision and with the participation of management, including the PEO and PFO, we conducted an evaluation of the effectiveness of internal control over financial reporting as of March 31, 2015 based on the framework in 2013 Internal Control-Integrated Framework issued by the Committee of Sponsoring Organizations of the Treadway Commission. Based on this evaluation under this framework, management concluded that the internal control over financial reporting was effective as of March 31, 2015.
We acquired the stock of IMS and Dana and assets of AGAPE during fiscal 2015. Our assessment of and conclusion on the effectiveness of internal control over financial reporting as of March 31, 2015 did not include the internal controls of these entities. Total assets of the acquired businesses (inclusive of acquired intangible assets and goodwill) represented approximately 10 percent of our consolidated assets as of March 31, 2015 and approximately 8 percent of our consolidated net revenues for the year ended March 31, 2015.
The independent registered public accounting firm that audited the financial statements has issued an attestation report on internal control over financial reporting. The report is below.
REPORT OF INDEPENDENT REGISTERED PUBLIC ACCOUNTING FIRM
Board of Directors and Shareholders
STERIS Corporation
We have audited STERIS Corporation and subsidiaries’ internal control over financial reporting as of March 31, 2015, based on criteria established in Internal Control-Integrated Framework issued by the Committee of Sponsoring Organizations of the Treadway Commission (2013 framework) (the COSO criteria). STERIS Corporation and subsidiaries’ management is responsible for maintaining effective internal control over financial reporting, and for its assessment of the effectiveness of internal control over financial reporting included in the accompanying Management’s Report on Internal Control Over Financial Reporting. Our responsibility is to express an opinion on STERIS Corporation and subsidiaries’ internal control over financial reporting based on our audit.
We conducted our audit in accordance with the standards of the Public Company Accounting Oversight Board (United States). Those standards require that we plan and perform the audit to obtain reasonable assurance about whether effective internal control over financial reporting was maintained in all material respects. Our audit included obtaining an understanding of internal control over financial reporting, assessing the risk that a material weakness exists, testing and evaluating the design and
91
operating effectiveness of internal control based on the assessed risk, and performing such other procedures as we considered necessary in the circumstances. We believe that our audit provides a reasonable basis for our opinion.
A company’s internal control over financial reporting is a process designed to provide reasonable assurance regarding the reliability of financial reporting and the preparation of financial statements for external purposes in accordance with generally accepted accounting principles. A company’s internal control over financial reporting includes those policies and procedures that (1) pertain to the maintenance of records that, in reasonable detail, accurately and fairly reflect the transactions and dispositions of the assets of the company; (2) provide reasonable assurance that transactions are recorded as necessary to permit preparation of financial statements in accordance with generally accepted accounting principles, and that receipts and expenditures of the company are being made only in accordance with authorizations of management and directors of the company; and (3) provide reasonable assurance regarding prevention or timely detection of unauthorized acquisition, use or disposition of the company’s assets that could have a material effect on the financial statements.
Because of its inherent limitations, internal control over financial reporting may not prevent or detect misstatements. Also, projections of any evaluation of effectiveness to future periods are subject to the risk that controls may become inadequate because of changes in conditions, or that the degree of compliance with the policies or procedures may deteriorate.
As indicated in the accompanying Management’s Report on Internal Control Over Financial Reporting, management’s assessment of and conclusion on the effectiveness of internal control over financial reporting did not include the internal controls of Integrated Medical Services International, Inc. (“IMS”), AGAPE Instruments Service, Inc. (“AGAPE”) and Dana Products Inc. (“Dana”) which are included in the 2015 consolidated financial statements of STERIS Corporation and subsidiaries, and constituted approximately 10% of total assets, as of March 31, 2015 and approximately 8% of total revenues for the year then ended. Our audit of internal control over financial reporting of STERIS Corporation and subsidiaries also did not include an evaluation of the internal control over financial reporting of IMS, AGAPE and Dana.
In our opinion, STERIS Corporation and subsidiaries maintained, in all material respects, effective internal control over financial reporting as of March 31, 2015, based on the COSO criteria.
We also have audited, in accordance with the standards of the Public Company Accounting Oversight Board (United States), the consolidated balance sheets of STERIS Corporation and subsidiaries as of March 31, 2015 and 2014 and the related consolidated statements of income, comprehensive income, shareholders’ equity, and cash flows for each of the three years in the period ended March 31, 2015 of STERIS Corporation and subsidiaries, and our report dated May 27, 2015 expressed an unqualified opinion thereon.
/s/ ERNST & YOUNG LLP
Cleveland, Ohio
May 27, 2015
92
ITEM 9B. | OTHER INFORMATION |
None.
93
PART III
ITEM 10. | DIRECTORS, EXECUTIVE OFFICERS AND CORPORATE GOVERNANCE |
BOARD OF DIRECTORS
Our current Board of Directors consists of ten Directors.
The following provides for each director the age of the director, the year in which each became a STERIS director, principal occupations and recent employment history, and any directorships held in companies having securities registered pursuant to the Securities Exchange Act of 1934 during the last five years. The directors will hold office until the 2015 Annual Meeting of Shareholders or until their successors are duly elected and qualified, subject to their earlier death, resignation or removal.
Richard C. Breeden, age 65, director since April 2008, and Chairman and CEO of Breeden Capital Management LLC, a manager of equity investment funds, since 2005. He has also served since 1996 as Chairman of Richard C. Breeden & Co., LLC, a professional services firm that provides a wide range of consulting services. Mr. Breeden also from time to time handles asset distributions to victims of unlawful conduct, typically on behalf of U.S. Government agencies. Since late 2012, Mr. Breeden has served as Special Master on behalf of the U.S. Department of Justice (“DOJ”) to administer and distribute through the Madoff Victim Fund just over $4 billion in forfeited assets to victims of the fraud at Madoff Securities. Mr. Breeden also is currently handling distributions of Fair Funds aggregating over $1 billion for the SEC in cases involving British Petroleum’s disclosures involving the oil spill in the Gulf of Mexico, and J.P. Morgan’s disclosures involving the so-called “London Whale”. Mr. Breeden has previously handled asset distributions to victims of unlawful conduct at WorldCom, Enron, Adelphia, Royal Dutch Shell and other companies. From 2005 to 2009, Mr. Breeden served as Corporate Monitor of KPMG LLP on behalf of DOJ under a deferred prosecution agreement between DOJ and KPMG relating to tax shelter frauds. From 1989 to 1993, Mr. Breeden served as Chairman of the SEC. Mr. Breeden also currently is serving a statutory three year term as a member of the Standing Advisory Group of the Public Company Accounting Oversight Board. During the past five years, Mr. Breeden has also served on the boards of Zale Corporation and H&R Block, Inc., where he was non-executive Chairman as well as a director.
Cynthia L. Feldmann, age 62, director since March 2005 and President and Founder of Jetty Lane Associates, a consulting firm, from December 2005 to December 2011. Ms. Feldmann is a retired certified public accountant with 27 years of experience in two large global accounting firms. From 2003 to 2005 Ms. Feldmann served as the Life Sciences Business Development Officer for the Boston law firm Palmer & Dodge, LLP. From 1994 to 2002, Ms. Feldmann was a partner with KPMG LLP, primarily serving as Partner-in-Charge of its National Medical Technologies Practice. From 1975 to 1994, Ms. Feldmann was employed by Coopers & Lybrand (now PricewaterhouseCoopers LLP), and during that time was named Partner-in-Charge of its Life Sciences practice. Ms. Feldmann has a Bachelor of Science, Accounting, from Boston College and holds a Master Professional Director Certification from the American College of Corporate Directors. Ms. Feldmann is a director of Hanger, Inc. and HeartWare International, Inc.
Jacqueline B. Kosecoff, age 65, director since October 2003 and, since March 2012, Managing Partner, Moriah Partners, LLC, a private equity firm focused on health services and technology and Senior Advisor to Warburg Pincus LLC, a private equity fund. She also has served as a member of the Executive Advisory Board of SAP America, Inc., a software and enterprise applications provider, since November 2010. From October 2007 to November 2011, Dr. Kosecoff served as Chief Executive Officer of OptumRx (formerly named Prescriptions Solutions), a pharmacy benefits management company and subsidiary of UnitedHealth Group, and continued to serve as a senior advisor to OptumRx from December 2011 to February 2012. Dr. Kosecoff served as Chief Executive Officer of Ovations Pharmacy Solutions, a UnitedHealth Group company, from December 2005 to October 2007. From July 2002 to December 2005, Dr. Kosecoff served as Executive Vice President, Specialty Companies, of PacifiCare Health Systems, Inc., one of the nation’s largest consumer health organizations. From 1998 to 2002, Dr. Kosecoff was President and Founder of Protocare, Inc., a firm involved in the development and testing of drugs, devices, biopharmaceutical and nutritional products, and consulting and analytic services. Dr. Kosecoff is a director of Sealed Air Corporation and athenahealth, Inc.
David B. Lewis, age 70, director since July 2010. Mr. Lewis has been of counsel since August 1, 2014 with the firm of Lewis & Munday, a Detroit based law firm with offices in Washington, D.C. and New York, NY. He was a partner in the firm from 1982 to August 2014 and served as its Chairman from 1982 to January 2011. He is a director of H&R Block, Inc. and The
94
Kroger Company. Previously, Mr. Lewis served on the Boards of Conrail, Inc., LG&E Energy Corp., M.A. Hanna, TRW, Inc., and Comerica, Inc.
Kevin M. McMullen, age 54, director since July 2000, and Chairman of the Board, Chief Executive Officer, and President of OMNOVA Solutions Inc., a major innovator of decorative and functional surfaces, emulsion polymers, and specialty chemicals, since February 2001. Mr. McMullen was President of GenCorp Inc.’s Decorative & Building Products business unit from 1996 until GenCorp’s spin-off of OMNOVA in 1999. Mr. McMullen became President and Chief Operating Officer of OMNOVA in 2000. Before joining GenCorp, Mr. McMullen was employed by General Electric Corporation in its Commercial & Industrial Lighting business from 1991 to 1996, and McKinsey & Company from 1985 to 1991.
Walter M Rosebrough, Jr., age 61, director and President and Chief Executive Officer of STERIS Corporation since October 2007. From February 2005 to September 2007, Mr. Rosebrough served as President and CEO of Coastal Hydraulics, Inc., a hydraulic and pneumatic systems company he purchased in 2005, and he continues to serve as its non-executive Chairman. Previously, Mr. Rosebrough spent nearly 20 years in the healthcare industry in various roles as a senior executive with Hill-Rom Holdings, Inc. (at the time, Hillenbrand Industries, Inc.), a worldwide provider of medical equipment and related services, including President and CEO of Support Systems International and President and CEO of Hill-Rom.
Mohsen M. Sohi, age 56, director since July 2005, and since July 2012, CEO of Freudenberg and Co., a general multi-industry company serving industries that include automotive, medical, aerospace, oil and gas and power generation and transmission. From July 2010 to June 2012, Dr. Sohi served as Managing Partner of Freudenberg and Co. From March 2003 through June 2010, Dr. Sohi served as President and Chief Executive Officer of Freudenberg-NOK, a privately-held joint venture partnership between Freudenberg and NOK Corp. of Japan, the world’s largest producer of elastomeric seals and custom molded products for automotive and other applications. From January 2001 to March 2003, Dr. Sohi was with NCR Corporation, a leading global technology company, most recently as the Senior Vice President, Retail Solutions Division. Prior to NCR, Dr. Sohi was with Honeywell International Inc. and its pre-merger constituent, Allied Signal, Inc., providers of aerospace, automation & control solutions, specialty materials and transportation systems, for 14 years, serving from July 2000 to January 2001 as President, Honeywell Electronic Materials. Dr. Sohi previously served as a director of Aviat Networks, Inc. (formerly known as Harris Stratex Networks, Inc.) from 2007 until January 2015.
John P. Wareham, age 73, director since November 2000. Mr. Wareham was appointed Chairman of the Board of Directors of STERIS in May 2005. In April 2005, Mr. Wareham retired as Chairman of the Board and Chief Executive Officer of Beckman Coulter, Inc., a leading provider of laboratory systems and complementary products used in biomedical analysis, a position which he held since February 1999. Previously Mr. Wareham served as President and Chief Operating Officer of Beckman Coulter, a position he assumed in 1993. Mr. Wareham is a director of ResMed Inc. Mr. Wareham previously served on the Boards of Beckman Coulter, Inc., Greatbatch, Inc. and Accuray Incorporated.
Loyal W. Wilson, age 67, director since 1987, and since the end of December 2013, Founder and Senior Advisor of Primus Capital Partners, Inc., a private equity investment and management firm. From 1994 to December 2013, Mr. Wilson served as Managing Director of Primus Capital Partners, Inc. From 1983 to 1994, Mr. Wilson served as a Managing Partner of Primus Venture Partners, L.P. Primus invests in established, high growth firms in the healthcare, software, technology enabled business services, and education industries.
Michael B. Wood, age 71, director since October 2004, and from August 2004 to the present a consultant orthopedic surgeon at the Mayo Clinic in Jacksonville, Florida and a Professor of Orthopedics at the Mayo Clinic College of Medicine. Dr. Wood served as President Emeritus of the Mayo Clinic Foundation from February 2003 until February 2004, and President and CEO of the Mayo Clinic Foundation from 1999 to 2003. The Mayo Clinic Foundation is a charitable, not-for-profit organization based in Rochester, Minnesota, and is the parent corporate entity of the Mayo Clinics in Minnesota, Florida and Arizona. Dr. Wood served as a director of Cubist Pharmaceuticals, Inc. until June 2014.
EXECUTIVE OFFICERS
Our executive officers serve for a term from the date of election to the next organizational meeting of the Board of Directors and until their respective successors are elected and qualified, subject to their earlier death, resignation, or removal. The following table presents certain information regarding our executive officers at March 31, 2015. All executive officers serve at the pleasure of the Board of Directors.
95
Name | Age | Position | ||
Kathleen L. Bardwell | 59 | Senior Vice President and Chief Compliance Officer | ||
Suzanne V. Forsythe | 61 | Vice President, Human Resources | ||
David A. Johnson | 53 | Senior Vice President, Surgical Solutions | ||
Robert E. Moss | 70 | Senior Vice President and Group President, STERIS Isomedix Services and Life Sciences | ||
Sudhir K. Pahwa | 62 | Senior Vice President, Infection Prevention Technologies | ||
Walter M Rosebrough, Jr. | 61 | President and Chief Executive Officer | ||
Michael J. Tokich | 46 | Senior Vice President, Chief Financial Officer and Treasurer | ||
J. Adam Zangerle | 48 | Vice President, General Counsel, and Secretary | ||
The following discussion provides a summary of each executive officer’s recent business experience:
Kathleen L. Bardwell serves as Senior Vice President and Chief Compliance Officer. She assumed this role in February 2014. From March 2008 to February 2014 she served as Vice President, Chief Compliance Officer.
Suzanne V. Forsythe serves as Vice President, Human Resources. She assumed this role in August 2011. She served as Senior Director, Human Resources from April 2008 through August 2011.
David A. Johnson serves as Senior Vice President, Surgical Solutions. He assumed this role in February 2014. From July 2012 to February 2014 he served as Senior Vice President, Global Operations and Quality. From April 2010 to July 2012 he served as Vice President, Global Operations and Continuous Improvement. From 2007 to April 2010 he served as Vice President Global Operations and Supply Chain at ConMed Corp., a global medical technology company specializing in the development and sale of surgical and patient monitoring products and services.
Robert E. Moss serves as Senior Vice President and Group President, STERIS Isomedix Services and Life Sciences. He assumed this role in October 2009. He served as Senior Vice President and Group President, STERIS Isomedix Services, from April 2005 until October 2009.
Sudhir K. Pahwa serves as Senior Vice President, Infection Prevention Technologies. He assumed this role in February 2014. From December 2008 to February 2014 he served as Vice President and General Manager, Infection Prevention Technologies.
Walter M Rosebrough, Jr. serves as President and Chief Executive Officer. He assumed this role when he joined STERIS in October 2007. His select summary information appears in the preceding Board of Directors section.
Michael J. Tokich serves as Senior Vice President, Chief Financial Officer and Treasurer. He assumed this role in February 2014. He served as Senior Vice President and Chief Financial Officer from March 2008 to February 2014.
J. Adam Zangerle serves as Vice President, General Counsel, and Secretary. He assumed this role in July 2013. From May 2007 to July 2013 he served as Associate General Counsel and Group General Counsel, Healthcare.
We have adopted a code of ethics for employees, the STERIS Corporation Code of Business Conduct, that applies to the principal executive officer, principal financial officer and principal accounting officer as well as all of our other employees. We have also adopted a code of ethics, the STERIS Corporation Director Code of Ethics, which applies to the members of the Company’s Board of Directors, including our principal executive officer. Our Code of Business Conduct for Employees and the Director Code of Ethics are discussed at greater length in Item 13 of this Part III and can be found on our Investor Relations website at www.steris-ir.com. Any amendments or waivers of either of these codes will be made available on this website.
LEGAL PROCEEDINGS
On December 19, 2014, a stockholder derivative lawsuit was filed in the Court of Common Pleas, Cuyahoga County, Ohio, against the members of STERIS’s board of directors and its named executive officers, challenging the “excise tax make-whole payments” approved by STERIS’s board in connection with the proposed Synergy transaction. STERIS is named as a nominal defendant in the action. These payments are in respect of an excise tax that will be imposed, by virtue of the transaction, solely on the value of any outstanding stock compensation held by STERIS board members and executive officers, and are intended to place these individuals in the same excise tax-neutral position with respect to their STERIS equity awards after the transaction as before. The case is captioned St. Lucie County Fire District Firefighters’ Pension Trust Fund v. Rosebrough, Jr., et al., Case No. CV 14 837749. The complaint generally alleges that STERIS’s board breached their fiduciary duties by approving the excise tax make-whole payments, that the payments constitute corporate waste and that the payments are voidable under Ohio law. The complaint seeks among other things a declaration that the excise tax make-whole payments are invalid, damages,
96
disgorgement of any excise tax make-whole payments and plaintiffs’ costs and disbursements in the action, including reasonable attorneys’ fees, expert fees, costs and expenses.
SECTION 16(a) BENEFICIAL OWNERSHIP REPORTING COMPLIANCE
Based on Company records and information, including a review of Forms 3, 4 and 5 and amendments thereto furnished to the Company, the Company believes that all filing requirements applicable to directors, executive officers, and greater than 10% shareholders under Section 16(a) of the Securities Exchange Act of 1934 for the fiscal year ended March 31, 2015 were complied with on a timely basis.
AUDIT COMMITTEE
The Board has a standing Audit Committee. Messrs. Lewis, Breeden and Wilson, Ms. Feldmann and Dr. Sohi are the current members of the Audit Committee. The Audit Committee provides oversight relating to the integrity of the Company’s financial statements and financial reporting process, including its systems of internal accounting and financial controls, the internal audit process, the annual independent audit of the Company’s annual financial statements, compliance with legal and regulatory requirements, the independent registered public accounting firm’s qualifications and independence, and related matters. SEC rules provide that only a person who meets certain independence criteria may serve on the audit committee of a public company. The Board has determined that Messrs. Lewis, Breeden and Wilson, Ms. Feldmann and Dr. Sohi each meet those independence criteria for audit committee members and that all such members also are independent within the meaning of the NYSE listing standards, and are “financially literate” and have accounting or related financial expertise within the meaning of NYSE listing standards. The Board has further determined that each of Messrs. Lewis, Breeden and Wilson, Ms. Feldmann and Dr. Sohi qualifies as an “audit committee financial expert” in accordance with Item 407(d)(5)(ii) of Regulation S-K. Mr. Lewis, who is the Committee Chair, was determined to qualify as an audit committee financial expert as a result of the Board’s examination of his education, and other board and audit committee experiences. Mr. Lewis graduated from the University of Chicago, Booth School of Business with an MBA degree in Finance. He served as Chairman and Chief Executive Officer of Lewis & Mundy, a law firm he co-founded, from 1972 to 1982 and 2004 to 2010. In addition, Mr. Lewis has served on the audit committees of four other U.S. public companies, and as audit committee chair of three of these public companies. A copy of the Audit Committee’s charter may be found at http://www.steris.com/about/ir/corpgovbridge.cfm. A copy will also be made available upon a request sent to the Company’s Secretary.
ITEM 11. | EXECUTIVE COMPENSATION |
COMPENSATION DISCUSSION AND ANALYSIS
Compensation Committee Overview
The Compensation Committee of our Board of Directors, which we refer to throughout this Compensation Discussion and Analysis as the Committee, is responsible for approving the compensation, benefits and perquisites of the President and Chief Executive Officer (to whom we refer as CEO) and senior management, and our general compensation philosophy. The Committee also approves annual equity grants available under our equity incentive compensation plan for eligible employees, as well as cash bonus payments to senior management and the maximum amount payable under our annual management cash bonus plans, based upon performance criteria established by the Committee under those plans. The Committee has regularly retained an independent compensation consultant and other advisors to assist with its responsibilities. Each member of the Committee satisfied the independence standards of the SEC and NYSE.
General Compensation Philosophy
Our management compensation programs are designed to align management’s interests with the long-term interests of shareholders and to support and promote the achievement of our goals and objectives by helping to recruit and retain executive talent required to successfully manage our business. Our management compensation programs seek to align compensation with individual and Company performance to achieve the goals and objectives of the business by providing and balancing incentives for annual financial performance as well as the generation of long-term value, growth and profitability. Therefore, management compensation is generally structured to provide a significant portion of the compensation opportunity on the basis of the long-term performance of STERIS stock, as well as business performance and other factors that influence shareholder value. The Committee believes that the design of our executive compensation program provides appropriate incentives and alignment with shareholders.
Some of the recent executive compensation practices adopted or supported by the Committee include:
• | Recommending that shareholders be provided the opportunity to vote annually at each annual meeting of shareholders regarding the compensation of our named executive officers (“say on pay” vote); |
97
• | Increasing the share ownership requirements under the Non-Employee Director Stock Ownership Guidelines (see subsection of Item 12. Security Ownership of Certain Beneficial Owners and Management and Related Stockholder Matters titled, “Non-Employee Director Stock Ownership Guidelines” for additional information); |
• | Eliminating all change in control agreements, including the related tax gross-ups; |
• | Adopting a new Senior Executive Severance Plan with less generous severance provisions, including a double trigger to receive benefits as a result of changes in control, and no tax gross ups (see subsection of Item 11. Executive Compensation, titled “Senior Executive Severance Plan” for additional information); |
• | Terminating the CEO’s Employment Agreement, including the Company severance obligations contained therein, and covering him under the less generous provisions of the Senior Executive Severance Plan; |
• | Modifying the Company’s 2006 Long-Term Equity Incentive Plan to substitute double trigger vesting for single trigger vesting following changes in control for equity awards made after March 12, 2014; |
• | Imposing a blanket prohibition on the hedging and pledging of Company securities by Company employees and directors; and |
• | Modifying the Company’s officer share ownership guidelines to reflect prevailing market practices that include automatic adjustments for changing circumstances (see "Officer Stock Ownership Guidelines" subsequently in this Compensation Discussion and Analysis) . |
The Committee has determined that the Company’s employee compensation policies and practices are not reasonably likely to have a material adverse effect on the Company. This determination was based in part on a review of compensation practices and programs conducted by the Committee’s compensation consultant, Pay Governance LLC (“Pay Governance” or “Consultant”) and by management, with risk being evaluated from several perspectives, including award time horizons, award limitations, metric structure, metric alignment with business strategy, payout cliffs, long-term incentive mix and other practices or policies that mitigate risk-taking. Other risk mitigating factors reviewed included clawbacks, stock ownership guidelines and stock retention policies, anti-hedging and pledging policies and equity grant practices, as well as more specific factors with respect to sales and service incentive plans.
The Committee believes that it must maintain flexibility in establishing compensation practices to allow it to address compensation trends, competitive issues, business needs, industry and the broader economic environment, and special situations that will be encountered in the recruitment, retention, and promotion of employees. Therefore, the compensation practices approved by the Committee will likely vary from year to year and from person to person, depending on the particular circumstances.
The Committee voluntarily solicited the input of shareholders regarding our executive compensation program at our 2010 Annual Meeting of Shareholders through a non-binding advisory “say on pay” proposal, and since that time has continued to seek shareholder input on our executive compensation in accordance with the provisions of Dodd-Frank at each Annual Meeting of Shareholders.
Consideration of 2014 Say-on-Pay Vote Results
The Committee reviewed the results of our 2014 “say-on-pay” vote, in which our named executive officer compensation was supported by more than 97% of the shares voted. After taking into consideration the strong support for our executive compensation program reflected in our annual say-on-pay vote results, the Committee decided to continue to apply the same philosophy, compensation objectives and governing principles as it has used in recent years when making subsequent decisions or adopting subsequent policies regarding named executive officer compensation. Also after taking into consideration this strong support, the Committee decided to continue using the same executive pay structure of base salary, cash bonus and mix of restricted stock and options.
Process for Determining Senior Management Compensation
Senior management compensation is generally reviewed and established on an annual basis by the Committee. Our fiscal year ends on March 31. Therefore, Committee members typically begin the assessment of compensation for senior management near the end of the fiscal year. The Committee typically meets again early in the new fiscal year to evaluate the performance of the Company and our named executive officers, and based on that evaluation of Company performance and individual evaluations, to determine bonus amounts, if any, for the recently completed fiscal year, and finalize base salaries, set bonus criteria, and approve equity awards for senior management for the new fiscal year.
For fiscal year 2015, the Consultant assisted with the annual compensation reviews, providing historical and prospective views regarding total compensation for our executive officers. The Consultant reports to the Committee and is charged with providing the Committee with competitive pay data and compensation trends, analysis and recommendations. Base salaries,
98
cash bonus levels, equity compensation, and total compensation of senior management are examined against data from multiple sources and surveys developed and provided by the Consultant, as described below. The Committee targets the payment of base salaries, cash bonuses and equity compensation and total direct compensation within a general range of 10% above or below the market median of those components. Similarly, target cash bonus opportunities and target equity incentive opportunities are designed to reflect market median targets. This is a guideline around which there is likely to be variation, depending on individual factors and business results. Factors used in the process of assessing and determining senior management compensation include individual and team performance, scope of responsibilities and accountability, competitive and other industry compensation data, special circumstances and expertise, business performance, and comparison with compensation of our other senior managers. The CEO also provides recommendations to the Committee for compensation adjustments for the other senior managers.
The Committee and the Consultant review market data relating to compensation to help assess the compensation of our senior executives, including each of the named executive officers. This review includes the Consultant’s analysis of proxy data from certain healthcare equipment and supply companies similar in size to the Company (see peer listing below), information derived from multiple general compensation surveys, including companies from across industries, and other executive compensation data maintained by the Consultant. This data includes peer companies with a focus on healthcare equipment and supplies (see listing below) and public industrial companies primarily from the S & P Composite 1500, adjusted by the Consultant to reflect the Company’s revenue. Peer group data is used for executive pay benchmarking purposes for the Company’s CEO and CFO. The public industrial company survey data also is utilized for executive pay benchmarking purposes for the Company’s CEO and CFO, as well as for all of the other named executive officers. The Committee evaluates this data with the assistance of the Consultant to develop a target and related range for each of base salary, incentive compensation (cash bonus), and long-term equity compensation, as well as total direct compensation, for each executive position that reflects market median pay (overall and by each element), consistent with the Company’s pay philosophy. In the fourth quarter of fiscal 2014, the Consultant reviewed the peer group used for executive pay benchmarking purposes for the Company’s CEO and CFO for fiscal 2015. The Consultant regularly reviews the group to provide consistency in assessing and administering the Company’s pay program. In selecting recommended peers, the Consultant focuses on companies that are in the health care equipment and supply industries, markets which reflect the Company’s primary business and where we often compete for senior executive talent. More specifically, the Consultant looks primarily for companies manufacturing durable medical goods and medical consumables. Also in selecting potential peers, the Consultant uses several factors including company size and scale, generally ranging from one-half to two times the corresponding measures for STERIS:
• | Revenue between $750 million and $3.0 billion |
• | Total assets between $1.1 million and $4.2 billion |
• | Employees between 3,750 and 7,100 |
• | Market capitalization between $2.8 billion and $6.8 billion |
No relative weighting is given to any one of these factors in determining peers. Rather, potential peer companies were included based on how well they meet all of these factors. In constructing the peer group the Consultant also endeavors to obtain a median peer company that reflects the Company’s size.
As a result of this analysis and further review for fiscal 2015, the Consultant identified the following companies to generate this peer group comparison compensation data for the Committee for fiscal 2015 and the Committee approved the recommended companies:
ŸBio-Rad Laboratories ŸBruker Corporation ŸCR Bard, Inc. ŸCONMED Corporation ŸDentsply International Inc. ŸEdwards Lifesciences Corp. ŸHaemonetics Corp. | ŸHill-Rom Holdings, Inc. ŸHologic ŸIDEXX Laboratories Inc. ŸIntegra Life Sciences ŸIntuitive Surgical, Inc. ŸInvacare Corporation | ŸResMed Inc. ŸSirona Dental Systems Inc. ŸTeleflex Incorporated ŸVarian Medical Systems Inc. ŸWaters Corp. ŸWest Pharmaceutical Services |
All of the peer group companies operate businesses similar to STERIS and to varying degrees met the Company’s peer group size criteria. On balance, STERIS’s financial and other criteria at the time the peer group was constructed at the end of fiscal 2014 generally fell within a reasonable range around the peer group’s medians in terms of annual revenue (STERIS: $1.6 billion vs. peers $1.7 billion), employees (STERIS: 6,000 vs. peers 6,000), assets (STERIS: $1.8 billion vs. peers $2.4 billion), and market cap (STERIS: $2.7 billion vs. peers $3.9 billion). Once the peer group is constructed, the Consultant continues to periodically review with the Committee changes in the revenue, employee, asset and market cap metrics of the peer group members relative to changes in the same metrics for STERIS to assess whether STERIS’s metrics continue to fall within a reasonable range around the peer group’s medians.
99
Executive Compensation Summary for Fiscal Year 2015
The Company’s named executive officers for fiscal 2015, as shown in the Fiscal 2015 Summary Compensation Table appearing later in this Item 11, are as follows: Walter M Rosebrough, Jr., President and CEO; Michael J. Tokich, Senior Vice President, CFO and Treasurer; Sudhir K. Pahwa, Senior Vice President, Infection Prevention Technologies; David A. Johnson, Senior Vice President, Surgical Solutions; and J. Adam Zangerle, Vice President, General Counsel, and Secretary.
The Committee’s consideration of the primary elements of compensation (base salary, incentive compensation (cash bonus) and equity compensation) for all of the named executive officers is based upon a combination of common criteria and measures applicable to all of the officers, as well as individual goals and objectives applicable specifically to each officer. For fiscal 2015, the Committee considered and applied a number of common criteria and measures to evaluate the named executive officers, including:
• | consolidated Company as well as business unit financial performance, |
• | prior individual performance and compensation, |
• | the complexity and scope of responsibilities of the officer’s position, |
• | the officer’s overall experience as well as experience with STERIS, |
• | market and survey data developed by the Consultant, and |
• | the CEO’s assessments and recommendations regarding individual performance (or in the case of the CEO, the Committee’s evaluation of his individual performance). |
Individual goals and objectives varied for each named executive officer based on their area of responsibility. In fiscal 2015:
• | Mr. Rosebrough’s individual goals and objectives related to acquisitions, regulatory compliance, Customer relations, product quality, new product introduction, employee relations and retention, organizational development, safety, process improvement, and profit and cash flow performance. |
• | Mr. Tokich’s individual goals and objectives related to financial reporting and compliance, working capital initiatives, Customer relations, investor relations, cost management, acquisitions, information technology initiatives, employee relations, business strategy initiatives and safety performance. |
• | Mr. Pahwa’s individual goals and objectives related to regulatory compliance, business unit financial performance, business unit organizational leadership, Customer relations, new product launches, product quality leadership, profit and cash flow and safety performance. |
• | Mr. Johnson’s individual goals and objectives related to regulatory compliance, business unit financial performance, business unit organizational leadership, Customer relations, new product launches, product quality leadership, profit and cash flow and safety performance. |
• | Mr. Zangerle’s individual goals and objectives related to acquisitions, regulatory compliance, Customer and employee relations, and safety performance. |
As CEO, Mr. Rosebrough has the broadest complexity and scope of responsibilities, as he has oversight for all aspects of our operations. All of our named executive officers, as well as other senior managers, report directly to Mr. Rosebrough. As a result of these various factors, individual performance against these factors, the individual’s roles and scope of responsibilities, and the Company’s performance, each element of compensation will necessarily vary between the named executive officers.
The Committee believes that our underlying executive compensation program is appropriate to reflect annual financial performance as well as rewarding and motivating behaviors that can create long-term shareholder value. For fiscal year 2015, the Committee evaluated the performance of the named executive officers, applying in each case the common criteria and measures and individual goals and objectives described above, as well as the Company’s actual performance against the targeted financial performance for payment of the incentive compensation. As a result, the Committee approved the fiscal year 2015 compensation described in the following pages for each of the named executive officers.
100
Principal Components of Compensation for Named Executive Officers
For the named executive officers, our compensation program is designed to recruit and retain management and align compensation with individual and Company performance on both an annual and longer-term basis. In addition, compensation of our named executive officers is generally structured to provide a significant portion of the compensation opportunity on the basis of the long-term performance of STERIS stock, as well as business performance and other factors that influence shareholder value. Based on this general compensation philosophy, the Committee has established compensation for our named executive officers consisting of the following principal components:
• | base salary; |
• | annual incentive compensation (cash bonus); |
• | long-term equity incentive compensation (generally stock options and restricted shares); and |
• | benefits and perquisites. |
The chart below illustrates the relative opportunity between base salary, restricted stock and performance based compensation (annual incentive compensation and stock options) of the named executive officers for fiscal 2015. Values shown in the chart for restricted stock and stock option awards reflect the fair market value based upon the NYSE composite closing price and the grant date fair value under FASB ASC topic 718, respectively, as of the effective dates of grant. The Company does not have a prescribed pay mix it uses to deliver compensation. Rather, the differences in pay mix between the named executive officers are driven purely by market median pay levels that are used to determine named executive officer target pay opportunities, consistent with the Company’s pay philosophy and objectives.
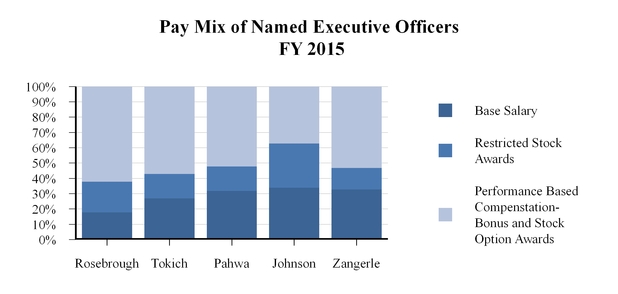
Base Salary:
Base salary for the CEO and other named executive officers is considered a basic component of executive compensation which is necessary to recruit and retain senior managers. In addition, base salary is intended to support compensation practices that are competitive among medical device, hospital supply, pharmaceutical, and other industrial, manufacturing and service companies which we draw from and compete with for executive talent.
The payment of base salary is not directly tied to achievement of pre-established financial goals. The Committee considers a number of factors in determining base salary, including previous individual performance, the Consultant’s data regarding compensation trends and practices, base salaries paid by other medical device, hospital supply, pharmaceutical, and other industrial companies, the complexity and responsibility of the executive’s position, and the executive’s overall experience and achievements against objectives, as well as the general and industry market for executive talent. The Committee believes that the target salary for our executive positions should generally be within 10% above or below the market median for similar positions based on the survey data provided by the Consultant. While the market median may serve as a general guideline, other factors such as experience, time in position, complexity of functions, competitive environment, special skills and past performance are also considered. The Committee believes that base salaries for executives with significant experience and strong past performance should generally fall within the range of plus or minus 10% of the market median for similar positions of industrial companies based on survey data. Based on these considerations and the Company’s fiscal year operating plan
101
(including the Company’s planned merit increase budget), information from the Consultant, and recommendations of the CEO with respect to compensation adjustments for the other named executive officers, the Committee determines the appropriate salary level for the named executive officers. Changes in salary levels are generally effective at the end of the first fiscal quarter or beginning of the second fiscal quarter. The Board of Directors also reviews the compensation actions of the Committee.
With respect to our CEO, Mr. Rosebrough’s initial annual base salary rate of $750,000 was established as part of his former employment agreement approved by our Board, which became effective October 1, 2007 when Mr. Rosebrough joined the Company. At his request, Mr. Rosebrough’s base salary rate remained unchanged from the time he started employment with the Company through the end of the first quarter of fiscal year 2014 although the Committee’s assessment of the Company’s performance, Mr. Rosebrough’s performance, and the Consultant’s survey data all indicated that increases in Mr. Rosebrough’s base salary would have been appropriate. Effective as of the beginning of the second quarter of fiscal 2014, Mr. Rosebrough’s annual base salary rate was increased to $800,000, his first increase since joining the Company, and his base salary rate remained unchanged for fiscal 2015. The survey data from the compensation consultant indicated that Mr. Rosebrough’s base salary remained below the market median for similar positions according to the survey data for both general industry and industry peers.
With respect to the other named executive officers, the Committee applied the common criteria and results of individual performance objectives described above under Executive Compensation Summary, including the evaluation and recommendation of the CEO regarding individual performance results as well as the survey data from the Consultant, to assess base salaries for each officer. Base salaries for all of these officers for fiscal 2015 remained at or below the market median for their respective positions, except for Mr. Johnson, who was slightly above the market median for his position but still within the acceptable range the Committee targets in the market. In determining Mr. Johnson’s base salary, the Committee took into consideration his unique skill sets and his scope of responsibilities and years of industry experience.
Annual Incentive Compensation (cash bonus):
Annual incentive compensation (or cash bonus) is considered necessary to attract and retain key employees, as well as performance based compensation consistent with shareholder value creation. For the named executive officers, this incentive compensation is cash-based and is determined by the Committee with a focus on the annual financial performance of the Company’s business in its entirety, and the officer’s individual performance against goals and objectives. Our annual incentive compensation is intended to reward performance when financial objectives are achieved and motivate and help retain qualified individuals who have the opportunity to influence future results, advance business objectives, and enhance shareholder value. This element of compensation is designed to provide competitive awards when financial performance and personal objectives are achieved or exceeded, or a reduced award or no award when these objectives are not achieved.
Annual incentive compensation is generally based on a weighted formula of selected financial targets. An individual’s annual incentive compensation target under our Management Incentive Compensation Plan or Senior Management Executive Incentive Compensation Plan (which we refer to collectively in this Compensation Discussion and Analysis as the Plans or Bonus Plans), is expressed as a percentage of base salary. The incentive compensation opportunity increases with the level of responsibility. For fiscal 2015, the target bonus for our CEO was 100% of his base salary rate for the fiscal year, consistent with market median levels for target bonuses for CEOs of other similar companies. This target bonus level for Mr. Rosebrough was fixed at the time he first joined the Company and has remained unchanged since that time. His bonus was based on performance against full year fiscal 2015 financial objectives, and could range from 0% to 200% of base salary based on actual performance against the established financial objectives, with the Committee having discretion to reduce (but not increase) Mr. Rosebrough’s bonus based upon performance against individual objectives. For other named executive officers, target bonus percentages ranged from 50% to 65% of base salary for the fiscal year. Messrs. Johnson, Pahwa, Tokich and Zangerle’s percentages were reflective of or below market median targets for individuals in similar roles. Annual incentive payments for each could range from 0% to 200% of target, based on actual performance against the established financial objectives and individual performance against personal objectives. The Consultant’s survey data also indicated that the Company’s incentive compensation maximum payment opportunities were consistent with market norms. Target bonus percentages and incentive compensation caps are reviewed annually by the Committee with the Consultant and compared to the Consultant’s survey data.
Financial targets for the Plans are established annually based on our operating plan financial metrics for the fiscal year as reviewed with the Committee and approved by the Board. Each year, the Committee and the Board evaluate our annual operating plan and consider financial metrics important to shareholder value and designed to support the overall strength and success of our business. After consideration of the Consultant’s compensation data, the recommendation of management, and approval of the Company’s operating plan, certain Company financial performance metrics are identified and approved by the Committee to establish criteria for calculating bonus compensation targets under the Plans. The Bonus Plans are generally designed to set target bonus opportunities to reflect the market median for comparable positions and are sufficient to produce median cash bonus compensation if target results are achieved. Bonus Plans are structured to be sufficient to produce top quartile cash compensation when maximum goals are achieved. If threshold levels of performance are not achieved, executives
102
earn no bonus and their resulting compensation levels are in the bottom quartile. The foregoing performance to compensation relationships are all consistent with the Company’s pay-for-performance philosophy.
For fiscal year 2015, the Committee determined the applicable overall financial metrics to be:
• | earnings before interest and taxes (EBIT), and |
• | free cash flow (which we define as cash flow from operating activities less purchases of property, plant, equipment and intangibles, net, plus proceeds from the sale of property, plant, equipment and intangibles), |
excluding in each case the effect of amounts related to the following special items that the Committee considers not representative of ongoing operations: impairment and restructuring charges, gains or losses on sales of assets outside the ordinary course of business, gain or loss on sales or divestiture of a subsidiary, costs associated with divestiture of discontinued operations, acquisition-related costs, and special or one-time regulatory, tax, litigation, settlement, pension, benefit, or governmental charges, costs or expenses, and the effects of other such items. We choose the two metrics, EBIT and free cash flow, because we believe these two operating metrics are the most representative of long-term shareholder value creation; we view EBIT as the key driver of our ultimate bottom line earnings and utilization of a free cash flow objective is intended to avoid managing cash items to influence bonus outcomes. We have used these same metrics in recent fiscal years.
The Committee assigned the following weighting to the Plan financial metrics, reflecting the Committee’s emphasis on the respective components of financial performance for fiscal year 2015:
• | EBIT - 75%; and |
• | free cash flow - 25%. |
For fiscal year 2015, the metrics and financial targets for calculating the potential payout under the Plans were approved by the Committee and the Board in April 2014. These metrics were applied to the CEO and the other named executive officers. Target performance for EBIT and free cash flow for 100% payout under the approved targets for the Plans were $252.9 million and $129.7 million, respectively. The Plans also required a minimum EBIT of $222.9 million before any payment would be made under the Plans to any of the named executive officers, regardless of business unit performance or individual performance. Any benefit from lower than planned capital expenditures was limited to $10.0 million. Free cash flow payout percentage was limited to the EBIT payout percentage until EBIT exceeded the target objective of $252.9 million, and a minimum free cash flow of $109.7 million was required before any payment could be made pursuant to the free cash flow metric. The maximum performance recognized and incentive compensation payable was capped at 200% of target performance. To achieve this performance level, EBIT of $272.9 million and free cash flow of $159.7 million would have been required. Actual financial performance against Plan criteria for fiscal 2015 was EBIT of $227.2 million on a U.S. GAAP basis and free cash flow of $161.6 (see subsection of MD&A titled “Non-GAAP Financial Measures” for additional information and related reconciliation of this financial measure to the most comparable GAAP measure). Actual financial performance against the Plan criteria for fiscal year 2015, adjusted for the special items discussed above, was EBIT of $256.5 million and free cash flow of $168.6 million. This performance resulted in a weighted aggregate performance achievement of 138.5% against targeted Plan criteria. The Committee reviewed the Plan terms and criteria and approved the bonuses calculated using the 138.5% achievement level for the adjusted financial metrics for the named executive officers. The following table shows the fiscal 2015 Plan financial metrics and 2015 Plan financial attainment percentages for named executive officers:
FY 2015 | |||||||||||||
0% Threshold | 100% Target | 200% Maximum | Weighting | Full Year Adjusted | Attainment % | Weighting Attainment | |||||||
Total Company EBIT | $222.9M | $252.9M | $272.9M | 75.00% | $256.5 | 118.0 | 88.5% | ||||||
Free Cash Flow | $109.7M | $129.7M | $159.7M | 25.00% | 168.6 | 200.0 | 50.0% | ||||||
Total | 138.5% | ||||||||||||
103
A reconciliation of the EBIT and free cash flow used to determine the targets and actual achievement is provided below:
Fiscal 2015 | Total Company EBIT- Actual | Free Cash Flow - Actual | ||
Metric, as reported | $227.2M | $161.6M | ||
Adjustments for comparability: | ||||
Impairment and amortization of acquired intangible assets | 5.8M | — | ||
Acquisition related transaction and integration expenses | 22.0M | 7.8M | ||
Loss (gain) from fair value adjustment of acquisition related contingent consideration | 2.3M | 2.8M | ||
Restructuring | (0.8M) | — | ||
Less: capital expenditure savings limit | — | (3.6M) | ||
Metric on comparable basis to target | 256.5M | $168.6M | ||
After also considering individual performance (including business unit performance where applicable) against the objectives for each named executive officer described above in the Executive Compensation Summary section of this Compensation Discussion and Analysis, the following incentive compensation determinations for fiscal 2015 were approved:
• | CEO - payment of $1,108,000, based on performance against the Senior Management Executive Incentive Compensation Plan criteria and personal goals and objectives for fiscal 2015 (138.5% of his target bonus opportunity); |
• | 4 other named executive officers - an aggregate payment of $1,149,378, based on performance against the Management Incentive Compensation Plan criteria and individual goals and objectives (individual performance percentages ranged from 100% to 125% of target bonus opportunities); and |
• | 794 other eligible employees - an aggregate payment not to exceed $21.8 million to those other eligible employees, based on performance against the Management Incentive Compensation Plan criteria. |
Therefore, the maximum total incentive compensation payments approved by the Committee for distribution to eligible employees under the Plans for fiscal year 2015 was $24.1 million, including the payments to the named executive officers.
Long-Term Equity Incentive Compensation:
Equity incentives are considered necessary to attract and retain employees critical to our continuing, long-term success, as well as providing employees significant alignment of interest with our shareholders. The Committee views nonqualified stock options, stock appreciation rights, restricted stock and restricted stock units as a direct link between management and shareholders. All value earned through stock options is solely dependent upon an increase of our stock price, which reflects investors’s views on the Company’s financial performance and long-term prospects. The Committee believes that options provide a strong linkage to the Company’s performance because the executive benefits only if and to the extent the Company’s stock price increases and the vesting provisions help prevent executives from fully capitalizing on near-term increases in stock values. All of our equity compensation plans have included a provision that stock options may not be granted at an option price less than 100% of fair market value on the grant date and that options may not be re-priced.
In July of 2006, STERIS Corporation 2006 Long-Term Equity Incentive Plan (the “2006 Plan”) was initially approved by shareholders. Shareholders also approved amendments to the 2006 Plan at the 2011 Annual Meeting of Shareholders, and the 2006 Plan was amended again by the Committee in March 2014 to provide for “double trigger” vesting with respect to changes in control for equity awards made after the amendment date. The Committee believes that the vesting requirements for Company equity awards are more demanding than those required in some cases by other companies both in terms of the length of the vesting period (four years) and the use of cliff vesting for the majority of restricted stock awards. The 2006 Plan is administered by the Committee and provides for a variety of equity-based incentive compensation, including stock options, stock appreciation rights, restricted stock units, restricted stock and other stock awards (stock appreciation rights and restricted stock units are generally used in countries outside the U.S. where stock options or ownership of stock of U.S. publicly traded companies may not be optimal for tax or other legal reasons). The Committee believes the 2006 Plan provides flexibility to design long-term equity compensation consistent with our long-term success and alignment with the interest of shareholders. As to the amount and type of equity incentives, the Committee generally considers the Consultant’s data regarding competitive trends and practices, the officer’s salary and level within our organization, the nature and complexity of the position, the recommendation of the CEO, and the Committee’s own evaluation of the performance of named executive officers, since the Committee members generally have an opportunity to observe their performance and have information on the level of past awards. The Committee ultimately decides the amount and mix of long-term compensation (stock options, stock appreciation
104
rights, restricted shares and restricted share units) granted to each named executive officer, other corporate officers and any other executives who report to the CEO, with input from the CEO.
For the past several years, long-term equity awards to each named executive officer have consisted of stock options and restricted stock. In keeping with the Company’s approach over the past several years of awarding options and restricted stock, the Consultant has developed long-term equity awards guidelines for consideration by the CEO and Committee for senior management that place more emphasis on options than restricted stock. This is consistent with the Company’s pay-for-performance philosophy as options only have value to the executive when the Company’s stock price exceeds the option’s exercise price. The CEO and Committee also consider other factors in determining award mix, including in particular the executive’s current equity holdings compared to the Officer Stock Ownership guidelines (discussed subsequently) for Company stock, since stock option holdings do not count toward executive stock holding guidelines. The Company’s peer group companies also continue to emphasize stock options over other forms of long-term equity awards, as well as to use service-based restricted stock awards.
The approval of long-term equity incentive compensation is typically made early in the fiscal year (April or May). The Consultant provides survey data for equity incentives, reflecting market median data and provides the Committee with equity award guidelines based upon this data. For these purposes, for fiscal 2015 the consultant used a $46 per share value based upon an analysis of the average daily closing price for the Company’s stock at various times during fiscal 2014. This value and the other information were then used in determining the number of options and restricted shares to be awarded and was not modified to reflect any subsequent increase or decrease in value of the Company’s stock as of the award approval date or effective date of the grant. This is consistent with the methodology used in previous fiscal years. Long-term equity compensation grants for fiscal year 2015 were approved by the Committee in April 2014 effective as of the day after the date of filing of the Company’s 10-K filing for its 2014 fiscal year. The Company has made regular equity grants effective on this same day since May of 2011.
The value of Mr. Rosebrough’s fiscal year 2015 equity grants was below the average of the market medians for the peer group and industry group survey data provided by Consultant. Because of market factors and the broader complexity and scope of responsibilities of his position, Mr. Rosebrough’s long-term equity compensation is greater than the other named executive officers.
For fiscal year 2015 equity grants to the other named executive officers, the Committee considered survey data of the Consultant and the equity award guidelines prepared by the Consultant based upon this data, common criteria and performance measures applicable to all of the officers, including the Company’s performance during fiscal year 2014, and individual goals and objectives applicable specifically to each officer, each as described above in the Executive Compensation Summary. The CEO also provided recommendations to the Committee regarding equity compensation for the other senior managers. The Committee assessed each of the named executive officers and based on the foregoing considerations the Committee approved fiscal year 2015 long-term equity incentive compensation grants to the named executive officers, finding them to be consistent with the market for executive talent, the Committee’s philosophy of aligning management compensation with the interests of shareholders and the performance of individual and business objectives, and reasonable. Overall, the value of the approved long-term equity awards for these named executive officers was slightly below total market median values for those executives, although results varied by individual officer based on length of time in current roles, achievement of individual performance goals, financial performance of their relevant units and the assumption of greater functional duties in some cases. The equity compensation grants for the named executive officers were made subject to the terms and conditions of approved forms of equity grant agreements and the 2006 Plan.
As part of its oversight of the long-term equity award program, the Committee and management annually review data from the Consultant regarding the cost of the program, both in terms of dilution and P&L expense. Outstanding equity awards of the Company are approximately 4% of shares outstanding, below the market median of the Company’s peers and approximating the median of S&P 500 companies. Moreover, overhang or total dilution overhang associated with the Company’s equity plans, which includes shares available for future grants, is also below the market median of the Company’s peers and approximates the median of S&P 500 companies. The Company’s three year average annual usage of shares for equity awards or its annual “burn rate” approximated 1.7% of shares outstanding, well below the market median of the Company’s peers and on par with that of S&P 500 companies. Finally, the annual expense associated with the Company equity awards expressed either as a percent of revenue or market cap has generally approximated the 25% percentile of the Company’s peers. On balance, the Committee believes it has prudently managed the equity program in support of the shareholders interests.
105
Benefit Programs:
Our named executive officers are eligible to participate in a number of benefit programs, including health, disability and life insurance programs and a qualified 401(k) plan, all of which also are available to nonunion employees in the United States. Named executive officers have no special retirement benefit arrangements such as supplemental retirement plans or excess or restoration retirement benefit plans. At one time the Company maintained a nonqualified deferred compensation plan permitting named executive officers to defer their compensation, but contributions under that plan have been frozen. The Company maintains no other retirement or deferred compensation arrangements for named executive officers.
Named executive officers and other senior employees may also participate in other benefit programs, including an employee relocation program and a Senior Executive Severance Plan (see subsection of Item 11. Executive Compensation, titled “Senior Executive Severance Plan” for additional information). The Senior Executive Severance Plan covers all of the named executive officers.
Perquisites:
The perquisites approved by the Committee for a limited number of senior managers, including our named executive officers, include a tax preparation/financial planning allowance and car allowance. The Committee has also approved club dues and limited personal use of private aircraft by the CEO. The values of these perquisites are included in the Summary Compensation Table under “All Other Compensation” in Item 11. Executive Compensation. The Committee considers the value of these benefits to be relatively modest.
Agreements Regarding Named Executive Officer Compensation
The Committee reviews and approves, or makes recommendations to the Board to approve, any agreements with the named executive officers relating to compensation or separation payments. There are a limited number of agreements regarding compensation with named executive officers currently in force. These agreements are discussed in the succeeding section entitled “Potential Payments to Named Executive Officers upon Termination of Employment or Change in Control.” The Committee believes that agreements regarding senior management compensation should generally be limited to special circumstances.
Clawback and Related Provisions
The Company’s Senior Executive Management Incentive Compensation Plan and Management Incentive Compensation Plan both contain “clawback” provisions. Under these provisions, if the Company’s financial statements for any fiscal year are required to be restated due to material noncompliance with any financial reporting requirement as a result of intentional misconduct of a participant, the participant is required to forfeit or return, as applicable, at the request of the Board or Committee, all or a portion of the participant’s award. The amount to be recovered is the amount of the award in excess of that which would have been payable had the financial statements initially been filed as restated. The Company is entitled to obtain repayment by a variety of different methods. The 2006 Plan also contains forfeiture and recovery provisions for “Detrimental Conduct.” Detrimental Conduct includes acts of dishonesty intended to result in material personal gain or enrichment at the expense of the Company and other acts or conduct detrimental or prejudicial to the business, reputation or other significant interest of the Company.
Tax Deductibility of Compensation
Section 162(m) of the Internal Revenue Code generally disallows a tax deduction to public companies for certain compensation in excess of $1 million paid to any person who on the last day of the fiscal year is the Company’s chief executive officer or among the three highest compensated named executive officers (other than the chief executive officer and chief financial officer). Certain compensation is specifically exempt from the deduction limit to the extent that it does not exceed $1 million during any fiscal year or is “performance based” as defined in Section 162(m). Incentive compensation payable under the Senior Executive Management Incentive Compensation Plan is intended to be performance based for these purposes. Stock options and stock appreciation rights as well as certain other types of equity incentive compensation available under the 2006 Plan (but not restricted stock awards, which vest solely based upon continued service) also are intended to be performance based and exempt from the deduction limit. The Committee believes that it is generally in the Company’s interest to structure compensation to come within the deductibility limits set in Section 162(m) of the Internal Revenue Code. The Committee also believes, however, that it must maintain the flexibility to take actions which it deems to be in the best interests of STERIS but which may not qualify for tax deductibility under Section 162(m).
Combination Related Tax Gross Ups
In connection with the Combination, the Committee and Board of Directors approved a compensatory arrangement intended to provide “make-whole” payments to the Company’s executive officers and Directors who will be subject to a 15%
106
excise tax imposed under Section 4985 of the Internal Revenue Code on their outstanding stock options, restricted stock and career restricted stock units solely because of the Combination. These make-whole payments will not be paid (and no excise tax will be payable) if the Combination is not completed. The rationale for approval of the arrangement and the arrangement are described at greater length in the Company’s Schedule 14A filed with the SEC February 9, 2015 (Commission File No. 001-14643).
Officer Stock Ownership Guidelines
The Committee first established stock ownership guidelines for senior managers in 2006. The guidelines have since been revised on several occasions, most recently in March 2015. The Committee believes these revised guidelines further align the interests of senior management with those of the shareholders. Senior managers (including the named executive officers) are encouraged to maintain a significant equity interest in the Company through ownership of stock that they acquire either with their own funds or through certain long-term incentive awards. The Committee believes that stock ownership helps create economic alignment with shareholders and is a factor in motivating our senior management to enhance shareholder value. Under the most recently revised guidelines, the stock ownership requirements are expressed as a multiple of salary rather than a fixed number of shares, as was previously the case. The Committee believes that this approach, which is consistent with the approach used in the Director Stock Ownership Guidelines, reflects prevailing market practices, and also has the benefit of adjusting for changing circumstances that should influence stockholding requirements. The following table outlines the required officer share ownership values at various levels within the Company, as defined by multiples of base salary for each officer:
Position: | Shareholding Requirements: |
CEO | 6 times base salary |
CFO | 4 times base salary |
Senior Vice Presidents | 3 times base salary |
Corporate Vice Presidents | 2 times base salary |
The following share types are included under these guidelines (stock options do not count toward share ownership):
• | Shares purchased outright; |
• | Shares acquired from exercised stock options (but not unexercised options); |
• | Shares purchased through the STERIS 401(k) plan; and/or |
• | Unvested restricted shares and restricted shares that have vested. |
From the time a senior manager achieves a position subject to these guidelines, he or she has a five-year period to attain the applicable shareholding requirements. Likewise, if an officer already subject to the guidelines is promoted to a position with higher shareholding requirements, he or she has a five year period in which to satisfy the higher requirements. A steady increase in share ownership over the five-year period is encouraged, subject to hardship exceptions. If the share ownership guideline is not achieved within the applicable five-year period, the CEO or the Committee is authorized to take into consideration the facts and circumstances with respect to that failure and take whatever action he or they consider appropriate, including restricting or eliminating future equity awards to the particular officer. Based on the closing price of the Company’s Common Stock on the NYSE on March 31, 2015 and base salaries in effect at that date, the President and CEO and all of the other named executive officers satisfied these guidelines.
Pay Governance
Pay Governance, LLC was the Compensation Committee’s compensation consultant for fiscal 2015. For fiscal 2015, as required by the NYSE listing standards, the Compensation Committee has considered various independence factors and potential conflicts of interest of Pay Governance, LLC and found Pay Governance to be independent and that no conflicts of interest existed.
Insider Trading Policy
The Company maintains an Insider Trading Policy which restricts activities in or relating to Company stock by Directors, executive officers and employees and their respective related persons. These restrictions include advance clearance requirements for Directors and executive officers for all transactions as well as “blackout” provisions. In addition, the Policy imposes blanket prohibitions for Directors, executive officers, employees and their respective related persons on a number of
107
types of transactions relating to Company stock, including short sales, option trading, hedging and pledging (including margin purchases of Company stock).
REPORT OF THE COMPENSATION COMMITTEE
The Compensation Committee has reviewed and discussed the Compensation Discussion and Analysis with management. Based on this review and discussion, the Compensation Committee recommended to the Board of Directors that the Compensation Discussion and Analysis be included in this Annual Report on Form 10-K for the year ended March 31, 2015.
Compensation Committee of the Board of Directors.
Loyal W. Wilson - Chairman
Kevin M. McMullen
John P. Wareham
Michael B. Wood
COMPENSATION COMMITTEE INTERLOCKS AND INSIDER PARTICIPATION
None of the members of the Board who served on the Compensation Committee during fiscal 2015 was ever an officer or employee of the Company or of any of its subsidiaries, other than John P. Wareham, who is Chairman of the Board of the Company and a Vice President of one of the Company’s subsidiaries. Mr. Wareham is not an employee of the Company or the subsidiary. None of the members of the Board who served on the Compensation Committee during fiscal 2015 had any relationship requiring disclosure under any paragraph of Item 404 of Regulation S-K.
108
TABULAR AND OTHER EXECUTIVE COMPENSATION DISCLOSURE
The persons named in the below table are sometimes referred to in this Annual Report on Form 10-K as the “named executive officers”.
FISCAL 2015 SUMMARY COMPENSATION TABLE
Name and Principal Position | Fiscal Year | Salary ($)(1) | Bonus ($) | Stock Awards ($)(2) | Option Awards ($)(3) | Non-Equity Incentive Plan Compensation ($)(4) | All Other Compensation ($)(5) | Total ($) | |||||||
Walter M Rosebrough, Jr. President and Chief Executive Officer | 2015 | 800,000 | 909,840 | 1,588,091 | 1,108,000 | 97,962 | 4,503,893 | ||||||||
2014 | 788,462 | 1,133,500 | 1,053,290 | 699,200 | 126,122 | 3,800,574 | |||||||||
2013 | 750,000 | 598,800 | 517,090 | 906,750 | 130,092 | 2,902,732 | |||||||||
Michael J. Tokich Senior Vice President, Chief Financial Officer and Treasurer | 2015 | 391,007 | 240,840 | 373,668 | 422,405 | 37,356 | 1,465,276 | ||||||||
2014 | 351,772 | 317,380 | 231,724 | 225,611 | 45,083 | 1,171,570 | |||||||||
2013 | 314,183 | 209,580 | 143,636 | 279,350 | 38,436 | 985,185 | |||||||||
Sudhir K. Pahwa Senior Vice President, Infection Prevention Technologies | 2015 | 328,366 | 160,560 | 233,543 | 272,872 | 31,256 | 1,026,597 | ||||||||
2014 | 312,614 | 194,962 | 100,610 | 158,933 | 30,965 | 798,084 | |||||||||
— | — | — | — | — | — | — | |||||||||
David A. Johnson Senior Vice President, Surgical Solutions | 2015 | 309,588 | 267,600 | 93,417 | 214,389 | 39,561 | 924,555 | ||||||||
2014 | 285,431 | 317,380 | 31,599 | 127,406 | 40,792 | 802,608 | |||||||||
2013 | 261,202 | 104,790 | 71,818 | 173,036 | 35,634 | 646,480 | |||||||||
J. Adam Zangerle Vice President, General Counsel, and Secretary | 2015 | 276,923 | 120,527 | 163,507 | 239,712 | 35,397 | 836,066 | ||||||||
— | — | — | — | — | — | — | |||||||||
— | — | — | — | — | — | — | |||||||||
(1) | Regular base salary for fiscal 2015, 2014 and 2013. |
(2) | The dollar amounts reflect the closing sales price per share of the Company’s common stock on the New York Stock Exchange Composite Tape on the effective date of the grant. For a discussion of specific restricted stock awards granted in fiscal 2015, see “Grants of Plan-Based Awards in Fiscal 2015” below and the narrative discussion that follows. From the date of award of all shares of restricted stock described, the recipient can vote the restricted shares and will receive cash dividends at the same times and amounts per share as all other holders of common stock. For a discussion of specific awards of restricted stock granted in fiscal 2015, see “Grants of Plan-Based Awards in Fiscal 2015” below and the narrative discussion that follows. |
(3) | The dollar amounts reflect the grant date fair value under FASB ASC topic 718 for option awards. The aggregate grant date fair value of option awards is computed in accordance with FASB ASC Topic 718, utilizing assumptions discussed in the Notes to our financial statements in our Form 10-K for the fiscal years ended March 31, 2015, March 31, 2014 and March 31, 2013. For a discussion of specific option awards granted in fiscal 2015, see “Grants of Plan-Based Awards in Fiscal 2015” below and the narrative discussion that follows. |
(4) | The dollar amounts represent incentive compensation paid for fiscal years 2015, 2014 and 2013 under the Company’s Senior Executive Management Incentive Compensation Plan for Mr. Rosebrough and under the Company’s Management Incentive Compensation Plan for the other named executive officers, as discussed in the Compensation Discussion and Analysis - “Principal Components of Compensation for Named Executive Officers - Annual Incentive Compensation (cash bonus)” section. |
(5) | Includes for all fiscal years shown for all named executive officers the following: auto allowance, tax preparation/financial planning fees, other personal expense, and Company matching contribution to 401(k) plan. In addition, in the case of Mr. Rosebrough, this also includes club dues and personal use of private aircraft utilized by the Company (the value of personal use of private aircraft was calculated based on the aggregate incremental cost of operating the aircraft). Also includes for all named executive officers dividends on shares of STERIS restricted stock, which dividends are not factored into values shown above. Dividends payable during fiscal 2013 were $.74 per Common Share. For fiscal 2013, restricted stock dividends paid to Mr. Rosebrough were $64,380. Dividends payable during fiscal 2014 were $0.82 per Common Share. For fiscal 2014, restricted stock dividends paid to Mr. Rosebrough were $67,650. Dividends payable during fiscal 2015 were $0.90 per Common Share. For fiscal 2015, restricted stock dividends paid to Mr. Rosebrough were $33,165. Except for the dividends for Mr. Rosebrough that are disclosed in the preceding sentences, no individual item of “All Other Compensation” for any of the named executive officers exceeded $25,000. |
109
GRANTS OF PLAN-BASED AWARDS IN FISCAL 2015
Name | Grant Date | Approval Date | Estimated Future Payouts Under Non-Equity Incentive Plan Awards | All Other Stock Awards: Number of Shares of Stock or Units (#) | All Other Option Awards; Number of Securities Underlying Options (#) | Exercise or Base Price of Option Awards ($/Sh) | Grant Date Fair Value of Stock and Option Awards ($) | |||||
Threshold ($) | Target ($) | Maximum ($) | ||||||||||
Walter M Rosebrough, Jr. | 5/30/2014(1) | 4/23/2014 | 17,000 | 909,840 | ||||||||
5/30/2014(1) | 4/23/2014 | 119,000 | 53.52 | 1,588,091 | ||||||||
— | 800,000 | 1,600,000 | ||||||||||
Michael J. Tokich | 5/30/2014(1) | 4/23/2014 | 4,500 | 240,840 | ||||||||
5/30/2014(1) | 4/23/2014 | 28,000 | 53.52 | 373,668 | ||||||||
— | 254,155 | 508,309 | ||||||||||
Sudhir K. Pahwa | 5/30/2014(1) | 4/23/2014 | 3,000 | 160,560 | ||||||||
5/30/2014(1) | 4/23/2014 | 17,500 | 53.52 | 233,543 | ||||||||
— | 164,183 | 328,366 | ||||||||||
David A. Johnson | 5/30/2014(1) | 4/23/2014 | 5,000 | 267,600 | ||||||||
5/30/2014(1) | 4/23/2014 | 7,000 | 53.52 | 93,417 | ||||||||
— | 154,794 | 309,588 | ||||||||||
J. Adam Zangerle | 5/30/2014(1) | 4/23/2014 | 2,252 | 120,527 | ||||||||
5/30/2014(1) | 4/23/2014 | 12,252 | 53.52 | 163,507 | ||||||||
— | 138,462 | 276,923 | ||||||||||
(1) | Restricted stock and stock option grants made as part of the annual long-term equity grant. All restricted stock and stock option awards were granted under the Company’s 2006 Long-Term Equity Incentive Plan. |
NARRATIVE SUPPLEMENT TO THE FISCAL 2015 SUMMARY COMPENSATION TABLE AND
THE GRANTS OF PLAN-BASED AWARDS IN FISCAL 2015 TABLE
Vesting Schedule
Stock option awards to employees generally vest and become nonforfeitable in increments of 25% per year over a four year period, with full vesting four years after the date of grant. Restricted stock awards to employee recipients generally cliff vest on the fourth anniversary of the grant date if the recipient remains in continuous employment through that date. However, employees who are grantees of restricted stock and have attained age 55 and been employed for at least 5 years at the time of the grant or meet these criteria during the term of the grant, will be subject to installment vesting rules over the four year period. Stock options and restricted stock awards granted prior to March 12, 2014 become fully vested upon a “change in control.” Equity awards made on or after March 12, 2014 are subject to “double trigger” vesting and will not vest immediately upon a change of control unless the recipient does not receive a qualified replacement award. Stock options and restricted stock will vest immediately if the grantee dies while employed by the Company.
Forfeiture and Post-Employment Treatment
The unvested portion of a stock option award (and the right to acquire the underlying shares) is generally forfeited at termination of employment (unless employment terminates on account of death). The vested portion of a stock option award (and the right to acquire the underlying shares) is forfeited following termination of employment and expiration of the applicable post-employment exercise period and also may be forfeited in the case of a termination of employment for “Cause.” Unvested restricted stock is forfeited at termination of employment, unless employment terminates on account of death. Accelerated vesting may apply to awards upon a change in control (see subsection of Item 11. Executive Compensation, titled “Equity Incentive Plan” for additional information).
Dividends
Dividends are payable on restricted stock at the same times and in the same amounts as payable generally from time to time on our outstanding Common Shares.
Option Exercise Price
110
Options granted under our stock option plans have an exercise price equal to the NYSE Composite Transaction Reporting System closing price of our Common Shares on the date the grant is approved or such later date as may be specified in the approval.
111
OUTSTANDING EQUITY AWARDS AT MARCH 31, 2015
Option Awards | Stock Awards | |||||||||||
Name | Option Grant Date | Number of Securities Underlying Unexercised Options (#) Exercisable | Number of Securities Underlying Unexercised Options (#) Unexercisable | Option Exercise Price ($) | Option Expiration Date | Stock Award Grant Date | Number of Shares or Units of Stock That Have Not Vested (#) | Market Value of Shares or Units of Stock That Have Not Vested ($)(1) | ||||
Walter M Rosebrough, Jr. | 5/31/2011 | — | 21,250 | 36.09 | 5/31/2021 | |||||||
5/30/2012 | — | 36,000 | 29.94 | 5/30/2022 | ||||||||
5/31/2013 | — | 75,000 | 45.34 | 5/31/2023 | ||||||||
5/30/2014 | — | 119,000 | 53.52 | 5/30/2024 | ||||||||
5/31/2011 | 3,750 | 263,513 | ||||||||||
5/30/2012 | 10,000 | 702,700 | ||||||||||
5/31/2013 | 18,750 | 1,317,563 | ||||||||||
5/30/2014 | 17,000 | 1,194,590 | ||||||||||
Michael J. Tokich | 11/1/2007 | 2,000 | — | 27.45 | 11/1/2017 | |||||||
3/14/2008 | 13,600 | — | 26.41 | 3/14/2018 | ||||||||
5/21/2009 | 12,000 | — | 22.83 | 5/21/2019 | ||||||||
5/20/2010 | 11,000 | — | 31.87 | 5/20/2020 | ||||||||
5/31/2011 | 10,875 | 3,625 | 36.09 | 5/31/2021 | ||||||||
5/30/2012 | 10,000 | 10,000 | 29.94 | 5/30/2022 | ||||||||
5/31/2013 | 5,500 | 16,500 | 45.34 | 5/31/2023 | ||||||||
5/30/2014 | — | 28,000 | 53.52 | 5/30/2024 | ||||||||
5/31/2011 | 3,700 | 259,999 | ||||||||||
5/30/2012 | 7,000 | 491,890 | ||||||||||
5/31/2013 | 7,000 | 491,890 | ||||||||||
5/30/2014 | 4,500 | 316,215 | ||||||||||
Sudhir K. Pahwa | 5/21/2009 | 3,000 | — | 22.83 | 5/21/2019 | |||||||
5/20/2010 | 6,825 | — | 31.87 | 5/20/2020 | ||||||||
5/31/2011 | 4,500 | 1,500 | 36.09 | 5/31/2021 | ||||||||
5/30/2012 | 3,500 | 3,500 | 29.94 | 5/30/2022 | ||||||||
5/31/2013 | 2,388 | 7,164 | 45.34 | 5/31/2023 | ||||||||
5/30/2014 | — | 17,500 | 53.52 | 5/30/2024 | ||||||||
5/31/2011 | 750 | 52,703 | ||||||||||
5/30/2012 | 2,500 | 175,675 | ||||||||||
5/31/2013 | 3,225 | 226,621 | ||||||||||
5/30/2014 | 3,000 | 210,810 | ||||||||||
David A. Johnson | 5/20/2010 | 7,500 | — | 31.87 | 5/20/2020 | |||||||
5/31/2011 | 8,250 | 2,750 | 36.09 | 5/31/2021 | ||||||||
5/30/2012 | 5,000 | 5,000 | 29.94 | 5/30/2022 | ||||||||
5/31/2013 | 750 | 2,250 | 45.34 | 5/31/2023 | ||||||||
5/30/2014 | — | 7,000 | 53.52 | 5/30/2024 | ||||||||
5/31/2011 | 3,700 | 259,999 | ||||||||||
5/30/2012 | 3,500 | 245,945 | ||||||||||
5/31/2013 | 7,000 | 491,890 | ||||||||||
5/30/2014 | 5,000 | 351,350 | ||||||||||
J. Adam Zangerle | 9/12/2006 | 2,200 | — | 24.72 | 9/12/2016 | |||||||
7/27/2007 | 2,200 | — | 27.68 | 7/27/2017 | ||||||||
5/21/2008 | 3,100 | — | 30.84 | 5/21/2018 | ||||||||
5/21/2009 | 3,150 | — | 22.83 | 5/21/2019 | ||||||||
5/20/2010 | 3,000 | — | 31.87 | 5/20/2020 | ||||||||
5/31/2011 | 2,625 | 875 | 36.09 | 5/31/2021 | ||||||||
5/30/2012 | 1,900 | 1,900 | 29.94 | 5/30/2022 | ||||||||
5/31/2013 | 1,500 | 4,500 | 45.34 | 5/31/2023 | ||||||||
5/30/2014 | — | 12,252 | 53.52 | 5/30/2024 | ||||||||
5/31/2011 | 1,200 | 84,324 | ||||||||||
5/30/2012 | 1,400 | 98,378 | ||||||||||
7/31/2012 | 1,000 | 70,270 | ||||||||||
11/26/2012 | 1,000 | 70,270 | ||||||||||
5/31/2013 | 5,000 | 351,350 | ||||||||||
5/30/2014 | 2,252 | 158,248 | ||||||||||
(1) | Market Value is computed by multiplying the number of shares or units of stock by the NYSE Composite Transaction Reporting System closing price of STERIS’s common shares on March 31, 2015. |
112
The vesting schedule for each grant in the above table is shown below, based on the option or stock award grant date, as applicable.
OPTION AWARDS VESTING SCHEDULE
Grant Date | Vesting Schedule | ||
9/12/2006 | 25% exercisable on 9/12/2007, 9/12/2008, 9/12/2009 and 9/12/2010 (Zangerle) | ||
7/27/2007 | 25% exercisable on 7/27/2008, 7/27/2009, 7/27/2010 and 7/27/2011 (Zangerle) | ||
11/1/2007 | 25% exercisable on 11/1/2008, 11/1/2009, 11/1/2010 and 11/1/2011 (Tokich) | ||
3/14/2008 | 25% exercisable on 3/14/2009, 3/14/2010, 3/14/2011 and 3/14/2012 (Tokich) | ||
5/21/2008 | 25% exercisable on 5/21/2009, 5/21/2010, 5/21/2011 and 5/21/2012 (Zangerle) | ||
5/21/2009 | 25% exercisable on 5/21/2010, 5/21/2011, 5/21/2012 and 5/21/2013 | ||
5/20/2010 | 25% exercisable on 5/20/2011, 5/20/2012, 5/20/2013 and 5/20/2014 | ||
5/31/2011 | 25% exercisable on 5/31/2012, 5/31/2013, 5/31/2014 and 5/31/2015 | ||
5/30/2012 | 25% exercisable on 5/30/2013, 5/30/2014, 5/30/2015 and 5/30/2016 | ||
5/31/2013 | 25% exercisable on 5/31/2014, 5/31/2015, 5/31/2016 and 5/31/2017 | ||
5/30/2014 | 25% exercisable on 5/30/2015, 5/30/2016, 5/30/2017 and 5/30/2018 | ||
STOCK AWARDS VESTING SCHEDULE
Grant Date | Vesting Schedule* |
5/31/2011 | 100% on 6/1/2015 (Tokich, Johnson and Zangerle) |
5/31/2011 | 50% vested on 5/31/2013 and 25% vested on 6/2/2014 and 25% on 6/1/2015 under 55/5 Rule (Rosebrough) |
5/31/2011 | 75% vested on 6/2/2014 and 25% on 6/1/2015 under 55/5 Rule (Pahwa) |
5/30/2012 | 100% on 5/30/2016 (Tokich, Johnson and Zangerle) |
5/30/2012 | 50% vested on 5/30/2014, 25% on 6/1/2015 and 25% on 5/30/2016 under 55/5 Rule (Pahwa) |
5/30/2012 | 25% vested on 5/30/2013 and 25% vested on 5/30/2014, 25% on 6/1/2015 and 25% on 5/30/2016 under 55/5 Rule (Rosebrough) |
5/31/2013 | 100% on 5/31/2017 (Tokich, Johnson and Zangerle) |
5/31/2013 | 25% vested on 6/2/2014, 25% on 6/1/2015, 25% on 5/31/2016 and 25% on 5/31/2017 under 55/5 Rule (Rosebrough and Pahwa) |
5/30/2014 | 100% on 5/30/2018 (Tokich and Zangerle) |
5/30/2014 | 75% on 5/30/2017 and 25% on 5/30/2018 under 55/5 Rule (Johnson) |
5/30/2014 | 25% on 6/1/2015, 25% on 5/30/2016, 25% on 5/30/2017 and 25% on 5/30/2018 under 55/5 Rule (Rosebrough and Pahwa) |
*All awards are restricted stock
.
113
OPTION EXERCISES AND STOCK VESTED IN FISCAL 2015
Option Awards | Stock Awards | |||||
Name | Number of Shares Acquired on Exercise (#) | Value Realized on Exercise ($)(1) | Number of Shares Acquired on Vesting (#) | Value Realized on Vesting ($)(2) | ||
Walter M Rosebrough, Jr.(3) | 100,000 | 3,553,000 | ||||
35,000 | 1,243,550 | |||||
98,200 | 3,241,582 | |||||
75,000 | 3,076,500 | |||||
36,000 | 1,301,760 | |||||
63,750 | 1,913,138 | |||||
60,600 | 2,074,338 | |||||
25,000 | 519,000 | |||||
35,000 | 1,843,100 | |||||
5,000 | 267,600 | |||||
6,250 | 329,000 | |||||
3,750 | 197,400 | |||||
Michael J. Tokich(4) | 2,000 | 47,040 | ||||
2,525 | 59,388 | |||||
4,500 | 236,970 | |||||
Sudhir K. Pahwa(5) | — | — | ||||
2,500 | 133,800 | |||||
1,075 | 56,588 | |||||
2,250 | 118,440 | |||||
David A. Johnson(6) | — | — | ||||
2,700 | 142,182 | |||||
J. Adam Zangerle(7) | 1,000 | 28,190 | ||||
1,000 | 28,190 | |||||
925 | 33,365 | |||||
1,200 | 63,192 | |||||
(1) | Value realized based on the gain, equal to the difference between the closing price of the Common Shares on the option exercise date and the option exercise price, times the number of option shares being exercised. |
(2) | Value realized based on the closing price of the Common shares on the date of vesting. |
(3) | 13,907 common shares were withheld to cover the required tax withholding due on the vesting of the 35,000 restricted shares. These common shares vested on May 20, 2014. |
2,273 common shares were withheld to cover the required tax withholding due on the vesting of the 5,000 restricted shares. These common shares vested on May 30, 2014.
2,966 common shares were withheld to cover the required tax withholding due on the vesting of the 6,250 restricted shares. These common shares vested on June 2, 2014.
1,780 common shares were withheld to cover the required tax withholding due on the vesting of the 3,750 restricted shares. These common shares vested on June 2, 2014.
(4) | 1,475 common shares were withheld to cover the required tax withholding due on the vesting of the 4,500 restricted shares. These common shares vested on May 20, 2014. |
(5) | 811 common shares were withheld to cover the required tax withholding due on the vesting of the 2,500 restricted shares. These common shares vested on May 30, 2014. |
354 common shares were withheld to cover the required tax withholding due on the vesting of the 1,075 restricted shares. These common shares vested on June 2, 2014.
740 common shares were withheld to cover the required tax withholding due on the vesting of the 2,250 restricted shares. These common shares vested on June 2, 2014.
(6) | 874 common shares were withheld to cover the required tax withholding due on the vesting of the 2,700 restricted shares. These common shares vested on May 20, 2014. |
(7) | 399 common shares were withheld to cover the required tax withholding due on the vesting of the 1,200 restricted shares. These common shares vested on May 20, 2014. |
114
NONQUALIFIED DEFERRED COMPENSATION FOR FISCAL 2015
Name | Executive Contributions in Fiscal 2015 ($) | Company Contributions in Fiscal 2015 ($) | Aggregate Earnings in Fiscal 2015 ($) | Aggregate Withdrawals/ Distributions in Fiscal 2015 ($) | Aggregate Balance at 3/31/15 ($) |
Walter M Rosebrough, Jr. | — | — | — | — | — |
Michael J. Tokich | — | — | 9,440 | — | 126,953 |
Sudhir K. Pahwa | — | — | 33,666 | — | 298,641 |
David A. Johnson | — | — | — | — | — |
J. Adam Zangerle | — | — | 2,843 | — | 40,407 |
DEFERRED COMPENSATION PLAN
The Company maintains a nonqualified deferred compensation plan (the “Deferred Compensation Plan”). Pursuant to the Deferred Compensation Plan each eligible employee was entitled to elect to defer receipt of up to 25% of base salary and up to 100% of incentive compensation (bonus) and/or commissions. To be eligible to participate, an employee was required to be in a salary grade and earn a salary above specified levels and to meet certain residence and other tests. The Deferred Compensation Plan was amended during the 2012 fiscal year to eliminate all rights to defer base salary in respect of the 2012 calendar year and all succeeding calendar years and to eliminate all rights to defer incentive compensation and commissions in respect of the 2013 fiscal year and all succeeding fiscal years. Thus no contributions are shown in the table for fiscal 2015. Messrs. Tokich, Pahwa, and Zangerle are the only named executive officers who participate in the Deferred Compensation Plan.
Amounts deferred by each participant were credited to an account established in the name of the participant. Deferrals may be allocated among various available hypothetical investment options, as selected by the participant. There are currently several available hypothetical investment options. No Company “match” was made on amounts deferred. Hypothetical investment earnings (losses) on account balances are credited (charged) to the account.
Under the Deferred Compensation Plan, a participant is entitled to receive distribution of the participant’s account balance (amounts deferred, together with earnings (losses)) after the earliest to occur of the following: death, disability, retirement (termination of employment at or after age 65), other termination of employment, change of control (if the participant elected to have a distribution upon a change of control) or a specified date selected by the participant (which date must be at least two years after the making of the election) as an “in service” distribution date. At the time of his or her deferral election, a participant may designate how the participant will receive distribution if the distribution is triggered by retirement, disability or a change of control. Distribution options are a single lump sum or annual installments over a period of years (not to exceed ten). If a distribution election is not made or a distribution is made for another reason, the distribution will be in a lump sum. Also, if a participant’s account balance is less than $50,000 at the time of a triggering event, the distribution will be made in a lump sum. Distributions to persons who are “specified employees” under Section 409A of the Internal Revenue Code may be delayed. A “change of control” for distribution purposes is a change of control of the Company within the meaning of Section 409A of the Internal Revenue Code.
The Deferred Compensation Plan is not funded, within the meaning of the Employee Retirement Income Security Act of 1974, and participants have only an unsecured contractual commitment by the Company to pay amounts owed under the Deferred Compensation Plan. Amounts owed may be subject to the claims of the Company’s creditors in the event of the Company’s insolvency.
POTENTIAL PAYMENTS TO NAMED EXECUTIVE OFFICERS UPON TERMINATION OF EMPLOYMENT OR CHANGE IN CONTROL
We maintain various contracts, agreements, plans, policies, and arrangements (collectively, agreements) that may provide for payments or the provision of other benefits following or in connection with any termination or constructive termination of employment or a change in control of the Company or change in a named executive officer’s responsibilities. Some of these agreements are available generally to all of our salaried employees on the same basis as, and do not discriminate in scope, terms or operation in favor of, our executive officers. None of the named executive officers are covered by a Company maintained defined benefit pension plan or other tax-qualified plan, other than our 401(k) plan. The only agreements concerning compensation to which any of the named executive officers are party or in which any of the named executive officers participate, other than our frozen Deferred Compensation Plan, that are not available generally to all our salaried employees, are described below.
115
Senior Executive Severance Plan
STERIS maintains a Senior Executive Severance Plan (“Senior Severance Plan”). The Senior Severance Plan covers all of the named executive officers (including the CEO) and certain other executives. Under the Plan, a participant who terminates employment with the Company for Good Reason (as defined), or whose employment is terminated by the Company other than for Cause (as defined) will be entitled to severance benefits. Generally, severance benefits will consist of severance pay equal to the participant’s annual base salary, payable over twelve months, incentive compensation (bonus) for the fiscal year in which the termination occurs based upon financial targets achieved (and prorated to reflect the participant’s actual period of participation), and reimbursement for continuing medical and dental coverage for up to twelve months under the Company’s plans. Payment of severance benefits is contingent on the participant’s execution of a release of claims against the Company. The Senior Severance Plan does not provide for any tax gross-ups with respect to severance benefits under any circumstances. If the termination is in conjunction with a Change in Control (as defined) and within specified time frames, the severance pay amount will equal two times the participant’s annual base salary, also payable over a twelve month period. The Senior Severance Plan or a participant’s participation in the Senior Severance Plan may be terminated by the Company upon twelve months notice, with some limitations. An executive who was covered by both an agreement or other arrangement providing benefits in the nature of severance and by the Senior Severance Plan, will be entitled to receive benefits under whichever provides for greater benefits, but not both.
Equity Incentive Plan
STERIS’s 2006 Long-Term Equity Incentive Plan (“2006 Plan”) authorizes the issuance or grant of various stock and stock related incentives, including stock options, restricted stock, restricted stock units, stock appreciation rights, performance units and other stock awards to employees and non-employee directors. All grants of stock options, restricted stock, restricted stock units, SARs and other stock awards made by STERIS subsequent to original approval of the 2006 Plan have been made pursuant to the 2006 Plan. Most stock option grants made prior to the approval of the 2006 Plan were pursuant to various other previously established plans. In connection with the adoption of the 2006 Plan, we discontinued the grant of options or other equity incentives under the previously established plans. However, some options granted under one of the previously established plans remain outstanding. As of March 31, 2015, there were two million seven hundred eighty-four thousand eight hundred and ten (2,784,810) shares remaining available for grant from the 2006 Plan.
In general, upon termination of an award recipient’s employment, the nonvested portions of his or her stock option grants, restricted stock awards and other equity incentive awards are immediately forfeited. However, unvested option grants and restricted stock awards will become vested and nonforfeitable upon an optionee’s death while employed and unvested restricted stock units and other equity incentive awards may be modified by the Company to give the award recipient the benefit of the award or unit through the date of death. Also, stock option and stock appreciation rights held by persons who are age 55 and have at least 5 years of service at termination may be exercisable for an extended period equal to the remaining term of the award. These extended exercise provisions are contingent upon the grantee remaining in Good Standing (as defined in the 2006 Plan) and not dying prior to expiration of the term, and are subject to the other 2006 Plan terms. If a recipient fails to remain in Good Standing, any outstanding stock options, restricted stock awards and other equity incentive compensation awards may be forfeited.
Under the provisions of the 2006 Plan in effect prior to March 13, 2014, as well as the previously established plans, upon the occurrence of a change in control (as defined in the 2006 Plan), all options and other awards then outstanding, to the extent unvested, generally vest and become immediately exercisable, without further action. The 2006 Plan was amended effective March 13, 2014 to provide new rules for changes of control for equity awards made on or after March 13, 2014. Under the new rules, awards do not automatically vest upon a change in control, provided the participant receives a qualifying replacement award. To qualify as a replacement award, the award must satisfy a number of criteria, including a requirement that the value of the replacement award be at least equal to the value of the award being replaced. The Board or Compensation Committee, as constituted immediately prior to the change in control, determines in its sole discretion whether the criteria have been satisfied. If a participant receives a qualifying replacement award, early vesting will occur only to the extent the participant’s employment is terminated by the participant for Good Reason (as defined in the 2006 Plan) or by his or her employer other than for Cause (as defined in the 2006 Plan), within two years after the change in control.
While the definition of change in control varies somewhat from plan to plan, in general a change in control under each includes any of the following: the acquisition by any person or group of 25% or more of the combined voting power of the Company’s outstanding voting stock; certain changes in the composition of a majority of the Board membership; the consummation of certain reorganizations, mergers or consolidations or disposition of all or substantially all of the assets of the Company or certain other business transactions involving the Company; or approval by the shareholders of a complete liquidation or dissolution of the Company. The Combination does not constitute a change in control under the 2006 Plan.
In connection with the grant of stock options, restricted stock, restricted stock units and stock appreciation rights under the 2006 Plan and previously established plans, optionees and other award recipients agree to restrictive covenants concerning non-
116
competition, non-interference and non-disclosure. If the recipient breaches any of these covenants, in addition to any other remedies we may have, awards then held by the recipient and stock then held that was received pursuant to awards may be forfeited.
Management Incentive Compensation Plan
We have established and maintain a Management Incentive Compensation Plan (sometimes referred to as the “Bonus Plan”), for key employees. The Bonus Plan is intended to support our compensation philosophy and encourage achievement of objectives by key employees whose responsibilities affect the performance of the business. Participants are selected annually. During fiscal 2015, all named executive officers, other than Mr. Rosebrough, were participants in the Bonus Plan.
Also each Bonus Plan participant is assigned annually a “target” bonus based upon his or her position and level of responsibility within the Company. The target bonus is an amount equal to the percentage of the participant’s base salary that he or she would receive as a bonus if all of the objectives established for, or otherwise applicable to, the participant are achieved. If the objectives are exceeded, a larger bonus may be payable. If the objectives are not attained, a smaller bonus or no bonus may be payable. In no case may the bonus payable to a participant exceed a cap of 200% of his or her target bonus. Generally, a participant is not entitled to a bonus in respect of a particular fiscal year unless he or she remains in the employ of the Company through the end of that fiscal year, except to the extent otherwise contractually required.
The Bonus Plan also provides that within twenty (20) days after the occurrence of the first Change of Control (as defined in the Bonus Plan) in any fiscal year, each participant may be paid an interim lump-sum cash payment with respect to his or her participation in the Bonus Plan, with the amount of the interim payment to be equal to the dollar amount of the participant’s target bonus for the entire fiscal year multiplied by a fraction, the numerator of which is the number of months between the beginning of the fiscal year and the end of the month in which the Change of Control occurs and the denominator of which is 12. The making of the interim payment will not reduce the obligation to make a final payment under the terms of the Bonus Plan, but the amount of any interim payment will be an offset against any later payment due under the Bonus Plan in respect of the fiscal year. A participant is not required to refund any portion of the interim payment. The Company will not make any interim payments in respect of the Combination.
For purposes of the Bonus Plan, a Change of Control includes the following: the acquisition by any person or group of 50% or more (or in some cases as little as 15%) of the Company’s outstanding Common Shares; a person’s commencement or public announcement of an intention to commence a tender offer that would result in such person becoming beneficial owner of 15% or more of the Company’s outstanding Common Shares; certain changes in the composition of a majority of the Board membership within a 24 month period; the consummation of certain mergers or consolidations, or dispositions of all or substantially all of the assets of the Company; or a person’s proposal of a “Control Share Acquisition” of the Company within the meaning of the Ohio General Corporation Law.
Senior Executive Management Incentive Compensation Plan
We have established and maintain a Senior Executive Management Incentive Compensation Plan (sometimes referred to as the “SEMICP”) for the CEO and any other executive officer or employee designated by the Compensation Committee. The SEMICP is intended to support our compensation philosophy and encourage achievement of objectives by key employees by providing incentives for superior performance. Participants are selected by the Compensation Committee in its sole discretion. During fiscal 2015, Mr. Rosebrough was the only participant in the SEMICP.
Annually, the Compensation Committee establishes the performance objectives for each SEMICP participant and the amount of incentive compensation payable (or formula for determining such amount) if the specified performance objectives for such fiscal year are achieved or exceeded. Performance objectives may be described in terms of Company-wide objectives or objectives that are related to the performance of the individual participant or of the subsidiary, division, department or function within the Company or one or more subsidiaries in which the participant is employed or for which the participant has responsibilities. The performance objectives are required to be limited to specified levels of Company (or subsidiary, division, department or function) performance, or such performance relative to peer company performance, in one or more, or a combination, of the following: earnings per share, return on invested capital, return on total capital, return on assets, return on equity, total shareholder return, stock value, net income, revenue, free cash flow, cash flow, operating profit, gross margin and/or contribution margin, earnings before interest and taxes, earnings before interest, taxes, depreciation and amortization, productivity improvement, and expense or liability reduction. The Compensation Committee may further specify in respect of the specific performance objectives a minimum acceptable level of achievement below which no incentive compensation payment will be made and set forth a formula for determining the amount of any payment to be made if performance is at or above the minimum acceptable level but falls short of full achievement of the specific performance objectives or exceeds full achievement of the specified performance objectives. The Committee retains the discretion to reduce the amount of any incentive compensation that would be otherwise payable to a participant (including a reduction in such amount to zero). The Compensation Committee is required to determine, as soon as reasonably practicable after the end of each fiscal year, whether
117
the performance objectives have been achieved and the amount of incentive compensation payable, and to document such determinations.
The maximum incentive compensation that may be paid to a participant under the SEMICP in respect of any fiscal year may not exceed the lesser of two and one-half (2 1/2) times the participant’s annual base salary or $2,500,000. Any incentive compensation payable under the SEMICP in respect of any fiscal year must be paid within two and one-half months after the end of the fiscal year.
TABLES OF PAYMENT ESTIMATES
Introduction
The tables that follow estimate and summarize the potential payments and benefits under compensation and benefit plans and contractual agreements to which the named executive officers are a party or a participant that may be realizable by each of the named executive officers in the event of a termination of employment and/or change in control under the circumstances described in the footnotes and column headings to the tables, as supplemented by the narrative descriptions of agreements and/or plans addressing or containing provisions relating to change in control and/or termination payments and benefits. These narrative descriptions are found under “Potential Payments to Named Executive Officers Upon Termination of Employment or Change in Control” in Item 11. Executive Compensation.
Excluded Amounts
The amounts shown in the tables that follow do not include payments and benefits to the extent they are provided on a non-discriminatory basis to salaried employees generally upon termination of employment. These include accrued salary and vacation pay, regular severance benefits, and distributions of plan balances under our 401(k) plan. The tables also do not include amounts receivable under the Deferred Compensation Plan (see subsection of Item 11. Executive Compensation, titled “Deferred Compensation Plan” for additional information).
118
Walter M Rosebrough, Jr.(1)
The table below describes those benefits to which Mr. Rosebrough would have been entitled under the Company’s Senior Executive Severance Plan (“Senior Executive Severance Plan”) and his equity awards under various scenarios, including change in control scenarios, as of March 31, 2015.
Termination by the Company without Cause or Termination by the employee for Good Reason(2) | Change in Control without Termination and no Qualifying Replacement Award | Change in Control without Termination but with Qualifying Replacement Award | Change in Control and Termination by the Company without Cause or Termination by the employee for Good Reason(4) | |
Severance Payment | $800,000 | $0 | $0 | $1,600,000 |
Stock Options(3) | $0 | $6,041,205 | $4,047,955 | $6,041,205 |
Restricted Stock(3) | $0 | $3,478,365 | $2,283,775 | $3,478,365 |
Pro-Rata Bonus Payment | $1,108,000 | $0 | $0 | $1,108,000 |
Medical and Dental Benefits | $10,572 | $0 | $0 | $10,572 |
Totals | $1,918,572 | $9,519,570 | $6,331,730 | $12,238,142 |
(1) | For purposes of this disclosure, the Change in Control date and all termination events are assumed to occur on March 31, 2015. The stock price used is the closing price of $70.27 on March 31, 2015, the assumed termination and Change in Control date. |
(2) | Pursuant to the Senior Executive Severance Plan, in the event of a “qualifying termination” in circumstances not involving a Change in Control, Mr. Rosebrough will be entitled to 12 months of severance payments based on his then current base salary, a pro-rata portion of his actual bonus, and 12 months of medical and dental benefits. A “qualifying termination” is any separation of service other than by the Company for Cause (as defined) or by executive without Good Reason (as defined). Good Reason includes death or Disability (as defined). Mr. Rosebrough’s actual bonus for fiscal 2015 is $1,108,000. The proration is 100% because the assumed termination date is the fiscal year end. |
(3) | In the event of a Change in Control with or without termination, or a termination on account of death, Mr. Rosebrough will be entitled to accelerated vesting of stock options and restricted stock awards made on or before March 12, 2014. Values attributable to accelerated vesting for stock options and restricted stock are shown in the first and third “Change in Control” columns. Awards granted after March 12, 2014 provide for double trigger vesting in Change in Control situations, that is, both a change in control and termination of employment under specified circumstances are required, provided the grantee receives a qualifying replacement award. |
(4) | Pursuant to the Senior Executive Severance Plan, in the event of a “qualifying termination” within one (1) year following a change in control, Mr. Rosebrough will be entitled to 12 months of severance payments based on a multiple of two (2) times his then current base salary, a pro-rata portion of his actual bonus, and 12 months of medical and dental benefits. A “qualifying termination” is any separation of service other than by the Company for Cause (as defined) or by executive without Good Reason (as defined). Good Reason includes death or Disability (as defined). Mr. Rosebrough’s actual bonus for 2015 is $1,108,000. The proration is 100% because the assumed termination date is the fiscal year end. |
119
Michael J. Tokich(1)
The table below describes those benefits to which Mr. Tokich would have been entitled under the Company’s Senior Executive Severance Plan (“Senior Executive Severance Plan”) and his equity awards under various scenarios, including change in control scenarios, as of March 31, 2015.
Termination by the Company without Cause or Termination by the employee for Good Reason(2) | Change in Control without Termination and no Qualifying Replacement Award | Change in Control without Termination but with Qualifying Replacement Award | Change in Control and Termination by the Company without Cause or Termination by the employee for Good Reason(4) | |
Severance Payment | $391,007 | $0 | $0 | $782,014 |
Stock Options(3) | $0 | $1,407,548 | $938,548 | $1,407,548 |
Restricted Stock(3) | $0 | $1,559,994 | $1,243,779 | $1,559,994 |
Pro-Rata Bonus Payment | $422,405 | $0 | $0 | $422,405 |
Medical and Dental Benefits | $17,316 | $0 | $0 | $17,316 |
Totals | $830,728 | $2,967,542 | $2,182,327 | $4,189,277 |
(1) | For purposes of this disclosure, the Change in Control date and all termination events are assumed to occur on March 31, 2015. The stock price used is the closing price of $70.27 on March 31, 2015, the assumed termination and Change in Control date. |
(2) | Pursuant to the Senior Executive Severance Plan, in the event of a “qualifying termination” in circumstances not involving a Change in Control, Mr. Tokich will be entitled to 12 months of severance payments based on his then current base salary, a pro-rata portion of his actual bonus, and 12 months of medical and dental benefits. A “qualifying termination” is any separation of service other than by the Company for Cause (as defined) or by executive without Good Reason (as defined). Good Reason includes death or Disability (as defined). Mr. Tokich’s actual bonus for fiscal 2015 is $422,425. The proration is 100% because the assumed termination date is the fiscal year end. |
(3) | In the event of a Change in Control with or without termination, or a termination on account of death, Mr. Tokich will be entitled to accelerated vesting of stock options and restricted stock awards made on or before March 12, 2014. Values attributable to accelerated vesting for stock options and restricted stock are shown in the first and third “Change in Control” columns. Awards granted after March 12, 2014 provide for double trigger vesting in Change in Control situations, that is, both a change in control and termination of employment under specified circumstances are required, provided the grantee receives a qualifying replacement award. |
(4) | Pursuant to the Senior Executive Severance Plan, in the event of a “qualifying termination” within one (1) year following a change in control, Mr. Tokich will be entitled to 12 months of severance payments based on a multiple of two (2) times his then current base salary, a pro-rata portion of his actual bonus, and 12 months of medical and dental benefits. A “qualifying termination” is any separation of service other than by the Company for Cause (as defined) or by executive without Good Reason (as defined). Good Reason includes death or Disability (as defined). Mr. Tokich’s actual bonus for 2015 is $422,425. The proration is 100% because the assumed termination date is the fiscal year end. |
120
Sudhir K. Pahwa(1)
Termination by the Company without Cause or Termination by the employee for Good Reason(2) | Change in Control without Termination and no Qualifying Replacement Award | Change in Control without Termination but with Qualifying Replacement Award | Change in Control and Termination by the Company without Cause or Termination by the employee for Good Reason(4) | |
Severance Payment | $328,366 | $0 | $0 | $656,733 |
Stock Options(3) | $0 | $664,149 | $371,024 | $664,149 |
Restricted Stock(3) | $0 | $665,808 | $454,998 | $665,808 |
Pro-Rata Bonus Payment | $272,872 | $0 | $0 | $272,872 |
Medical and Dental Benefits | $14,620 | $0 | $0 | $14,620 |
Totals | $615,858 | $1,329,957 | $826,022 | $2,274,182 |
(1) | For purposes of this disclosure, the Change in Control date and all termination events are assumed to occur on March 31, 2015. The stock price used is the closing price of $70.27 on March 31, 2015, the assumed termination and Change in Control date. |
(2) | Pursuant to the STERIS Corporation Senior Executive Severance Plan (“Senior Executive Severance Plan”), in the event of a “qualifying termination” in circumstances not involving a Change in Control, Mr. Pahwa will be entitled to 12 months of severance payments based on his then current base salary, a pro-rata portion of his actual bonus, and 12 months of medical and dental benefits. A “qualifying termination” is any separation of service other than by the Company for Cause (as defined) or by executive without Good Reason (as defined). Good Reason includes death or Disability (as defined). Mr. Pahwa’s actual bonus for fiscal 2015 is $272,282. The proration is 100% because the assumed termination date is the fiscal year end. |
(3) | In the event of a Change in Control with or without termination, or a termination on account of death, Mr. Pahwa will be entitled to accelerated vesting of stock options and restricted stock awards made on or before March 12, 2014. Values attributable to accelerated vesting for stock options and restricted stock are shown in the first and third “Change in Control” columns. Awards granted after March 12, 2014 provide for double trigger vesting in Change in Control situations, that is, both a change in control and termination of employment under specified circumstances are required, provided the grantee receives a qualifying replacement award. |
(4) | Pursuant to the Senior Executive Severance Plan, in the event of a “qualifying termination” within one (1) year following a change in control, Mr. Pahwa will be entitled to 12 months of severance payments based on a multiple of two (2) times his then current base salary, a pro-rata portion of his actual bonus, and 12 months of medical and dental benefits. A “qualifying termination” is any separation of service other than by the Company for Cause (as defined) or by executive without Good Reason (as defined). Good Reason includes death or Disability (as defined). Mr. Pahwa’s actual bonus for 2015 is $272,282. The proration is 100% because the assumed termination date is the fiscal year end. |
121
David A. Johnson(1)
Termination by the Company without Cause or Termination by the employee for Good Reason(2) | Change in Control without Termination and no Qualifying Replacement Award | Change in Control without Termination but with Qualifying Replacement Award | Change in Control and Termination by the Company without Cause or Termination by the employee for Good Reason(4) | |
Severance Payment | $309,588 | $0 | $0 | $619,175 |
Stock Options(3) | $0 | $468,988 | $351,738 | $468,988 |
Restricted Stock(3) | $0 | $1,349,184 | $997,834 | $1,349,184 |
Pro-Rata Bonus Payment | $214,389 | $0 | $0 | $214,389 |
Medical and Dental Benefits | $19,046 | $0 | $0 | $19,046 |
Totals | $543,023 | $1,818,172 | $1,349,572 | $2,670,782 |
(1) | For purposes of this disclosure, the Change in Control date and all termination events are assumed to occur on March 31, 2015. The stock price used is the closing price of $70.27 on March 31, 2015, the assumed termination and Change in Control date. |
(2) | Pursuant to the STERIS Corporation Senior Executive Severance Plan (“Senior Executive Severance Plan”), in the event of a “qualifying termination” in circumstances not involving a Change in Control, Mr. Johnson will be entitled to 12 months of severance payments based on his then current base salary, a pro-rata portion of his actual bonus, and 12 months of medical and dental benefits. A “qualifying termination” is any separation of service other than by the Company for Cause (as defined) or by executive without Good Reason (as defined). Good Reason includes death or Disability (as defined). Mr. Johnson’s actual bonus for fiscal 2015 is $214,389. The proration is 100% because the assumed termination date is the fiscal year end. |
(3) | In the event of a Change in Control with or without termination, or a termination on account of death, Mr. Johnson will be entitled to accelerated vesting of stock options and restricted stock awards made on or before March 12, 2014. Values attributable to accelerated vesting for stock options and restricted stock are shown in the first and third “Change in Control” columns. Awards granted after March 12, 2014 provide for double trigger vesting in Change in Control situations, that is, both a change in control and termination of employment under specified circumstances are required, provided the grantee receives a qualifying replacement award. |
(4) | Pursuant to the Senior Executive Severance Plan, in the event of a “qualifying termination” within one (1) year following a change in control, Mr. Johnson will be entitled to 12 months of severance payments based on a multiple of two (2) times his then current base salary, a pro-rata portion of his actual bonus, and 12 months of medical and dental benefits. A “qualifying termination” is any separation of service other than by the Company for Cause (as defined) or by executive without Good Reason (as defined). Good Reason includes death or Disability (as defined). Mr. Johnson’s actual bonus for 2015 is $214,389. The proration is 100% because the assumed termination date is the fiscal year end. |
122
J. Adam Zangerle(1)
The table below describes those benefits to which Mr. Zangerle would have been entitled under the Company’s Senior Executive Severance Plan (“Senior Executive Severance Plan”) and his equity awards under various scenarios, including change in control scenarios, as of March 31, 2015.
Termination by the Company without Cause or Termination by the employee for Good Reason(2) | Change in Control without Termination and no Qualifying Replacement Award | Change in Control without Termination but with Qualifying Replacement Award | Change in Control and Termination by the Company without Cause or Termination by the employee for Good Reason(4) | |
Severance Payment | $276,923 | $0 | $0 | $553,846 |
Stock Options(3) | $0 | $423,941 | $218,720 | $423,941 |
Restricted Stock(3) | $0 | $762,570 | $604,322 | $762,570 |
Pro-Rata Bonus Payment | $239,712 | $0 | $0 | $239,712 |
Medical and Dental Benefits | $10,572 | $0 | $0 | $10,572 |
Totals | $527,207 | $1,186,511 | $823,042 | $1,990,641 |
(1) | For purposes of this disclosure, the Change in Control date and all termination events are assumed to occur on March 31, 2015. The stock price used is the closing price of $70.27 on March 31, 2015, the assumed termination and Change in Control date. |
(2) | Pursuant to the Senior Executive Severance Plan, in the event of a “qualifying termination” in circumstances not involving a Change in Control, Mr. Zangerle will be entitled to 12 months of severance payments based on his then current base salary, a pro-rata portion of his actual bonus, and 12 months of medical and dental benefits. A “qualifying termination” is any separation of service other than by the Company for Cause (as defined) or by executive without Good Reason (as defined). Good Reason includes death or Disability (as defined). Mr. Zangerle’s actual bonus for fiscal 2015 is $239,712. The proration is 100% because the assumed termination date is the fiscal year end. |
(3) | In the event of a Change in Control with or without termination, or a termination on account of death, Mr. Zangerle will be entitled to accelerated vesting of stock options and restricted stock awards made on or before March 12, 2014. Values attributable to accelerated vesting for stock options and restricted stock are shown in the first and third “Change in Control” columns. Awards granted after March 12, 2014 provide for double trigger vesting in Change in Control situations, that is, both a change in control and termination of employment under specified circumstances are required, provided the grantee receives a qualifying replacement award. |
(4) | Pursuant to the Senior Executive Severance Plan, in the event of a “qualifying termination” within one (1) year following a change in control, Mr. Zangerle will be entitled to 12 months of severance payments based on a multiple of two (2) times his then current base salary, a pro-rata portion of his actual bonus, and 12 months of medical and dental benefits. A “qualifying termination” is any separation of service other than by the Company for Cause (as defined) or by executive without Good Reason (as defined). Good Reason includes death or Disability (as defined). Mr. Zangerle’s actual bonus for 2015 is $239,712. The proration is 100% because the assumed termination date is the fiscal year end. |
123
ITEM 12. | SECURITY OWNERSHIP OF CERTAIN BENEFICIAL OWNERS AND MANAGEMENT AND RELATED STOCKHOLDER MATTERS |
EQUITY COMPENSATION PLAN INFORMATION
The table below presents information concerning all equity compensation plans and individual equity compensation arrangements in effect as of our March 31, 2015 fiscal year end.
Plan Category | Number of securities to be issued upon exercise of outstanding options, warrants and rights | Weighted-average exercise price of outstanding options, warrants and rights ($) | Number of securities remaining available for future issuance under equity compensation plans (excluding securities reflected in column (a)) | |||
(a) | (b) | (c) | ||||
Equity compensation plans approved by security holders | 1,759,890 | 37.03 | 2,784,810 | |||
Equity compensation plans not approved by security holders | — | — | — | |||
Total | 1,759,890 | 37.03 | 2,784,810 | |||
OWNERSHIP OF VOTING SECURITIES - 5% OWNERS
The following table shows certain information with respect to all persons known by STERIS to beneficially own more than five percent of the Company’s outstanding Common Shares, based on 59,677,128 Common Shares outstanding as of April 30, 2015.
Name and Address of Beneficial Owner | Amount and Nature of Beneficial Ownership | Percent of Class | |
BlackRock Inc. 40 East 52nd Street, New York, NY 10022 | 5,387,527(1) | 9.03 | % |
FMR LLC 245 Summer Street, Boston, MA 02210 | 4,406,411(2) | 7.38 | % |
The Vanguard Group, Inc. 100 Vanguard Blvd., Malvern, PA 19355 | 3,594,320(3) | 6.02 | % |
RidgeWorth Capital Management, Inc., as Parent Company of Ceredex Value Advisors LLC and Certium Asset Management LLC 3333 Piedmont Road NE, Suite 1500, Atlanta, GA 30305 | 3,236,618(4) | 5.42 | % |
(1) | Based solely upon information contained in a Schedule 13G/A filed with the Securities and Exchange Commission on January 15, 2015, which Schedule specifies that BlackRock Inc. has sole voting power with respect to 5,253,155 of these shares, shared voting power with respect to none of these shares and sole dispositive power with respect to 5,387,527 of these shares and shared dispositive power with respect to none of these shares. |
(2) | Based solely upon information contained in a Schedule 13G filed with the Securities and Exchange Commission on February 13, 2015, which Schedule specifies that FMR LLC has sole voting power with respect to 136,509 of these shares, shared voting power with respect to none of these shares and sole dispositive power with respect to 4,406,411 of these shares and shared dispositive power with respect to none of these shares. |
(3) | Based solely upon information contained in a Schedule 13G/A filed with the Securities and Exchange Commission on February 11, 2015, which Schedule specifies that The Vanguard Group, Inc. has sole voting power with respect 79,377 of these shares, shared voting power with respect to none of these shares and sole dispositive power with respect to 3,520,243 of these shares and shared dispositive power with respect to 74,077 of these shares. |
(4) | Based solely upon information contained in a Schedule 13G/A filed with the Securities and Exchange Commission on February 12, 2015, which Schedule specifies that RidgeWorth Capital Management, Inc., as Parent Company for Ceredex Value Advisors LLC and Certium Asset Management LLC, has sole voting power with respect to 2,888,568 of these shares, shared voting power with respect to none of these shares and sole dispositive power with respect to all of these shares and shared dispositive power with respect to none of these shares. |
124
STOCK OWNERSHIP OF DIRECTORS AND EXECUTIVE OFFICERS
The following table shows the beneficial ownership of our Common Shares by each director of the Company, each of the named executive officers and all directors and executive officers of the Company as a group, as of April 30, 2015, unless otherwise indicated below.
Number of Shares Beneficially Owned as of April 30, 2015(1) | ||||
Name of Beneficial Owner | Shares Owned Directly and Indirectly(2) | Stock Options Exercisable Within 60 Days of April 30, 2015 | Total Stock-Based Ownership | |
Walter M Rosebrough, Jr.(3) | 261,457 | 94,000 | 355,457 | |
Michael J. Tokich | 36,335 | 86,100 | 122,435 | |
Sudhir K. Pahwa | 20,540 | 30,226 | 50,766 | |
David A. Johnson | 21,026 | 29,250 | 50,276 | |
J. Adam Zangerle | 15,064 | 26,063 | 41,127 | |
Richard C. Breeden | 97,537 | 25,066 | 122,603(4) | |
Cynthia L. Feldmann | 10,000 | 7,999 | 17,999 | |
Jacqueline B. Kosecoff(3) | 30,362 | 38,453 | 68,815 | |
David B. Lewis | 6,684 | 9,472 | 16,156 | |
Kevin M. McMullen | 32,231 | 19,212 | 51,443 | |
Mohsen M. Sohi | 16,825 | 33,318 | 50,143 | |
John P. Wareham | 31,560 | 23,494 | 55,054 | |
Loyal W. Wilson | 23,525 | 29,212 | 52,737 | |
Michael B. Wood | 28,732 | 33,796 | 62,528 | |
All Directors and Executive Officers as a group (17 persons) | 696,881 | 579,879 | 1,276,760 | |
(1) | As of April 30, 2015, (a) none of the directors and executive officers beneficially owned 1% or more of our outstanding Common Shares and (b) the directors and executive officers of the Company as a group beneficially owned approximately 2.12% of the outstanding Common Shares (including shares subject to stock options exercisable by them within 60 days). |
(2) | Included are (a) Common Shares beneficially owned outright; (b) restricted Common Shares; (c) Common Shares held in the Company’s 401(k) plan; and Common Shares held through a trust. Except as otherwise provided in the following footnotes, all listed Beneficial Owners have sole voting power and sole investment power as to the Common Shares listed in this column. |
(3) | With respect to the Common Shares listed in the first column, the following Beneficial Owners have shared voting power and shared investment power: Mr. Rosebrough as to 90,000 Common Shares; and Dr. Kosecoff as to 9,063 Common Shares. |
(4) | Based on disclosures in Mr. Breeden’s prior SEC filings, Mr. Breeden has disclaimed beneficial ownership of these shares which shares are held by investment funds managed by Breeden Capital Management LLC, a registered investment adviser of which Mr. Breeden is the managing member. |
Total Number of Shares Beneficially Owned by and CRSUs (as defined below) of Non-Employee Directors as of April 30, 2015 | ||||
Name of Beneficial Owner | Total Stock-Based Ownership (1) | CRSUs | Total Stock Based Ownership Including CRSUs | |
Richard C. Breeden | 122,603 | 5,587 | 128,190 | |
Cynthia L. Feldmann | 17,999 | 5,110 | 23,109 | |
Jacqueline B. Kosecoff | 68,815 | 2,845 | 71,660 | |
David B. Lewis | 16,156 | 6,177 | 22,333 | |
Kevin M. McMullen | 51,443 | — | 51,443 | |
Mohsen M. Sohi | 50,143 | — | 50,143 | |
John P. Wareham | 55,054 | 4,111 | 59,165 | |
Loyal W. Wilson | 52,737 | 8,434 | 61,171 | |
Michael B. Wood | 62,528 | 1,309 | 63,837 | |
(1) | All numbers are from column 3 of the first table above. |
125
CHANGES IN CONTROL
On October 13, 2014, STERIS and Synergy Health plc (“Synergy”) issued an announcement stating that a newly formed U.K. corporation, New STERIS Limited (“New STERIS”), was commencing a “recommended offer” under English law to effect the combination of STERIS and Synergy (the “Combination”). In connection with the Combination, (i) a wholly owned indirect subsidiary of New STERIS will merge with and into STERIS (the “Merger”) with STERIS surviving the Merger as an indirect wholly owned subsidiary of New STERIS and (ii) New STERIS will acquire all of the outstanding shares of Synergy by means of a court-sanctioned scheme of arrangement (the “Scheme”) under English law. Under the terms of the Combination, (i) STERIS shareholders will receive one New STERIS share for each STERIS share they hold and (ii) Synergy shareholders will receive 439 pence in cash and 0.4308 shares of New STERIS for each Synergy share they hold, resulting among other things in the former shareholders of STERIS receiving 70% of the equity of New STERIS and the former shareholders of Synergy receiving 30% of the equity in STERIS. There can be no assurance that the Combination will occur. The Combination is described in greater detail in STERIS’s proxy statement/prospectus dated February 6, 2015.
NON-EMPLOYEE DIRECTOR COMPENSATION
Description of Non-Employee Director Compensation for Fiscal 2015.
Non-employee Directors are compensated by the Company for their service as such for each term of office. Company employees serving as Directors are not compensated for their service as Directors.
For the 2014-15 term of office, the Chairman of the Board was paid a retainer of $290,000 and each other non-employee Director was paid a retainer of $200,000. These retainers were paid in full at the beginning of the term. Retainer fees are fully vested immediately upon payment, regardless of the form in which paid.
For all current Directors, absent an election to the contrary, the retainer fee was payable as follows for the 2014-15 term of office: $65,000 in cash ($95,000 for the Chairman), $67,500 in stock options ($97,500 for the Chairman) and $67,500 in career restricted stock units (“CRSUs”) ($97,500 for the Chairman). However, a Director may elect to receive all or a part of the cash or option portions of the fee in STERIS shares or CRSUs and may elect to receive the CRSU portion of the fee in STERIS shares, and certain Directors made these elections.
A non-employee Director first elected after the 2013 Annual Meeting of Shareholders will receive the same amount of retainer fees, but the available forms of payment will be limited until such time as the Director has satisfied the Company’s Non-Employee Director Stock Ownership Guidelines (see subsection of Item 12. Security Ownership of Certain Beneficial Owners and Management and Related Stockholder Matters titled, “Non-Employee Director Stock Ownership Guidelines” for additional information). A new Director will receive a retainer fee of $65,000 in cash, but may elect to receive CRSUs in lieu of all or a portion of the cash. The remaining $135,000 of the Director’s retainer fee will be payable in CRSUs.
The number of CRSUs or STERIS shares a Director is entitled to receive for each annual term will be determined based upon the dollar amount of the retainer fees elected to be received in CRSUs or STERIS shares, respectively and the STERIS per share closing price on the NYSE on the effective date of grant. The number of options a Director is entitled to receive is determined based upon the same factors and a Black-Scholes calculation, and the option price is the NYSE grant date closing price. A Director’s CRSUs will be settled in STERIS common shares six months after the cessation of the Director’s Board service. Directors will be paid cash dividend equivalents on their CRSUs as dividends are paid on STERIS common shares.
The following Committee Chair fees were paid for the 2014-2015 terms of office: Audit Committee Chair - $15,000; Compensation Committee Chair - $10,000; and other Committee Chairs - $7,500 each. These fees are payable in cash. Meeting attendance fees are payable to each Director at a rate of $1,000 per meeting for each Board meeting and assigned Committee meeting attended in excess of 20 during the annual term. No meeting attendance fees were paid for the 2014-2015 term.
126
Director Compensation Table for Fiscal 2015.
Name | Fees Earned or Paid in Cash ($)(1) | Stock Awards ($)(2) | Option Awards ($)(3) | Career Restricted Stock Units $(4) | All Other Compensation ($)(5) | Total ($) | ||||||
Richard C. Breeden(6) | 7,500 | — | 65,871 | 132,484 | 4,488 | 210,343 | ||||||
Cynthia L. Feldmann | 65,000 | — | 29,271 | 104,967 | 4,171 | 203,409 | ||||||
Jacqueline B. Kosecoff | 7,500 | 64,979 | 65,871 | 67,453 | 2,286 | 208,089 | ||||||
David B. Lewis | 55,000 | — | — | 159,949 | 4,907 | 219,856 | ||||||
Kevin M. McMullen | 65,000 | 134,957 | — | — | — | 199,957 | ||||||
Mohsen M. Sohi | 65,000 | 104,967 | 29,271 | — | — | 199,238 | ||||||
John P. Wareham | 95,000 | — | 95,157 | 97,495 | 3,303 | 290,955 | ||||||
Loyal W. Wilson | 10,000 | — | — | 199,988 | 6,776 | 216,764 | ||||||
Michael B. Wood | 65,000 | — | 65,871 | 67,453 | 903 | 199,227 | ||||||
(1) | The dollar amount represents the portion of the annual retainer fee paid in cash for the 2014-2015 annual term plus chair fees, where applicable, for the fiscal year ended March 31, 2015. |
(2) | The dollar amounts reflect the closing sales price per share of the Company’s common stock on the New York Stock Exchange Composite Tape on the effective date of the grant. |
(3) | The dollar amounts reflect the grant date fair value of stock options granted in fiscal 2015 FASB ASC Topic 718. The grant date fair value of an award is determined utilizing assumptions discussed in Notes to our financial statements for the fiscal year ended March 31, 2015. The grant date fair value estimate for these stock option awards in accordance FASB ASC Topic 718 equaled the compensation cost recognized by the Company during fiscal 2015. |
(4) | The dollar amounts reflect the closing sales price per share of the Company’s common stock on the New York Stock Exchange Composite Tape on the effective date of the grant. |
(5) | Consists of dividend equivalents paid on CRSUs for fiscal 2015. |
(6) | Based on disclosures in Mr. Breeden’s prior SEC filings, the governing documents of Breeden Capital Management LLC and related investment funds provide that compensation received by Mr. Breeden for services as a director of the Company is apportioned among the investment funds, and Mr. Breeden has no interest in such compensation other than to the extent of his pro-rata ownership interest in the investment funds. |
Non-Employee Director Stock Ownership Guidelines.
During fiscal 2013, the Board revised its non-employee director stock ownership guidelines (the “guidelines”). Under the revised guidelines, each non-employee Director is required to own Company Common Stock with a value of at least six (6) times the cash portion of the annual Director fees payable to the Director (determined before giving effect to any election by the Director to receive fees in a different form). As noted previously, the cash portion of the annual Director fees for the 2014-15 term of office was $95,000 for the Chairman and $65,000 for each of the other non-employee Directors (determined before giving effect to any election by the Director to receive fees in other forms). A new Director has a period of five years from the date of initial appointment or election to satisfy the guidelines. For purposes of the guidelines, all shares held beneficially directly or indirectly by a Director and all career restricted stock units (“CRSUs”), if any, held by a Director will be counted; however, stock options are not be counted for guideline purposes. Based upon the number of shares and CRSUs held by each of our Directors as of April 30, 2015 and our share price of $66.50 per share as of the close of business on such date, each of our Directors satisfied the guidelines as of such date.
ITEM 13. | CERTAIN RELATIONSHIPS AND RELATED TRANSACTIONS, AND DIRECTOR INDEPENDENCE |
RELATED PERSON TRANSACTIONS
During fiscal 2015, we were not a participant in, and there are not currently proposed, any related person transactions (within the meaning of, and required to be disclosed under, Item 404(a) of Regulation S-K).
Our Director Code of Ethics provides that STERIS directors may not receive any loans, consulting fees, or other material personal profit or benefit in connection with any transaction involving STERIS, other than compensation, expense payments
127
and committee fees as a director (or in the case of a director employed by the Company, compensation as an employee), as approved by the full Board. Other than such payments, a director must disclose to the Company’s General Counsel any transaction, or proposed transaction, between a STERIS entity and the director, a member of the director’s immediate family, or a business the director or an immediate family member owns, controls, or has a substantial interest in. Directors also may not have a personal or family financial interest in any STERIS supplier, customer, consultant, reseller or competitor that has a reasonable potential for causing a conflict of interest or divided loyalty, or resulting in material personal gain.
Our Code of Business Conduct for employees requires that relationships with third parties, as well as all business decisions, be based on what is required by law and in the best interests of STERIS, and not be motivated or influenced by personal considerations. This Code also requires that employees discuss with their supervisor or the STERIS Legal Department any activity that might create a conflict of interest, including personal financial interests that might reasonably affect their business judgment on behalf of the Company. Our Conflicts of Interest Policy also contains prohibitions with respect to conflicts of interest or transactions involving personal financial gain.
In addition, our Board has adopted a policy with respect to related party transactions. In general, this policy requires that all transactions or proposed transactions between the Company and a related party that exceed $120,000 and in which the related party has a direct or indirect material interest, be disclosed to and ratified or approved by the Nominating and Governance Committee or by disinterested members of our full Board. Under this policy, related parties include all of our Directors and executive officers and their immediate family members, and entities owned (more than 5% ownership) by a Director, executive officer or their immediate family members. In fiscal year 2015, there were no related party transactions between us and related parties that required ratification or approval under this policy.
INDEPENDENCE STANDARDS
The Board believes that independent directors must comprise a substantial majority of the Board. It is expected that at least two-thirds of the Board should be independent. Under our Governance Guidelines, an independent director is one who meets the definition of independence as defined by NYSE listing requirements. A director will not be considered independent if he or she has a material relationship with the Company. Generally, the Board will not consider a director to be independent under the following circumstances:
• | The director is, or has been within the last three years, an employee of the Company, or an immediate family member of the director is, or has been within the last three years, an executive officer, of the Company; |
• | The director or an immediate family member has received, during any 12-month period within the last three years, more than $120,000 in direct compensation from the Company, other than director and committee fees and pension or other forms of deferred compensation for prior service (provided such compensation is not contingent in any way on continued service); |
• | (a) The director or an immediate family member is a current partner of a firm that is our internal or external auditor; (b) the director is a current employee of such firm; (c) the director has an immediate family member who is a current employee of such a firm who participates in the firm’s audit, assurance or tax compliance (but not tax planning) practice; or (d) the director or an immediate family member was within the last three years (but is no longer) a partner or employee of such firm and personally worked on our audit within that time; |
• | The director or an immediate family member is, or has been within the last three years, employed as an executive officer of another entity where any of the present executive officers at the same time serves or served on that entity’s compensation committee; |
• | The director is a current employee, or an immediate family member is a current executive officer, of an entity that has made payments to, or received payments from, the Company for property or services in an amount which, in any of the last three fiscal years, exceeds the greater of $1 million, or two percent of such entity’s consolidated gross revenues; or |
• | The director is an executive officer of a charitable organization and, within the last three years, the Company’s charitable contributions in any year to the organization (exclusive of gift-match payments) exceed the greater of $1 million or two percent of the organization’s consolidated gross revenues. |
Based upon the foregoing criteria, the Board of Directors has determined that all of the following directors are independent within the meaning of NYSE listing requirements: Richard C. Breeden, Cynthia L. Feldmann, Jacqueline B. Kosecoff, David B. Lewis, Kevin M. McMullen, Mohsen M. Sohi, John P. Wareham, Loyal W. Wilson, and Michael B. Wood. The Board of Directors also has determined that each of STERIS’s Compensation Committee members meets the additional requirements for independence required to be a member of the Compensation Committee under NYSE listing requirements and applicable law. The Board of Directors also has determined that each of the members of the Audit Committee meets the requirements for independence and financial literacy and possesses the accounting or related financial management expertise required to be a
128
member of the Audit Committee under NYSE listing requirements and applicable law and is an audit committee financial expert as defined in SEC regulations.
ITEM 14. | PRINCIPAL ACCOUNTANT FEES AND SERVICES |
Ernst & Young LLP was appointed as the Company’s independent registered public accounting firm for the fiscal year ending March 31, 2015, by the Audit Committee of the Board of Directors.
The Audit Committee has adopted policies and procedures which are intended to control the services provided by Ernst & Young LLP and to monitor their continuing independence. Under these policies, the Audit Committee must pre-approve all services performed by Ernst & Young LLP. In addition, the Audit Committee may delegate authority to grant certain pre-approvals to a member of the Committee. Pre-approvals granted by a member of the Committee are reported to the full Audit Committee at its next regularly scheduled meeting.
The aggregate fees for professional services by Ernst & Young LLP for the fiscal years ended March 31, 2015 and March 31, 2014 were:
Years Ended March 31, | ||||||
Type of Fees | 2015 | 2014 | ||||
(in thousands) | ||||||
Audit Fees | $ | 2,920 | $ | 2,269 | ||
Audit-Related Fees | 1,065 | 58 | ||||
Tax Fees | 1,632 | 20 | ||||
Total | $ | 5,617 | $ | 2,347 | ||
All of the services provided by Ernst & Young LLP in fiscal year 2015 were pre-approved in accordance with the Audit Committee’s pre-approval policies and procedures described above. In the above table, “Audit Fees” are fees paid to Ernst & Young LLP for professional services for the audit of the Company’s consolidated financial statements included in this Annual Report on Form 10-K and review of financial statements included in Form 10-Qs, for the audit of the Company’s internal control over financial reporting and for services that are provided by the accountant in connection with statutory audits; “Audit-Related Fees” include fees billed by Ernst & Young LLP for assurance and related services that are reasonably related to the performance of the audit or review of the Company’s financial statements, benefit plan audits and advisory services as well as due diligence and attestation services provided in connection with proposed acquisitions; and “Tax Fees” include fees for tax compliance, tax advice and tax planning primarily related to proposed acquisitions.
129
PART IV
ITEM 15. EXHIBITS AND FINANCIAL STATEMENT SCHEDULE
LIST OF CONSOLIDATED FINANCIAL STATEMENTS AND FINANCIAL STATEMENT SCHEDULE
(a) (1) The following consolidated financial statements of STERIS Corporation and subsidiaries are included in Item 8:
Consolidated Balance Sheets – March 31, 2015 and 2014.
Consolidated Statements of Income – Years ended March 31, 2015, 2014, and 2013.
Consolidated Statements of Comprehensive Income –Years ended March 31, 2015, 2014, and 2013.
Consolidated Statements of Cash Flows – Years ended March 31, 2015, 2014, and 2013.
Consolidated Statements of Shareholders’ Equity – Years ended March 31, 2015, 2014, and 2013.
Notes to Consolidated Financial Statements.
(a) (2) The following consolidated financial statement schedule of STERIS Corporation and subsidiaries is included in Item 8:
Schedule II - Valuation and Qualifying Accounts
All other schedules for which provision is made in the applicable accounting regulation of the SEC are not required under the related instructions or are inapplicable and, therefore, have been omitted.
(a) (3) Exhibits
Exhibit Number | Exhibit Description |
2.1 | Rule 2.7 Announcement, dated as October 13, 2014, of STERIS Corporation and Synergy Health plc. (filed as Exhibit 2.1 to Form 8-K filed October 14, 2014 (Commission File No. 1-14643), and incorporated herein by reference). |
2.2 | Agreement and Plan of Merger, dated as of October 13, 2014, by and among STERIS Corporation, Solar New HoldCo Limited, Solar U.S. Holding Co., Solar US Parent Co., and Solar US Merger Sub Inc. (filed as Exhibit 2.2 to Form 8-K filed October 14, 2014 (Commission File No. 1-14643), and incorporated herein by reference). |
3.1 | 1992 Amended Articles of Incorporation of STERIS Corporation, as amended on May 14, 1996, November 6, 1996, and August 6, 1998 (filed as Exhibit 3.1 to Form 10-K for the fiscal year ended March 31, 2000 (Commission File No. 1-14643), and incorporated herein by reference). |
3.2 | Amended and Restated Regulations of STERIS Corporation, as amended on July 26, 2007 (filed as Exhibit 3.2 to Form 10-Q for the fiscal quarter ended June 30, 2007 (Commission File No. 1-14643), and incorporated herein by reference). |
4.1 | Specimen Form of Common Stock Certificate (filed as Exhibit 4.1 to Form 10-K for the fiscal year ended March 31, 2002 (Commission File No. 1-14643), and incorporated herein by reference). |
10.1 | STERIS Corporation Form of Nonqualified Stock Option Grant Agreement for Directors (filed as Exhibit 10.4 to Form 10-Q for the fiscal quarter ended December 31, 2004 (Commission File No. 1-14643), and incorporated herein by reference).* |
10.2 | STERIS Corporation Form of Nonqualified Stock Option Agreement for Employees (filed as Exhibit 10.2 to Form 10-Q for the fiscal quarter ended December 31, 2004 (Commission File No. 1-14643), and incorporated herein by reference).* |
10.3 | STERIS Corporation 2002 Stock Option Plan (filed as Exhibit 10.7 to Form 10-K for the fiscal year ended March 31, 2003 (Commission File No. 1-14643), and incorporated herein by reference).* |
130
10.4 | STERIS Corporation 2006 Long-Term Equity Incentive Plan (filed as Exhibit 10.1 to Form 8-K filed July 28, 2006 (Commission File No. 1-14643), and incorporated herein by reference).* |
10.5 | Amendment No. 1 to STERIS Corporation 2006 Long-Term Equity Incentive Plan (filed as Exhibit 10.11 to Form 10-K for the fiscal year ended March 31, 2007 (Commission File No. 1-14643), and incorporated herein by reference).* |
10.6 | STERIS Corporation Form of Nonqualified Stock Option Agreement for Employees (filed as Exhibit 10.7 to Form 10-Q for the fiscal quarter ended September 30, 2006 (Commission File No. 1-14643), and incorporated herein by reference).* |
10.7 | STERIS Corporation Form of Nonqualified Stock Option Agreement for Nonemployee Directors (filed as Exhibit 10.8 to Form 10-Q for the fiscal quarter ended September 30, 2006 (Commission File No. 1-14643), and incorporated herein by reference).* |
10.8 | STERIS Corporation Form of Nonqualified Stock Option Agreement for Employees (filed as Exhibit 10.3 to Form 10-Q for the fiscal quarter ended June 30, 2008 (Commission File No. 1-14643), and incorporated herein by reference).* |
10.9 | STERIS Corporation Form of Nonqualified Stock Option Agreement for Nonemployee Directors (filed as Exhibit 10.4 to Form 10-Q for the fiscal quarter ended June 30, 2008 (Commission File No. 1-14643), and incorporated herein by reference).* |
10.10 | STERIS Corporation Form of Restricted Stock Agreement for Employees (filed as Exhibit 10.1 to Form 10-Q for the fiscal quarter ended June 30, 2009 (Commission File No. 1-14643), and incorporated herein by reference).* |
10.11 | STERIS Corporation Form of Non-Qualified Stock Option Agreement for Employees (filed as Exhibit 10.2 to Form 10-Q for the fiscal quarter ended June 30, 2009 (Commission File No. 1-14643), and incorporated herein by reference).* |
10.12 | STERIS Corporation 2006 Long-Term Equity Incentive Plan (as Amended and Restated Effective July 28, 2011) (filed as Exhibit A to Schedule 14A (Definitive Proxy Statement) filed June 7, 2011 (Commission File No. 1-14643), and incorporated herein by reference).* |
10.13 | STERIS Corporation Form of Non-Qualified Stock Option Agreement for Employees. (filed as Exhibit 10.22 to Form 10-K for the fiscal year ended March 31, 2011(Commission File No. 1-14643), and incorporated herein by reference).* |
10.14 | STERIS Corporation Form of Restricted Stock Agreement for Employees (filed as Exhibit 10.23 to Form 10-K for the fiscal year ended March 31, 2011(Commission File No. 1-14643), and incorporated herein by reference).* |
10.15 | STERIS Corporation Form of Restricted Stock Agreement for Employees (filed as Exhibit 10.1 to Form 10-Q for the fiscal quarter ended June 30, 2011 (Commission File No. 1-14643), and incorporated herein by reference.* |
10.16 | STERIS Corporation Form of Nonqualified Stock Option Agreement for Employees (filed as Exhibit 10.2 to Form 10-Q for the fiscal quarter ended June 30, 2011 (Commission File No. 1-14643), and incorporated herein by reference).* |
10.17 | STERIS Corporation Form of Restricted Stock Agreement for Employees (filed as Exhibit 10.27 to Form 10-K for the fiscal year ended March 31, 2012 (Commission File No. 1-14643, and incorporated herein by reference).* |
10.18 | STERIS Corporation Form of Restricted Stock Agreement for Employees.(filed as Exhibit 10.28 to Form 10-K for the fiscal year ended March 31, 2012 (Commission File No. 1-14643, and incorporated herein by reference).* |
10.19 | Amendment to Nonqualified Stock Option Agreement (filed as Exhibit 10.11 to Form 10-Q for the fiscal quarter ended December 31, 2012 (Commission File No. 1-14643), and incorporated herein by reference).* |
10.20 | Form of Nonqualified Stock Option Agreement for Nonemployee Directors (filed as Exhibit 10.12 to Form10-Q for the fiscal quarter ended December 31, 2012 (Commission File No. 1-14643), and incorporated herein by reference).* |
131
10.21 | Form of Nonqualified Stock Option Agreement for Employees (filed as Exhibit 10.13 to Form10-Q for the fiscal quarter ended December 31, 2012 (Commission File No. 1-14643), and incorporated herein by reference).* |
10.22 | Form of Nonqualified Stock Option Agreement for Employees (filed as Exhibit 10.14 to Form 10-Q for the fiscal quarter ended December 31, 2012 (Commission File No. 1-14643), and incorporated herein by reference).* |
10.23 | Form of Career Restricted Stock Unit Agreement for Nonemployee Directors (filed as Exhibit 10.33 to Form 10-K for the fiscal year ended March 31, 2013 (Commission File No. 1-14643), and incorporated by reference).* |
10.24 | Form of Nonqualified Stock Option Agreement for Nonemployee Directors (filed as Exhibit 10.34 to Form 10-K for the fiscal year ended March 31, 2013 (Commission File No. 1-14643), and incorporated by reference).* |
10.25 | STERIS Corporation 2006 Long-Term Equity Incentive Plan (as Amended and Restated Effective March 13, 2014) (filed as Exhibit Appendix A to Schedule 14A (Definitive Proxy Statement) filed June 9, 2014 (Commission File No. 1463), and incorporated herein by reference).* |
10.26 | Description of Non-Employee Director Compensation Arrangements (filed as Exhibit 10.1 to Form 10-Q for the fiscal quarter ended September 30, 2013 (Commission File No. 1-14643), and incorporated herein by reference).* |
10.27 | Description of Non-Employee Director Compensation Changes (filed as Exhibit 10.7 to Form 10-Q for the fiscal quarter ended June 30, 2014 (Commission File No. 1-14643) and incorporated herein by reference).* |
10.28 | STERIS Corporation Deferred Compensation Plan Document (filed as Exhibit 10.1 to Form 8-K filed September 1, 2006 (Commission File No. 1-14643), and incorporated herein by reference).* |
10.29 | STERIS Corporation Deferred Compensation Plan Document (as Amended and Restated Effective January 1, 2009) (filed as Exhibit 10.1 to Form 10-Q for the fiscal quarter ended December 31, 2008 (Commission File No. 1-14643), and incorporated herein by reference).* |
10.30 | Amended and Restated Adoption Agreement related to STERIS Corporation Deferred Compensation Plan (filed as Exhibit 10.2 to Form 10-Q filed for the fiscal quarter ended December 31, 2008 (Commission File No. 1-14643), and incorporated herein by reference).* |
10.31 | Amendment No. 1 to STERIS Corporation Deferred Compensation Plan Document (as Amended and Restated Effective January 1, 2009) dated November 4, 2011 (filed as Exhibit 10.1 to Form 10-Q for the fiscal quarter ended December 31, 2011 (Commission File No. 1-14643), and incorporated herein by reference).* |
10.32 | STERIS Corporation Management Incentive Compensation Plan, as Amended (filed as Exhibit 10.6 to Form 10-Q for the fiscal quarter ended June 30, 2014 (Commission File No. 1-14643), and incorporated herein by reference).* |
10.33 | STERIS Corporation Senior Executive Management Incentive Compensation Plan, as Amended and Restated Effective April 1, 2010 (filed as Appendix A to Schedule 14A (Definitive Proxy Statement) filed June 8, 2010 (Commission File No. 1-14643), and incorporated herein by reference).* |
10.34 | STERIS Corporation Senior Executive Severance Plan effective June 1, 2012 (filed as Exhibit 10.3 to Form 10-Q for the fiscal quarter ended June 30, 2012 (Commission No. 1-14643), and incorporated herein by reference.* |
10.35 | Form of Indemnification Agreement between STERIS Corporation and each of its directors and certain executive officers (filed as Exhibit 10.31 to Form 10-K for the fiscal year ended March 31, 2010 (Commission File No. 1-14643), and incorporated herein by reference). |
10.36 | Agreement dated as of April 23, 2008 by and among STERIS Corporation, Richard C. Breeden, Robert H. Fields, and the Breeden Investors identified therein (filed as Exhibit 10.1 to Form 8-K filed April 24, 2008 (Commission File No. 1-14643), and incorporated herein by reference). |
132
10.37 | Agreement dated November 4, 2011 between STERIS Corporation and Bank of America, N.A. providing Transfer and Advised Line for Letters of Credit (filed as Exhibit 10.2 to Form 10-Q for the fiscal quarter ended December 31, 2011 (Commission File No. 1-14643), and incorporated herein by reference). |
10.38 | 364-Day Bridge Credit Agreement, dated as of October 13, 2014, among Solar US Parent Co., as borrower, STERIS Corporation, as guarantor, Bank of America, N.A. as Administrative Agent and lender, and the other lenders party thereto (filed as Exhibit 10.1 to Form 8-K filed October 14, 2014 (Commission File No. 1-14643), and incorporated herein by reference). |
10.39 | Credit Agreement, dated as of March 31, 2015, by and among STERIS Corporation and New STERIS Limited, as borrowers, various U.S. subsidiaries of STERIS Corporation, as guarantors, various financial institutions, as lenders, JPMorgan Chase Bank, N.A., as Administrative Agent, Bank of America, N.A., KeyBank National Association and PNC Bank, National Association, as Syndication Agents, Santander Bank, N.A., The Bank of Tokyo Mitsubishi UFJ, Ltd., Sumitomo Mitsui Banking Corporation and DNB Capital LLC, as Documentation Agents, and J.P. Morgan Securities LLC, Merrill Lynch, Pierce, Fenner & Smith Incorporated and KeyBank National Association, as Joint Lead Arrangers and Joint Bookrunners (filed as Exhibit 10.1 to Form 8-K filed April 2, 2015 (Commission File No. 1-14643), and incorporated herein by reference). |
10.40 | Amended and Restated Bridge Credit Agreement, dated as of March 31, 2015, by and among STERIS Corporation and New STERIS Limited, as borrowers and guarantors, various U.S. subsidiaries of STERIS Corporation, as guarantors, Solar U.S. Parent Co., as retiring borrower, Bank of America, N.A., as Administrative Agent and lender, JPMorgan Chase Bank, N.A., as Syndication Agent and lender, KeyBank National Association, as Documentation Agent and lender, and Merrill Lynch, Pierce, Fenner & Smith Incorporated, J.P. Morgan Securities LLC and KeyBanc Capital Markets Inc., as Joint Lead Arrangers and Joint Bookrunners (filed as Exhibit 10.2 to Form 8-K filed April 2, 2015 (Commission File No. 1-14643), and incorporated herein by reference). |
10.41 | Second Amendment, dated as of March 31, 2015, to Note Purchase Agreements dated as of December 17, 2003, among STERIS Corporation and each of the institutions party thereto (filed as Exhibit 10.3 to Form 8-K filed April 2, 2015 (Commission File No. 1-14643), and incorporated herein by reference). |
10.42 | Affiliate Guaranty, dated as of March 31, 2015, by STERIS Corporation and each of American Sterilizer Company, Integrated Medical Systems International, Inc., STERIS Europe, Inc., STERIS Inc., United States Endoscopy Group, Inc., Isomedix Inc., and Isomedix Operations Inc., of the December 17, 2003 Note Purchase Agreements, as amended and restated, and Notes issued pursuant thereto (filed as Exhibit 10.4 to Form 8-K filed April 2, 2015 (Commission File No. 1-14643), and incorporated herein by reference). |
10.43 | First Amendment, dated as of March 31, 2015, to Note Purchase Agreement dated as of August 15, 2008, among STERIS Corporation and each of the institutions party thereto (filed as Exhibit 10.5 to Form 8-K filed April 2, 2015 (Commission File No. 1-14643), and incorporated herein by reference). |
10.44 | Affiliate Guaranty, dated as of March 31, 2015, by STERIS Corporation and each of American Sterilizer Company, Integrated Medical Systems International, Inc., STERIS Europe, Inc., STERIS Inc., United States Endoscopy Group, Inc., Isomedix Inc. and Isomedix Operations Inc., of the August 15, 2008 Note Purchase Agreements, as amended and restated, and Notes issued pursuant thereto (filed as Exhibit 10.6 to Form 8-K filed April 2, 2015 (Commission File No. 1-14643), and incorporated herein by reference). |
10.45 | First Amendment, dated as of March 31, 2015, to Note Purchase Agreements dated as of December 4, 2012, among STERIS Corporation and each of the institutions party thereto (filed as Exhibit 10.7 to Form 8-K filed April 2, 2015 (Commission File No. 1-14643), and incorporated herein by reference). |
10.46 | Affiliate Guaranty, dated as of March 31, 2015, by STERIS Corporation and each of American Sterilizer Company, Integrated Medical Systems International, Inc., STERIS Europe, Inc., STERIS Inc., United States Endoscopy Group, Inc., Isomedix Inc. and Isomedix Operations Inc., of the December 4, 2012 Note Purchase Agreements, as amended and restated, and Notes issued pursuant thereto (filed as Exhibit 10.8 to Form 8-K filed April 2, 2015 (Commission File No. 1-14643), and incorporated herein by reference). |
133
10.47 | Stock Purchase Agreement dated July 16, 2012 by and among STERIS Corporation, United States Endoscopy Group, Inc. and the shareholders party thereto (filed as Exhibit 2.1 to Form 8-K filed August 15, 2012 (Commission No. 1-14643), and incorporated herein by reference). |
10.48 | Stock Purchase Agreement dated October 16, 2012 between STERIS Corporation, Richard J. and Michelle A. Schultz, individually and as trustees of certain trusts, such trusts and Spectrum Surgical Instruments Corp. (filed as Exhibit 10.5 to Form 10-Q for the fiscal quarter ended December 31, 2012 (Commission File No. 1-14643), and incorporated herein by reference). |
10.49 | Stock Purchase Agreement dated March 31, 2014 by and among STERIS Corporation, Integrated Medical Systems International, Inc. and the shareholders party thereto (filed as Exhibit 2.1 to Form 8-K filed May 9, 2014 (Commission No. 1-14643), and incorporated herein by reference). |
21.1 | Subsidiaries of STERIS Corporation. |
23.1 | Consent of Independent Registered Public Accounting Firm. |
24.1 | Power of Attorney. |
31.1 | Certification of the Principal Executive Officer Pursuant to Exchange Act Rule 13a-14(a)/15d-14(a). |
31.2 | Certification of the Principal Financial Officer Pursuant to Exchange Act Rule 13a-14(a)/15d-14(a). |
32.1 | Certification of the Principal Executive Officer and the Principal Financial Officer Pursuant to Section 906 of the Sarbanes-Oxley Act of 2002. |
EX-101 | Instance Document. |
EX-101 | Schema Document. |
EX-101 | Calculation Linkbase Document. |
EX-101 | Definition Linkbase Document. |
EX-101 | Labels Linkbase Document. |
EX-101 | Presentation Linkbase Document. |
* | A management contract or compensatory plan or arrangement required to be filed as an exhibit hereto. |
134
SIGNATURES
Pursuant to the requirements of Sections 13 or 15(d) of the Securities Exchange Act of 1934, the Registrant has duly caused this report to be signed on its behalf by the undersigned, thereunto duly authorized, on the date indicated.
STERIS CORPORATION (Registrant) | |||
Date: | May 27, 2015 | By: | /S/ MICHAEL J. TOKICH |
Michael J. Tokich | |||
Senior Vice President, Chief Financial Officer and Treasurer | |||
Pursuant to the requirements of the Securities Exchange Act of 1934, this report has been signed below by the following persons on behalf of the Registrant and in the capacities and on the date indicated.
SIGNATURE | TITLE | DATE | ||
/S/ WALTER M ROSEBROUGH, JR. | President, Chief Executive Officer and Director | May 27, 2015 | ||
Walter M Rosebrough, Jr. | ||||
/S/ MICHAEL J. TOKICH | Senior Vice President, Chief Financial Officer and Treasurer | May 27, 2015 | ||
Michael J. Tokich | ||||
* | Chairman and Director | May 27, 2015 | ||
John P. Wareham | ||||
* | Director | May 27, 2015 | ||
Richard C. Breeden | ||||
* | Director | May 27, 2015 | ||
Cynthia L. Feldmann | ||||
* | Director | May 27, 2015 | ||
David B. Lewis | ||||
* | Director | May 27, 2015 | ||
Jacqueline B. Kosecoff | ||||
* | Director | May 27, 2015 | ||
Kevin M. McMullen | ||||
* | Director | May 27, 2015 | ||
Mohsen M. Sohi | ||||
* | Director | May 27, 2015 | ||
Loyal W. Wilson | ||||
* | Director | May 27, 2015 | ||
Michael B. Wood | ||||
* | The undersigned, by signing his name hereto, does sign and execute this Annual Report on Form 10-K pursuant to the Powers of Attorney executed by the above-named directors of the Registrant and filed with the Securities and Exchange Commission on behalf of such directors. |
Date: | May 27, 2015 | By: | /S/ J. ADAM ZANGERLE |
J. Adam Zangerle, Attorney-in-Fact for Directors | |||
135
EXHIBIT INDEX
Exhibit Number | Exhibit Description |
2.1 | Rule 2.7 Announcement, dated as October 13, 2014, of STERIS Corporation and Synergy Health plc. (filed as Exhibit 2.1 to Form 8-K filed October 14, 2014 (Commission File No. 1-14643), and incorporated herein by reference). |
2.2 | Agreement and Plan of Merger, dated as of October 13, 2014, by and among STERIS Corporation, Solar New HoldCo Limited, Solar U.S. Holding Co., Solar US Parent Co., and Solar US Merger Sub Inc. (filed as Exhibit 2.2 to Form 8-K filed October 14, 2014 (Commission File No. 1-14643), and incorporated herein by reference). |
3.1 | 1992 Amended Articles of Incorporation of STERIS Corporation, as amended on May 14, 1996, November 6, 1996, and August 6, 1998 (filed as Exhibit 3.1 to Form 10-K for the fiscal year ended March 31, 2000 (Commission File No. 1-14643), and incorporated herein by reference). |
3.2 | Amended and Restated Regulations of STERIS Corporation, as amended on July 26, 2007 (filed as Exhibit 3.2 to Form 10-Q for the fiscal quarter ended June 30, 2007 (Commission File No. 1-14643), and incorporated herein by reference). |
4.1 | Specimen Form of Common Stock Certificate (filed as Exhibit 4.1 to Form 10-K for the fiscal year ended March 31, 2002 (Commission File No. 1-14643), and incorporated herein by reference). |
10.1 | STERIS Corporation Form of Nonqualified Stock Option Grant Agreement for Directors (filed as Exhibit 10.4 to Form 10-Q for the fiscal quarter ended December 31, 2004 (Commission File No. 1-14643), and incorporated herein by reference).* |
10.2 | STERIS Corporation Form of Nonqualified Stock Option Agreement for Employees (filed as Exhibit 10.2 to Form 10-Q for the fiscal quarter ended December 31, 2004 (Commission File No. 1-14643), and incorporated herein by reference).* |
10.3 | STERIS Corporation 2002 Stock Option Plan (filed as Exhibit 10.7 to Form 10-K for the fiscal year ended March 31, 2003 (Commission File No. 1-14643), and incorporated herein by reference).* |
10.4 | STERIS Corporation 2006 Long-Term Equity Incentive Plan (filed as Exhibit 10.1 to Form 8-K filed July 28, 2006 (Commission File No. 1-14643), and incorporated herein by reference).* |
10.5 | Amendment No. 1 to STERIS Corporation 2006 Long-Term Equity Incentive Plan (filed as Exhibit 10.11 to Form 10-K for the fiscal year ended March 31, 2007 (Commission File No. 1-14643), and incorporated herein by reference).* |
10.6 | STERIS Corporation Form of Nonqualified Stock Option Agreement for Employees (filed as Exhibit 10.7 to Form 10-Q for the fiscal quarter ended September 30, 2006 (Commission File No. 1-14643), and incorporated herein by reference).* |
10.7 | STERIS Corporation Form of Nonqualified Stock Option Agreement for Nonemployee Directors (filed as Exhibit 10.8 to Form 10-Q for the fiscal quarter ended September 30, 2006 (Commission File No. 1-14643), and incorporated herein by reference).* |
10.8 | STERIS Corporation Form of Nonqualified Stock Option Agreement for Employees (filed as Exhibit 10.3 to Form 10-Q for the fiscal quarter ended June 30, 2008 (Commission File No. 1-14643), and incorporated herein by reference).* |
10.9 | STERIS Corporation Form of Nonqualified Stock Option Agreement for Nonemployee Directors (filed as Exhibit 10.4 to Form 10-Q for the fiscal quarter ended June 30, 2008 (Commission File No. 1-14643), and incorporated herein by reference).* |
10.10 | STERIS Corporation Form of Restricted Stock Agreement for Employees (filed as Exhibit 10.1 to Form 10-Q for the fiscal quarter ended June 30, 2009 (Commission File No. 1-14643), and incorporated herein by reference).* |
136
10.11 | STERIS Corporation Form of Non-Qualified Stock Option Agreement for Employees (filed as Exhibit 10.2 to Form 10-Q for the fiscal quarter ended June 30, 2009 (Commission File No. 1-14643), and incorporated herein by reference).* |
10.12 | STERIS Corporation 2006 Long-Term Equity Incentive Plan (as Amended and Restated Effective July 28, 2011) (filed as Exhibit A to Schedule 14A (Definitive Proxy Statement) filed June 7, 2011 (Commission File No. 1-14643), and incorporated herein by reference).* |
10.13 | STERIS Corporation Form of Non-Qualified Stock Option Agreement for Employees. (filed as Exhibit 10.22 to Form 10-K for the fiscal year ended March 31, 2011(Commission File No. 1-14643), and incorporated herein by reference).* |
10.14 | STERIS Corporation Form of Restricted Stock Agreement for Employees (filed as Exhibit 10.23 to Form 10-K for the fiscal year ended March 31, 2011(Commission File No. 1-14643), and incorporated herein by reference).* |
10.15 | STERIS Corporation Form of Restricted Stock Agreement for Employees (filed as Exhibit 10.1 to Form 10-Q for the fiscal quarter ended June 30, 2011 (Commission File No. 1-14643), and incorporated herein by reference.* |
10.16 | STERIS Corporation Form of Nonqualified Stock Option Agreement for Employees (filed as Exhibit 10.2 to Form 10-Q for the fiscal quarter ended June 30, 2011 (Commission File No. 1-14643), and incorporated herein by reference).* |
10.17 | STERIS Corporation Form of Restricted Stock Agreement for Employees (filed as Exhibit 10.27 to Form 10-K for the fiscal year ended March 31, 2012 (Commission File No. 1-14643, and incorporated herein by reference).* |
10.18 | STERIS Corporation Form of Restricted Stock Agreement for Employees.(filed as Exhibit 10.28 to Form 10-K for the fiscal year ended March 31, 2012 (Commission File No. 1-14643, and incorporated herein by reference).* |
10.19 | Amendment to Nonqualified Stock Option Agreement (filed as Exhibit 10.11 to Form 10-Q for the fiscal quarter ended December 31, 2012 (Commission File No. 1-14643), and incorporated herein by reference).* |
10.20 | Form of Nonqualified Stock Option Agreement for Nonemployee Directors (filed as Exhibit 10.12 to Form10-Q for the fiscal quarter ended December 31, 2012 (Commission File No. 1-14643), and incorporated herein by reference).* |
10.21 | Form of Nonqualified Stock Option Agreement for Employees (filed as Exhibit 10.13 to Form10-Q for the fiscal quarter ended December 31, 2012 (Commission File No. 1-14643), and incorporated herein by reference).* |
10.22 | Form of Nonqualified Stock Option Agreement for Employees (filed as Exhibit 10.14 to Form 10-Q for the fiscal quarter ended December 31, 2012 (Commission File No. 1-14643), and incorporated herein by reference).* |
10.23 | Form of Career Restricted Stock Unit Agreement for Nonemployee Directors (filed as Exhibit 10.33 to Form 10-K for the fiscal year ended March 31, 2013 (Commission File No. 1-14643), and incorporated by reference).* |
10.24 | Form of Nonqualified Stock Option Agreement for Nonemployee Directors (filed as Exhibit 10.34 to Form 10-K for the fiscal year ended March 31, 2013 (Commission File No. 1-14643), and incorporated by reference).* |
10.25 | STERIS Corporation 2006 Long-Term Equity Incentive Plan (as Amended and Restated Effective March 13, 2014) (filed as Exhibit Appendix A to Schedule 14A (Definitive Proxy Statement) filed June 9, 2014 (Commission File No. 1463), and incorporated herein by reference).* |
10.26 | Description of Non-Employee Director Compensation Arrangements (filed as Exhibit 10.1 to Form 10-Q for the fiscal quarter ended September 30, 2013 (Commission File No. 1-14643), and incorporated herein by reference).* |
10.27 | Description of Non-Employee Director Compensation Changes (filed as Exhibit 10.7 to Form 10-Q for the fiscal quarter ended June 30, 2014 (Commission File No. 1-14643) and incorporated herein by reference).* |
137
10.28 | STERIS Corporation Deferred Compensation Plan Document (filed as Exhibit 10.1 to Form 8-K filed September 1, 2006 (Commission File No. 1-14643), and incorporated herein by reference).* |
10.29 | STERIS Corporation Deferred Compensation Plan Document (as Amended and Restated Effective January 1, 2009) (filed as Exhibit 10.1 to Form 10-Q for the fiscal quarter ended December 31, 2008 (Commission File No. 1-14643), and incorporated herein by reference).* |
10.30 | Amended and Restated Adoption Agreement related to STERIS Corporation Deferred Compensation Plan (filed as Exhibit 10.2 to Form 10-Q filed for the fiscal quarter ended December 31, 2008 (Commission File No. 1-14643), and incorporated herein by reference).* |
10.31 | Amendment No. 1 to STERIS Corporation Deferred Compensation Plan Document (as Amended and Restated Effective January 1, 2009) dated November 4, 2011 (filed as Exhibit 10.1 to Form 10-Q for the fiscal quarter ended December 31, 2011 (Commission File No. 1-14643), and incorporated herein by reference).* |
10.32 | STERIS Corporation Management Incentive Compensation Plan, as Amended (filed as Exhibit 10.6 to Form 10-Q for the fiscal quarter ended June 30, 2014 (Commission File No. 1-14643), and incorporated herein by reference).* |
10.33 | STERIS Corporation Senior Executive Management Incentive Compensation Plan, as Amended and Restated Effective April 1, 2010 (filed as Appendix A to Schedule 14A (Definitive Proxy Statement) filed June 8, 2010 (Commission File No. 1-14643), and incorporated herein by reference).* |
10.34 | STERIS Corporation Senior Executive Severance Plan effective June 1, 2012 (filed as Exhibit 10.3 to Form 10-Q for the fiscal quarter ended June 30, 2012 (Commission No. 1-14643), and incorporated herein by reference.* |
10.35 | Form of Indemnification Agreement between STERIS Corporation and each of its directors and certain executive officers (filed as Exhibit 10.31 to Form 10-K for the fiscal year ended March 31, 2010 (Commission File No. 1-14643), and incorporated herein by reference). |
10.36 | Agreement dated as of April 23, 2008 by and among STERIS Corporation, Richard C. Breeden, Robert H. Fields, and the Breeden Investors identified therein (filed as Exhibit 10.1 to Form 8-K filed April 24, 2008 (Commission File No. 1-14643), and incorporated herein by reference). |
10.37 | Agreement dated November 4, 2011 between STERIS Corporation and Bank of America, N.A. providing Transfer and Advised Line for Letters of Credit (filed as Exhibit 10.2 to Form 10-Q for the fiscal quarter ended December 31, 2011 (Commission File No. 1-14643), and incorporated herein by reference). |
10.38 | 364-Day Bridge Credit Agreement, dated as of October 13, 2014, among Solar US Parent Co., as borrower, STERIS Corporation, as guarantor, Bank of America, N.A. as Administrative Agent and lender, and the other lenders party thereto (filed as Exhibit 10.1 to Form 8-K filed October 14, 2014 (Commission File No. 1-14643), and incorporated herein by reference). |
10.39 | Credit Agreement, dated as of March 31, 2015, by and among STERIS Corporation and New STERIS Limited, as borrowers, various U.S. subsidiaries of STERIS Corporation, as guarantors, various financial institutions, as lenders, JPMorgan Chase Bank, N.A., as Administrative Agent, Bank of America, N.A., KeyBank National Association and PNC Bank, National Association, as Syndication Agents, Santander Bank, N.A., The Bank of Tokyo Mitsubishi UFJ, Ltd., Sumitomo Mitsui Banking Corporation and DNB Capital LLC, as Documentation Agents, and J.P. Morgan Securities LLC, Merrill Lynch, Pierce, Fenner & Smith Incorporated and KeyBank National Association, as Joint Lead Arrangers and Joint Bookrunners (filed as Exhibit 10.1 to Form 8-K filed April 2, 2015 (Commission File No. 1-14643), and incorporated herein by reference). |
10.40 | Amended and Restated Bridge Credit Agreement, dated as of March 31, 2015, by and among STERIS Corporation and New STERIS Limited, as borrowers and guarantors, various U.S. subsidiaries of STERIS Corporation, as guarantors, Solar U.S. Parent Co., as retiring borrower, Bank of America, N.A., as Administrative Agent and lender, JPMorgan Chase Bank, N.A., as Syndication Agent and lender, KeyBank National Association, as Documentation Agent and lender, and Merrill Lynch, Pierce, Fenner & Smith Incorporated, J.P. Morgan Securities LLC and KeyBanc Capital Markets Inc., as Joint Lead Arrangers and Joint Bookrunners (filed as Exhibit 10.2 to Form 8-K filed April 2, 2015 (Commission File No. 1-14643), and incorporated herein by reference). |
138
10.41 | Second Amendment, dated as of March 31, 2015, to Note Purchase Agreements dated as of December 17, 2003, among STERIS Corporation and each of the institutions party thereto (filed as Exhibit 10.3 to Form 8-K filed April 2, 2015 (Commission File No. 1-14643), and incorporated herein by reference). |
10.42 | Affiliate Guaranty, dated as of March 31, 2015, by STERIS Corporation and each of American Sterilizer Company, Integrated Medical Systems International, Inc., STERIS Europe, Inc., STERIS Inc., United States Endoscopy Group, Inc., Isomedix Inc., and Isomedix Operations Inc., of the December 17, 2003 Note Purchase Agreements, as amended and restated, and Notes issued pursuant thereto (filed as Exhibit 10.4 to Form 8-K filed April 2, 2015 (Commission File No. 1-14643), and incorporated herein by reference). |
10.43 | First Amendment, dated as of March 31, 2015, to Note Purchase Agreement dated as of August 15, 2008, among STERIS Corporation and each of the institutions party thereto (filed as Exhibit 10.5 to Form 8-K filed April 2, 2015 (Commission File No. 1-14643), and incorporated herein by reference). |
10.44 | Affiliate Guaranty, dated as of March 31, 2015, by STERIS Corporation and each of American Sterilizer Company, Integrated Medical Systems International, Inc., STERIS Europe, Inc., STERIS Inc., United States Endoscopy Group, Inc., Isomedix Inc. and Isomedix Operations Inc., of the August 15, 2008 Note Purchase Agreements, as amended and restated, and Notes issued pursuant thereto (filed as Exhibit 10.6 to Form 8-K filed April 2, 2015 (Commission File No. 1-14643), and incorporated herein by reference). |
10.45 | First Amendment, dated as of March 31, 2015, to Note Purchase Agreements dated as of December 4, 2012, among STERIS Corporation and each of the institutions party thereto (filed as Exhibit 10.7 to Form 8-K filed April 2, 2015 (Commission File No. 1-14643), and incorporated herein by reference). |
10.46 | Affiliate Guaranty, dated as of March 31, 2015, by STERIS Corporation and each of American Sterilizer Company, Integrated Medical Systems International, Inc., STERIS Europe, Inc., STERIS Inc., United States Endoscopy Group, Inc., Isomedix Inc. and Isomedix Operations Inc., of the December 4, 2012 Note Purchase Agreements, as amended and restated, and Notes issued pursuant thereto (filed as Exhibit 10.8 to Form 8-K filed April 2, 2015 (Commission File No. 1-14643), and incorporated herein by reference). |
10.47 | Stock Purchase Agreement dated July 16, 2012 by and among STERIS Corporation, United States Endoscopy Group, Inc. and the shareholders party thereto (filed as Exhibit 2.1 to Form 8-K filed August 15, 2012 (Commission No. 1-14643), and incorporated herein by reference). |
10.48 | Stock Purchase Agreement dated October 16, 2012 between STERIS Corporation, Richard J. and Michelle A. Schultz, individually and as trustees of certain trusts, such trusts and Spectrum Surgical Instruments Corp. (filed as Exhibit 10.5 to Form 10-Q for the fiscal quarter ended December 31, 2012 (Commission File No. 1-14643), and incorporated herein by reference). |
10.49 | Stock Purchase Agreement dated March 31, 2014 by and among STERIS Corporation, Integrated Medical Systems International, Inc. and the shareholders party thereto (filed as Exhibit 2.1 to Form 8-K filed May 9, 2014 (Commission No. 1-14643), and incorporated herein by reference). |
21.1 | Subsidiaries of STERIS Corporation. |
23.1 | Consent of Independent Registered Public Accounting Firm. |
24.1 | Power of Attorney. |
31.1 | Certification of the Principal Executive Officer Pursuant to Exchange Act Rule 13a-14(a)/15d-14(a). |
31.2 | Certification of the Principal Financial Officer Pursuant to Exchange Act Rule 13a-14(a)/15d-14(a). |
32.1 | Certification of the Principal Executive Officer and the Principal Financial Officer Pursuant to Section 906 of the Sarbanes-Oxley Act of 2002. |
EX-101 | Instance Document. |
EX-101 | Schema Document. |
139
EX-101 | Calculation Linkbase Document. |
EX-101 | Definition Linkbase Document. |
EX-101 | Labels Linkbase Document. |
EX-101 | Presentation Linkbase Document. |
* | A management contract or compensatory plan or arrangement required to be filed as an exhibit hereto. |
140