Attached files
| file | filename |
|---|---|
| 8-K - FORM 8-K - OVERSEAS SHIPHOLDING GROUP INC | v411691_8-k.htm |
Exhibit 99.1

Lender’s Conference Call May 27, 2015

Page 2 Confidential Disclaimer This conference call is being held pursuant to the Company’s loan agreements with its lenders and the information that is being disclosed is subject to the confidentiality provisions of such loan agreements. This conference call may contain forward - looking statements regarding OSG’s prospects, including the outlook for tanker and articulated tug/barge markets, changing oil trading patterns, and prospects for certain strategic alliances and investments. These statements are based on certain assumptions made by OSG management based on its experience and perception of historical trends, current conditions, expected future developments and other factors it believes are appropriate in the circumstances. Forward - looking statements are subject to a number of risks, uncertainties and assumptions, many of which are beyond the control of OSG, which may cause actual results to differ materially from those implied or expressed by the forward - looking statements. Factors, risks, and uncertainties that could cause the actual results to differ from the expectations reflected in these forward - looking statements are described in OSG’s Annual Report on Form 10 - K for 2014 and in other reports OSG files with the Securities and Exchange Commission .
Page 3 Confidential I. OSG Overview 4 II. Post Emergence Developments 5 III. Market Update 6 IV. Financial Update 7 V. Proposed Amendments 10 VI. Question & Answer Session 13 VII. Appendix 14 Page Agenda

Page 4 Confidential Overseas Shipholding Group Company Overview □ Currently operates a total of 80 vessels in both the U.S. Flag and International Flag business □ U.S. Flag business, with a fleet of 24 vessels , remains the Jones Act market leader with 22 Jones Act vessels − Vessel types include Handysize product carriers, lightering and non - lightering ATBs − Vessels are predominately fixed on medium - term time charters − Jones Act fleet includes 10 chartered - in vessels □ International Flag business operates a fleet of 56 vessels, 7 of which are chartered - in − Vessel types include ULCC, VLCC, Aframax and Panamax crude carriers, LR2, LR1 and MR product carriers, as well as FSOs and LNG Carriers ▪ Holds 50.0% interest in 2 FSOs through a JV ▪ Holds 49.9% interest in 4 LNG carriers through a JV − Vessels operate mainly in spot market through commercial pools
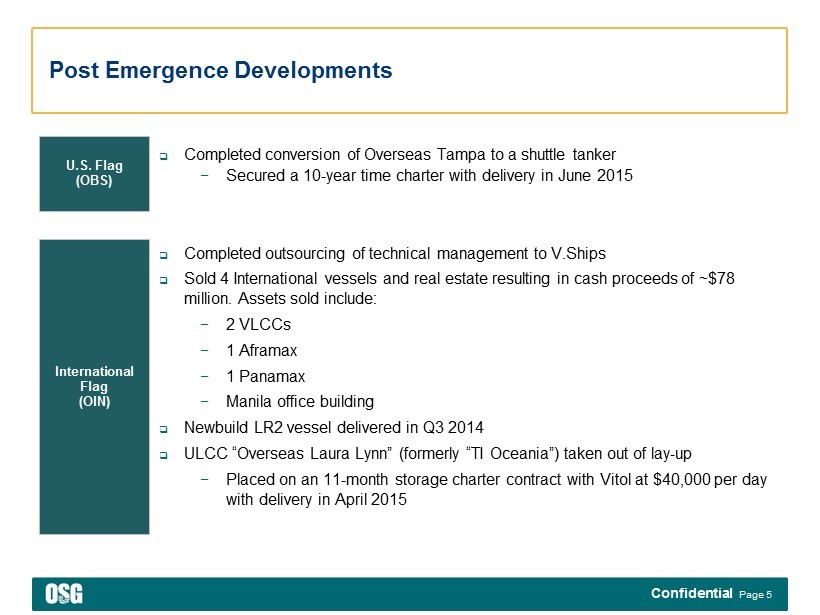
Page 5 Confidential International Flag (OIN) Post Emergence Developments U.S. Flag (OBS) □ Completed outsourcing of technical management to V.Ships □ Sold 4 International vessels and real estate resulting in cash proceeds of ~$78 million. Assets sold include: − 2 VLCCs − 1 Aframax − 1 Panamax − Manila office building □ Newbuild LR2 vessel delivered in Q3 2014 □ ULCC “Overseas Laura Lynn” (formerly “TI Oceania”) taken out of lay - up − Placed on an 11 - month storage charter contract with Vitol at $40,000 per day with delivery in April 2015 □ Completed conversion of Overseas Tampa to a shuttle tanker − Secured a 10 - year time charter with delivery in June 2015

Page 6 Confidential Market Update Source: Navigistics , Clarksons Research, Company filings. (1) Based on January - March 2015. (2) Actual OSG average rate based on weighted average rate of crude and product Aframax (LR2) vessels.. (3) Actual OSG average rate based on weighted average rate of crude and product Panamx (LR1) vessels. International Flag – 1 - Year Time Charter Rates U.S. Flag – Time Charter Rates $45.0K $33.0K $23.0K $21.5K $15.8K $10.0 $15.0 $20.0 $25.0 $30.0 $35.0 $40.0 $45.0 $50.0 Apr-10 Apr-11 Apr-12 Apr-13 Apr-14 Apr-15 VLCC Suezmax Aframax Panamax / LR1 MR $52.0 $53.0 $53.0 $46.0 $42.0 $46.0 $58.0 $70.0 $75.0 $0.0 $10.0 $20.0 $30.0 $40.0 $50.0 $60.0 $70.0 $80.0 2006 2007 2008 2009 2010 2011 2012 2013 2014 Jones Act Product Tankers Bankruptcy Emergence (August 2014) (US$ 000’s/Day) (US$ 000’s/Day) TCE Spot Rates (US$/Day) Projected per Emergence Model Actual OSG Average Rates Drewry Actual Vessel Type 2014 2015 2014 2015 (1) VLCC 21,303$ 22,944$ 24,336$ 49,280$ Aframax / LR2 (2) 15,727 16,334 19,784 30,403 Panamax / LR1 (3) 14,397 15,400 16,890 20,264 MR 15,519 16,693 11,897 18,064

Page 7 Confidential Financial Update OSG Consolidated All amounts in $M $ in Millions Actual Q1 2015 3/31/2015 Actual Q1 2014 3/31/2014 Actual 9 months ending 3/31/2015 Projected 9 months ending 3/31/2015 At Emergence (1) Time Charter Equivalent (TCE) Revenues $221.6 $214.6 $596.8 $518.2 Income from Vessel Operations $65.1 $34.6 $127.1 $64.9 Adjusted EBITDA $113.7 $86.6 $270.4 $213.9 Net Income $42.9 $12.6 $80.0 $9.6 Cash (2) $595.3 $638.7 $248.0 Debt $1,665.6 $2,556.3 $1,621.4 Equity / (Deficit) $1,326.3 $(49.2) $1,109.5 LTM Adjusted EBITDA (3) $325.7 $267.8 $269.1 Senior Leverage Ratio 3.7x NA 4.4x Total Leverage Ratio 5.1x 9.5x 6.0x Interest Coverage (4) 2.8x NM 2.5x Fixed Charge Coverage (5) 2.4x NM 2.2x (1) As projected in Emergence Model. Note Q1 2015 projections derived from dividing 2015 annual projections by 4 and adjusting th e b alance sheet items by one quarter of annual 2015 net change in cash, debt repayment and net income. (2) 3/31/2015 Cash includes $118 million of restricted cash, $78 million of which relates to proceeds from sale of vessels and ot her property. (3) At Emergence Projected LTM Adjusted EBITDA calculated combining actual 2Q 2014 results with projected 3Q 2014 – Q1 2015 results per projections in Amended Disclosure Statement Appendices (D.I. 3147) filed 5/9/2014. (4) 3/31/2015 Interest Coverage ratio based on annualized Q1 2015 interest expense divided by LTM Adj. EBITDA. 3/31/2014 Interest Coverage is not meaningful as company only paid $0.2 million of interest LTM 3/31/2014. (5) 3/31/2015 Fixed Charge Coverage defined as (Adj. EBITDA - CapEx )/(Interest + Mandatory Amortization). Based on annualized Q1 2015 interest expense and 1.00% mandatory amortization on OBS and OIN Term Loans. CapEx is comprised of vessel expenditures and property expenditures . Fixed Charge Coverage is not meaningful for LTM 3/31/2014 as company only paid $0.2 million of interest.

Page 8 Confidential Financial Update U.S. Flag (OBS) All amounts in $M $ in Millions Actual Q1 2015 3/31/2015 Actual Q1 2014 3/31/2014 Actual 9 months ending 3/31/2015 Projected 9 months ending 3/31/2015 At Emergence (1) Time Charter Equivalent (TCE) Revenues $111.2 $100.9 $320.6 $297.1 Income from Vessel Operations $28.3 $23.1 $88.0 $56.7 Adjusted EBITDA $45.6 $40.6 $137.1 $106.6 Net Income $18.9 $23.0 $59.3 $28.5 Cash $125.0 $278.3 $101.4 Debt $597.1 NM $589.4 Equity $478.8 $1,012.6 $125.9 LTM Adjusted EBITDA (2) $168.7 NA $138.1 OBS Leverage Ratio 3.5x NA 4.3 x OBS Interest Coverage (3) 4.5x NA 3.9x OBS Fixed Charge Coverage (4) 3.7x NA 3.2x (1) As projected in Emergence Model. Note Q1 2015 projections derived from dividing 2015 annual projections by 4 and adjusting the balance sheet items by one quar ter of 2015 net change in cash, debt repayment and net income. (2) At Emergence Projected LTM Adjusted EBITDA calculated combining actual 2Q 2014 results with projected 3Q 2014 – Q1 2015 results per projectio ns in Amended Disclosure Statement Appendices (D.I. 3147) filed 5/9/2014. (3) Based on annualized Q1 2015 interest expense divided by LTM Adj. EBITDA. (4) Fixed Charge Coverage defined as (Adj. EBITDA - CapEx )/(Interest + Mandatory Amortization). Based on annualized Q1 2015 interest expense and 1.00% mandatory amortization on OBS T erm Loan . CapEx is comprised of vessel expenditures and property expenditures.

Page 9 Confidential Financial Update International Flag (OIN) All amounts in $M $ in Millions Actual Q1 2015 3/31/2015 Actual Q1 2014 3/31/2014 Actual 9 months ending 3/31/2015 Projected 9 months ending 3/31/2015 At Emergence (1) Time Charter Equivalent (TCE) Revenues $110.4 $113.6 $276.3 $221.2 Income from Vessel Operations $35.8 $25.9 $41.6 $8.2 Adjusted EBITDA $67.0 $57.3 $135.6 $107.3 Net Income $38.0 $32.4 $189.8 $7.6 Cash (2) $324.4 $188.2 $88.2 Debt $622.6 560.7 $587.6 Equity $1,426.4 $962.0 $1,380 LTM Adjusted EBITDA (3) $153.4 NA $125.0 OIN Leverage Ratio 4.1x NA 4.7x OIN Interest Coverage (4) 3.7x NA 3.3x OIN Fixed Charge Coverage (5) 2.9x NA 2.8x (1) As projected in Emergence Model. Note Q1 2015 projections derived from dividing 2015 annual projections by 4 and adjusting th e b alance sheet items by one quarter of 2015 net change in cash, debt repayment and net income. (2) 3/31/2015 Cash and Cash Equivalents include $78.0 million of restricted cash relating to proceeds from sale of vessels and other property. (3) At Emergence Projected LTM Adjusted EBITDA calculated combining actual 2Q 2014 results with projected 3Q 2014 – Q1 2015 results per projections in Amended Disclosure Statement Appendices (D.I. 3147) filed 5/9/2014. (4) Based on annualized Q1 2015 interest expense divided by LTM Adj. EBITDA. (5) Fixed Charge Coverage defined as (Adj. EBITDA - CapEx )/(Interest + Mandatory Amortization). Based on annualized Q1 2015 interest expense and 1.00% mandatory amortization on OIN Term Loan. CapEx is comprised of vessel expenditures and property expenditures.

Page 10 Confidential Proposed Senior Credit Facilities Amendments Include the Following: □ The Company is requesting various changes to both the OIN and OBS Senior Credit Facilities in order to clarify and clean up the language in certain provisions and provide flexibility for the company to pursue a number of contemplated initiatives. □ The Following will be modified in both the OIN and OBS Credit Agreements: − Removal of language in sections 6.05, 6.06 and 6.07 that limit the company’s ability to “agree to” any mergers, consolidations or acquisitions ▪ Note, a variety of other provisions will either limit or hinder the ability of executing on such transactions − Allow for directors that are appointed via proxy to not trigger a change of control □ The following will be modified only in the OIN Credit Agreement: − Change the current Excess Cash Flow Period to be the 6 month period from 7/1/15 to 12/31/15 − Consent to a $200 million dividend to Holdings (OSG) ▪ PF liquidity at OIN of $174 million following the dividend (1) − Waive the requirement that the Company re - invest the proceeds from asset sales prior to the amendment date (to be capped at $78 million) − Carve out certain AR collateral for the pool vessels in order to allow pool operators to use this collateral to obtain financing ▪ Currently OIN provides the capital to finance these assets to the pool operators . Changing this provision will free up additional working capital and cash for OIN − Permit the bareboat charter of up to 2 vessels from OIN to OBS (1) As of 3/31/2015.
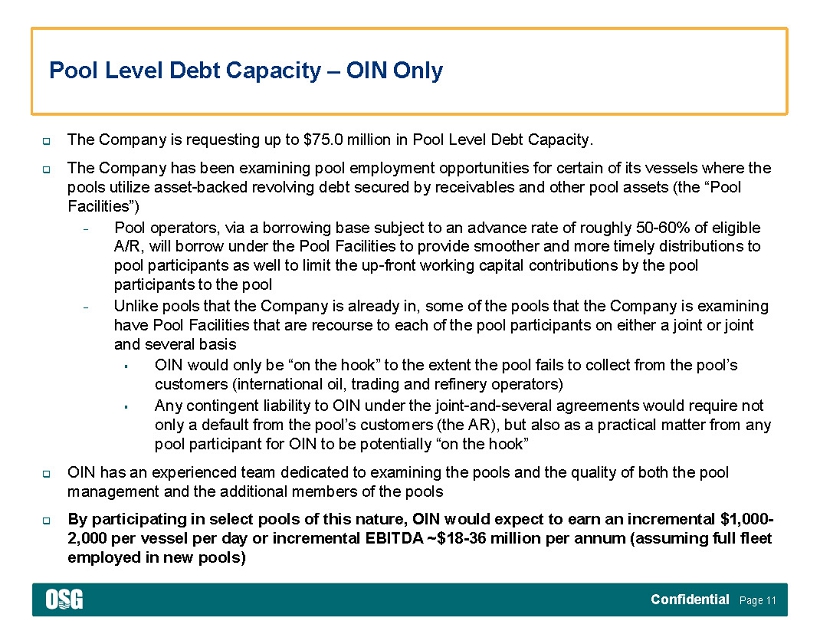
Page 11 Confidential Pool Level Debt Capacity – OIN Only □ The Company is requesting up to $75.0 million in Pool Level Debt Capacity. □ The Company has been examining pool employment opportunities for certain of its vessels where the pools utilize asset - backed revolving debt secured by receivables and other pool assets (the “Pool Facilities”) − Pool operators, via a borrowing base subject to an advance rate of roughly 50 - 60% of eligible A/R, will borrow under the Pool Facilities to provide smoother and more timely distributions to pool participants as well to limit the up - front working capital contributions by the pool participants to the pool − Unlike pools that the Company is already in, some of the pools that the Company is examining have Pool Facilities that are recourse to each of the pool participants on either a joint or joint and several basis ▪ OIN would only be “on the hook” to the extent the pool fails to collect from the pool’s customers (international oil, trading and refinery operators) ▪ Any contingent liability to OIN under the joint - and - several agreements would require not only a default from the pool’s customers (the AR), but also from any pool participant for OIN to be potentially “on the hook” □ OIN has an experienced team dedicated to examining the pools and the quality of both the pool management and the additional members of the pools □ By participating in select pools of this nature, OIN would expect to earn an incremental $1,000 - 2,000 per vessel per day or incremental EBITDA ~$18 - 36 million per annum (assuming full fleet employed in new pools)

Page 12 Confidential Timing and Process for the Amendment Requests □ Please refer to Syndtrak for the corresponding legal documentation and posting memos □ Signature pages for both the OIN and OBS Amendments are due Monday, June 1 st at 5:30pm EST □ Please submit sign pdfs for each fund in the respective Credit Facilities to projectOSG@whitecase.com − Lenders that Consent to the OBS Term Loan Amendment will receive a 5 bps fee − Lenders that Consent to the OIN Amendment will receive a 50 bps fee. The 101 soft call provision will also be refreshed for a 6 month period □ For questions of a business nature please contact J.R. Young of Jefferies at or □ For questions of a legal nature please contact Rob Amdursky of White & Case at or
Page 13 Confidential Q&A

Page 14 Confidential Appendix

Page 15 Confidential Definitions Shipping Revenue - Voyage Expenses (see Glossary section in 10 - K for items included) = TCE Revenue - Operatin g Expenses (Vessel Expenses, Tech Management transition costs , Charter Hire, G&A including severance, Gain/Loss on disposal of Vessels and Impairments, Depreciation and Amortization) +/ - Equity in Income of Affiliated Companies = Operating Income/(Loss) * Adjusted EBITDA is presented to provide lenders with meaningful additional information that management uses to monitor ongo ing operating results and evaluate trends over comparative periods. Adjusted EBITDA should not be considered a substitute for net income/(loss) attributable to the Company or cash flow from operating activities prepared in accordance with accounting principles generally accepted in the United States or as a measure of profitability or liquidity. Adj usted EBITDA for OIN and OBS also excludes other income Net Income - /+ Gain/(Loss) on Disposals of Vessels, including impairments + Depreciation/Amortization + Technical Management Transition Costs + Severance Costs + Goodwill & Other Intangibles Impairment + Interest Expense + Reorganization items, net - /+ Income Tax Benefit/(Expense) = Adjusted EBITDA* Total Debt Divided by: LTM Adjusted EBITDA = Total Leverage Ratio LTM Adjusted EBITDA Divided by: Interest Expense = Interest Coverage (LTM Adjusted EBITDA – Vessel & Property CapEx ) Divided by: (Interest Expense + Mandatory Amortization) = Fixed Charge Coverage Senior Secured Debt Divided by: LTM Adjusted EBITDA = Senior Leverage Ratio

Page 16 Confidential Reconciliations – Actual Results (1) OIN and OBS Adjusted EBITDA exclude other expenses/(income). OSG Consolidated Adjusted EBITDA does not adjust for other e xpe nses/(income). OSG Consolidated OBS OIN Q1 LTM FY Q1 LTM 9 Months Ending Q1 FY Q1 LTM 9 Months Ending Q1 FY Q1 LTM 9 Months Ending ($ in millions) 2014 3/31/2014 2014 2015 3/31/2015 3/31/2015 2014 2014 2015 3/31/2015 3/31/2015 2014 2014 2015 3/31/2015 3/31/2015 TCE revenue (net of voyage expenses) 215$ 782$ 761$ 222$ $ 768 $ 597 101$ 415$ 111$ $ 426 $ 321 114$ 346$ 110$ $ 343 $ 276 Vessel expenses (incl. tech mgmt transition costs) (67) (266) (272) (69) (275) (206) (32) (135) (34) (137) (103) (34) (137) (35) (138) (103) Charter hire expense (45) (187) (152) (32) (138) (98) (22) (91) (23) (91) (69) (23) (61) (9) (47) (30) General & administrative (incl. severance) (31) (113) (101) (19) (89) (61) (6) (30) (9) (33) (10) (11) (61) (11) (61) (49) Depreciation and amortization (38) (171) (152) (37) (151) (114) (17) (68) (17) (68) (51) (21) (84) (20) (83) (62) Goodwill & other intangibles impairment charge - (16) - - - - - - - - - - - - - - Gain/(loss) on disposal of vessels/other property 1 (364) 11 1 10 10 (0) 1 (0) 1 1 2 10 1 10 10 Income from vessel operations 35$ (334)$ 95$ 65$ $ 126 127$ 23$ 92$ 28$ $ 97 88$ 26$ 13$ 36$ $ 22 42$ Equity in income/(loss) of affiliated companies 8 39 41 12 45 36 0 3 (0) 3 3 8 38 12 42 33 Operating income / (loss) 43$ (295)$ 136$ 78$ $ 171 163$ 24$ 95$ 28$ $ 100 91$ 34$ 50$ 48$ 65$ 75$ Net income 13$ $ (458) $ (152) 43$ (122)$ $ 80 23$ $ 70 19$ 65$ 59$ 32$ $ 131 38$ 136$ $ 190 Other expenses/(income) (1) NA NA NA NA NA NA 0.5 7.4 (0.0) 6.8 6.5 1 (145) (0) (146) (146) Gain/(loss) on disposal of vessels/other property (1) 364 (11) (1) (10) (10) 0 (1) 0 (1) (1) (2) (10) (1) (10) (10) Depreciation and amortization 38 171 152 37 151 114 17 68 17 68 51 21 84 20 83 62 Technical management transition costs 0 0 3 0 3 2 - - - - - 0 3 0 3 2 Severance and relocation costs 7 10 17 0 10 2 0 1 0 1 (4) 4 16 - 12 6 Goodwill & other intangibles impairment charge - 16 - - - - - - - - - - - - - - Interest expense 0 0 232 29 261 86 - 15 9 25 25 0 45 10 55 29 Reorganization items, net 29 172 171 3 146 60 0 3 0 3 0 0 18 - 18 2 Income tax provision/(benefit) 1 (8) (115) 3 (113) (63) 0 0 - 0 (0) 0 1 (0) 0 0 Adjusted EBITDA 87$ 268$ 299$ 114$ 326$ 270$ 41$ 164$ 46$ 169$ 137$ 57$ 144$ 67$ 153$ 136$

Page 17 Confidential Reconciliations – At Emergence Projections (1) OIN and OBS Adjusted EBITDA exclude other expenses/(income). OSG Consolidated Adjusted EBITDA does not adjust for other e xpe nses/(income). OSG Consolidated OBS OIN Actual At Emergence Projections Actual At Emergence Projections Actual At Emergence Projections Q2 6 Months Ending Q1 LTM 9 Months Ending Q2 6 Months Ending Q1 LTM 9M Ending Q2 6 Months Ending Q1 LTM 9 Months Ending ($ in millions) 2014 2014 2015 3/31/2015 3/31/2015 2014 2014 2015 3/31/20153/31/2015 2014 2014 2015 3/31/20153/31/2015 TCE revenue (net of voyage expenses) 172$ 340$ 178$ 690$ 518$ 105$ 196$ 102$ 402$ $ 297 67$ 144$ 77$ 288$ $ 221 Vessel expenses (incl. tech mgmt transition costs) (68) (139) (71) (278) (210) (33) (68) (35) (136) (103) (35) (71) (36) (142) (107) Charter hire expense (40) (59) (30) (129) (89) (23) (46) (23) (91) (69) (17) (13) (7) (37) (20) General & administrative (incl. severance) (27) (23) (12) (61) (34) (23) (13) (6) (42) (19) (12) (10) (5) (28) (15) Depreciation and amortization (40) (80) (41) (161) (121) (17) (33) (17) (67) (50) (21) (47) (24) (92) (71) Goodwill & other intangibles impairment charge - - - - - - - - - - - - - - - Gain/(loss) on disposal of vessels/other property 0 0 - 0 0 0 - - 0 - 0 0 - 0 0 Income from vessel operations $ (4) $ 39 $ 26 $ 61 $ 65 $ 9 $ 37 $ 20 $ 66 $ 57 $ (19) $ 3 $ 6 $ (11) $ 8 Equity in income/(loss) of affiliated companies 10 19 9 38 28 0 - - 0 - 9 19 9 37 28 Operating income / (loss) 6$ 58$ 35$ 99$ 93$ 10$ 37$ 20$ 66$ 57$ (10)$ 21$ 15$ 26$ 36$ Net income $ (204) 3$ 7$ $ (195) $ 10 $ 6 19$ 10$ $ 35 28$ $ (53) 2$ 6$ $ (46) 8$ Other expenses/(income) (1) 0 - - 0 - 1 - - 1 - Gain/(loss) on disposal of vessels/other property (0) (0) - (0) (0) (0) - - (0) - (0) (0) - (0) (0) Depreciation and amortization 40 80 41 161 121 17 33 (17) 67 50 21 47 24 92 71 Technical management transition costs 2 - - 2 - - - - - - 2 - - 2 - Severance and relocation costs 8 - - 8 - 5 - - 5 - 5 - - 5 - Goodwill & other intangibles impairment charge - - - - - - - - - - - - - - - Interest expense 175 55 27 257 82 - 18 9 27 27 26 19 10 55 29 Reorganization items, net 86 - - 86 - 3 - - 3 - 16 - - 16 - Income tax provision/(benefit) (50) 0 1 (49) 1 0 0 1 1 1 0 - - 0 - Adjusted EBITDA 55$ 138$ 76$ 269$ 214$ 32$ 70$ 3$ 138$ 107$ 18$ 68$ 39$ 125$ 107$