Attached files
| file | filename |
|---|---|
| 8-K - HORIZON BANCORP INC /IN/ | hb_8k0527.htm |
Exhibit 99.1

A NASDAQ Traded Company - Symbol HBNC

This presentation may contain forward-looking statements regarding the financial performance, business, and future operations of Horizon Bancorp and its affiliates (collectively, “Horizon”). For these statements, Horizon claims the protection of the safe harbor for forward-looking statements contained in the Private Securities Litigation Reform Act of 1995. Forward-looking statements provide current expectations or forecasts of future events and are not guarantees of future results or performance. As a result, undue reliance should not be placed on these forward-looking statements, which speak only as of the date hereof. We have tried, wherever possible, to identify such statements by using words such as “anticipate,” “estimate,” “project,” “intend,” “plan,” “believe,” “will” and similar expressions, and although management believes that the expectations reflected in such forward-looking statements are accurate and reasonable, actual results may differ materially from those expressed or implied in such statements. Risks and uncertainties that could cause our actual results to differ materially include those set forth in Horizon’s filings with the Securities and Exchange Commission, including its Annual Report on Form 10-K. Statements in this presentation should be considered in conjunction with such risk factors and the other information publicly available about Horizon, including the information in the filings we make with the Securities and Exchange Commission. Horizon does not undertake, and specifically disclaims any obligation, to publicly release any updates to any forward-looking statement to reflect events or circumstances occurring or arising after the date on which the forward-looking statement is made, or to reflect the occurrence of unanticipated events, except to the extent required by law. Forward-Looking Statements

Who We Are *

* Horizon at a Glance 32 Locations Across Indiana and MichiganHeadquartered in Michigan City, IndianaRecord Earnings 14 out of Last 15 YearsMarket Capitalization of $224 Million$2.2 Billion in Total Assets$985 Million in AUMOwnership9% Insiders12% Employee Benefit Plans39% Institutional * Market data as of May 20, 2015; financial data as of March 31, 2015
Northwest Indiana/Southwest Michigan… The Right Side of Chicago

Retail BankingBusiness BankingMortgage BankingWealth Management Complementary Revenue Streams that are Counter-Cyclical to Varying Economic Cycles * Four Key Revenue Streams

Horizon’s Story Steady GrowthSuperior ReturnsFinancial StrengthConsistent Performance *

1Q15 Highlights *

1Q15 Highlights * Total Loan Growth - LQA 29%, YOY 33% Commercial Loan Growth - LQA 13%, YOY 32%Core Net Interest Margin Held Steady at 3.47% (1)Strong Mortgage Revenue Generated Redeployable CapitalOpened Full-Service Carmel, Indiana Branch on February 23, 2015Announced Peoples Bancorp, Inc. Acquisition on February 19, 2015 (1) Core net interest margin excludes interest income from acquisition related purchase accounting adjustments

* Net Income and Diluted Earnings per Share 2015 Off to a Strong Start Change LQ YOY Net Inc. 8.3% 56.8% Dil. EPS 7.8% 44.7%
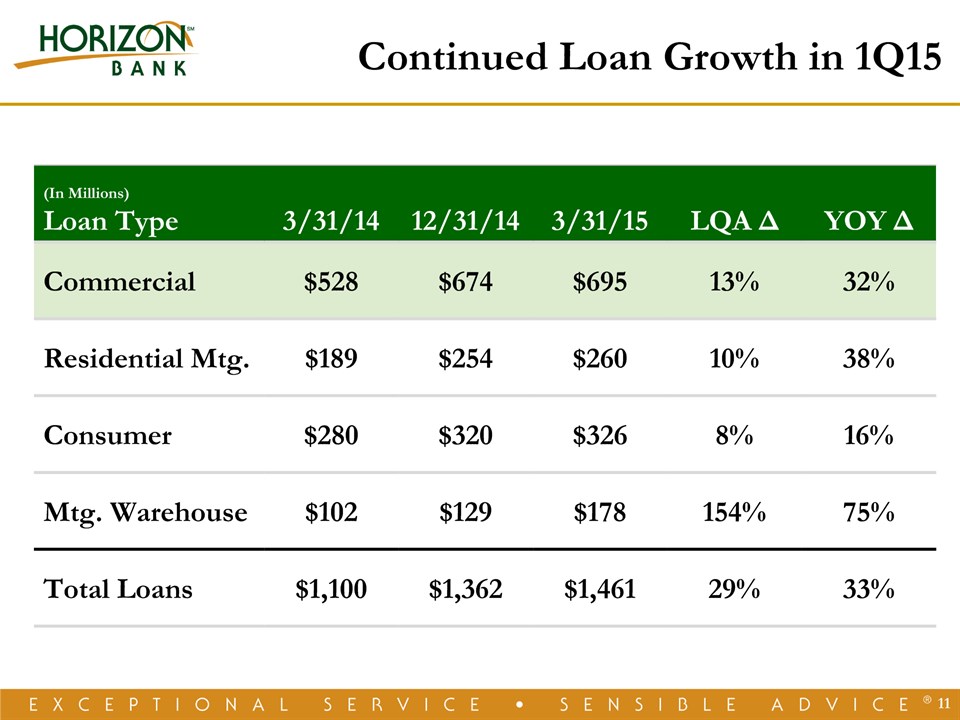
Continued Loan Growth in 1Q15 * (In Millions)Loan Type 3/31/14 12/31/14 3/31/15 LQA Δ YOY Δ Commercial $528 $674 $695 13% 32% Residential Mtg. $189 $254 $260 10% 38% Consumer $280 $320 $326 8% 16% Mtg. Warehouse $102 $129 $178 154% 75% Total Loans $1,100 $1,362 $1,461 29% 33%

Peoples Bancorp Acquisition *

* Peoples Bancorp Franchise Overview Established in 1925 in Auburn, IN16 F.S. Locations (IN-12 & MI-4)$3.4 Million LTM Net Income$477 Million in Total Assets$230 Million in Total Loans $358 Million in Deposits$230 Million in AUM0.27% NPAs/Assets Data Source: Peoples company financials at or for the twelve months ended March 31, 2015Map Source: SNL Financial

* Merger Highlights Strategic Financial Operational Aligned with Horizon’s plan to expand in the states of Indiana and MichiganNatural expansion into contiguous Northeast Indiana Bolsters existing presence in Southwest MichiganContinued revenue diversificationStrong core deposit base EPS accretion of 4.5% in 2016, first full year pro formaInitial TBV dilution of $0.65 with five year earn backInternal rate of return over 20% Operating leverage through cost savings estimated at 37%Revenue synergies through increased product offeringMinimal credit concerns

* Pro Forma Franchise 48 Full Service Locations$2.6 Billion in Assets$1.7 Billion in Loans$1.8 Billion in Deposits$1.2 Billion in AUMMarket Cap. ~ $268 Million Horizon and Peoples company financials and pro forma analysis, excluding merger adjustments. Horizon announced intention to close Peoples’ Middlebury, IN branch. Market cap based on HBNC’s 15-day average stock price on May 20, 2015.Map Source: SNL Financial

* Based on Horizon’s closing price of $23.02 as of February 18, 2015 Merger Summary Horizon Bancorp Acquiring Peoples Bancorp Horizon Bancorp Acquiring Peoples Bancorp Deal Price per Share (1) $31.62 Consideration Structure 0.95 HBNC shares for each outstanding PBNI share; $9.75 in cash for each outstanding PBNI share Aggregate Deal Value (1) $73.1 million Consideration Mix (1) 69% stock, 31% cash Termination Fee $3.5 million Required Approvals Customary regulatory; Horizon and Peoples shareholder approval Anticipated Closing Early third quarter of 2015 Social Issues Maurice Winkler, III, Peoples CEO, to serve on Horizon Bancorp and Horizon Bank’s board of directorsRetention of Jeffrey Gatton, Peoples COO, to lead regional branch operations, training and sales efforts

* Source: SNL Financial; financial data as of December 31, 2014 and market data as of February 18, 2015Nationwide bank and thrift transactions announced after 12/31/2012 with target’s assets between $200 million and $1 billion, tangible common equity to tangible assets between 10.0% and 15%, LTM return on average assets between 0.25% and 1.00% and NPAs/assets less than 1.50%, excluding transactions where pricing information is unavailable Transaction Pricing Metric HBNC/PBNI ComparableTransactions (1) Price/Tangible Book Value 124% 138% Price/LTM Earnings 21x 21x Core Deposit Premium 4.4% 6.9% Market Premium 22% 33%
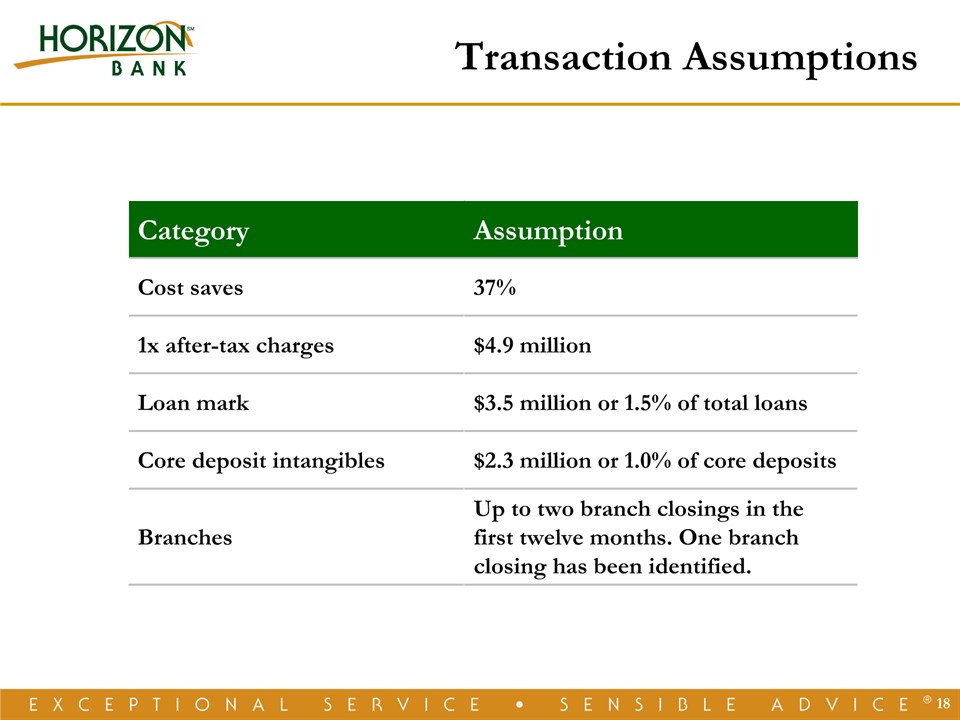
* Transaction Assumptions Category Assumption Cost saves 37% 1x after-tax charges $4.9 million Loan mark $3.5 million or 1.5% of total loans Core deposit intangibles $2.3 million or 1.0% of core deposits Branches Up to two branch closings in the first twelve months. One branch closing has been identified.

Horizon’s Growth Story *

Horizon: A Company on the Move OrganicExpans.(7) St. JosephSouth BendElkhart Lake County Kalamazoo Indianapolis Carmel M&A(7) Anchor Mortgage Alliance Bank American Trust Heartland 1st MortgageSummitPeoples * Assets ($ Mil.) $721 $2,631 Loans($ Mil.) $548 $1,691 Deposits($ Mil.) $489 $1,823 Branches 7 48 11% CAGR 10% CAGR 11% CAGR Note: Current financials reflect Peoples, excluding merger adjustments

Growth Opportunities in All Directions * Kalamazoo, Lansing & St. JosephPopulation: 883,000Deposits: $10 billion South Bend, Elkhart & Fort WaynePopulation: 835,000Deposits: $12 billion Indianapolis & Johnson CountyPopulation: 1.4 millionDeposits: $32 billion Lake & Porter CountiesPopulation: 657,000Deposits: $11 billion LEGACYLa Porte CountyPopulation: 111,000Deposits: $1.6 billion N E S W Note: Data by primary counties for each market

2000 – 1Q15 CAGR: 13% In Millions Net Income History * Solid Historical Earnings

* Investing in Commercial LendersCreates Growth Commercial Loan Balances

* Balanced Risk In Commercial Portfolio Commercial Loan Composition as of March 31, 2015

Kalamazoo and Indianapolis Loan Balances * Growth Markets Thriving 2014 Growth: 43%

March 31, 2015 December 31, 2008 In Millions 2008 1Q15 CAGR Commercial $311 $695 13.8% Real Estate $291 $439 6.8% Consumer $280 $326 2.5% Total $882 $1,461 8.4% * Shift to Commercial

December 31, 2008 March 31, 2015 Strong Low Cost Deposit Growth * In Millions 2008 1Q15 CAGR NIB $84 $285 21.7% IB Trans. $429 $905 12.7% CDs $329 $274 -2.8% Total $842 $1,465 9.3%

* NPLs/ Loans Disciplined Credit Culture
* Why Invest In Horizon

Shareholder Value Plan - Since 2001 Steady Growth in Net Book Value & EPS DividendsUninterrupted Dividends for more than 25 YearsDividend Increases Aligned with Earnings GrowthImproving LiquidityStock Splits in 2001, 2003, 2011 and 2012Common Stock Issued in Heartland and Summit AcquisitionsRussell 2000 Index Since 2012Added to Nasdaq Community Bank Index in 2014 *

Highly Regarded For Financial Performance Top 200 Community Banks for Financial Performance Six Consecutive Years, 2008 - 2013US Banker & ABA MagazinesTop 10% of Community BanksAnnual Community Bankers Cup, 2012 & 2013Raymond JamesKBW Bank Honor Roll2011 & 2012 *

Highly Regarded In Our Communities * Community Relations Award Urban League of Northwest Indiana, Inc.Nine out of Ten Customers Would Refer a FriendIndependent SurveyBest Bank - Twelve out of Last Thirteen YearsThe News Dispatch Readers PollBest Bank for Obtaining a Business LoanNorthwest Indiana Business Quarterly Family Friendly Work PoliciesIU Health / Clarian Award

Horizon Outperforms the MarketFor Total Shareholder Return As of May 20, 2015; 2015 estimated EPS of $2.24 is the mean estimate from 3rd party research analystsSNL U.S. Bank: Includes all Major Exchange Banks in SNL's coverage universe. * Horizon Bancorp: 5-Year Total Return Comparison P/2015 Est. EPS 10.9x P/TBV 145% Div. Yield 2.3%

Thank Youfor Your Investment inHorizon Bancorp
A NASDAQ Traded Company - Symbol HBNC
Appendix

* Non-GAAP Reconciliations