Attached files
| file | filename |
|---|---|
| 8-K - 8-K - PACIFIC MERCANTILE BANCORP | shareholdermeetingpresenta.htm |

PACIFIC MERCANTILE BANCORP PRESIDENT’S REPORT 2 0 1 5 A N N U A L M E E T I N G
PACIFIC MERCANTILE BANCORP This presentation contains statements regarding our expectations, beliefs and views about our future financial performance and our business, trends and expectations regarding the markets in which we operate, and our future plans. Those statements constitute “forward-looking statements” within the meaning of Section 27A of the Securities Act of 1933, as amended, and Section 21E of the Securities Exchange Act of 1934, as amended, can be identified by the fact that they do not relate strictly to historical or current facts. Often, they include words such as “believe,” “expect,” “anticipate,” “intend,” “plan,” “estimate,” “project,” or words of similar meaning, or future or conditional verbs such as “will,” “would,” “should,” “could,” or “may”. Forward-looking statements are based on current information available to us and our assumptions about future events over which we do not have control. Moreover, our business and our markets are subject to a number of risks and uncertainties which could cause our actual financial performance in the future, and the future performance of our markets (which can affect both our financial performance and the market prices of our shares), to differ, possibly materially, from our expectations as set forth in the forward-looking statements contained in this presentation. In addition to the risk of incurring loan losses, which is an inherent risk of the banking business, these risks and uncertainties include, but are not limited to, the following: the risk that the economic recovery in the United States, which is still relatively fragile, will be adversely affected by domestic or international economic conditions, which could cause us to incur additional loan losses and adversely affect our results of operations in the future; the risk that our results of operations in the future will continue to be adversely affected by our exit from the wholesale residential mortgage lending business and the risk that our commercial banking business will not generate the additional revenues needed to fully offset the decline in our mortgage banking revenues within the next two to three years; the risk that our interest margins and, therefore, our net interest income will be adversely affected by changes in prevailing interest rates; the risk that we will not succeed in further reducing our remaining nonperforming assets, in which event we would face the prospect of further loan charge-offs and write-downs of other real estate owned and would continue to incur expenses associated with the management and disposition of those assets; the risk that we will not be able to manage our interest rate risks effectively, in which event our operating results could be harmed; the prospect that government regulation of banking and other financial services organizations will increase, causing our costs of doing business to increase and restricting our ability to take advantage of business and growth opportunities. Additional information regarding these and other risks and uncertainties to which our business is subject are contained in our Annual Report on Form 10-K for the year ended December 31, 2014 which is on file with the SEC as well as subsequent Quarterly Reports on Form 10-Q that we file with the SEC. Due to these and other risks and uncertainties to which our business is subject, you are cautioned not to place undue reliance on the forward-looking statements contained in this news release, which speak only as of its date, or to make predictions about our future financial performance based solely on our historical financial performance. We disclaim any obligation to update or revise any of the forward-looking statements as a result of new information, future events or otherwise, except as may be required by law. FORWARD LOOKING STATEMENT

PACIFIC MERCANTILE BANCORP ORANGE COUNTY ECONOMIC TRENDS

PACIFIC MERCANTILE BANCORP 2014 VC INVESTMENT BY MSA $15,740 $6,883 $4,443 $4,218 $2,054 $1,205 $1,186 $1,065 $857 $805 $642 $621 $547 $496 $480 Combined LA/OC market ranks 5th overall in VC investment TOTAL VENTURE CAPITAL INVESTEDMSA $2.6 billion in VC investment into LA/OC area 1. SAN FRANCISCO 2. SAN JOSE 3. BOSTON 4. NEW YORK CITY 5. LOS ANGELES - LONG BEACH 6. SEATTLE 7. OAKLAND 8. CHICAGO 9. WASHINGTON, DC 10. SAN DIEGO 11. FORT LAUDERDALE 12. AUSTIN 13. ORANGE COUNTY 14. ATLANTA 15. DENVER Source: National Venture Capital Association

ORANGE COUNTY UNEMPLOYMENT RATE PACIFIC MERCANTILE BANCORP 7% 6% 5% 4% 3% 2% 1% MAR 2014 APR 2014 MAY 2014 JUN 2014 JUL 2014 AUG 2014 SEP 2014 OCT 2014 NOV 2014 DEC 2014 JAN 2015 FEB 2015 MAR 2015 Unemployment Rate Back To Pre-Great Recession Levels In Orange County 6.0% 5.1% 5.2% 5.5% 6.0% 5.8% 5.3% 5.2% 5.2% 4.7% 5.0% 4.6% 4.4% Source: California Employment Development Department

PACIFIC MERCANTILE BANCORP 60% 50% 40% 30% 20% 10% 0% EXPECTED EMPLOYMENT ORANGE COUNTY EMPLOYMENT EXPECTATIONS 52% Of Firms Surveyed Expect To Increase Their Labor Force Compared With Only 4% That Expect To Decrease INCREASE 52.1% 43.8% 4.2% UNCHANGED DECREASE Source: Cal State Fullerton Q2 2015 Orange County Business Expectations Survey

PACIFIC MERCANTILE BANCORP Source: Chapman University 7% 6% 5% 4% 3% 2% 1% 60.2 65.9 53.2 54.7 50.4 59.5 61.1 59.2 64.1 58.5 62.2 62.6 62.9 Q1 2012 Q2 2012 Q3 2012 Q4 2012 Q1 2013 Q2 2013 Q3 2013 Q4 2013 Q1 2014 Q2 2014 Q3 2014 Q4 2014 Q1 2015 The Orange County Composite Index is a measure of the results of surveys of conditions for manufacturing in Orange County according to Purchasing Managers. A value of 50 for the Composite Index shows a general expansion of the manufacturing economy of the county and a value below 50 shows a decline. Manufacturing Activity In Orange County Is Steadily Expanding ORANGE COUNTY COMPOSITE INDEX

PACIFIC MERCANTILE BANCORP Office Vacancy Rates Expected To Continue To Decline Throughout 2015 ORANGE COUNTY OFFICE VACANCY RATE 14% 13% 12% 11% 10% Q4 2012 Q1 2013 Q2 2013 Q3 2013 Q4 2013 Q1 2014 Q2 2014 Q3 2014 Q4 2014 Q1 2015 Q2 2015 Q3 2015 FORECAST 13.5% 13.2% 12.6% 12.8% 12.6% 13.2% 12.6% 12.8% 11.8% 11.9% 11.4% 11.1% Source: Grubb & Ellis

PACIFIC MERCANTILE BANCORP For Three Quarters In A Row, The Optimism Of Orange County Business Persons Has Increased ORANGE COUNTY BUSINESS EXPECTATIONS Source: Cal State Fullerton 100 90 80 70 60 50 40 30 20 10 90.7 72.8 70.5 75.0 91.6 93.9 85.2 88.8 88.1 83.8 85.7 91.5 92.0 Q1 2012 Q2 2012 Q3 2012 Q4 2012 Q1 2013 Q2 2013 Q3 2013 Q4 2013 Q1 2014 Q2 2014 Q3 2014 Q4 2014 Q1 2015 The Orange County Business Expectations Survey is a measure of future business expectations by Orange County firms. A value above 50 indicates an expectation of future growth in the economy.

PACIFIC MERCANTILE BANCORP 2014 REVIEW & KEY PERFORMANCE INDICATORS
PACIFIC MERCANTILE BANCORP Steady improvement in operating results culminating in profitable fourth quarter Exceptional progress in growing our commercial banking model 33% increase in C&I loans 22% increase in owner-occupied CRE loans 16% increase in non-interest bearing deposits Continued balance sheet clean-up Non-performing assets/total assets declined to 2.33% from 2.52% Total classified assets declined by 34% Net recoveries in 2014 – NO NET CREDIT LOSSES! FRB written agreement terminated in November 2014 2014 IN REVIEW

PACIFIC MERCANTILE BANCORP Steady improvement in operating results culminating in profitable fourth quarter Exceptional progress in growing our commercial banking model 33% increase in C&I loans 22% increase in owner-occupied CRE loans 16% increase in non-interest bearing deposits Continued balance sheet clean-up Non-performing assets/total assets declined to 2.33% from 2.52% Total classified assets declined by 34% Net recoveries in 2014 – NO NET CREDIT LOSSES! FRB written agreement terminated in November 2014 CONTINUED UPGRADING OF BANK TALENT E X E C U T I V E P O S I T I O N B A C K G R O U N D Tom Wagner Robert Stevens Ross Macdonald Scott Parker EVP and Head of Corporate Finance and Training EVP and Chief Risk Officer SVP and Regional Manager of San Juan Capistrano office SVP and Regional Manager of La Jolla office 25 years of banking experience Head of Corporate Finance for Silicon Valley Bank 35 years of banking experience CCO of Mission Community Bancorp CCO of Rabobank Commercial relationship manager at: BB&T Bank, Manufacturers Bank and Bank of America 30 years of banking experience President and CEO of Vibra Bank

Continue building relationship-oriented banking model Expand specialty lending businesses Improve deposit mix with more core deposits Maintain strong capital ratios KEY PERFORMANCE INDICATORS PROGRESS REPORT PACIFIC MERCANTILE BANCORP

$350 $300 $250 $200 $150 $100 ($ IN MILLIONS) CRE Owner-Occupied C&I Relationship Loans As A Percentage Of Total Loans 65% 60% 55% 50% 45% 40% 35% 30% KEY PERFORMANCE INDICATORS PROGRESS REPORT Continue Building Relationship-Oriented Banking Model $169 9/30/13 12/31/13 3/31/14 6/30/14 9/30/14 12/31/14 3/31/15 $188 $174 $226 $170 $229 $191 $197 $213 $212 $313 $253 $265 47.8% 51.6% 51.3% 55.1% 56.3% 61.4% 62.4% $302 PACIFIC MERCANTILE BANCORP
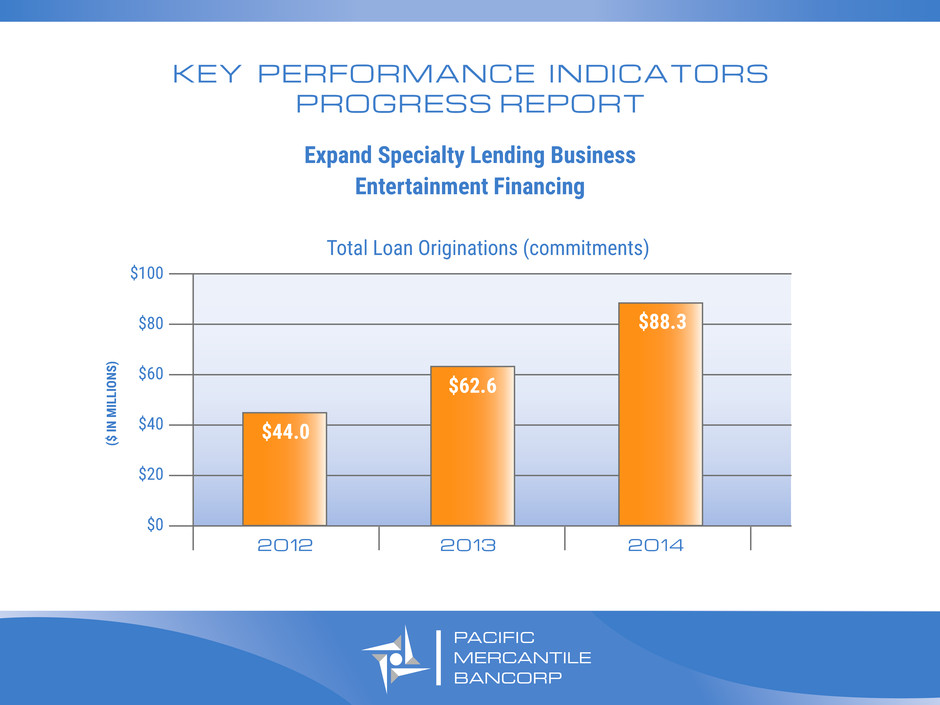
PACIFIC MERCANTILE BANCORP $100 $80 $60 $40 $20 $0 2012 2013 2014 $88.3 $62.6 $44.0 Expand Specialty Lending Business Entertainment Financing KEY PERFORMANCE INDICATORS PROGRESS REPORT Total Loan Originations (commitments) ($ IN MILLIONS )
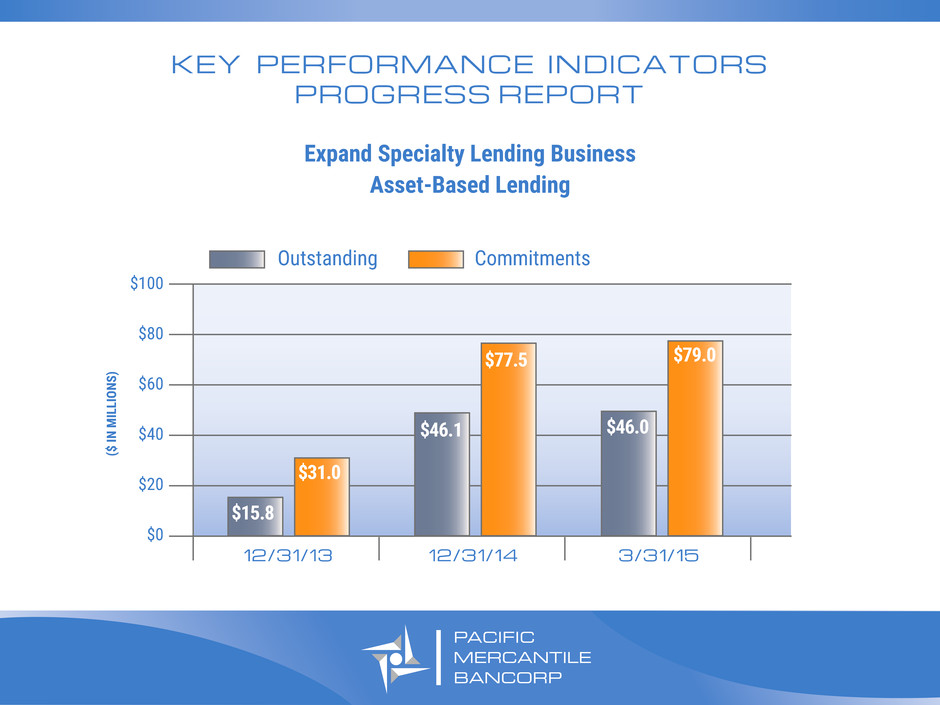
$100 $80 $60 $40 $20 $0 12/31/13 12/31/14 3/31/15 $15.8 $31.0 $46.1 $77.5 $46.0 $79.0 Outstanding Commitments ($ IN MILLIONS ) PACIFIC MERCANTILE BANCORP Expand Specialty Lending Business Asset-Based Lending KEY PERFORMANCE INDICATORS PROGRESS REPORT

PACIFIC MERCANTILE BANCORP $600 $550 $500 $450 $400 $350 $300 $250 $200 $150 $100 46.3% 45.1% 64.7% 60.6% 49.7% 3/31/14 Core Deposits Core Deposits as a Percentage of Total Deposits 6/30/14 9/30/14 12/31/14 3/31/15 70.0% 60.0% 50.0% 40.0% 30.0% 20.0% 10.0% 0.0% $574 $556 $438 $369$364 KEY PERFORMANCE INDICATORS PROGRESS REPORT Improve Deposit Mix With More Core Deposits
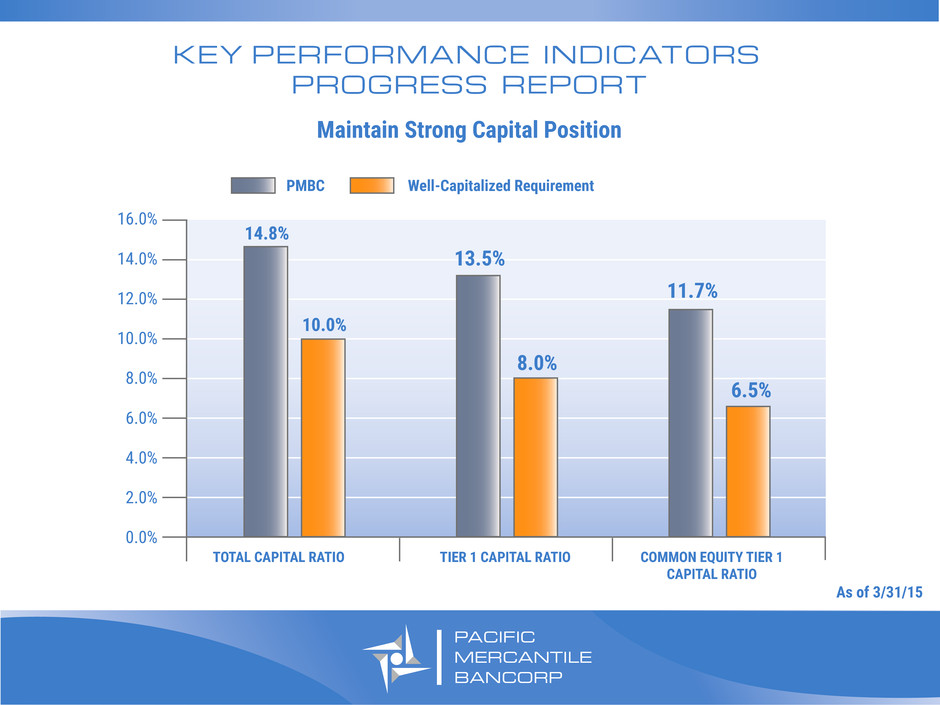
PACIFIC MERCANTILE BANCORP PMBC Well-Capitalized Requirement As of 3/31/15 KEY PERFORMANCE INDICATORS PROGRESS REPORT Maintain Strong Capital Position 16.0% 14.0% 12.0% 10.0% 8.0% 6.0% 4.0% 2.0% 0.0% TOTAL CAPITAL RATIO 14.8% 10.0% 6.5% 8.0% 11.7% TIER 1 CAPITAL RATIO COMMON EQUITY TIER 1 CAPITAL RATIO 13.5%

PACIFIC MERCANTILE BANCORP 2015 OUTLOOK

PACIFIC MERCANTILE BANCORP Continued low interest rate environment Pressures net interest margin Limits revenue growth Run-off of CRE portfolio offsets growth in commercial lending Competitors offering low fixed-rate, long-term CRE loans HEADWINDS AND CHALLENGES

PACIFIC MERCANTILE BANCORP 2015 INITIATIVES Transition SBA lending to commercial banking staff SBA Group terminated in January SBA loans now offered as part of full relationship banking model Continue expanding portfolio of products and services that can attract new clients and generate additional income Mobile Banking – April Cash Manager (Extended FDIC Sweep) – May Business Credit Cards – June

PACIFIC MERCANTILE BANCORP Targeting Greater Than Peer Loan Growth Primarily Driven By C&I And Owner-occupied CRE Maintenance Of Net Interest Margin Driving decline in cost of funds via conversion of >$120mm of CDs to lower-cost deposits Relatively Stable Expense Levels Headcount Control Geographic Infrastructure In Place Meaningful Ongoing Recovery Opportunities Should Keep Provision Requirements Modest For 2015 Steady Increase In Profitability 2015 OUTLOOK

PACIFIC MERCANTILE BANCORP Q&A
