Attached files
| file | filename |
|---|---|
| 8-K - FORM 8-K - Endo International plc | d931368d8k.htm |
Exhibit 99.1
|
|
Exhibit 99.1
Endo International plc
UBS Healthcare Conference
May 20, 2015
©2015 Endo Pharmaceuticals Inc. All rights reserved.
|
|
Forward Looking Statements
This presentation contains information relating to the acquisition of Par by Endo that includes or is based on “forward-looking statements” within the meaning of Section 27A of the Securities Act of 1933, as amended, Section 21E of the Securities Exchange Act of 1934, as amended, and Canadian securities legislation. These statements include statements regarding the timing and the closing of the transaction, the expected benefits of the transaction, the expected accretion to earnings resulting from the transaction, expected product approvals and Endo’s plans to operate Par. Forward-looking statements include the information concerning our possible or assumed results of operations. We have tried, whenever possible, to identify such statements by words such as “believes,” “expects,” “anticipates,” “intends,” “estimates,” “plan,” “projected,” “forecast,” “will,” “may” or similar expressions. We have based these forward-looking statements on our current expectations of future events. Because these statements reflect our current views concerning future events, these forward-looking statements involve risks and uncertainties. If underlying assumptions prove inaccurate or unknown, or unknown risks or uncertainties materialize, actual results could differ material from those expressed in the forward-looking statements contained in this presentation. Risks and uncertainties include, among other things, uncertainties as to the timing of the acquisition; the possibility that various closing conditions to the transaction may not be satisfied or waived, including that a governmental entity may prohibit, delay, or refuse to grant approval for the consummation of the transaction; that the FDA or other regulatory authorities do not approve any product(s) in the manner desired by Endo on a timely basis, or at all; that there is a material adverse change to Par; that the integration of Par business into Endo is not as successful as expected; the failure of Endo to achieve the expected financial and commercial results from the transaction; other business effects, including effects of industry, economic or political conditions outside Endo’s control; transaction costs; the outcome of litigation, actual or contingent liabilities; as well as other cautionary statements contained elsewhere herein and in Endo’s periodic reports filed with the Securities and Exchange Commission (SEC) and with securities regulators in Canada on the System for Electronic Document Analysis and Retrieval (SEDAR), including current reports on Form 8-K, quarterly reports on Form 10-Q and annual reports on Form 10-K. We do not undertake any obligation to update our forward-looking statements after the date of this presentation for any reason, even if new information becomes available or other events occur in the future, except as may be required under applicable securities law. You should understand that it is not possible to predict or identify all such factors. Consequently, you should not consider this to be a complete discussion of all potential risks or uncertainties.
1
©2015 Endo Pharmaceuticals Inc. All rights reserved.
|
|
Non-GAAP Financial Measures
This presentation refers to non-GAAP financial measures of Par Pharmaceutical Holdings, Inc. (Par), including EBITDA, adjusted EBITDA and adjusted gross margin, which are financial measures that are not prepared in conformity with accounting principles generally accepted in the United States (GAAP). We define Par’s adjusted gross margin as gross margin plus amortization expense, stock based compensation expense related to cost of goods, inventory write-downs related to patent litigation and cost of goods acquired on inventory step up. Par’s adjusted EBITDA represents net (loss) income before interest expense, net; provision (benefit) for income taxes; depreciation and amortization; intangible asset impairment; restructuring costs; settlements and loss contingencies; net transaction related costs including severance; upfront and development milestones; stock-based compensation expense and certain other non-recurring, non-cash and other cash expenses. Par’s presentation of EBITDA, adjusted EBITDA and adjusted gross margin may be different from non-GAAP financial measures presented by other companies. We believe that the presentation of Par’s non-GAAP financial measures provides useful supplementary information regarding operational performance because it enhances an investor’s overall understanding of the financial performance and prospects for future core business activities by providing a basis for the comparison of results of core business operations between current, past and future periods. Reconciliation of non-GAAP financial measures to the nearest comparable GAAP amounts have been provided within the appendix at the end of this presentation. We have not provided a quantitative reconciliation of projected non-GAAP measures described above because not all of the information necessary for quantitative reconciliation is available to us at this time without unreasonable efforts. This is due primarily to variability and difficulty in making accurate detailed forecasts and projections. Accordingly, we do not believe that reconciling information for such projected figures would be meaningful.
Additional Information
This presentation is provided for informational purposes only and is neither an offer to purchase nor a solicitation of an offer to sell shares of Endo. Endo and Par shareholders should read any filings made by Endo with the SEC in connection with the proposed combination, as they will contain important information. Those documents, if and when filed, as well as Endo’s other public filings with the SEC, may be obtained without charge at the SEC’s website
| 2 |
|
©2015 Endo Pharmaceuticals Inc. All rights reserved.
at www.sec.gov and at Endo’s website at endo.com.
|
|
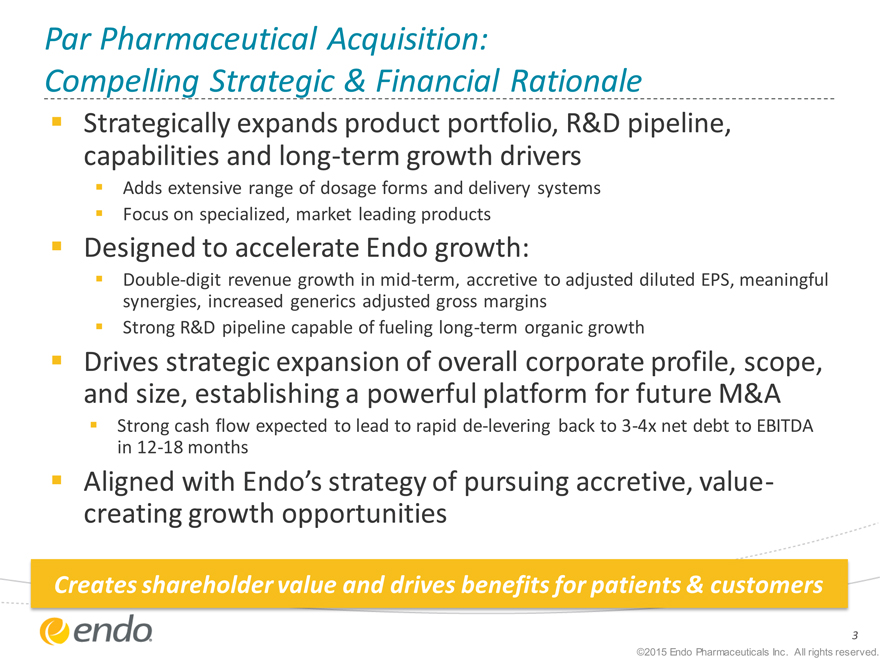
Par Pharmaceutical Acquisition:
Compelling Strategic & Financial Rationale
Strategically expands product portfolio, R&D pipeline,
capabilities and long-term growth drivers
Adds extensive range of dosage forms and delivery systems
Focus on specialized, market leading products
Designed to accelerate Endo growth:
Double-digit revenue growth in mid-term, accretive to adjusted diluted EPS, meaningful
synergies, increased generics adjusted gross margins
Strong R&D pipeline capable of fueling long-term organic growth
Drives strategic expansion of overall corporate profile, scope,
and size, establishing a powerful platform for future M&A
Strong cash flow expected to lead to rapid de-levering back to 3-4x net debt to EBITDA
in 12-18 months
Aligned with Endo’s strategy of pursuing accretive, value-
creating growth opportunities
Creates shareholder value and drives benefits for patients & customers
| 3 |
|
©2015 Endo Pharmaceuticals Inc. All rights reserved.
|
|
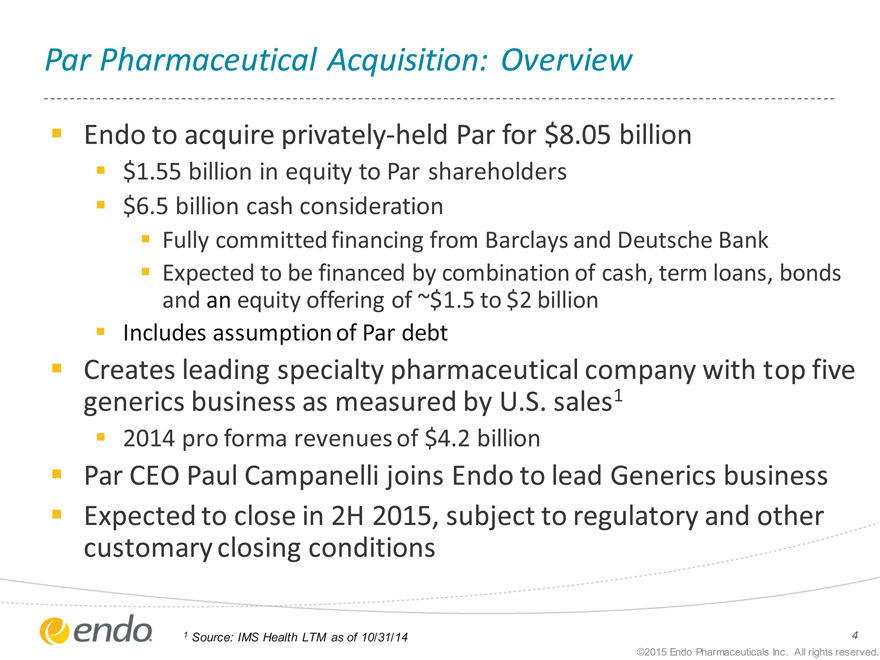
Par Pharmaceutical Acquisition: Overview
Endo to acquire privately-held Par for $8.05 billion
$1.55 billion in equity to Par shareholders
$6.5 billion cash consideration
Fully committed financing from Barclays and Deutsche Bank
Expected to be financed by combination of cash, term loans, bonds and an equity offering of ~$1.5 to $2 billion
Includes assumption of Par debt
Creates leading specialty pharmaceutical company with top five generics business as measured by U.S. sales1
2014 pro forma revenues of $4.2 billion
Par CEO Paul Campanelli joins Endo to lead Generics business
Expected to close in 2H 2015, subject to regulatory and other customary closing conditions
1 Source: IMS Health LTM as of 10/31/14
4
©2015 Endo Pharmaceuticals Inc. All rights reserved.
|
|
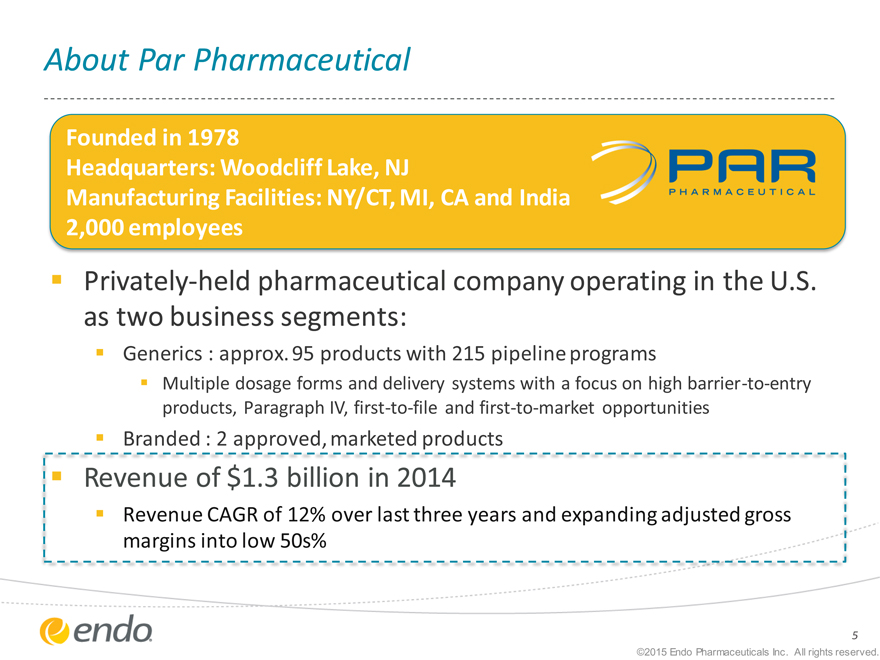
About Par Pharmaceutical
Founded in 1978
Headquarters: Woodcliff Lake, NJ
Manufacturing Facilities: NY/CT, MI, CA and India
2,000 employees
Privately-held pharmaceutical company operating in the U.S.
as two business segments:
Generics : approx. 95 products with 215 pipeline programs
Multiple dosage forms and delivery systems with a focus on high barrier-to-entry
products, Paragraph IV, first-to-file and first-to-market opportunities
Branded : 2 approved, marketed products
Revenue of $1.3 billion in 2014
Revenue CAGR of 12% over last three year and expanding adjusted gross margins into low 50s%
5
©2015 Endo Pharmaceuticals Inc. All rights reserved.
|
|
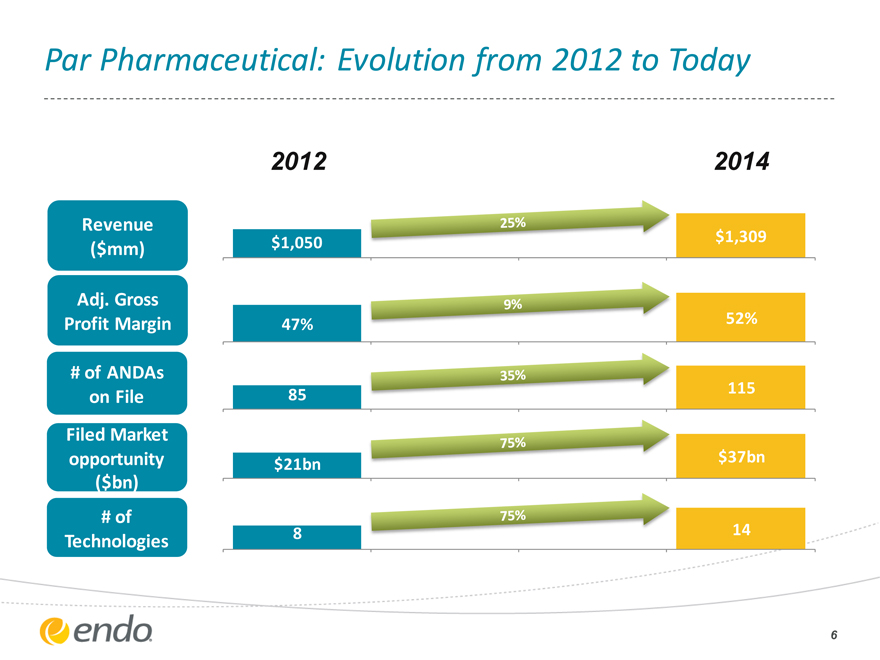
Par Pharmaceutical: Evolution from 2012 to Today
Revenue ($mm)
Adj. Gross Profit Margin
# of ANDAs on File
Filed Market opportunity ($bn)
# of Technologies
2012
$1,050 47% 85 $21bn 8
$1,309 52% 115 $37bn 14
2014
25%
9%
35%
75%
75%
6
|
|
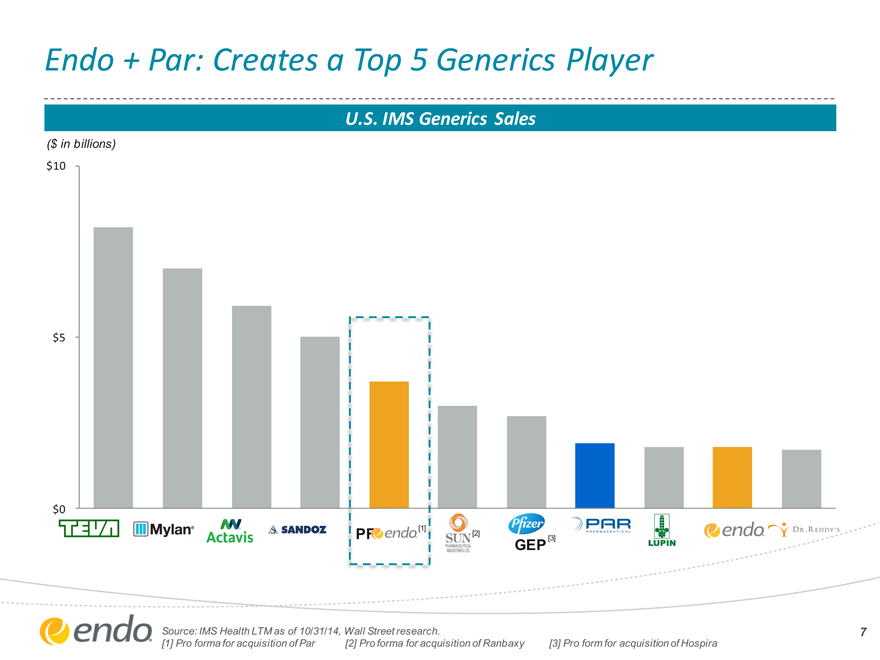
Endo + Par: Creates a Top 5 Generics Player
U.S. IMS Generics Sales
($ in billions) $10
$5
$0
[2]
GEP [3]
ce: IMS Health LTM as of 10/31/14, Wall Street research. ro forma for acquisition of Par [2] Pro forma for acquisition of Ranbaxy [3] Pro form for acquisition of Hospira
7
|
|
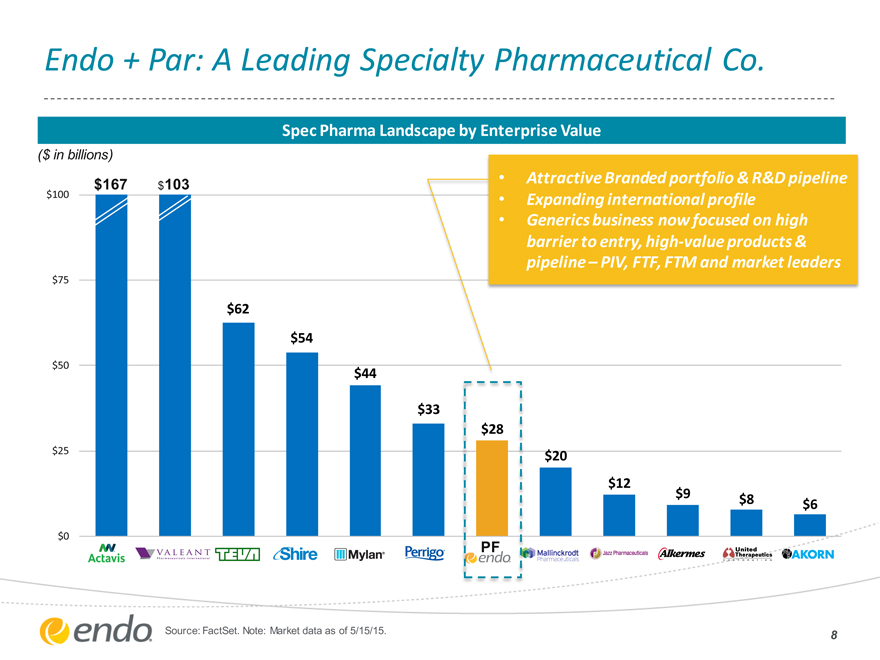
Endo + Par: A Leading Specialty Pharmaceutical Co.
Spec Pharma Landscape by Enterprise Value
($ in billions)
$167 $103
Attractive Branded portfolio & R&D pipeline
Expanding international profile
Generics business now focused on high barrier to entry, high-value products & pipeline – PIV, FTF, FTM and market leaders
$100 $75 $50 $25 $0
$62
$54
$44
$33
$20
$12
$9
$8
$6
Source: FactSet. Note: Market data as of 5/15/15.
8
|
|
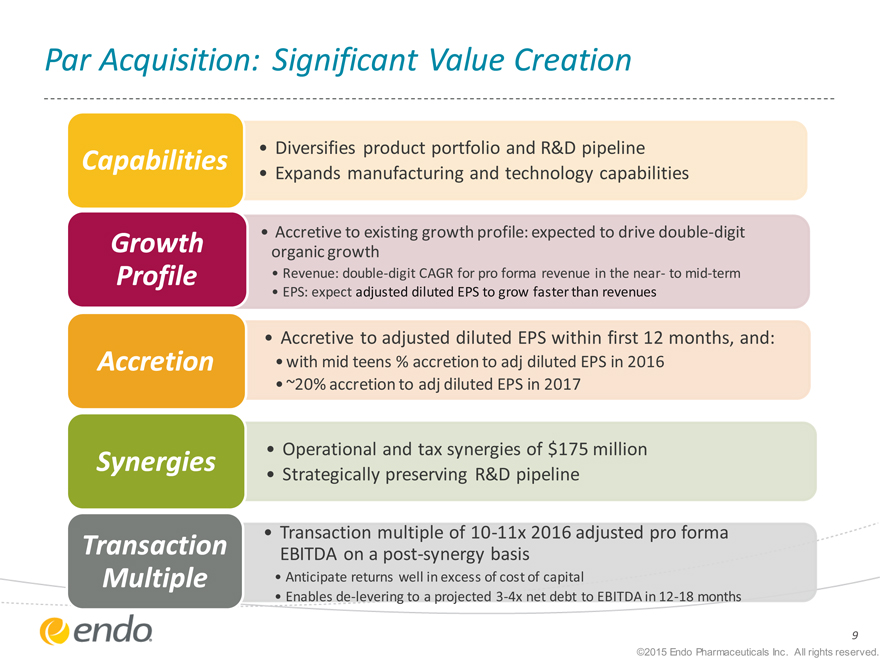
Par Acquisition: Significant Value Creation
Capabilities
Growth Profile
Accretion
Synergies
Transaction
Multiple
Diversifies product portfolio and R&D pipeline
Expands manufacturing and technology capabilities
Accretive to existing growth profile: expected to drive double-digit organic growth
Revenue: double-digit CAGR for pro forma revenue in the near- to mid-term
EPS: expect adjusted diluted EPS to grow faster than revenues
Accretive to adjusted diluted EPS within first 12 months, and:
with mid teens % accretion to adj diluted EPS in 2016
~20% accretion to adj diluted EPS in 2017
Operational and tax synergies of $175 million
Strategically preserving R&D pipeline
Transaction multiple of 10-11x 2016 adjusted pro forma EBITDA on a post-synergy basis
Anticipate returns well in excess of cost of capital
Enables de-levering to a projected 3-4x net debt to EBITDA in 12-18 months
9
©2015 Endo Pharmaceuticals Inc. All rights reserved.
|
|
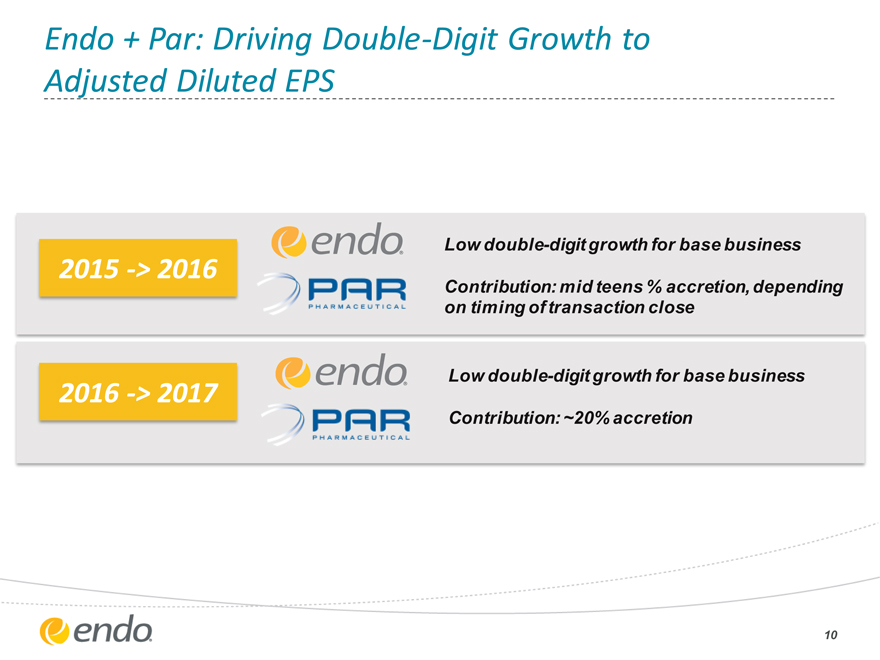
Endo + Par: Driving Double-Digit Growth to
Adjusted Diluted EPS
2015 -> 2016
2016 -> 2017
Low double-digit growth for base business
Contribution: mid teens % accretion, depending on timing of transaction close
Low double-digit growth for base business
Contribution: ~20% accretion
10
|
|
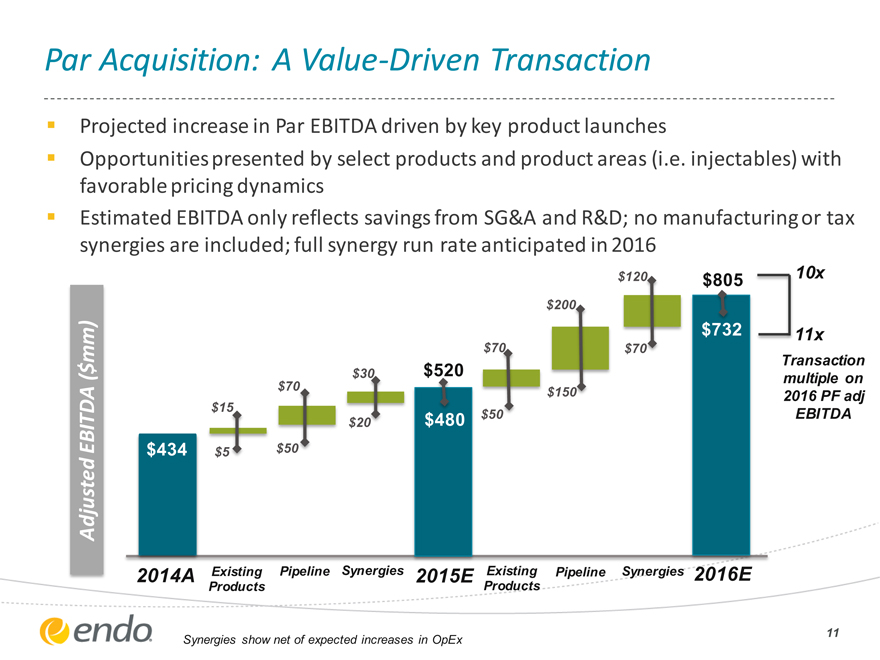
Par Acquisition: A Value-Driven Transaction
Projected increase in Par EBITDA driven by key product launches
Opportunities presented by select products and product areas (i.e. injectables) with favorable pricing dynamics
Estimated EBITDA only reflects savings from SG&A and R&D; no manufacturing or tax synergies are included; full synergy run rate anticipated in 2016
Adjusted EBITDA ($mm)
$434
$15
$5
$70
$50
$30
$20
$520
$480
$70
$50
$200
$150
$120
$70
$805
$732
10x
11x
Transaction multiple on 2016 PF adj EBITDA
2014A
Existing Products
Pipeline
Synergies
2015E
Existing Products
Pipeline
Synergies
2016E
Synergies show net of expected increases in OpEx
11
|
|
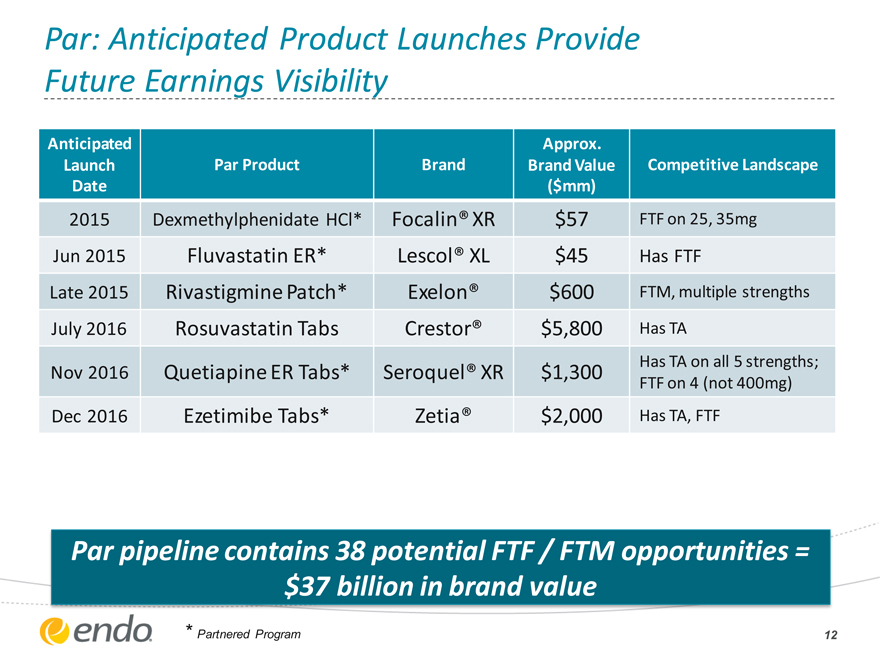
Par: Anticipated Product Launches Provide
Future Earnings Visibility
Anticipated Approx.
Launch Par Product Brand Brand Value Competitive Landscape
Date($mm)
2015 Dexmethylphenidate HCl* Focalin® XR $57 FTF on 25, 35mg
Jun 2015 Fluvastatin ER* Lescol® XL $45 Has FTF
Late 2015 Rivastigmine Patch* Exelon® $600 FTM, multiple strengths
July 2016 Rosuvastatin Tabs Crestor® $5,800 Has TA
Has TA on all 5 strengths;
Nov 2016 Quetiapine ER Tabs* Seroquel® XR $1,300 FTF on 4 (not 400mg)
Dec 2016 Ezetimibe Tabs* Zetia® $2,000 Has TA, FTF
Par pipeline contains 38 potential FTF / FTM opportunities = $37 billion in brand value
* Partnered Program
12
|
|
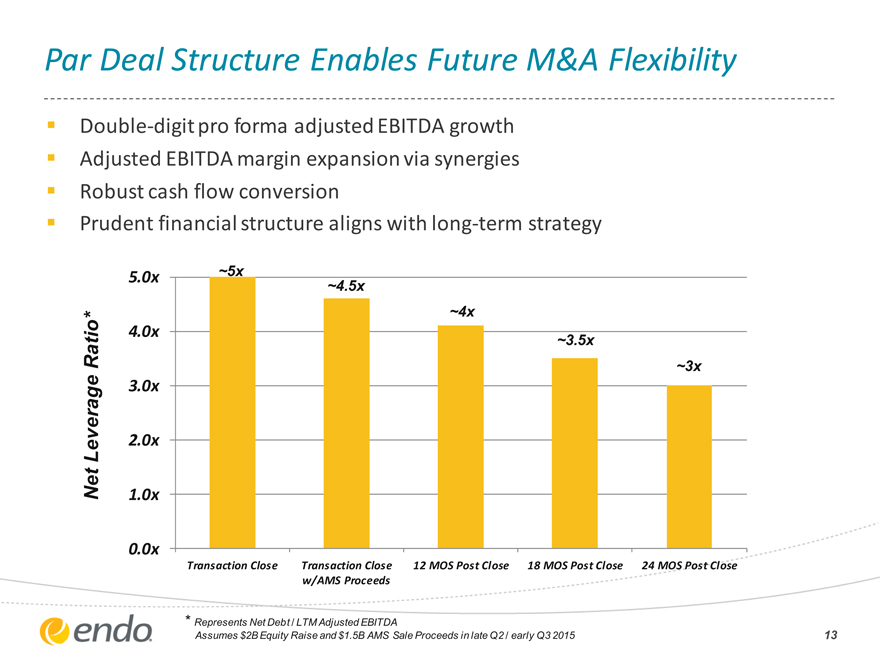
Par Deal Structure Enables Future M&A Flexibility
Double-digit pro forma adjusted EBITDA growth
Adjusted EBITDA margin expansion via synergies
Robust cash flow conversion
Prudent financial structure aligns with long-term strategy
Net Leverage Ratio*
5.0x 4.0x 3.0x 2.0x 1.0x 0.0x
~5x
~4.5x
~4x
~3.5x
~3x
Transaction Close Transaction Close 12 MOS Post Close 18 MOS Post Close 24 MOS Post Close
w/AMS Proceeds
* Represents Net Debt / LTM Adjusted EBITDA
Assumes $2B Equity Raise and $1.5B AMS Sale Proceeds in late Q2 / early Q3 2015
13
|
|
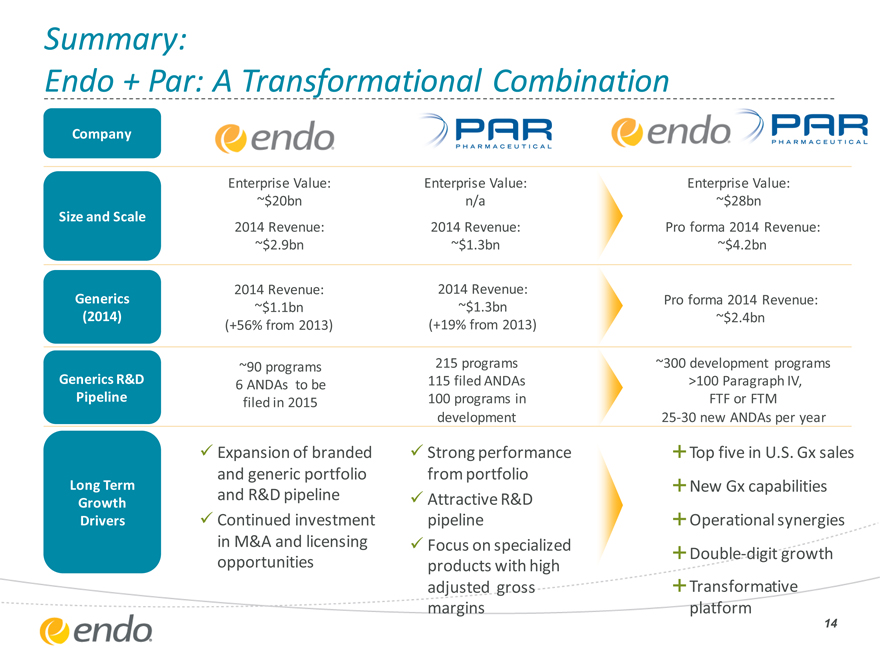
Summary:
Endo + Par: A Transformational Combination
Company
Size and Scale
Generics (2014)
Generics R&D Pipeline
Long Term Growth Drivers
Enterprise Value:
~$20bn
2014 Revenue:
~$2.9bn
2014 Revenue:
~$1.1bn (+56% from 2013)
~90 programs
6 ANDAs to be filed in 2015
Expansion of branded and generic portfolio and R&D pipeline Continued investment in M&A and licensing opportunities
Enterprise Value: n/a
2014 Revenue:
~$1.3bn
2014 Revenue:
~$1.3bn (+19% from 2013)
215 programs 115 filed ANDAs 100 programs in development
Strong performance from portfolio Attractive R&D pipeline Focus on specialized products with high adjusted gross margins
Enterprise Value:
~$28bn
Pro forma 2014 Revenue:
~$4.2bn
Pro forma 2014 Revenue:
~$2.4bn
~300 development programs >100 Paragraph IV, FTF or FTM 25-30 new ANDAs per year
Top five in U.S. Gx sales New Gx capabilities Operational synergies Double-digit growth
Transformative platform
14
Appendix
©2015 Endo Pharmaceuticals Inc. All rights reserved.
|
|
Appendix
©2015 Endo Pharmaceuticals Inc. All rights reserved.
|
|
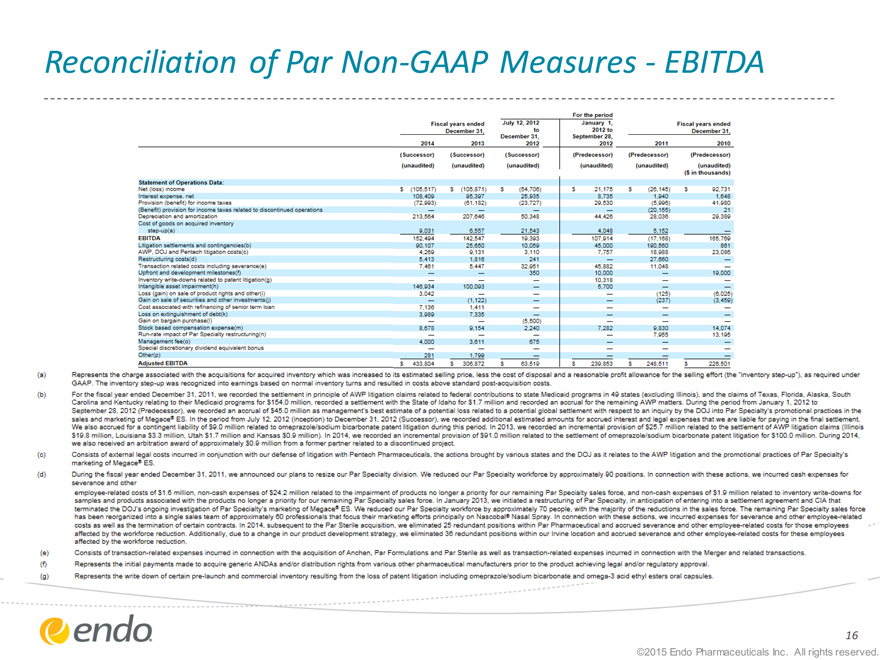
Reconciliation of Par Non-GAAP Measures—EBITDA
Fiscal years ended July 12. 2012 January 1, Fiscal years ended
December 31, to 2012 to December 31.
2014 2013 December 31, 2012 September 28, 2012 2011 2010
(Successor) (Successor) (Successor) (Predecessor) (Predecessor) (Predecessor)
(unaudited) (unaudited) (unaudited) (unaudited) (unaudited) (unaudited)
($ in thousands)
Statement of Operations Data
Net (loss) income S (105.517) S (105.871) $ (54.706) S 21.175 $ (26.145) $ 92.731
Interest expense, net 108.409 95.397 25.935 8,735 1.940 1.648
Provision (benefit) for income taxes (72.093) (61.182) (23.727) 29.530 (5.996) 41.980
(Benefit) provision for income taxes related to discontinued operations — — — — (20.155) 21
Depreciation and amortization 213.564 207.646 50.348 44.426 28.036 29.389
Cost of goods on acquired inventory step-up(a) 9.031 6.557 21.543 4.048 5,152
EBITDA 152.494 142.547 19.393 107.914 (17.168) 165.769
Litigation settlements and contingencies(b) 90.107 25.650 •: 45.000 190.560 861
AWP. DOJ and Pentech litigation costs(c) 4.269 9.131 3.110 7.757 18.988 23.036
Restructuring costs(d) 5.413 1,816 241 — 27.660 —
Transaction related costs including severance(e) 7.461 5.447 32.951 45.882 11.048 —
Upfront and development milestones(f) — — 350 10.000 — 19.000
Inventory write-downs related to patent litigation(g) — — — 10.318 — —
Intangible asset impairment(h) 146.934 100,093 — 5.700 — —
Loss (gain) on sale of product rights and other(i) 3.042 — — — (125} (6,025)
Gain on sale of securities and other investments(j) — (1.122) — — (237} (3.459)
Cost associated with refinancing of senior term loan 7.136 1,411 — — — —
Loss on extinguishment of debt(fc) 3.989 7,335 — — — —
Gain on bargain purchase^) — — (5.500) — — —
Stock based compensation expense(m) 8.678 9,154 2.240 7,282 9.830 14.074
Run-rate impact of Par Speoalty restructuring(n) — — — — 7.955 13.195
Management fee(o) 4.000 3,611 5~5
Special discretionary dividend equivalent bonus — — — — — —
Other(p) 281 1,799 — — — —
Adjusted EBITDA S 433.804 S 306,872 $ 63.519 S 239.853 S 248.511 $ 226.501
(a) Represents the charge associated with the acquisitions for acquired inventory which was increased to its estimated selling price, less the cost of disposal and a reasonable profit allowance for the selling effort (the “inventory step-up*), as required under GAAP. The inventory step-up was recognized into earnings based on normal inventory turns and resulted in costs above standard post-acquisition costs.
(b) For the fiscal year ended December 31. 2011, we recorded the settlement in principle of AWP litigation claims related to federal contributions to state Medicaid programs in 49 states (excluding Illinois), and the claims of Texas, Florida, Alaska, South Carolina and Kentucky relating to their Medicaid programs for $154.0 million, recorded a settlement with the State of Idaho for 31.7 million and recorded an accrual for the remaining AWP matters. During the period from January 1,2012 to September 28, 2012 (Predecessor we recorded an accrual of $45.0 million as management’s best estimate of a potential loss related to a potential global settlement with respect to an inquiry by the DQJ into Par Specialty’s promotional practices in the sales and marketing of Megace3 ES. In the period from July 12, 2012 (inception) to December 31, 2012 (Successor), we recorded additional estimated amounts for accrued interest and legal expenses that we are liable for paying in the final settlement. We also accrued for a contingent liability of $0.0 million related to omeprazole’sodium bicarbonate patent litigation during this period. In 2013, we recorded an incremental provision of 525.7 million related to the settlement of AWP litigation claims (Illinois §19.8 million, Louisiara S3.3 million, Utah $11.7 million and Kansas $0.9 million). In 201 4, we recorded an incremental provision of &91.0 million related to the settlement of omeprazole/sodium bicarbonate patent litigation for S100.0 million. During 2014, we also received an arbitration award of approximately $0.9 million from a former partner related to a discontinued project.
(c) Consists of external leg al costs incurred in conjunction with our defense of litigation with Pentech Pharmaceuticals, the actions brought by various states and tine DDJ as it relates to the AWP litigation and the promotional practices of Par Specialty’s marketing of Megace® ES.
(d) During the fiscal year ended December 31, 2011, we announced our plans to resize our Par Specialty division. We reduced our Par Specialty workforce by approximately 90 positions. In connection with these actions, we incurred Gash expenses for severance and other
employee-related costs of $1.8 million, non-cash expenses of $24.2 million related to the impairment of products no longer a priority for our remaining Par Specialty sales force, and non-cash expenses of $1.9 million related to inventory write-downs for samples and products associated with the products no longer a priority for our remaining Par Specialty sales force. In January 2013, we initiated a restructuring of Par Specialty, in anticipation of entering into a settlement agreement and CIA that terminated the DOJ’s ongoing investigation of Par Specialty’s marketing of Megace® ES. We reduced our Par Specialty workforce by approximately 70 people, with the majority of the reductions in the sales force. The remaining Par Specialty sales force has been reorganized into a single sales team of approximately SO professionals that focus their marketing efforts principally on Nascobal* Nasal Spray. In connection with these actions, we incurred expenses for severance and other employee-related costs as well as the termination of certain contracts. In 2014, subsequent to the Par Sterile acquisition, we eliminated 25 redundant positions within Par Pharmaceutical and accrued severance and other employee-related costs for those employees affected by the workforce reduction. Additionally, due to a change in our product development strategy, we eliminated 36 redundant positions within our Irvine location and accrued severance and other employee-related costs for these employees affected by the workforce reduction.
(e) Consists of transaction- related expenses incurred in connection with the acquisition of Anchen, Par Formulations and Par Sterile as well as transaction-related expenses incurred in connection with tine Merger and related transactions.
(f) Represents the initial payments made to acquire generic ANDAs and/or distribution rights from various other pharmaceutical manufacturers prior to tine product achieving legal and/or regulator/ approval.
(g) Represents the write down of certain pre-launch and commercial inventory resulting from the loss of patent litigation including omeprazole/sodium bicarbonate and omega-3 acid ethyl esters oral capsules.
©2015 Endo Pharmaceuticals Inc. All rights reserved.
16
|
|
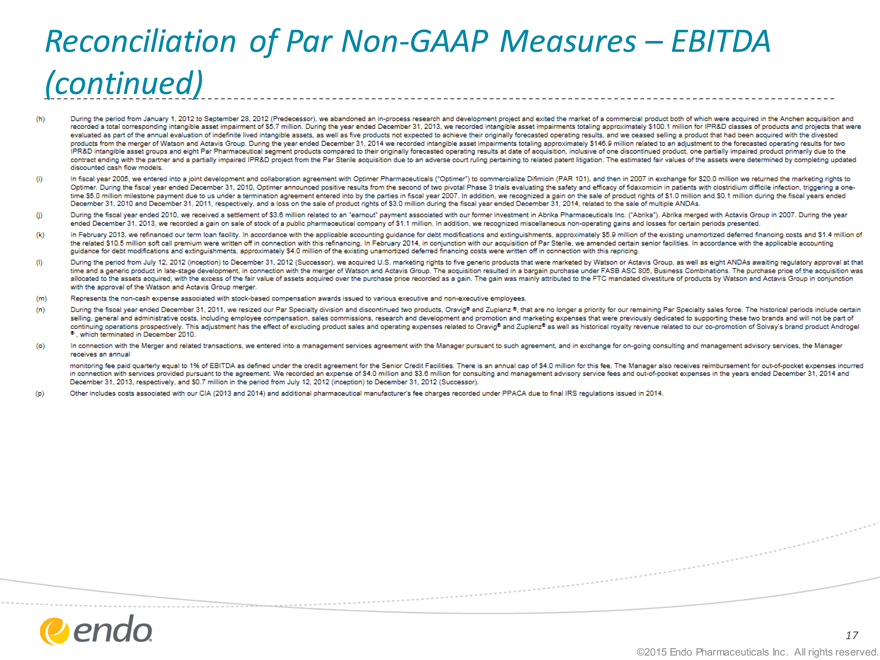
Reconciliation of Par Non-GAAP Measures—EBITDA (continued)
(h) During the period from January 1, 2012 to September 28, 2012 (Predecessor), we abandoned an in-process research and development project and exited the market of a commercial product both of which were acquired in the Anchen acquisition and recorded a total corresponding intangible asset impairment of $5.7 million. During the year ended December 31, 2013, we recorded intangible asset impairments totaling approximately $100.1 million for IPR&D classes of products and projects that were evaluated as part of the annual evaluation of indefinite lived intangible assets, as well as five products not expected to achieve their originally forecasted operating results, and we ceased selling a product that had been acquired with the divested Products from the merger of Watson and Actavis Group. During the year ended December 31, 2014 we recorded intangible asset impairments totaling approximately $146.9 million related to an adjustment to the forecasted operating results for two IPR&D intangible asset groups and eight Par Pharmaceutical segment products compared to their originally forecasted operating results at date of acquisition, inclusive of one discontinued product, one partially impaired product primarily due to the contract ending with the partner and a partially impaired IPR&D project from the Par Sterile acquisition due to an adverse court ruling pertaining to related patent litigation. The estimated fair values of the assets were determined by completing updated discounted cash flow models.
(i) In fiscal year 2005, we entered into a joint development and collaboration agreement with Optimer Pharmaceuticals (‘Optimer’) to commercialize Difimicin (PAR 101), and then in 2007 in exchange for 520.3 million we returned the marketing rights to Optimer. During the fiscal year ended December 31. 2010. Optimer announced positive results from the second of two pivotal Phase 3 trials evaluating the safety and efficacy of fidaxomicin in patients worth Clostridium difficult infection, triggering a onetime S5.0 million milestone payment due to us under a termination agreement entered into by the parties in fiscal year 2007. In addition, we recognized a gain on the sale of product rights of $1.0 million and SO. 1 million during the fiscal years ended December 31. 2010 and December 31, 2011, respectively and a loss on the sale of product rights of 53.0 million during the fiscal year ended December 31. 2014 related to the sale of multiple ANDAs
(j) During the fiscal year ended 2010, we received a settlement of $3.0 million related to an “earnout* payment associated with our former investment in Abrika Pharmaceuticals Inc. (‘Abrika*). Abrika merged worth Actavis Group in 2007. During the year ended December 31. 2013, we recorded a gain on sale of stock of a public pharmaceutical company of 51.1 million. In addition, we recognized miscellaneous non-operating gains and losses for certain periods presented.
(k) In February 2013, we refinanced our term loan facility. In accordance worth the applicable accounting guidance for debt modifications and extinguishments, approximately 55.0 million of the existing unamortized deferred financing costs and S1.4 million of the related $10.5 million soft call premium were written off in connection with this refinancing. In February 2014, in conjunction with our acquisition of Par Sterile, we amended certain senior facilities In accordance with the applicable accounting guidance for debt modifications and extinguishments, approximately 54.0 million of the existing unamortized deferred financing costs were written off in connection with this repricing.
(I) During the period from July 12, 2012 (inception) to December 31. 2012 (Successor), we acquired U.S. marketing rights to five generic products that were marketed by Watson or Actavis Group, as well as eight ANDAs awaiting regulatory approval at that time and a generic product in late-stage development, in connect on with the merger of Watson and Actavis Group. The acquisition resulted in a bargain purchase under FAS6 ASC 805, Business Combinations. The purchase price of the acquisition was allocated to the assets acquired, with the excess of the fair value of assets acquired over the purchase price recorded as a gain. The gain was mainly attributed to the FTC mandated divestiture of products by Watson and Actavis Group in conjunction worth the approval of the Watson and Actavis Group merger
(m) Represents the non-cash expense associated with stock-based compensation awards issued to various executive and non-executive employees.
(n) During the fiscal year ended December 31. 2011, we resized our Par Specialty division and discontinued two products. Oravig® and Zuplenz ®. that are no longer a priority for our remaining Par Specialty sales force. The historical periods include certain selling, general and administrative costs, including employee compensation, sales commissions, research and development and promotion and marketing expenses that were previously dedicated to supporting these two brands and will not be part of continuing operations prospectively. This adjustment has the effect of excluding product sales and operating expenses related to Oravig* and Zuplenz* as well as historical royalty revenue related to our co-promotion of Solvay’s brand product Androgel *, which terminated m December 2010.
(o) In connection with the Merger and related transactions, we entered into a management services agreement with the Manager pursuant to such agreement, and in exchange for on-going consulting and management advisory services, the Manager receives an annual monitoring fee paid quarterly equal to 1% of EBITDA as defined under the credit agreement for the Senior Credit Facilities There is an annual cap of 54.0 million for this fee. The Manager also receives reimbursement for out-of-pocket expenses incurred in connection with services provided pursuant to the agreement. We recorded an expense of S4.0 million and S3.0 million for consulting and management advisory service fees and out-of-pocket expenses in the years ended December 31. 2014 and December 31. 2013, respectively, and 50.7 million in the period from July 12, 2012 (inception) to December 31, 2012 (Successor).
(p) Other includes costs associated with our CIA (2013 and 2014) and additional pharmaceutical manufacturer’s fee charges recorded under PPACA due to final IRS regulations issued m 2014.
17
|
|
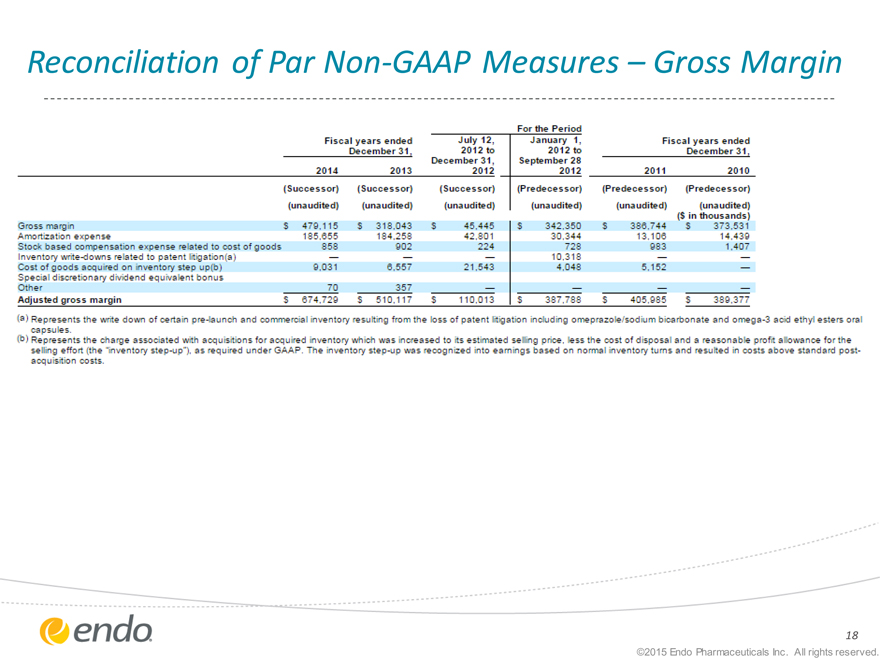
Reconciliation of Par Non-GAAP Measures—Gross Margin
For the Period
Fiscal years ended December,
July 12, 2012 to
January 1, 2012 to
Fiscal years ended December 31,
2014
2013
December 31, 2012
September 28 2012
2011
2010
[Successor)
(Successor)
{Successor)
(Predecessor)
(Predecessor)
(Predecessor)
{unaudited)
(unaudited)
(unaudited)
(unaudited)
(unaudited)
(unaudited) (5 in thousands)
Gross margin
$ 470,115
$ 318,043
$ 45,445
$342,353
$366,744
$ 373,531
Amortization expense
185.655
184.253
42.831
30,344
13.106
14,430
Stock based compensation expense related to cost of goods S53
332
224
728
333
1,407
Inventory write-downs related to patent litigation (a)
—
—
—
10,318
—
—
Cost of goods acquired on inventory step up (b)
3,031
6,557
21.543
4.048
5.152
—
Special discretionary dividend equivalent bonus
Other
73
357
—
—
—
—
Adjusted gross margin
$674,720
$ 513,117
$110,013
$367,736
$435.335
$333,377
(a) Represents the write down of certain pre-launch and commercial inventory resulting from the toss-of patent litigation including omeprazole/sod bicarbonate and omega-3 acid ethyl esters oraI cappsules.
(b) Represents the charge associated with acquisitions for acquired inventory which was increased to its estimated selling price, less the cost of disposal and a reasonable profit allowance for the selling effort (the ‘inventory step-up”), as required jnder GAAP. The inventory step-up was recognized into earnings based on normal inventory turns and resulted in costs above standard post-acquisition costs.
18
|
|

Endo International plc
UBS Healthcare Conference
May 20, 2015
©2015 Endo Pharmaceuticals Inc. All rights reserved.