Attached files
| file | filename |
|---|---|
| 8-K - 8-K - Century Communities, Inc. | ccs-20150520x8k.htm |
Forward-Looking StatementsCertainstatementsinthisInvestorPresentationmayberegardedas"forward-lookingstatements"withinthemeaningofthePrivateSecuritiesLitigationReformActof1995,asamended.Certainforward-lookingstatementsdiscusstheCompany’splans,strategiesandintentions,andmaybeidentifiedbyreferencetoafutureperiodorperiodsorbytheuseofforward-lookingterminology,suchas“expects,”“may,”“will,”“believes,”“should,”“would,”“could,”“approximately,”“anticipates,”“estimates,”“targets,”“intends,”“likely,”“projects,”“positioned,”“strategy,”“future,”and“plans.”Inaddition,thesewordsmayusethepositiveornegativeorothervariationsofthoseterms.Allstatementsotherthanstatementsofhistoricalfactare“forward–lookingstatements”forpurposesoffederalandstatesecuritieslaws.Thereisnoguaranteethatanyoftheeventsanticipatedbytheseforward-lookingstatementswilloccur.Thesestatementsinvolveknownandunknownrisks,uncertaintiesandotherfactorsthatmaycauseouractualresults,levelsofactivity,performanceorachievementstodifferfromthoseexpressedorimpliedbytheforward-lookingstatement.Theseforward-lookingstatementsarebasedonvariousassumptionsandthecurrentexpectationsofthemanagementoftheCompany,andmaynotbeaccuratebecauseofrisksanduncertaintiessurroundingtheseassumptionsandexpectations.Certainfactorsmaycauseactualresultstodiffersignificantlyfromtheseforward-lookingstatements.Ifanyoftheeventsoccur,thereisnoguaranteewhateffecttheywillhaveontheoperationsorfinancialconditionoftheCompany.Majorrisks,uncertaintiesandassumptionsinclude,butarenotlimitedto,risksrelatingto:theCompany’scapitalandfinancingneedsandavailability;anyunforeseenchangestooreffectsonliabilities,futurecapitalexpenditures,revenues,expenses,earnings,synergies,indebtedness,financialcondition,lossesandfutureprospects;theCompany’sabilitytointegrateandoperateassetssuccessfullyaftertheclosingofanacquisition;theeffectofgeneraleconomicconditions,includingemploymentrates,housingstarts,interestratelevels,availabilityoffinancingforhomemortgages,andthestrengthoftheU.S.dollar;andotherfactors.However,itisnotpossibletopredictoridentifyallsuchfactors.Inaddition,theCompanyhasdisclosedundertheheading“RiskFactors”initsAnnualReportonForm10-KforthefiscalyearendedDecember31,2014(the“AnnualReport”),filedwiththeU.S.SecuritiesandExchangeCommissiononMarch6,2015,theriskfactorswhichmateriallyaffectitsbusiness,financialconditionandoperatingresults.InvestorsareencouragedtoreviewtheAnnualReportforadditionalinformationregardingtherisksanduncertaintiesthatmaycauseactualresultstodiffermateriallyfromthoseexpressedinanyforward-lookingstatement.Forward-lookingstatementsincludedhereinaremadeasofthedatehereof,andtheCompanyundertakesnoobligationtopubliclyupdateorreviseanyforward-lookingstatementtoreflectfutureevents,developmentsorotherwise,exceptasmayberequiredbyapplicablelaw.2
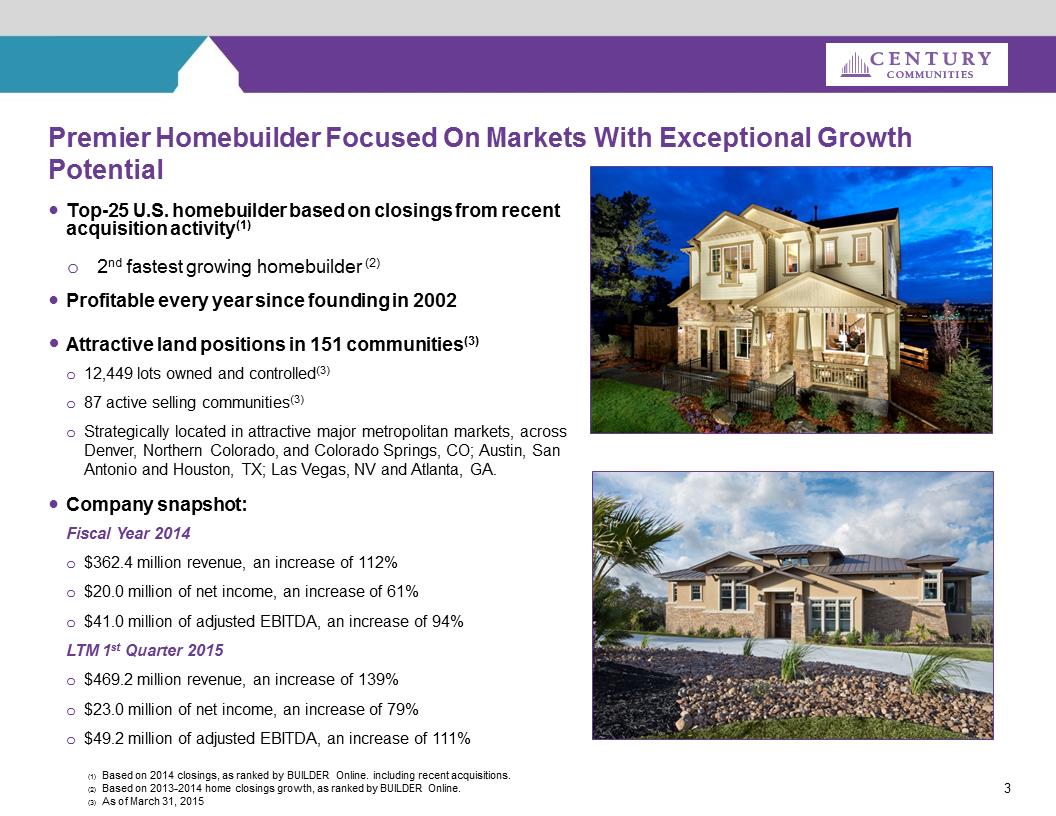
Premier Homebuilder Focused On Markets With Exceptional Growth Potential(1)Based on 2014 closings, as ranked by BUILDER Online. including recent acquisitions.(2)Based on 2013-2014 home closings growth, as ranked by BUILDER Online.(3)As of March 31, 20153.Top-25 U.S. homebuilderbased on closings from recent acquisition activity(1)o2ndfastest growing homebuilder (2).Profitable every year since founding in 2002.Attractive land positions in 151 communities(3)o12,449 lots owned and controlled(3)o87 active selling communities(3)oStrategically located in attractive major metropolitan markets, across Denver, Northern Colorado, and Colorado Springs, CO; Austin, San Antonio and Houston, TX; Las Vegas, NV and Atlanta, GA..Company snapshot:Fiscal Year 2014o$362.4 million revenue, an increase of 112%o$20.0 million of net income, an increase of 61%o$41.0 million of adjusted EBITDA, an increase of 94%LTM 1stQuarter 2015o$469.2 million revenue, an increase of 139%o$23.0 million of net income, an increase of 79%o$49.2 million of adjusted EBITDA, an increase of 111%S:\SALES & MARKETING (NEW)\MARKETING\PHOTOS\1 CORPORATE PHOTO LIBRARY\COLORADO\Exteriors\CO_SF_Tallyns Reach Bellmar Exterior.jpgS:\SALES & MARKETING (NEW)\MARKETING\PHOTOS\1 CORPORATE PHOTO LIBRARY\TEXAS\Canyons\130226-canyons_002_web.jpg
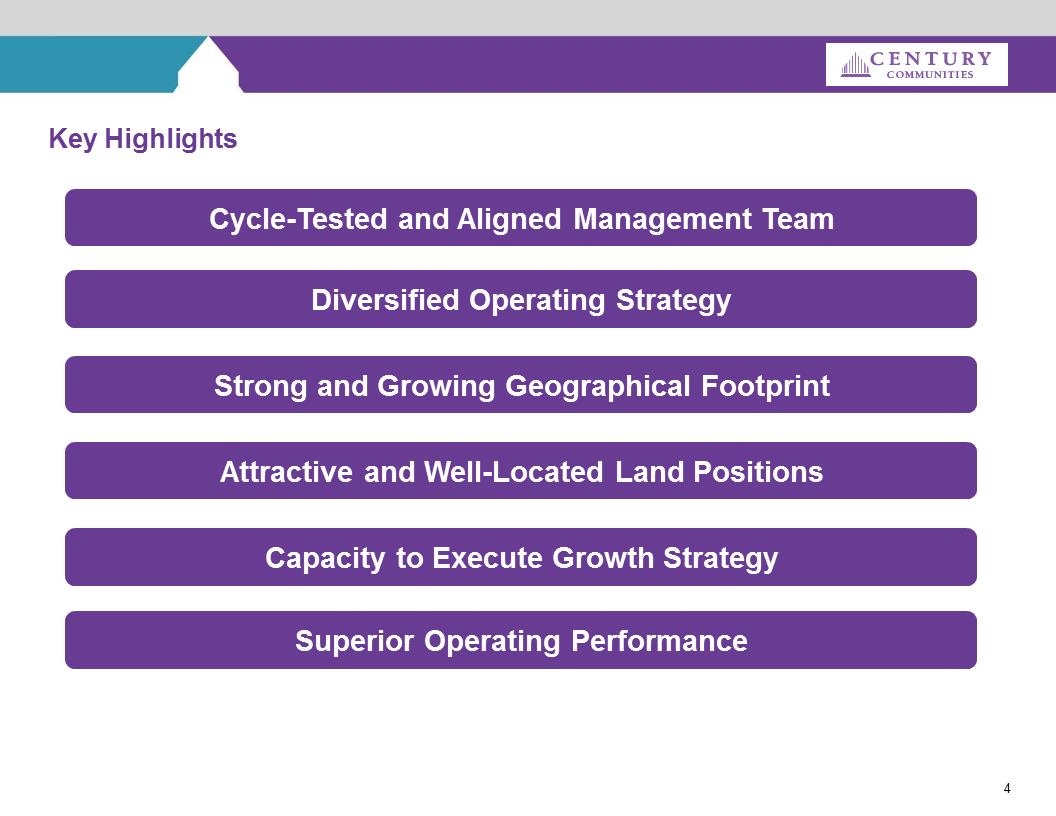
Key HighlightsCycle-Tested and Aligned Management TeamStrong and Growing Geographical FootprintSuperior Operating PerformanceAttractive and Well-Located Land PositionsDiversified Operating Strategy
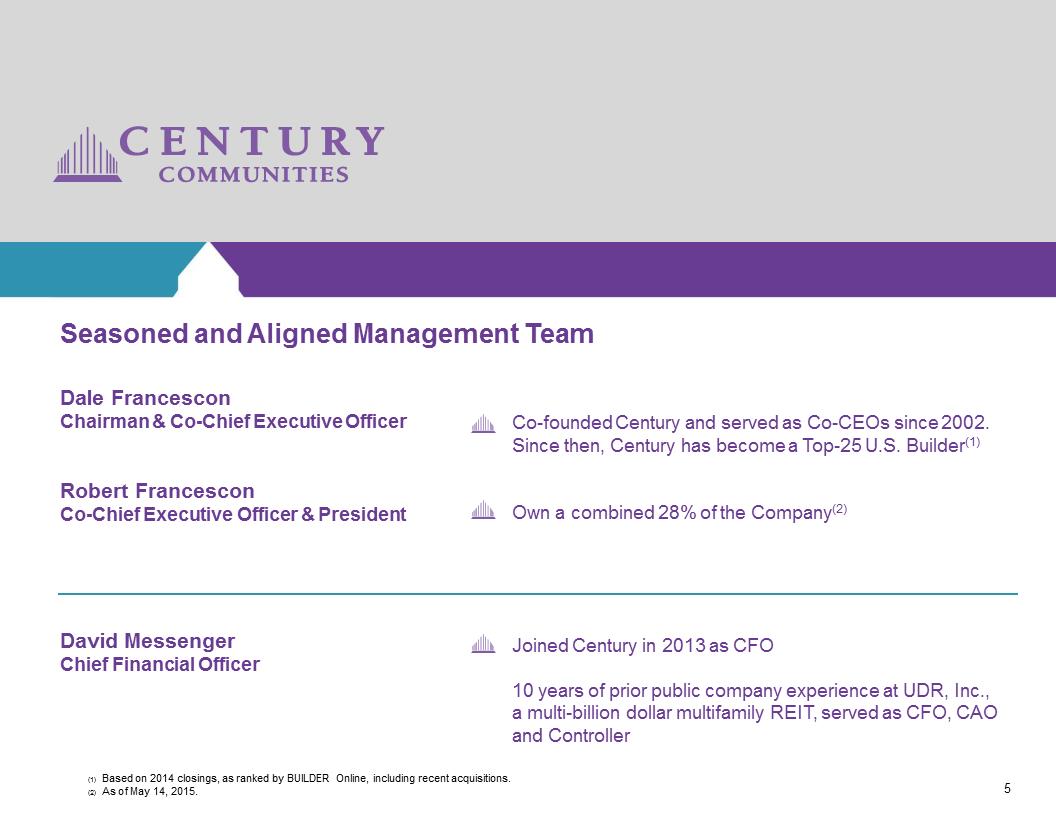
Seasoned and Aligned Management TeamDale FrancesconChairman & Co-Chief Executive OfficerRobert FrancesconCo-Chief Executive Officer & PresidentDavid MessengerChief Financial OfficerCo-founded Century and served as Co-CEOs since 2002. Since then, Century has become a Top-25 U.S. Builder(1)Own a combined 28% of the Company(2)Joined Century in 2013 as CFO10 years of prior public company experience at UDR, Inc., a multi-billion dollar multifamily REIT, served as CFO, CAO and ControllerCentury Communit.emfCentury Communit.emfCentury Communit.emf(1)Based on 2014 closings, as ranked by BUILDER Online, including recent acquisitions.(2)As of May 14, 2015.5Century Communities.emf
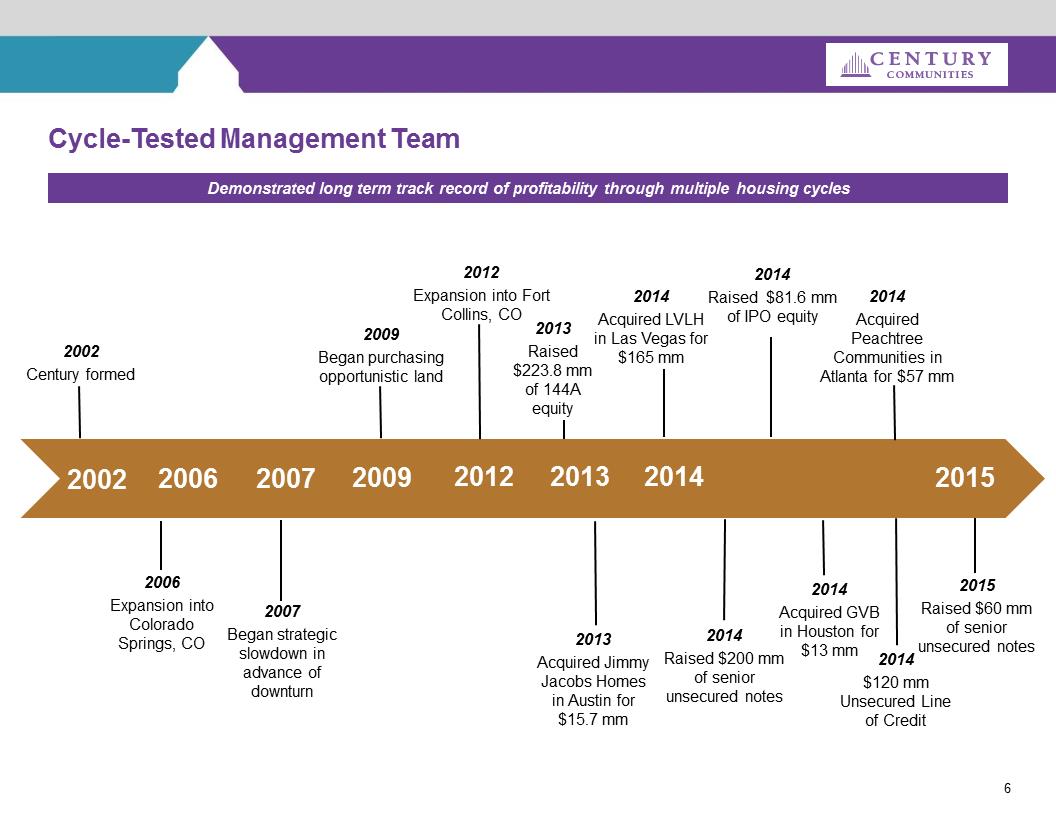
Cycle-Tested Management Team6200620122002Century formed20022009 Began purchasing opportunistic land20132014Acquired LVLH in Las Vegas for $165 mm2013Acquired Jimmy Jacobs Homes in Austin for $15.7 mm20142013Raised $223.8 mm of 144A equity2014Raised $200 mm of senior unsecured notes20072007Began strategic slowdown in advance of downturn2012Expansion into Fort Collins, CO2006Expansion into Colorado Springs, CO20092014Raised $81.6 mm of IPO equity2014Acquired GVB in Houston for $13 mm2014Acquired Peachtree Communities in Atlanta for $57 mm2014$120 mm Unsecured Line of Credit20152015Raised $60 mm of senior unsecured notes
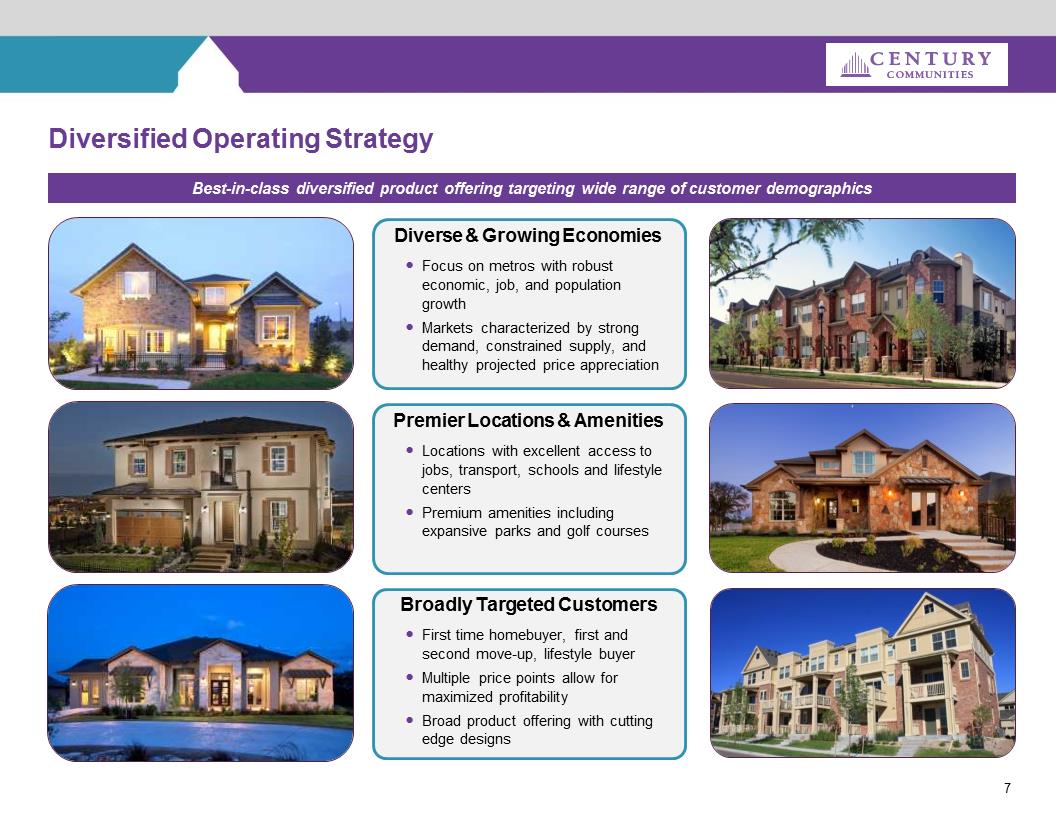
7Diversified Operating StrategyBest-in-class diversified product offering targeting wide range of customer demographicsCaballo1_22SM.jpgCO_ATT_ Genova_Brownstone at RidgeGate.jpgCO _ ATT_ Belevediere Backyard Row Home Ext.jpgDiverse & Growing Economies.Focus on metros with robust economic, job, and population growth.Markets characterized by strong demand, constrained supply, and healthy projected price appreciationBroadly Targeted Customers.First time homebuyer, first and second move-up, lifestyle buyer.Multiple price points allow for maximized profitability.Broad product offering with cutting edge designsPremier Locations & Amenities.Locations with excellent access to jobs, transport, schools and lifestyle centers.Premium amenities including expansive parks and golf courseshttp://centurycommunities.com/assets/communities/slideshow/country-club-highlands/small/country-club-highlands-aberdeen-model-exterior.jpghttp://centurycommunities.com/assets/communities/slideshow/montecito-at-ridgegate/small/montecito-at-ridgegate-residence7945-exterior.jpg http://centurycommunities.com/assets/communities/slideshow/crystal-falls/small/crystal-falls-model-home.jpg
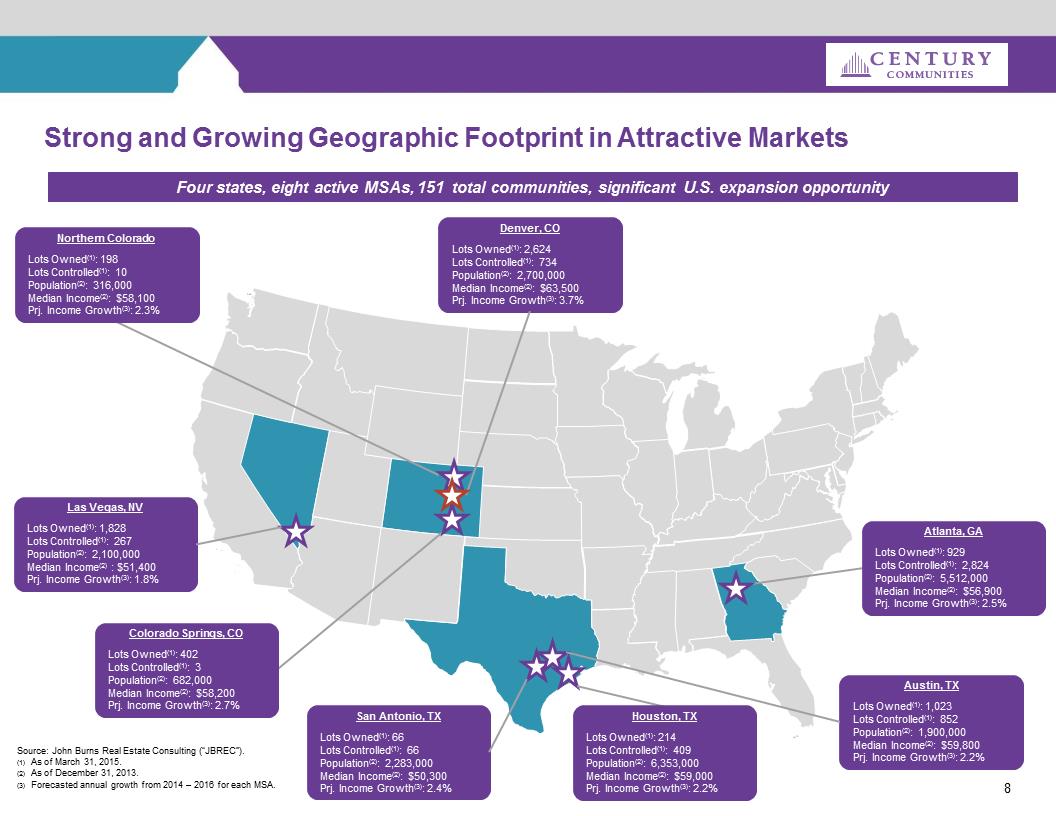
8Strong and Growing Geographic Footprint in Attractive MarketsLas Vegas, NVLots Owned(1): 1,828Lots Controlled(1): 267Population(2): 2,100,000Median Income(2) : $51,400Prj. Income Growth(3): 1.8%Denver, COLots Owned(1): 2,624Lots Controlled(1): 734Population(2): 2,700,000Median Income(2): $63,500Prj. Income Growth(3): 3.7%Colorado Springs, COLots Owned(1): 402Lots Controlled(1): 3Population(2): 682,000Median Income(2): $58,200Prj. Income Growth(3): 2.7%Northern Colorado Lots Owned(1): 198Lots Controlled(1): 10Population(2): 316,000Median Income(2): $58,100Prj. Income Growth(3): 2.3%Austin, TXLots Owned(1): 1,023Lots Controlled(1): 852Population(2): 1,900,000Median Income(2): $59,800Prj. Income Growth(3): 2.2%San Antonio, TX Lots Owned(1): 66Lots Controlled(1): 66Population(2): 2,283,000Median Income(2): $50,300Prj. Income Growth(3): 2.4%Houston, TXLots Owned(1): 214Lots Controlled(1): 409Population(2): 6,353,000Median Income(2): $59,000Prj. Income Growth(3): 2.2%Atlanta, GALots Owned(1): 929Lots Controlled(1): 2,824Population(2): 5,512,000Median Income(2): $56,900Prj. Income Growth(3): 2.5%Source: John Burns Real Estate Consulting (“JBREC”).(1)As of March 31, 2015.(2)As of December 31, 2013.(3)Forecasted annual growth from 2014 –2016 for each MSA.Four states, eight active MSAs, 151 total communities, significant U.S. expansion opportunity
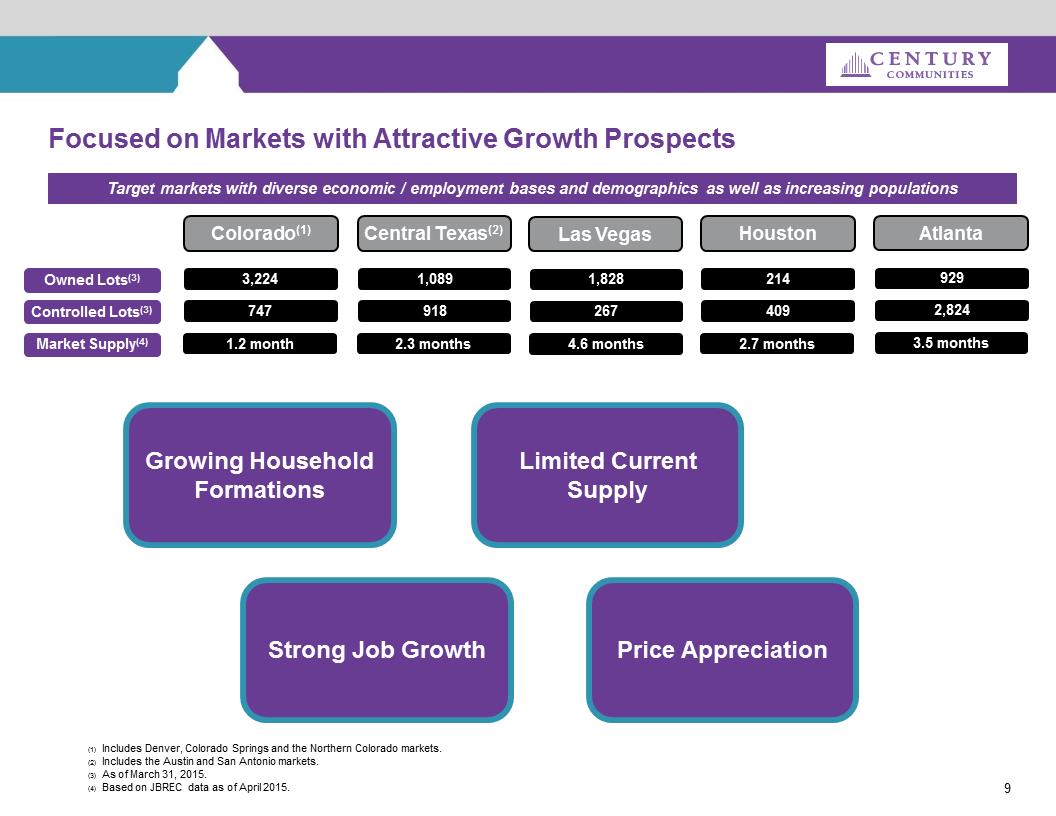
9Focused on Markets with Attractive Growth ProspectsTarget markets with diverse economic / employment bases and demographics as well as increasing populationsColorado(1)Central Texas(2)HoustonGrowing Household Formations(1)Includes Denver, Colorado Springs and the Northern Colorado markets.(2)Includes the Austin and San Antonio markets.(3)As of March 31, 2015.(4)Based on JBREC data as of April 2015.Las VegasOwned Lots(3)Controlled Lots(3)3,2247471,0899182144091,8282671.2 month2.3 months2.7 months4.6 monthsMarket Supply(4)Strong Job Growth Limited Current SupplyPrice AppreciationAtlanta9292,8243.5 months
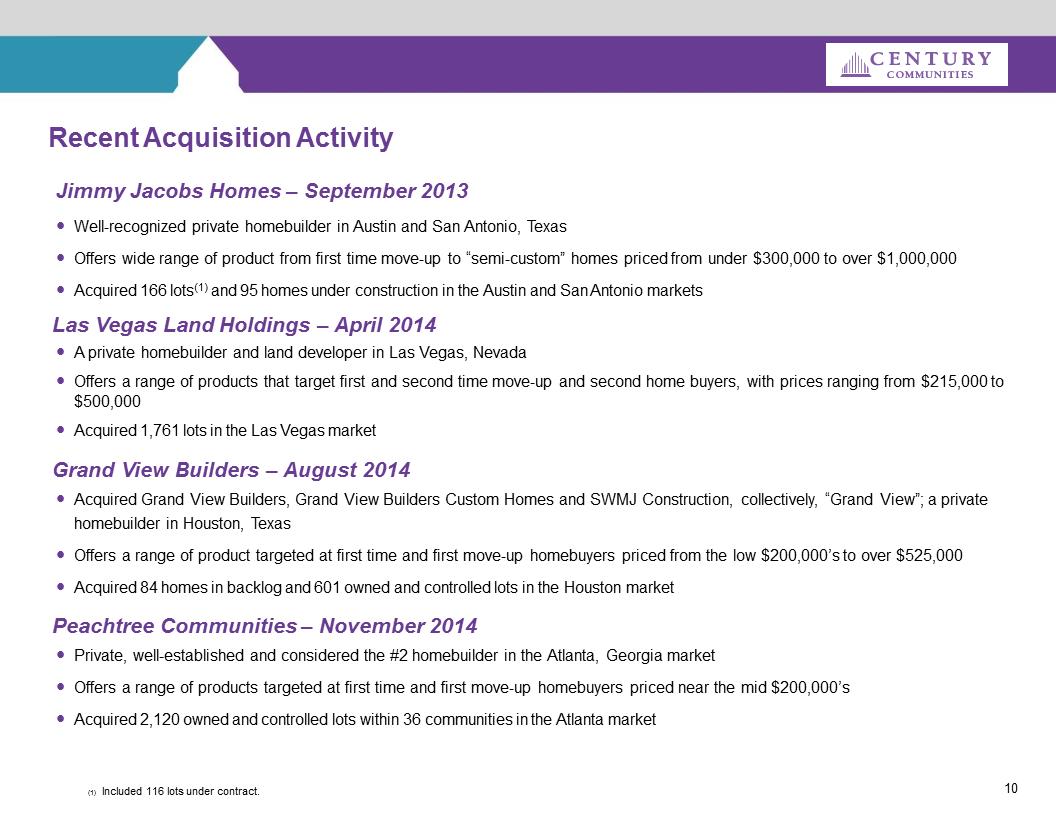
Recent Acquisition Activity 10.Well-recognized private homebuilder in Austin and San Antonio, Texas.Offers wide range of product from first time move-up to “semi-custom” homes priced from under $300,000 to over $1,000,000.Acquired 166 lots(1)and 95 homes under construction in the Austin and San Antonio marketsJimmy Jacobs Homes –September 2013Las Vegas Land Holdings –April 2014.A private homebuilder and land developer in Las Vegas, Nevada.Offers a range of products that target first and second time move-up and second home buyers, with prices ranging from $215,000 to $500,000.Acquired 1,761 lots in the Las Vegas marketGrand View Builders –August 2014.Acquired Grand View Builders, Grand View Builders Custom Homes and SWMJ Construction, collectively, “Grand View”; a private homebuilder in Houston, Texas.Offers a range of product targeted at first time and first move-up homebuyers priced from the low $200,000’s to over $525,000.Acquired 84 homes in backlog and 601 owned and controlled lots in the Houston marketPeachtree Communities –November 2014.Private, well-established and considered the #2 homebuilder in the Atlanta, Georgia market.Offers a range of products targeted at first time and first move-up homebuyers priced near the mid $200,000’s.Acquired 2,120 owned and controlled lots within 36 communities in the Atlanta market(1)Included 116 lots under contract.
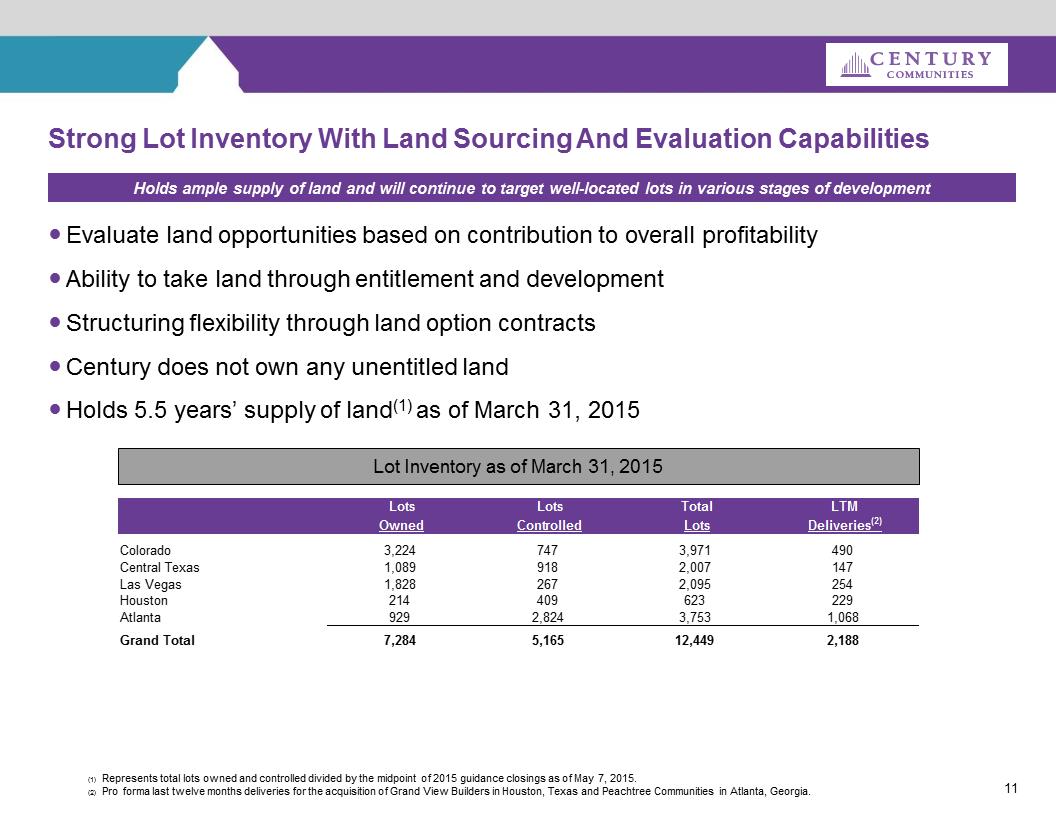
Strong Lot Inventory With Land Sourcing And Evaluation Capabilities.Evaluate land opportunities based on contribution to overall profitability.Ability to take land through entitlement and development.Structuring flexibility through land option contracts.Century does not own any unentitled land.Holds 5.5 years’ supply of land(1) as of March 31, 2015Holds ample supply of land and will continue to target well-located lots in various stages of development11Lot Inventory as of March 31, 2015(1)Represents total lots owned and controlled divided by the midpoint of 2015 guidance closings as of May 7, 2015.(2)Pro forma last twelve months deliveries for the acquisition of Grand View Builders in Houston, Texas and Peachtree Communities in Atlanta, Georgia.LotsLotsTotalLTMOwnedControlledLotsDeliveries(2)Colorado3,2247473,971490Central Texas1,0899182,007147Las Vegas1,8282672,095254Houston214409623229Atlanta9292,8243,7531,068Grand Total7,2845,16512,4492,188
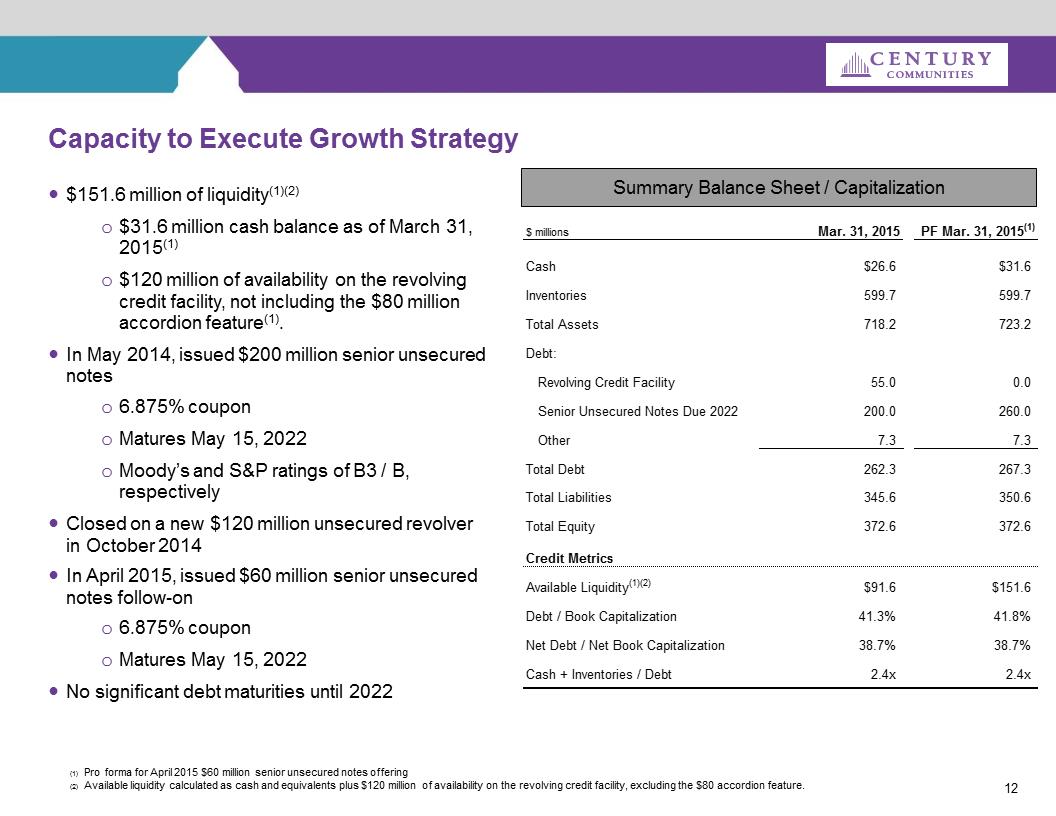
12Capacity to Execute Growth Strategy.$151.6 million of liquidity(1)(2)o$31.6 million cash balance as of March 31, 2015(1)o$120 million of availability on the revolving credit facility, not including the $80 million accordion feature(1)..In May 2014, issued $200 million senior unsecured noteso6.875% couponoMatures May 15, 2022oMoody’s and S&P ratings of B3 / B, respectively.Closed on a new $120 million unsecured revolver in October 2014.In April 2015, issued $60 million senior unsecured notes follow-on o6.875% couponoMatures May 15, 2022.No significant debt maturities until 2022Summary Balance Sheet / Capitalization (1)Pro forma for April 2015 $60 million senior unsecured notes offering(2)Available liquidity calculated as cash and equivalents plus $120 million of availability on the revolving credit facility, excluding the $80 accordion feature.$ millionsMar. 31, 2015PF Mar. 31, 2015(1)Cash$26.6$31.6Inventories599.7599.7Total Assets718.2723.2Debt:Revolving Credit Facility55.00.0Senior Unsecured Notes Due 2022200.0260.0Other7.37.3Total Debt262.3267.3Total Liabilities345.6350.6Total Equity372.6372.6Credit MetricsAvailable Liquidity(1)(2)$91.6$151.6Debt / Book Capitalization41.3%41.8%Net Debt / Net Book Capitalization38.7%38.7%Cash + Inventories / Debt2.4x2.4x
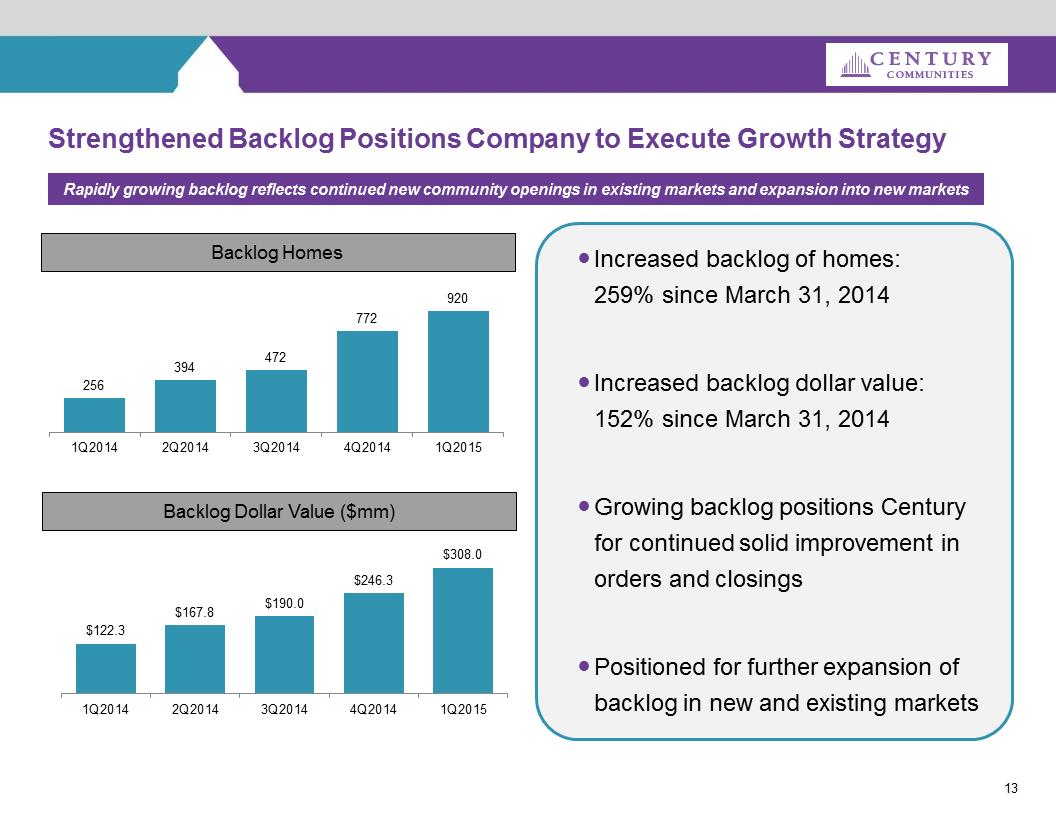
13Strengthened Backlog Positions Company to Execute Growth StrategyBacklog HomesRapidly growing backlog reflects continued new community openings in existing markets and expansion into new marketsBacklog Dollar Value ($mm).Increased backlog of homes: 259% since March 31, 2014.Increased backlog dollar value: 152% since March 31, 2014.Growing backlog positions Century for continued solid improvement in orders and closings.Positioned for further expansion of backlog in new and existing markets 256 394 472 772 9201Q20142Q20143Q20144Q20141Q2015$122.3$167.8$190.0$246.3$308.01Q20142Q20143Q20144Q20141Q2015
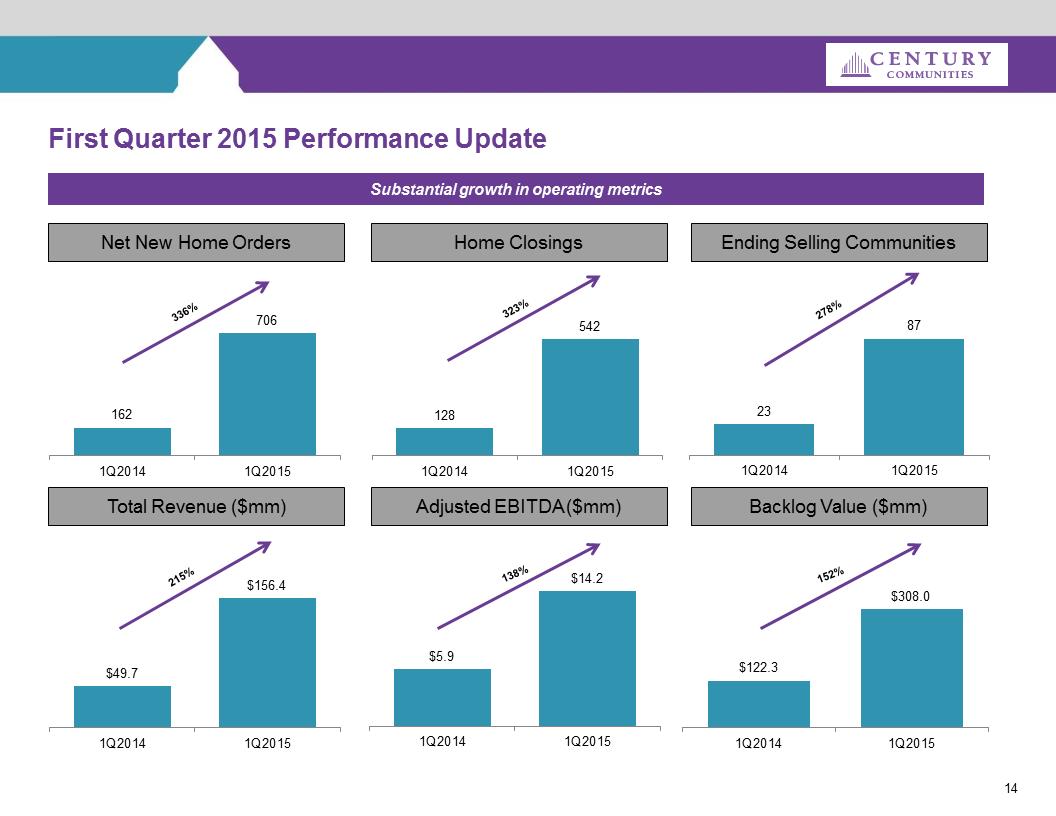
First Quarter 2015 Performance UpdateNet New Home OrdersHome ClosingsEnding Selling CommunitiesTotal Revenue ($mm)Backlog Value ($mm)Substantial growth in operating metrics14Adjusted EBITDA ($mm)1627061Q20141Q2015336%1285421Q20141Q2015323%23871Q20141Q2015278%$49.7 $156.4 1Q20141Q2015215%$5.9 $14.2 1Q20141Q2015138%$122.3 $308.0 1Q20141Q2015152%
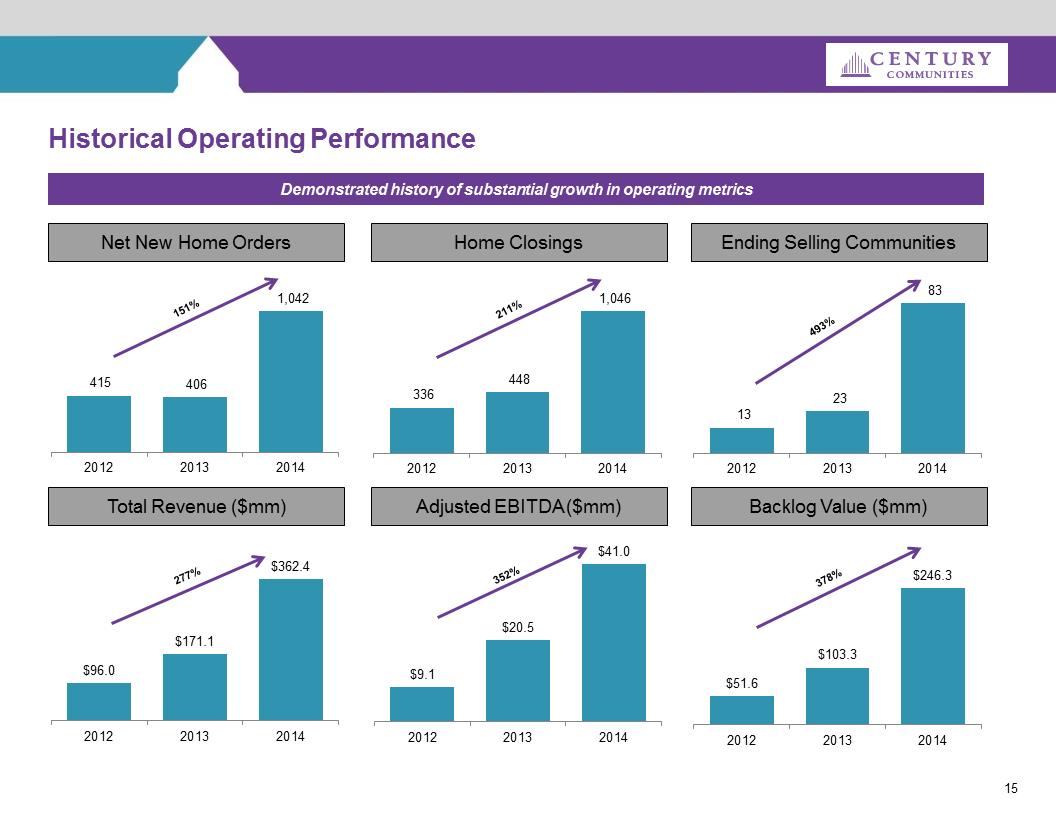
Historical Operating PerformanceNet New Home OrdersHome ClosingsEnding Selling CommunitiesTotal Revenue ($mm)Backlog Value ($mm)Demonstrated history of substantial growth in operating metrics15415 406 1,042 201220132014151%13 23 83 201220132014493%$96.0 $171.1 $362.4 201220132014277%336 448 1,046 201220132014211%Adjusted EBITDA ($mm)$9.1 $20.5 $41.0 201220132014352%$51.6 $103.3 $246.3 201220132014378%
Key Highlights16Cycle-Tested and Aligned Management TeamStrong and Growing Geographical FootprintSuperior Operating PerformanceAttractive and Well-Located Land PositionsDiversified Operating StrategyCapacity to Execute Growth Strategy
Recent Acquisitions17
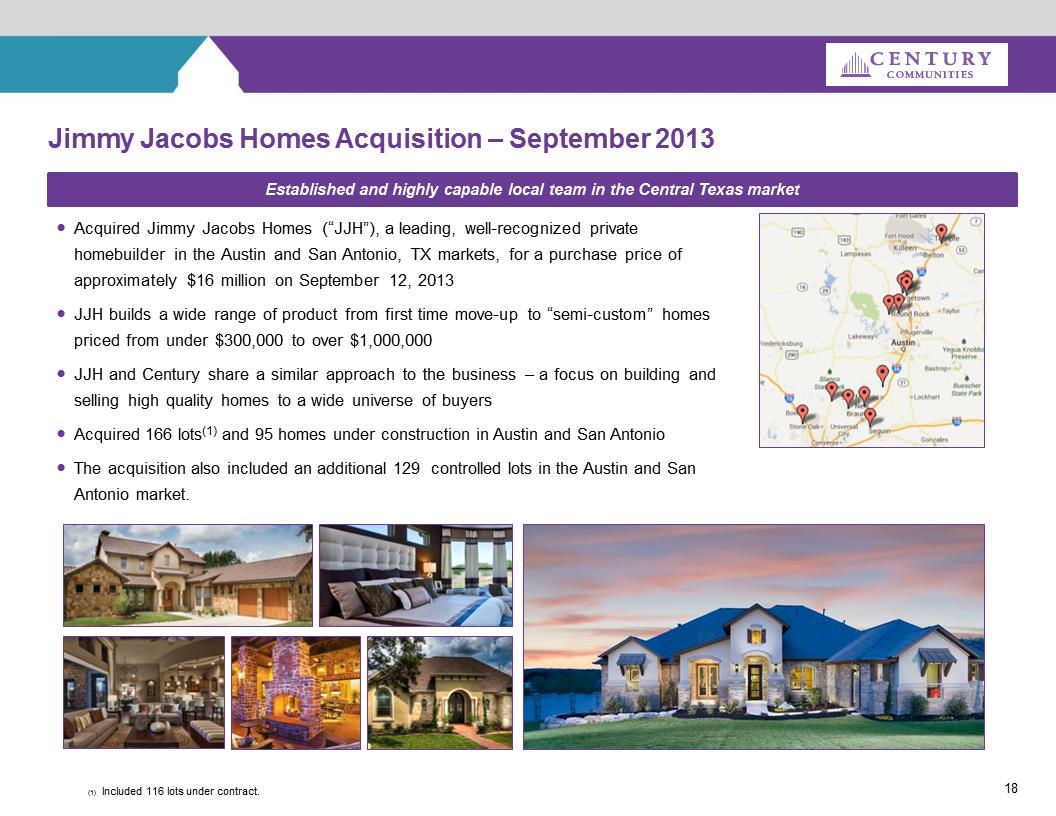
Jimmy Jacobs Homes Acquisition –September 2013.Acquired Jimmy Jacobs Homes (“JJH”), a leading, well-recognized private homebuilder in the Austin and San Antonio, TX markets, for a purchase price of approximately $16 million on September 12, 2013.JJH builds a wide range of product from first time move-up to “semi-custom” homes priced from under $300,000 to over $1,000,000.JJH and Century share a similar approach to the business –a focus on building and selling high quality homes to a wide universe of buyers.Acquired 166 lots(1)and 95 homes under construction in Austin and San Antonio.The acquisition also included an additional 129 controlled lots in the Austin and San Antonio market. Established and highly capable local team in the Central Texas marketRedMapPin.pnghttp://www.jacobshomes.com/CmImageDir/slideshow_61.jpghttp://www.jacobshomes.com/CmImageDir/slideshow_57.jpghttp://www.jacobshomes.com/CmImageDir/slideshow_63.jpghttp://www.jacobshomes.com/CmImageDir/image_255.jpghttp://bdxcdn.cust.footprint.net/Images/Homes/Jimmy11570/12550231.jpg?maxwidth=180&maxheight=240&format=jpg(1)Included 116 lots under contract.
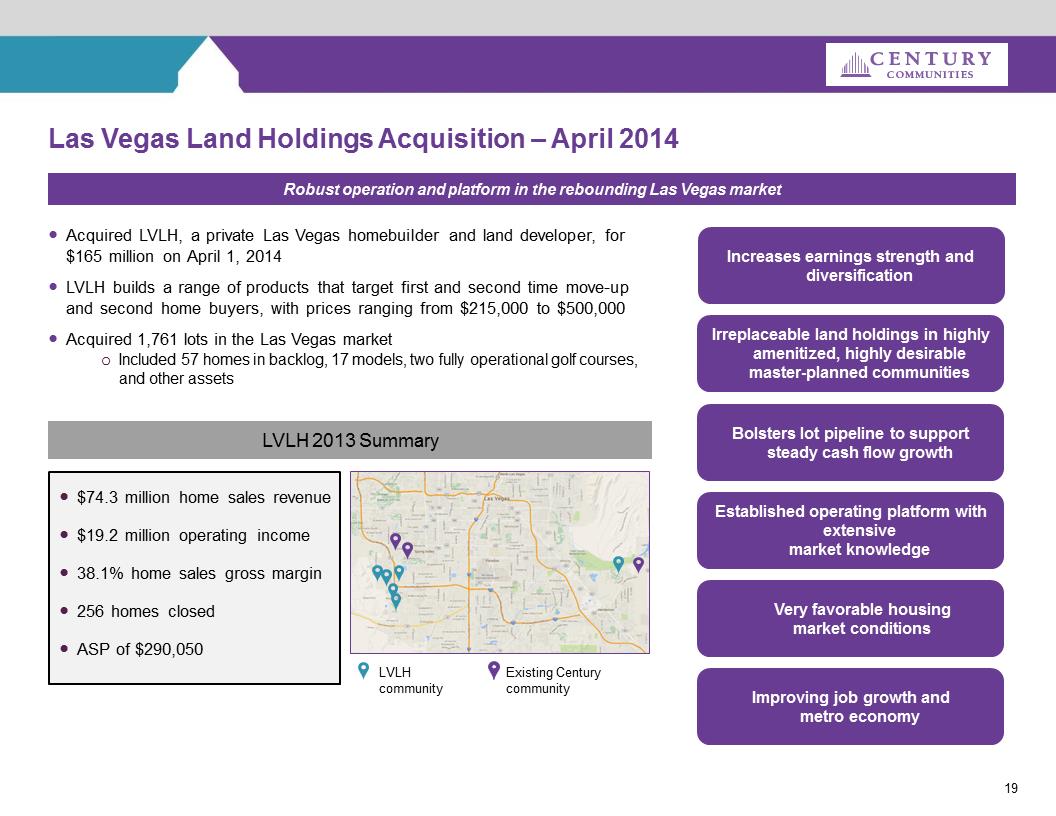
Las Vegas Land Holdings Acquisition –April 2014.Acquired LVLH, a private Las Vegas homebuilder and land developer, for $165 million on April 1, 2014.LVLH builds a range of products that target first and second time move-up and second home buyers, with prices ranging from $215,000 to $500,000.Acquired 1,761 lots in the Las Vegas marketoIncluded 57 homes in backlog, 17 models, two fully operational golf courses, and other assetsRobust operation and platform in the rebounding Las Vegas market.$74.3 million home sales revenue.$19.2 million operating income.38.1% home sales gross margin.256 homes closed.ASP of $290,050LVLH communityExisting Century communityVery favorable housingmarket conditions Improving job growth and metro economyBolsters lot pipeline to support steady cash flow growthIncreases earnings strength and diversificationIrreplaceable land holdings in highly amenitized, highly desirable master-planned communitiesEstablished operating platform with extensive market knowledgeLVLH 2013 Summary
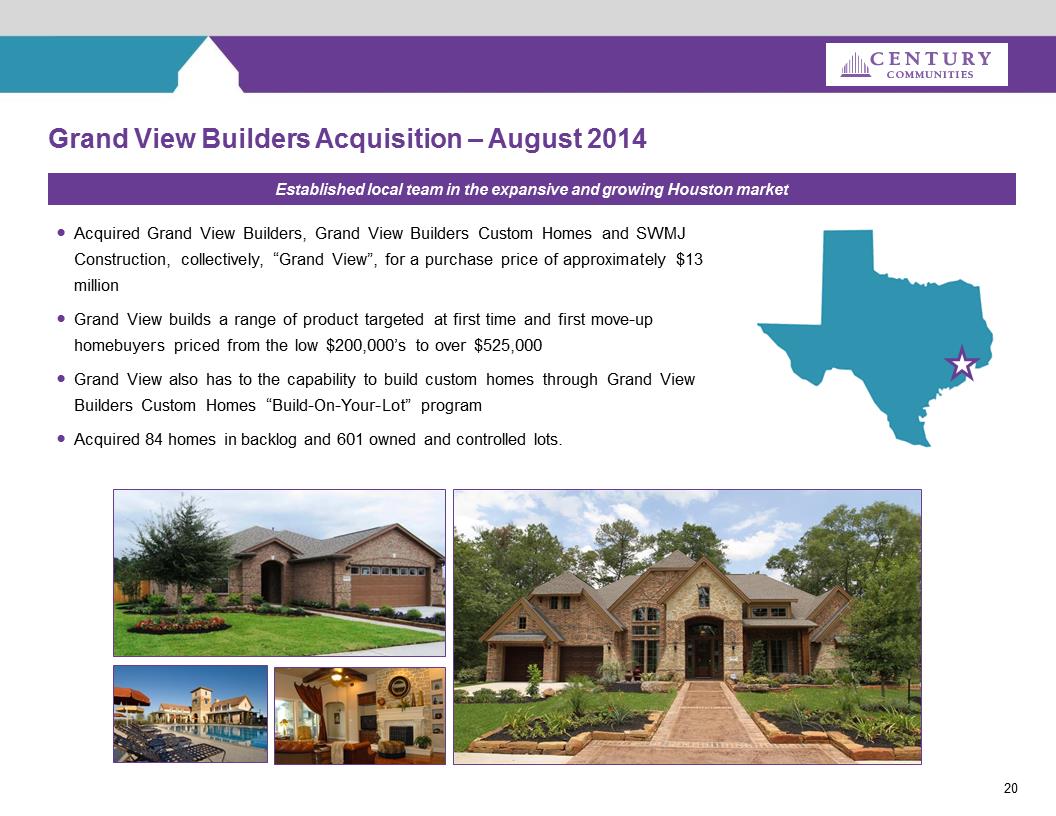
20Grand View Builders Acquisition –August 2014Established local team in the expansive and growing Houston market.Acquired Grand View Builders, Grand View Builders Custom Homes and SWMJ Construction, collectively, “Grand View”, for a purchase price of approximately $13 million.Grand View builds a range of product targeted at first time and first move-up homebuyers priced from the low $200,000’s to over $525,000.Grand View also has to the capability to build custom homes through Grand View Builders Custom Homes “Build-On-Your-Lot” program.Acquired 84 homes in backlog and 601 owned and controlled lots.S:\SALES & MARKETING (NEW)\MARKETING\1-TEXAS\Grand View\Photos\Amburn Oaks\For New Web\communitycmphotos_2.jpgS:\SALES & MARKETING (NEW)\MARKETING\1-TEXAS\Grand View\Photos\BOYL\For New Web\DSC_5220-1x1.jpgS:\SALES & MARKETING (NEW)\MARKETING\1-TEXAS\Grand View\Photos\Stewarts Forest\995 Briac Lane (15) (Large).JPGS:\SALES & MARKETING (NEW)\MARKETING\1-TEXAS\Grand View\Photos\Lakes of Bella Terra 55\Pool Area II.JPG
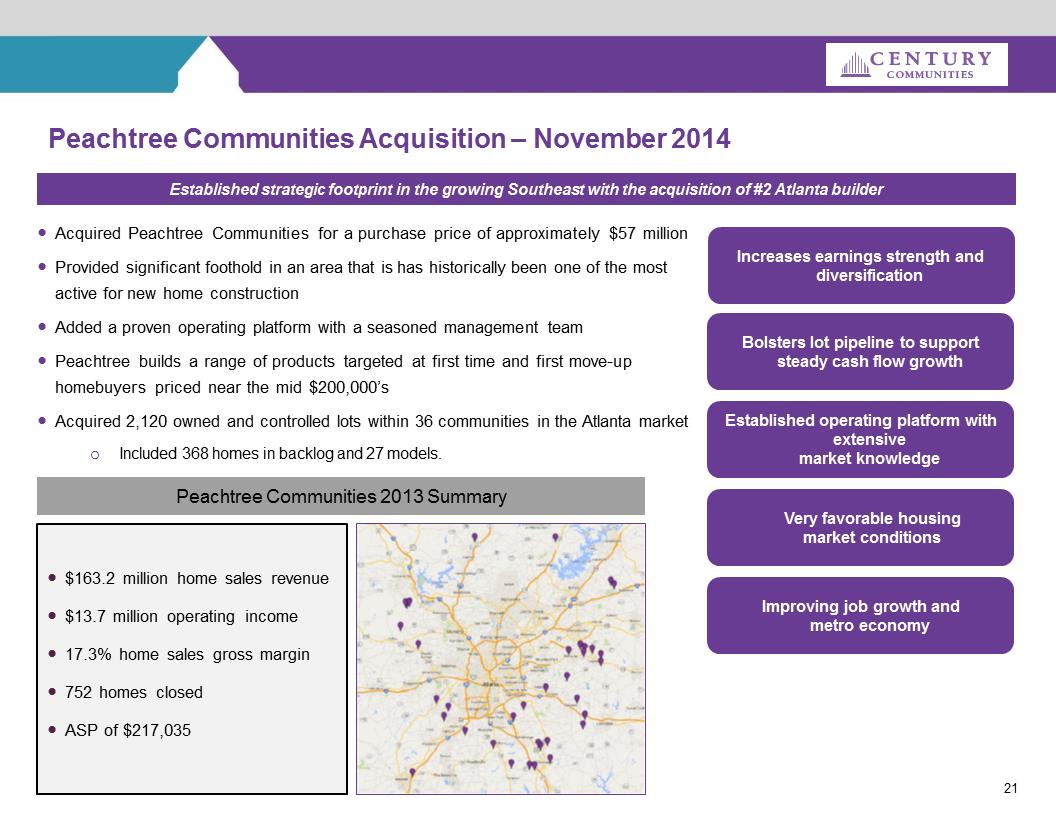
21Peachtree Communities Acquisition –November 2014Established strategic footprint in the growing Southeast with the acquisition of #2 Atlanta builder.Acquired Peachtree Communities for a purchase price of approximately $57 million.Provided significant foothold in an area that is has historically been one of the most active for new home construction.Added a proven operating platform with a seasoned management team.Peachtree builds a range of products targeted at first time and first move-up homebuyers priced near the mid $200,000’s.Acquired 2,120 owned and controlled lots within 36 communities in the Atlanta marketoIncluded 368 homes in backlog and 27 models..$163.2 million home sales revenue.$13.7 million operating income.17.3% home sales gross margin.752 homes closed.ASP of $217,035Peachtree Communities 2013 SummaryVery favorable housingmarket conditions Improving job growth and metro economyBolsters lot pipeline to support steady cash flow growthIncreases earnings strength and diversificationEstablished operating platform with extensive market knowledge
Pic2_Kitchen.jpgHistorical Financial Performance
Operating Performance Highlights23.Revenues totaled $362.4 million, an increase of $191.3 million from a year earlieroOverall average selling price totaled $336.4 thousandoClosings totaled 1,046, up 133.5% year-over-year.Operating income of $31.1 million compared to $17.9 million for the prior-year, an increase of 74.1%.Adjusted EBITDA was $41.0 million compared to $20.5 million for the prior-year, an increase of approximately $20.5 million or 99.6%oImproved overhead as a percentage of homebuilding revenue at 13.3%, down 50 bps from 2013.Pre-tax income of $31.0 million compared to $18.1 million for the prior-year, an increase of 71.3%.Total backlog increased to 772 homes from 222 homes a year earlier.Backlog value of $246.3 million at December 31, 2014, up 138.6% year-over-year.Revenues totaled $156.4 million, an increase of $106.8 million from the prior year quarteroOverall average selling price totaled $284.7 thousandoClosings totaled 542, up 323.4% year-over-year.Operating income of $9.2 million compared to $5.4 million for the prior-year quarter, an increase of 70.5%.Adjusted EBITDA was $14.2 million compared to $5.9 million for the prior-year quarter, an increase of approximately $8.2 million or 138.3%oImproved overhead as a percentage of homebuilding revenue at 13.6%, down 50 bps from the first quarter 2014.Pre-tax income of $9.5 million compared to $5.2 million for the prior-year quarter, an increase of 83.3%.Total backlog increased to 920 homes from 256 homes a year earlier.Backlog value of $308.0 million at March 31, 2015, up 151.8% year-over-yearFiscal Year 20141stQuarter 2015
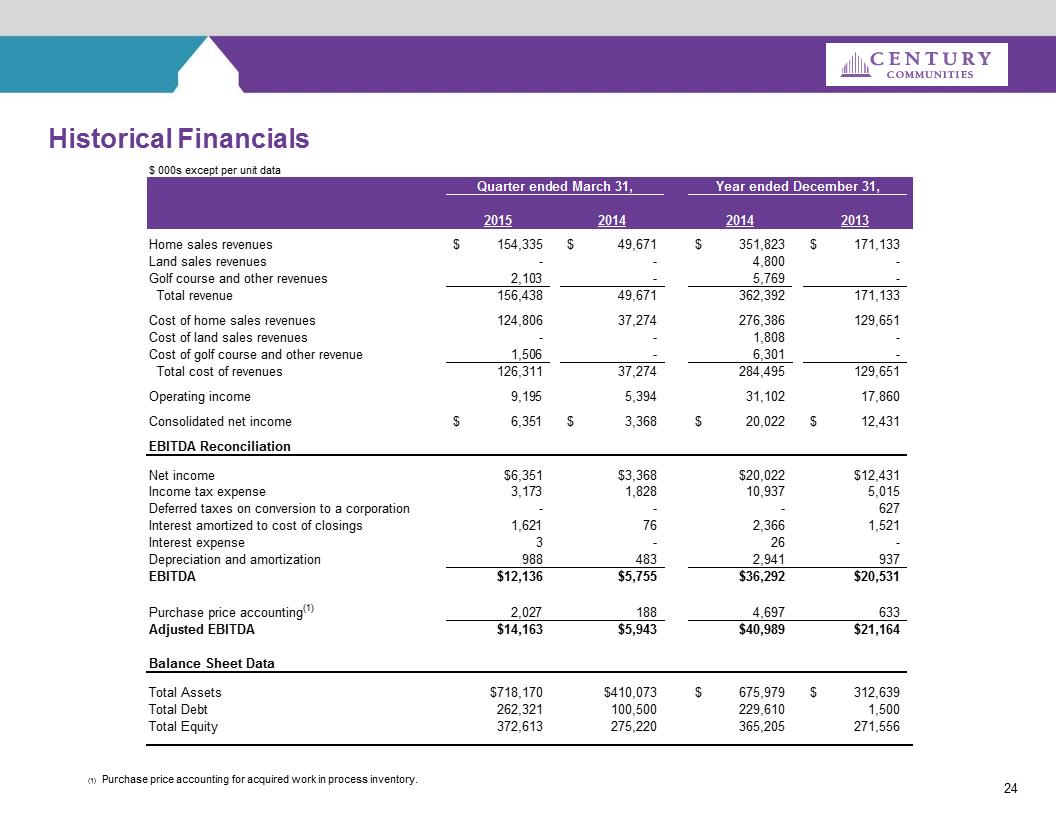
Historical Financials24(1)Purchase price accounting for acquired work in process inventory.$ 000s except per unit dataQuarter ended March 31,2015201420142013Home sales revenues154,335$ 49,671$ 351,823$ 171,133$ Land sales revenues- - 4,800 - Golf course and other revenues2,103 - 5,769 - Total revenue156,438 49,671 362,392 171,133 Cost of home sales revenues124,806 37,274 276,386 129,651 Cost of land sales revenues- - 1,808 - Cost of golf course and other revenue1,506 - 6,301 - Total cost of revenues126,311 37,274 284,495 129,651 Operating income9,195 5,394 31,102 17,860 Consolidated net income6,351$ 3,368$ 20,022$ 12,431$ EBITDA ReconciliationNet income$6,351$3,368$20,022$12,431Income tax expense3,173 1,828 10,937 5,015 Deferred taxes on conversion to a corporation- - - 627 Interest amortized to cost of closings1,621 76 2,366 1,521 Interest expense3 - 26 - Depreciation and amortization988 483 2,941 937 EBITDA$12,136$5,755$36,292$20,531Purchase price accounting(1)2,027 188 4,697 633 Adjusted EBITDA$14,163$5,943$40,989$21,164Balance Sheet DataTotal Assets$718,170$410,073675,979$ 312,639$ Total Debt262,321100,500229,610 1,500 Total Equity372,613275,220365,205 271,556 Year ended December 31,25http://www.highpointeestates.com/_media/images/Century_Communities.jpg7945 Exterior.jpgS:\SALES & MARKETING (NEW)\MARKETING\PHOTOS\1 CORPORATE PHOTO LIBRARY\COLORADO\Exteriors\CO _ ATT_ HomeTown Exterior.jpgS:\SALES & MARKETING (NEW)\MARKETING\PHOTOS\1 CORPORATE PHOTO LIBRARY\COLORADO\Interiors\CO_SF_Wolf Ranch 4520 Kitchen.jpgS:\SALES & MARKETING (NEW)\MARKETING\PHOTOS\1 CORPORATE PHOTO LIBRARY\COLORADO\Interiors\CO_SF_Montecito at RidgeGate 7945 Family Room.jpgS:\SALES & MARKETING (NEW)\MARKETING\PHOTOS\1 CORPORATE PHOTO LIBRARY\TEXAS\Canyons\130226-canyons-012_web.jpgS:\SALES & MARKETING (NEW)\MARKETING\PHOTOS\1 CORPORATE PHOTO LIBRARY\TEXAS\TexasBest\VintageOaks_exteriorday.jpgPage 24 Separator - reduced.jpg