Attached files
| file | filename |
|---|---|
| 8-K - 8-K - Cardiff Oncology, Inc. | a15-11591_28k.htm |
Exhibit 99.1
|
|
May, 2015 Better Cancer Monitoring with Cell-Free DNA |
|
|
Forward-Looking Statements Statements in this presentation about the Company's expectations, applications of its technology, markets, launch of tests and other statements that are not historical facts are "forward-looking statements" within the meaning of Section 27A of the Securities Act of 1933 and Section 21E of the Securities Exchange Act of 1934 and are based on management's current beliefs, assumptions, estimates and projections. Actual results may differ materially from those projected in the forward-looking statements for various reasons, including risks associated with product and test development, test transfer to contracting labs, government regulation, market acceptance, limited commercial experience, dependence on key personnel, obtaining financing and other factors discussed in the Company's periodic reports filed with the Securities and Exchange Commission. Copyright©2015 Trovagene, Inc. Confidential 2 |
|
|
Our Goal To Improve Treatment Outcomes with Copyright©2015 Trovagene, Inc. Confidential 3 Non-invasive Cancer Monitoring Trovagene’s technology non-invasively detects and quantitates circulating tumor DNA in urine and plasma for improved disease management |
|
|
Company Overview Copyright©2015 Trovagene, Inc. Confidential 4 Numerous clinical collaborations with leading cancer centers 30+ clinical studies Expanding clinical evidence to support broad market adoption Generating health economic data necessary for appropriate reimbursement CLIA certified, CAP accredited, high complexity lab to offer diagnostic services Precision cancer monitoring technology addresses a high unmet clinical need Enables frequent, non-invasive monitoring of oncogene mutation status, disease progression, and recurrence Significant patent portfolio around cell-free DNA Proprietary methods of extracting, purifying, detecting and quantifying oncogene mutations in cell-free DNA NASDAQ: TROV ~$350M market cap Molecular Diagnostic Specialist Focused on Cancer Monitoring Founded in 1999 NASDAQ listing 2012 $44M cash on hand (03/31/15) |
|
|
Experienced Leadership Team Copyright©2015 Trovagene, Inc. Confidential 5 Mark Erlander, PhD Chief Scientific Officer BioTheranostics, AviaraDx, Arcturus, J&J, Scripps Research Institute BS, MS Biochem PhD Neuroscience Antonius Schuh, PhD Chief Executive Officer Sorrento Therapeutics, AviaraDx, Arcturus, Sequenom PhD Pharm. Chem Stephen Zaniboni Chief Financial Officer Awarepoint, XIFIN, Sorrento Therapeutics, AviaraDx, Arcturus, Sequenom CPA BS Accounting MBA Scientific Advisors Alberto Bardelli, PhD Paul Billings, MD, PhD Charles Cantor, PhD Carlo M. Croce, MD Riccardo Dalla-Favera, MD Brunangelo Falini, MD K. Peter Hirth, PhD Board of Directors Thomas Adams, PhD (Chair) Paul Billings, MD, PhD John P. Brancaccio, CPA Carl B. Feldbaum Gary S. Jacob, PhD Rodney Markin, MD, PhD Antonius Schuh, PhD Stanley Tennant, MD Matt Posard Chief Commercial Officer Gen-Probe, Biosite, Illumina BA Econ, UCSD Vlada Melnikova MD, PhD VP, Research & Development Transgenomic, ApoCell, MD Anderson Cancer Center MD PhD Biological Engineering Keith McCormick VP, Sales & Sales Operations BioTheranostics, AviaraDx, Biogen Idec, Schering Plough, Dianon Systems BBA Marketing MBA Int’l Business Oanh Dang, PhD VP, Business Development Sequenom, Gen-Probe, Illumina, Sirius Genomics, Zymeworks PhD Biomedical Sciences Janel Dockter VP, Product Development Hologic, Gen-Probe, The Scripps Research Institute BA Microbiology David Moskowitz, RPh VP, Investor Relations UBS, FBR, Caris & Co, Roth Capital BS Pharmacy MBA Finance Rob Kelley VP, Marketing Duke Immunology, Merck, Guidant, Biosite, Siemens, Illumina BS Biology, Duke University MBA Anderson School of Business |
|
|
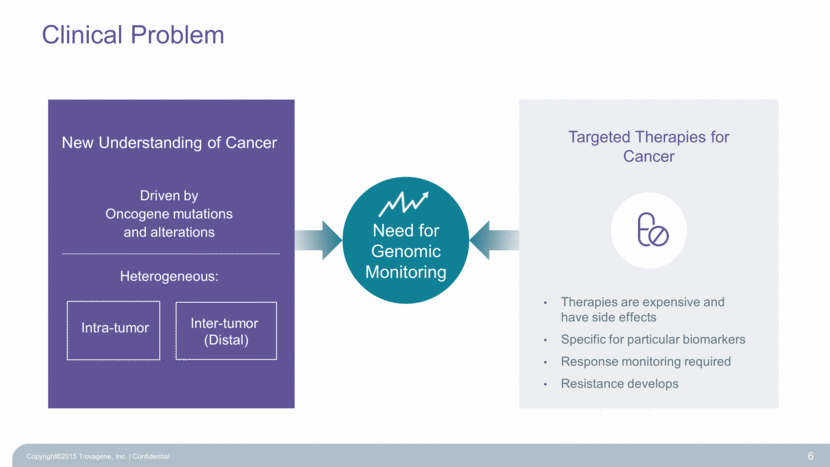
Targeted Therapies for Cancer Therapies are expensive and have side effects Specific for particular biomarkers Response monitoring required Resistance develops Clinical Problem Copyright©2015 Trovagene, Inc. Confidential 6 Driven by Oncogene mutations and alterations Heterogeneous: Inter-tumor (Distal) New Understanding of Cancer Intra-tumor Need for Genomic Monitoring |
|
|
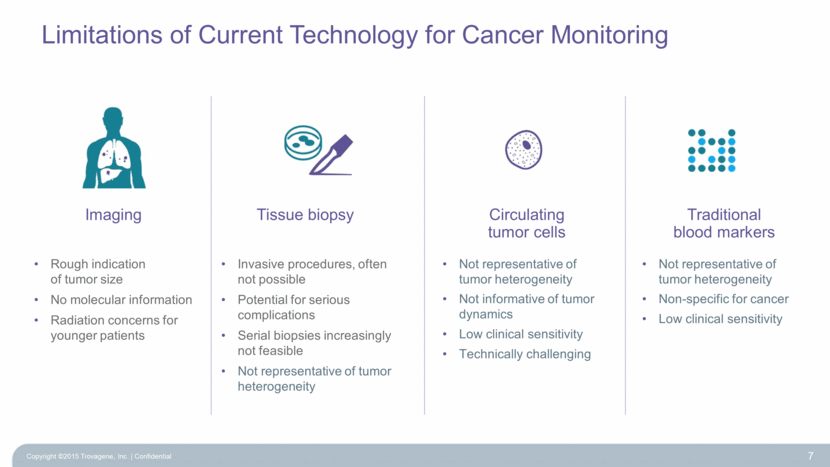
Limitations of Current Technology for Cancer Monitoring Copyright ©2015 Trovagene, Inc. Confidential 7 Imaging Tissue biopsy Circulating tumor cells Rough indication of tumor size No molecular information Radiation concerns for younger patients Not representative of tumor heterogeneity Not informative of tumor dynamics Low clinical sensitivity Technically challenging Traditional blood markers Not representative of tumor heterogeneity Non-specific for cancer Low clinical sensitivity Invasive procedures, often not possible Potential for serious complications Serial biopsies increasingly not feasible Not representative of tumor heterogeneity |
|
|
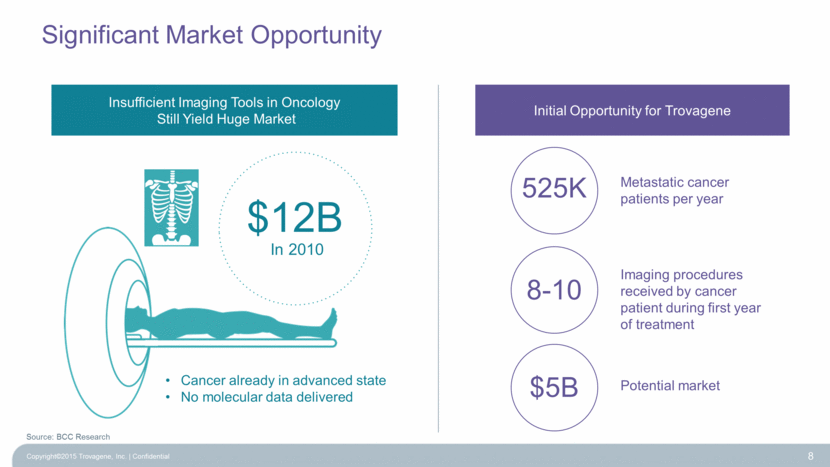
Significant Market Opportunity Copyright©2015 Trovagene, Inc. Confidential 8 $12B In 2010 Insufficient Imaging Tools in Oncology Still Yield Huge Market Initial Opportunity for Trovagene 525K Metastatic cancer patients per year 8-10 Imaging procedures received by cancer patient during first year of treatment $5B Potential market Cancer already in advanced state No molecular data delivered Source: BCC Research |
|
|
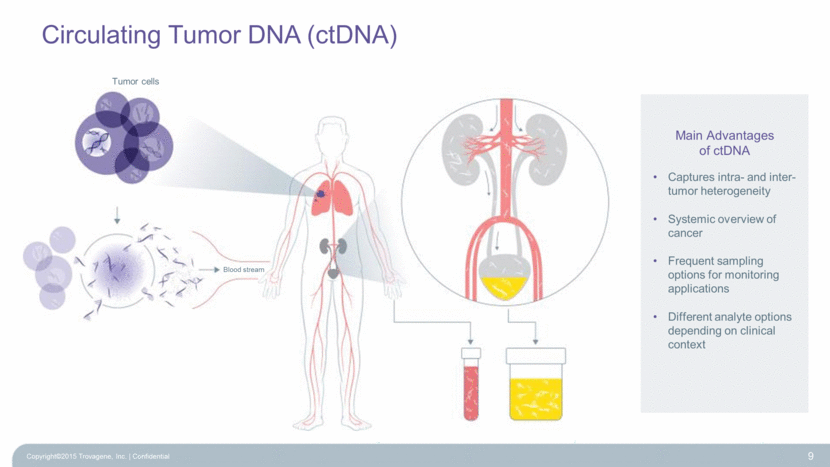
Circulating Tumor DNA (ctDNA) Copyright©2015 Trovagene, Inc. Confidential 9 Main Advantages of ctDNA Captures intra- and inter-tumor heterogeneity Systemic overview of cancer Frequent sampling options for monitoring applications Different analyte options depending on clinical context Tumor cells Blood stream |
|
|
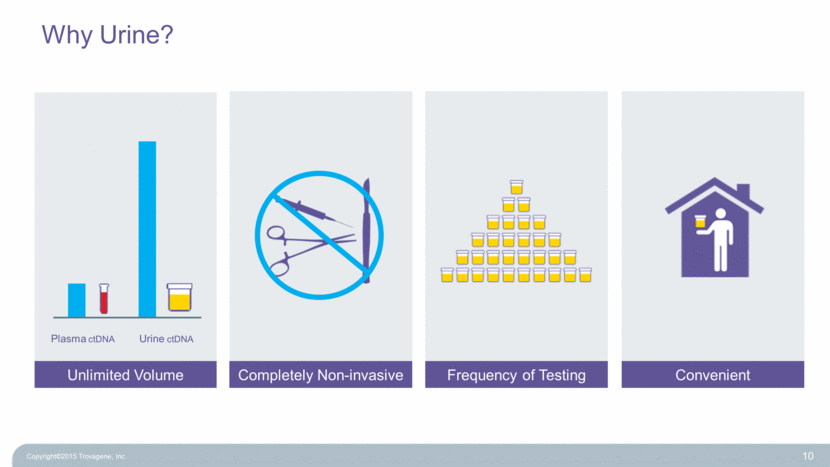
Why Urine? Copyright©2015 Trovagene, Inc. 10 Unlimited Volume Completely Non-invasive Frequency of Testing Convenient Urine ctDNA Plasma ctDNA |
|
|
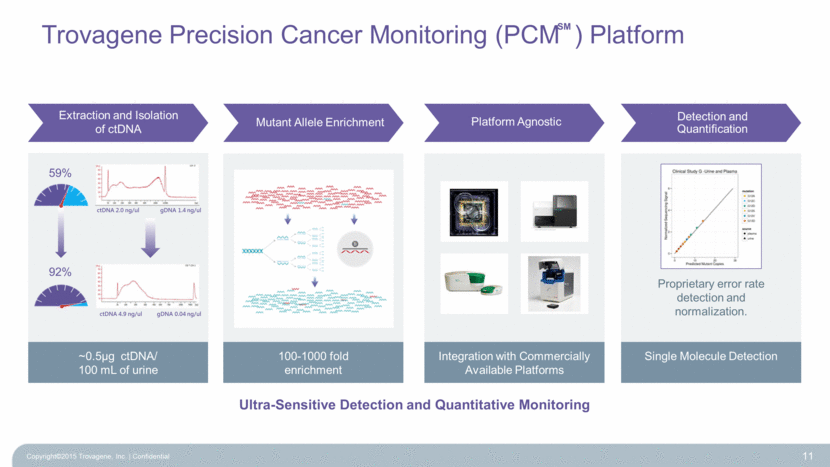
Trovagene Precision Cancer Monitoring (PCM ) Platform Copyright©2015 Trovagene, Inc. Confidential 11 Ultra-Sensitive Detection and Quantitative Monitoring 100-1000 fold enrichment ~0.5µg ctDNA/ 100 mL of urine Integration with Commercially Available Platforms Single Molecule Detection ctDNA 4.9 ng/ul gDNA 0.04 ng/ul ctDNA 2.0 ng/ul gDNA 1.4 ng/ul Extraction and Isolation of ctDNA Mutant Allele Enrichment Platform Agnostic Detection and Quantification 59% 92% SM Proprietary error rate detection and normalization. |
|
|
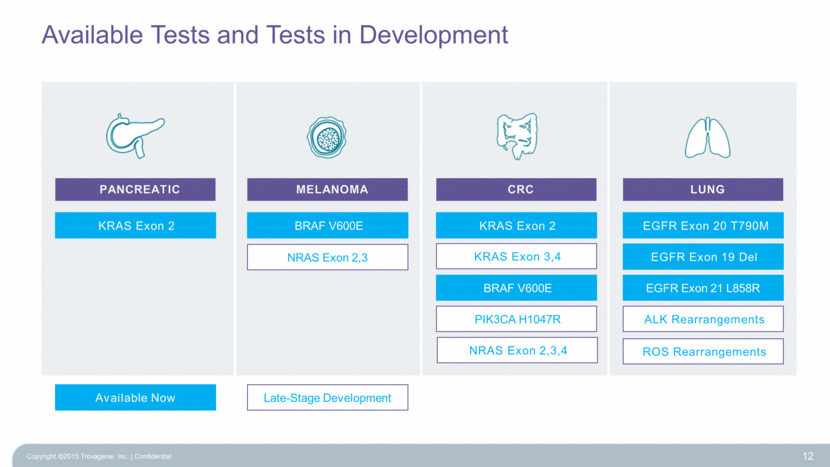
Available Tests and Tests in Development Copyright ©2015 Trovagene, Inc. Confidential 12 CRC LUNG MELANOMA PANCREATIC KRAS Exon 2 BRAF V600E KRAS Exon 2 NRAS Exon 2,3,4 BRAF V600E PIK3CA H1047R EGFR Exon 20 T790M EGFR Exon 19 Del EGFR Exon 21 L858R ALK Rearrangements NRAS Exon 2,3 KRAS Exon 3,4 ROS Rearrangements Available Now Late-Stage Development |
|
|
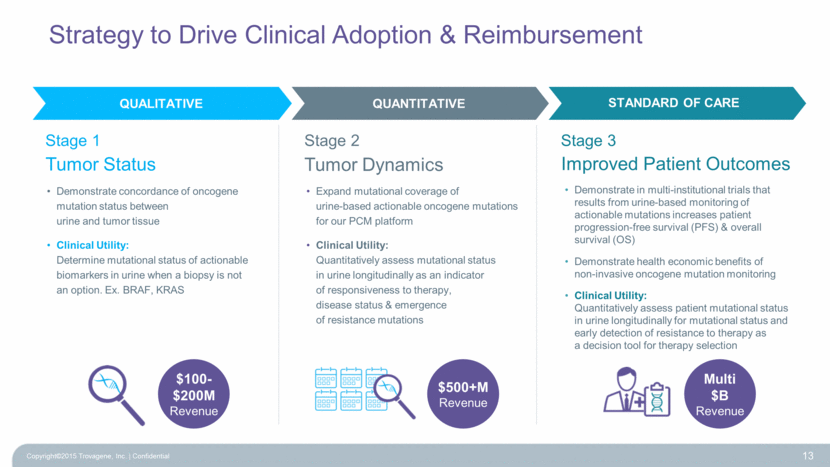
Strategy to Drive Clinical Adoption & Reimbursement Copyright©2015 Trovagene, Inc. Confidential 13 Demonstrate concordance of oncogene mutation status between urine and tumor tissue Clinical Utility: Determine mutational status of actionable biomarkers in urine when a biopsy is not an option. Ex. BRAF, KRAS $100-$200M Revenue Expand mutational coverage of urine-based actionable oncogene mutations for our PCM platform Clinical Utility: Quantitatively assess mutational status in urine longitudinally as an indicator of responsiveness to therapy, disease status & emergence of resistance mutations Demonstrate in multi-institutional trials that results from urine-based monitoring of actionable mutations increases patient progression-free survival (PFS) & overall survival (OS) Demonstrate health economic benefits of non-invasive oncogene mutation monitoring Clinical Utility: Quantitatively assess patient mutational status in urine longitudinally for mutational status and early detection of resistance to therapy as a decision tool for therapy selection $500+M Revenue Multi $B Revenue QUALITATIVE QUANTITATIVE STANDARD OF CARE Tumor Status Stage 1 Tumor Dynamics Stage 2 Improved Patient Outcomes Stage 3 |
|
|
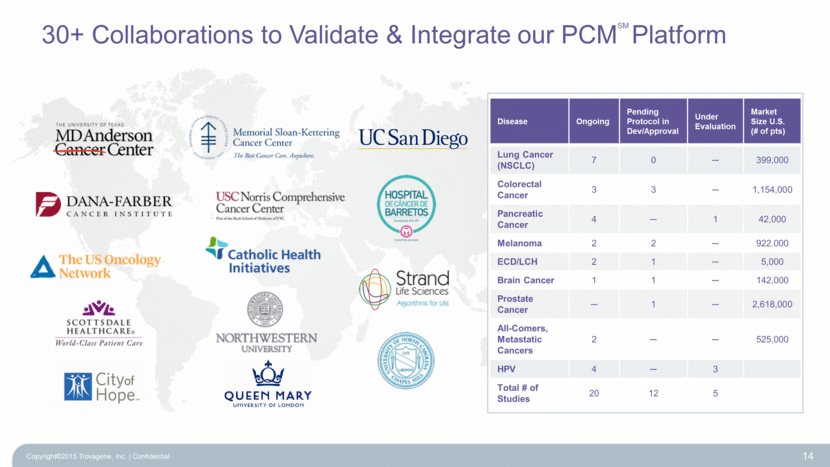
30+ Collaborations to Validate & Integrate our PCM Platform Copyright©2015 Trovagene, Inc. Confidential 14 Disease Ongoing Pending Protocol in Dev/Approval Under Evaluation Market Size U.S. (# of pts) Lung Cancer (NSCLC) 7 0 – 399,000 Colorectal Cancer 3 3 – 1,154,000 Pancreatic Cancer 4 – 1 42,000 Melanoma 2 2 – 922.000 ECD/LCH 2 1 – 5,000 Brain Cancer 1 1 – 142,000 Prostate Cancer – 1 – 2,618,000 All-Comers, Metastatic Cancers 2 – – 525,000 HPV 4 – 3 Total # of Studies 20 12 5 SM |
|
|
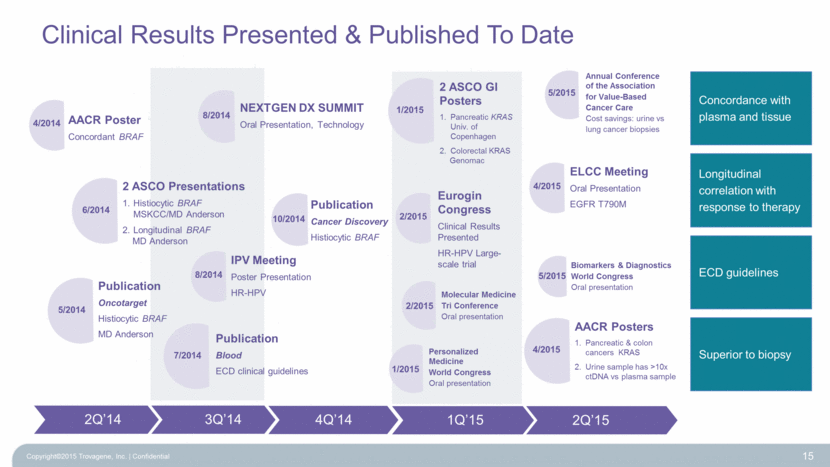
Clinical Results Presented & Published To Date Copyright©2015 Trovagene, Inc. Confidential 15 2 ASCO Presentations Histiocytic BRAF MSKCC/MD Anderson Longitudinal BRAF MD Anderson AACR Poster Concordant BRAF NEXTGEN DX SUMMIT Oral Presentation, Technology IPV Meeting Poster Presentation HR-HPV Publication Cancer Discovery Histiocytic BRAF 2Q’14 3Q’14 4/2014 6/2014 8/2014 8/2014 Publication Oncotarget Histiocytic BRAF MD Anderson 5/2014 Publication Blood ECD clinical guidelines 7/2014 10/2014 4Q’14 1Q’15 2Q’15 Eurogin Congress Clinical Results Presented HR-HPV Large-scale trial 2/2015 ELCC Meeting Oral Presentation EGFR T790M 4/2015 2 ASCO GI Posters Pancreatic KRAS Univ. of Copenhagen Colorectal KRAS Genomac 1/2015 AACR Posters Pancreatic & colon cancers KRAS Urine sample has >10x ctDNA vs plasma sample 4/2015 Personalized Medicine World Congress Oral presentation 1/2015 Molecular Medicine Tri Conference Oral presentation 2/2015 Annual Conference of the Association for Value-Based Cancer Care Cost savings: urine vs lung cancer biopsies 5/2015 Biomarkers & Diagnostics World Congress Oral presentation 5/2015 Concordance with plasma and tissue Longitudinal correlation with response to therapy ECD guidelines Superior to biopsy |
|
|
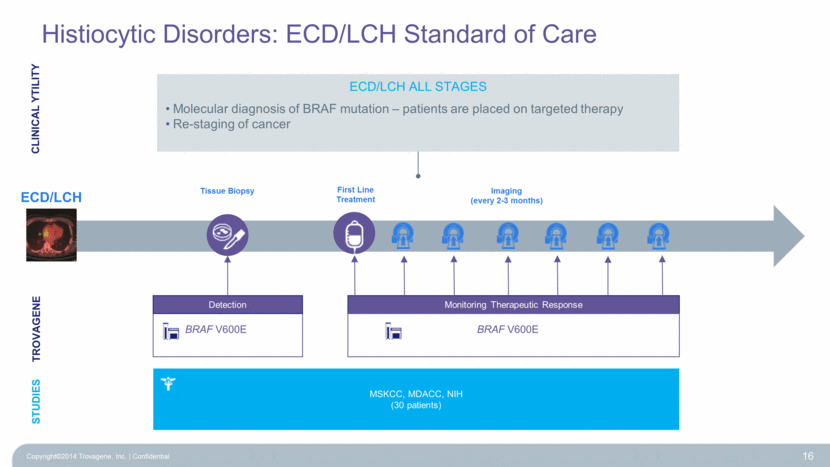
ECD/LCH Tissue Biopsy First Line Treatment Imaging (every 2-3 months) Histiocytic Disorders: ECD/LCH Standard of Care Copyright©2014 Trovagene, Inc. Confidential Monitoring Therapeutic Response BRAF V600E Detection BRAF V600E TROVAGENE ECD/LCH ALL STAGES Molecular diagnosis of BRAF mutation – patients are placed on targeted therapy Re-staging of cancer CLINICAL YTILITY MSKCC, MDACC, NIH (30 patients) STUDIES 16 |
|
|
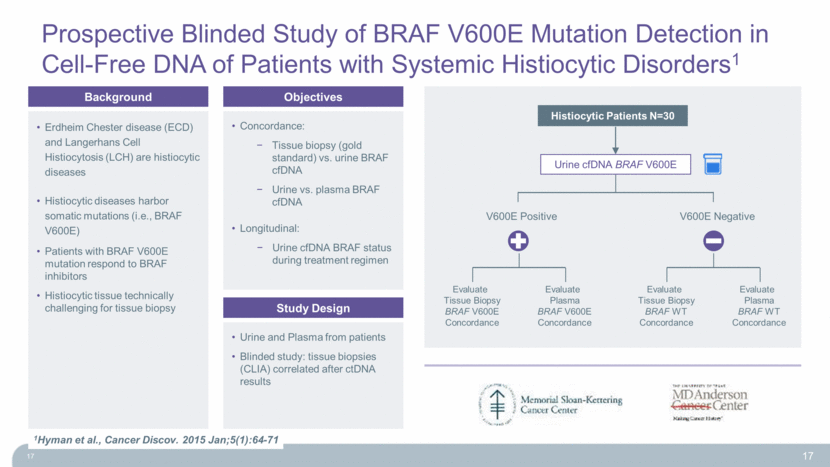
Prospective Blinded Study of BRAF V600E Mutation Detection in Cell-Free DNA of Patients with Systemic Histiocytic Disorders1 17 Histiocytic Patients N=30 Urine cfDNA BRAF V600E V600E Positive V600E Negative Evaluate Tissue Biopsy BRAF V600E Concordance Evaluate Plasma BRAF V600E Concordance Evaluate Tissue Biopsy BRAF WT Concordance Evaluate Plasma BRAF WT Concordance Background Objectives Study Design Erdheim Chester disease (ECD) and Langerhans Cell Histiocytosis (LCH) are histiocytic diseases Histiocytic diseases harbor somatic mutations (i.e., BRAF V600E) Patients with BRAF V600E mutation respond to BRAF inhibitors Histiocytic tissue technically challenging for tissue biopsy Concordance: Tissue biopsy (gold standard) vs. urine BRAF cfDNA Urine vs. plasma BRAF cfDNA Longitudinal: Urine cfDNA BRAF status during treatment regimen Urine and Plasma from patients Blinded study: tissue biopsies (CLIA) correlated after ctDNA results 1Hyman et al., Cancer Discov. 2015 Jan;5(1):64-71 17 |
|
|
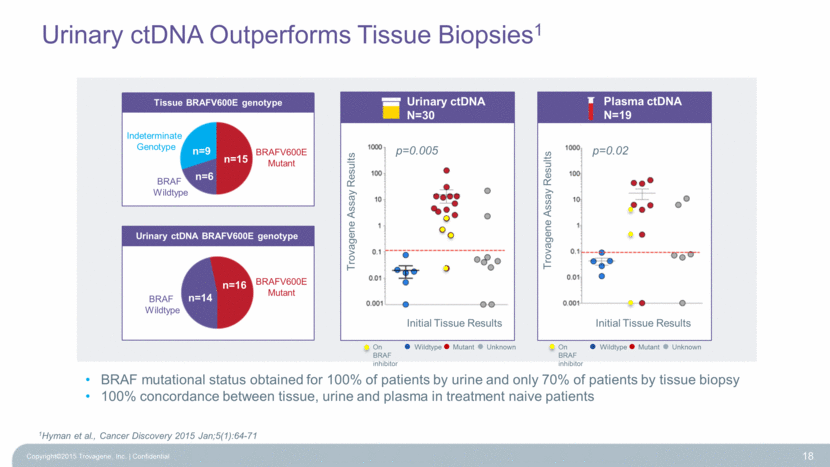
Urinary ctDNA Outperforms Tissue Biopsies1 Copyright©2015 Trovagene, Inc. Confidential 18 1Hyman et al., Cancer Discovery 2015 Jan;5(1):64-71 Urinary ctDNA N=30 Initial Tissue Results Plasma ctDNA N=19 Initial Tissue Results Trovagene Assay Results Trovagene Assay Results Wildtype Mutant Unknown On BRAF inhibitor p=0.005 p=0.02 Wildtype Mutant Unknown On BRAF inhibitor Urinary ctDNA BRAFV600E genotype Tissue BRAFV600E genotype Indeterminate Genotype BRAFV600E Mutant BRAF Wildtype n=9 n=6 n=15 BRAFV600E Mutant BRAF Wildtype n=14 n=16 BRAF mutational status obtained for 100% of patients by urine and only 70% of patients by tissue biopsy 100% concordance between tissue, urine and plasma in treatment naive patients |
|
|
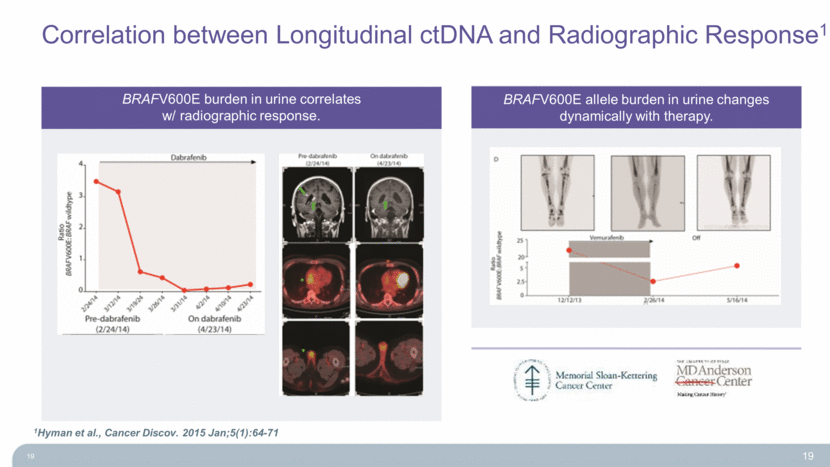
Correlation between Longitudinal ctDNA and Radiographic Response1 19 BRAFV600E burden in urine correlates w/ radiographic response. BRAFV600E allele burden in urine changes dynamically with therapy. 1Hyman et al., Cancer Discov. 2015 Jan;5(1):64-71 19 |
|
|
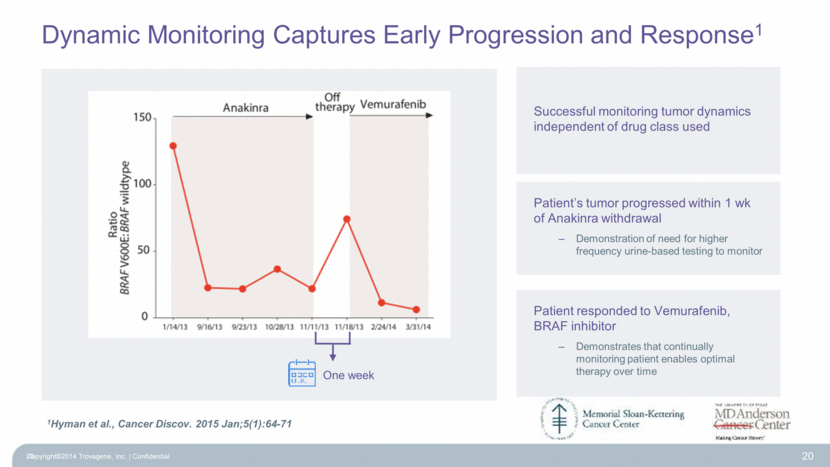
Dynamic Monitoring Captures Early Progression and Response1 Copyright©2014 Trovagene, Inc. Confidential 20 One week Successful monitoring tumor dynamics independent of drug class used Patient’s tumor progressed within 1 wk of Anakinra withdrawal Demonstration of need for higher frequency urine-based testing to monitor Patient responded to Vemurafenib, BRAF inhibitor Demonstrates that continually monitoring patient enables optimal therapy over time 1Hyman et al., Cancer Discov. 2015 Jan;5(1):64-71 20 |
|
|
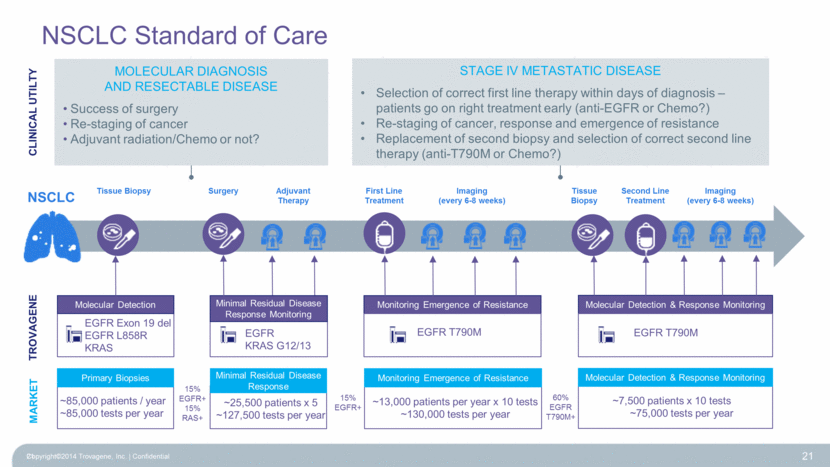
NSCLC Standard of Care Copyright©2014 Trovagene, Inc. Confidential 21 Molecular Detection & Response Monitoring EGFR T790M Monitoring Emergence of Resistance EGFR T790M Molecular Detection EGFR Exon 19 del EGFR L858R KRAS TROVAGENE NSCLC Tissue Biopsy First Line Treatment Tissue Biopsy Second Line Treatment Imaging (every 6-8 weeks) Surgery Imaging (every 6-8 weeks) EGFR KRAS G12/13 Minimal Residual Disease Response Monitoring CLINICAL UTILTY Adjuvant Therapy Primary Biopsies ~85,000 patients / year ~85,000 tests per year MARKET 15% EGFR+ Monitoring Emergence of Resistance ~13,000 patients per year x 10 tests ~130,000 tests per year 60% EGFR T790M+ Molecular Detection & Response Monitoring ~7,500 patients x 10 tests ~75,000 tests per year Minimal Residual Disease Response ~25,500 patients x 5 ~127,500 tests per year 15% EGFR+ 15% RAS+ Molecular DIAGNOSIS and RESECTABLE DISEASE Success of surgery Re-staging of cancer Adjuvant radiation/Chemo or not? Stage IV Metastatic DISEASE Selection of correct first line therapy within days of diagnosis – patients go on right treatment early (anti-EGFR or Chemo?) Re-staging of cancer, response and emergence of resistance Replacement of second biopsy and selection of correct second line therapy (anti-T790M or Chemo?) 21 |
|
|
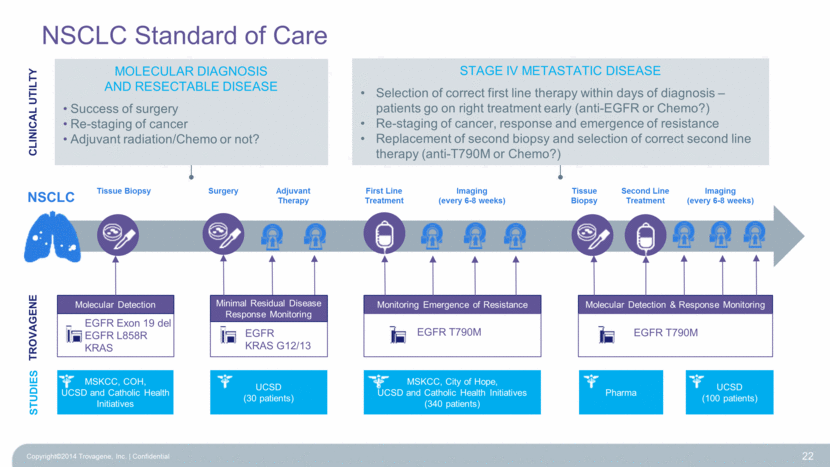
NSCLC Standard of Care Copyright©2014 Trovagene, Inc. Confidential 22 Molecular Detection & Response Monitoring EGFR T790M Monitoring Emergence of Resistance EGFR T790M Molecular Detection EGFR Exon 19 del EGFR L858R KRAS TROVAGENE NSCLC Tissue Biopsy First Line Treatment Tissue Biopsy Second Line Treatment Imaging (every 6-8 weeks) Surgery Imaging (every 6-8 weeks) EGFR KRAS G12/13 Minimal Residual Disease Response Monitoring CLINICAL UTILTY Adjuvant Therapy STUDIES MSKCC, COH, UCSD and Catholic Health Initiatives UCSD (30 patients) Pharma UCSD (100 patients) MSKCC, City of Hope, UCSD and Catholic Health Initiatives (340 patients) Molecular DIAGNOSIS and RESECTABLE DISEASE Success of surgery Re-staging of cancer Adjuvant radiation/Chemo or not? Stage IV Metastatic DISEASE Selection of correct first line therapy within days of diagnosis – patients go on right treatment early (anti-EGFR or Chemo?) Re-staging of cancer, response and emergence of resistance Replacement of second biopsy and selection of correct second line therapy (anti-T790M or Chemo?) |
|
|
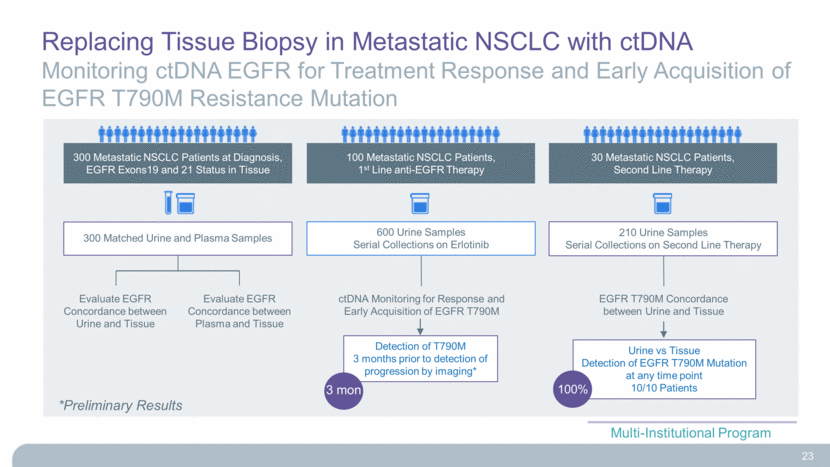
Replacing Tissue Biopsy in Metastatic NSCLC with ctDNA Monitoring ctDNA EGFR for Treatment Response and Early Acquisition of EGFR T790M Resistance Mutation 30 Metastatic NSCLC Patients, Second Line Therapy 300 Metastatic NSCLC Patients at Diagnosis, EGFR Exons19 and 21 Status in Tissue ctDNA Monitoring for Response and Early Acquisition of EGFR T790M 210 Urine Samples Serial Collections on Second Line Therapy 100 Metastatic NSCLC Patients, 1st Line anti-EGFR Therapy 600 Urine Samples Serial Collections on Erlotinib Evaluate EGFR Concordance between Urine and Tissue Evaluate EGFR Concordance between Plasma and Tissue 300 Matched Urine and Plasma Samples Multi-Institutional Program EGFR T790M Concordance between Urine and Tissue Urine vs Tissue Detection of EGFR T790M Mutation at any time point 10/10 Patients 100% Detection of T790M 3 months prior to detection of progression by imaging* 3 mon *Preliminary Results 23 |
|
|
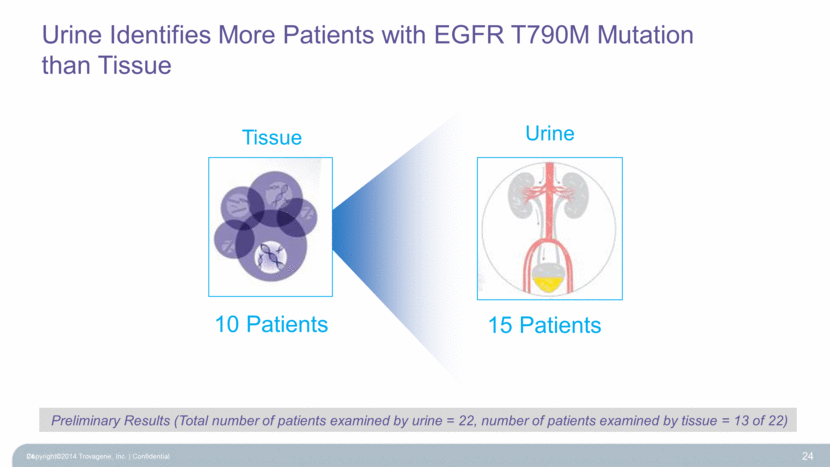
Urine Identifies More Patients with EGFR T790M Mutation than Tissue Copyright©2014 Trovagene, Inc. Confidential 24 15 Patients Tissue Urine 10 Patients Preliminary Results (Total number of patients examined by urine = 22, number of patients examined by tissue = 13 of 22) 24 |
|
|
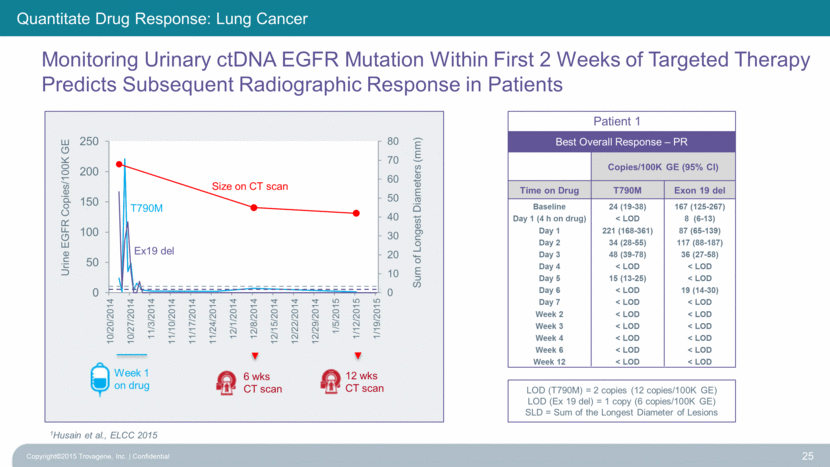
Monitoring Urinary ctDNA EGFR Mutation Within First 2 Weeks of Targeted Therapy Predicts Subsequent Radiographic Response in Patients Copyright©2015 Trovagene, Inc. Confidential 25 1Husain et al., ELCC 2015 Quantitate Drug Response: Lung Cancer Patient 1 Copies/100K GE (95% CI) Time on Drug T790M Exon 19 del Baseline 24 (19-38) 167 (125-267) Day 1 (4 h on drug) < LOD 8 (6-13) Day 1 221 (168-361) 87 (65-139) Day 2 34 (28-55) 117 (88-187) Day 3 48 (39-78) 36 (27-58) Day 4 < LOD < LOD Day 5 15 (13-25) < LOD Day 6 < LOD 19 (14-30) Day 7 < LOD < LOD Week 2 < LOD < LOD Week 3 < LOD < LOD Week 4 < LOD < LOD Week 6 < LOD < LOD Week 12 < LOD < LOD Best Overall Response – PR LOD (T790M) = 2 copies (12 copies/100K GE) LOD (Ex 19 del) = 1 copy (6 copies/100K GE) SLD = Sum of the Longest Diameter of Lesions T790M Ex19 del Size on CT scan Sum of Longest Diameters (mm) Week 1 on drug 6 wks CT scan 12 wks CT scan 0 10 20 30 40 50 60 70 80 0 50 100 150 200 250 10/20/2014 10/27/2014 11/3/2014 11/10/2014 11/17/2014 11/24/2014 12/1/2014 12/8/2014 12/15/2014 12/22/2014 12/29/2014 1/5/2015 1/12/2015 1/19/2015 Urine EGFR Copies/100K GE |
|
|
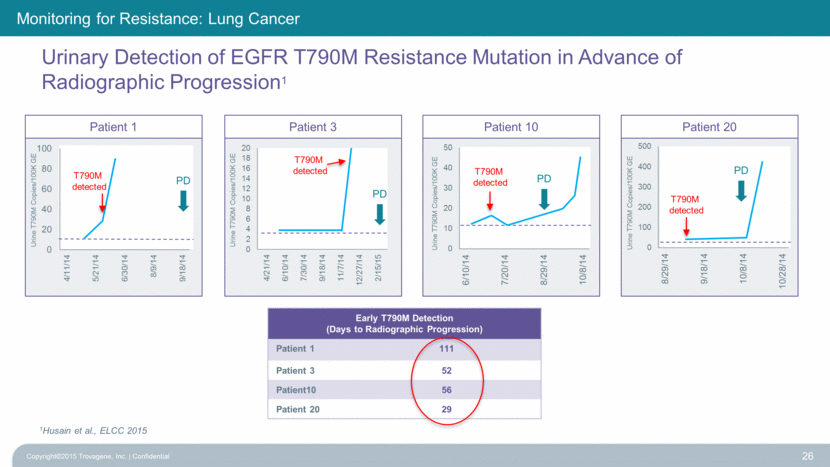
Patient 20 Patient 10 Patient 3 Copyright©2015 Trovagene, Inc. Confidential 26 1Husain et al., ELCC 2015 Monitoring for Resistance: Lung Cancer Early T790M Detection (Days to Radiographic Progression) Patient 1 111 Patient 3 52 Patient10 56 Patient 20 29 PD PD PD T790M detected T790M detected PD T790M detected T790M detected Urine T790M Copies/100K GE Patient 1 Urine T790M Copies/100K GE Urine T790M Copies/100K GE Urine T790M Copies/100K GE Urinary Detection of EGFR T790M Resistance Mutation in Advance of Radiographic Progression1 0 2 4 6 8 10 12 14 16 18 20 4/21/14 6/10/14 7/30/14 9/18/14 11/7/14 12/27/14 2/15/15 0 20 40 60 80 100 4/11/14 5/21/14 6/30/14 8/9/14 9/18/14 0 10 20 30 40 50 6/10/14 7/20/14 8/29/14 10/8/14 0 100 200 300 400 500 8/29/14 9/18/14 10/8/14 10/28/14 |
|
|
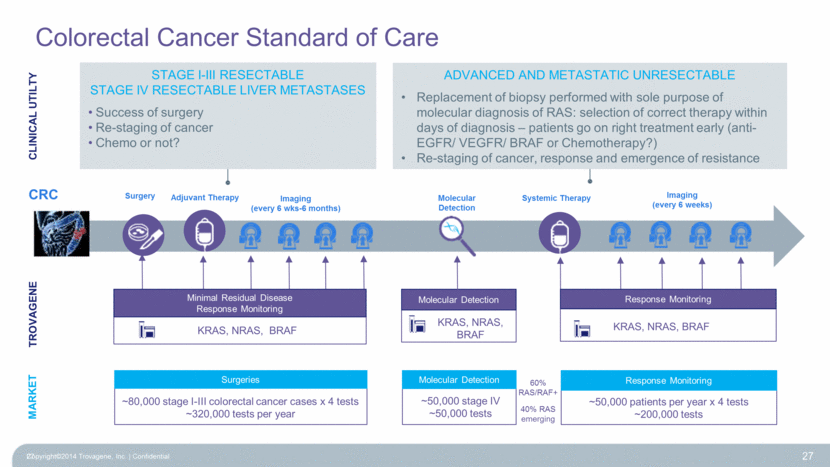
Colorectal Cancer Standard of Care Copyright©2014 Trovagene, Inc. Confidential 27 KRAS, NRAS, BRAF Minimal Residual Disease Response Monitoring TROVAGENE Adjuvant Therapy Imaging (every 6 weeks) Systemic Therapy Imaging (every 6 wks-6 months) Molecular Detection KRAS, NRAS, BRAF Surgery KRAS, NRAS, BRAF Response Monitoring Molecular Detection Molecular Detection ~50,000 stage IV ~50,000 tests MARKET Surgeries ~50,000 patients per year x 4 tests ~200,000 tests Response Monitoring ~80,000 stage I-III colorectal cancer cases x 4 tests ~320,000 tests per year 60% RAS/RAF+ 40% RAS emerging CLINICAL UTILTY Stage I-III Resectable Stage IV Resectable Liver Metastases Success of surgery Re-staging of cancer Chemo or not? Advanced and metastatic unresectable Replacement of biopsy performed with sole purpose of molecular diagnosis of RAS: selection of correct therapy within days of diagnosis – patients go on right treatment early (anti-EGFR/ VEGFR/ BRAF or Chemotherapy?) Re-staging of cancer, response and emergence of resistance CRC 27 |
|
|
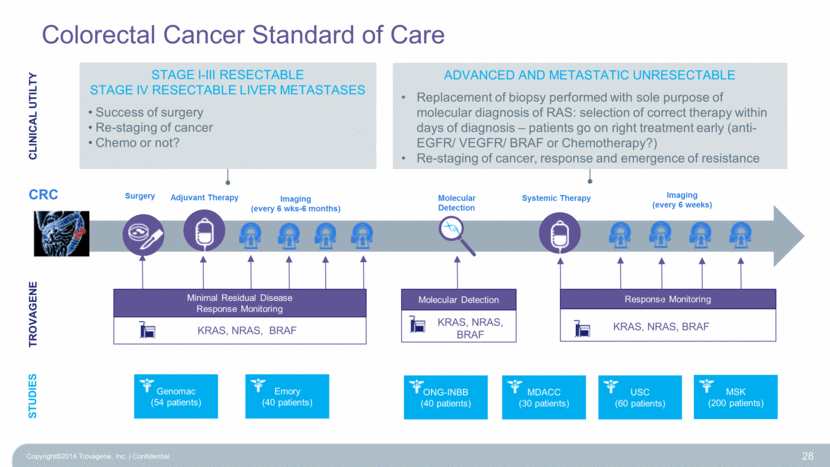
Colorectal Cancer Standard of Care Copyright©2014 Trovagene, Inc. Confidential 28 KRAS, NRAS, BRAF Minimal Residual Disease Response Monitoring TROVAGENE Adjuvant Therapy Imaging (every 6 weeks) Systemic Therapy Imaging (every 6 wks-6 months) Molecular Detection KRAS, NRAS, BRAF Surgery KRAS, NRAS, BRAF Response Monitoring Molecular Detection ONG-INBB (40 patients) MDACC (30 patients) USC (60 patients) MSK (200 patients) Genomac (54 patients) Emory (40 patients) STUDIES CLINICAL UTILTY CRC Stage I-III Resectable Stage IV Resectable Liver Metastases Success of surgery Re-staging of cancer Chemo or not? Advanced and metastatic unresectable Replacement of biopsy performed with sole purpose of molecular diagnosis of RAS: selection of correct therapy within days of diagnosis – patients go on right treatment early (anti-EGFR/ VEGFR/ BRAF or Chemotherapy?) Re-staging of cancer, response and emergence of resistance |
|
|
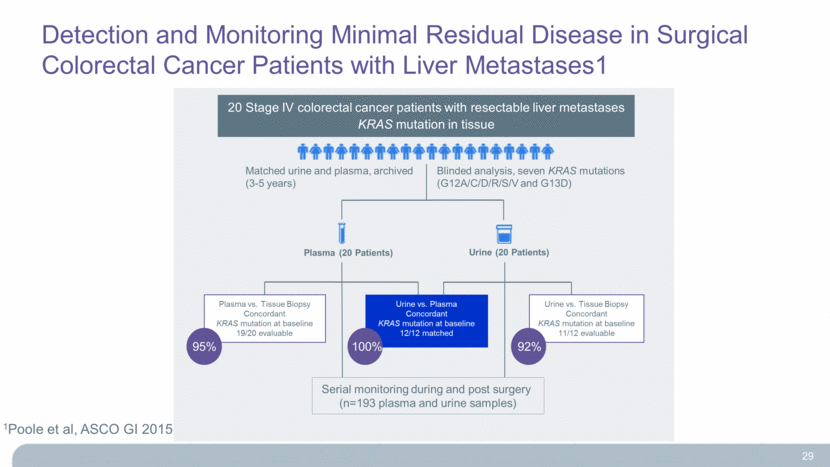
Detection and Monitoring Minimal Residual Disease in Surgical Colorectal Cancer Patients with Liver Metastases1 Urine (20 Patients) Plasma (20 Patients) Plasma vs. Tissue Biopsy Concordant KRAS mutation at baseline 19/20 evaluable Urine vs. Plasma Concordant KRAS mutation at baseline 12/12 matched Urine vs. Tissue Biopsy Concordant KRAS mutation at baseline 11/12 evaluable 95% 100% 92% Serial monitoring during and post surgery (n=193 plasma and urine samples) 20 Stage IV colorectal cancer patients with resectable liver metastases KRAS mutation in tissue Matched urine and plasma, archived (3-5 years) Blinded analysis, seven KRAS mutations (G12A/C/D/R/S/V and G13D) 1Poole et al, ASCO GI 2015 29 |
|
|
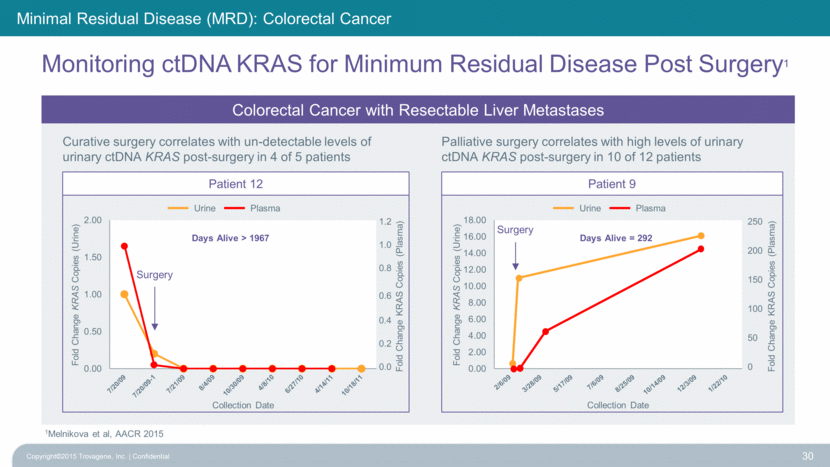
Monitoring ctDNA KRAS for Minimum Residual Disease Post Surgery1 Copyright©2015 Trovagene, Inc. Confidential 30 1Melnikova et al, AACR 2015 Curative surgery correlates with un-detectable levels of urinary ctDNA KRAS post-surgery in 4 of 5 patients Palliative surgery correlates with high levels of urinary ctDNA KRAS post-surgery in 10 of 12 patients Colorectal Cancer with Resectable Liver Metastases Minimal Residual Disease (MRD): Colorectal Cancer Surgery Days Alive > 1967 Patient 9 Days Alive = 292 Surgery 1.2 1.0 0.8 0.6 0.4 0.2 0.0 Fold Change KRAS Copies (Plasma) 250 200 150 100 50 0 Fold Change KRAS Copies (Plasma) Urine Plasma Urine Plasma Patient 12 0.00 0.50 1.00 1.50 2.00 Fold Change KRAS Copies (Urine) Collection Date 0.00 2.00 4.00 6.00 8.00 10.00 12.00 14.00 16.00 18.00 Fold Change KRAS Copies (Urine) Collection Date |
|
|
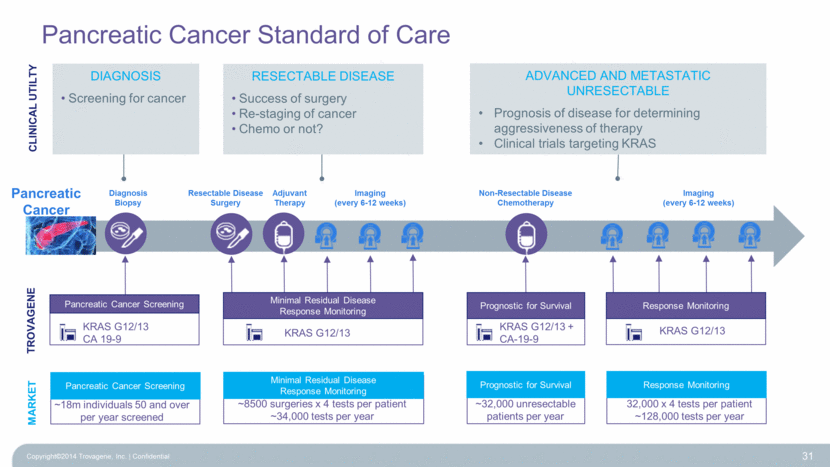
Pancreatic Cancer Standard of Care Copyright©2014 Trovagene, Inc. Confidential 31 TROVAGENE Pancreatic Cancer Diagnosis Biopsy Adjuvant Therapy Imaging (every 6-12 weeks) Imaging (every 6-12 weeks) Resectable Disease Surgery Non-Resectable Disease Chemotherapy Prognostic for Survival KRAS G12/13 + CA-19-9 CLINICAL UTILTY KRAS G12/13 Diagnosis Screening for cancer KRAS G12/13 Minimal Residual Disease Response Monitoring Pancreatic Cancer Screening KRAS G12/13 CA 19-9 Response Monitoring RESECTABLE DISEASE Success of surgery Re-staging of cancer Chemo or not? Advanced and Metastatic Unresectable Prognosis of disease for determining aggressiveness of therapy Clinical trials targeting KRAS MARKET ~8500 surgeries x 4 tests per patient ~34,000 tests per year 32,000 x 4 tests per patient ~128,000 tests per year ~18m individuals 50 and over per year screened Pancreatic Cancer Screening Minimal Residual Disease Response Monitoring Prognostic for Survival Response Monitoring ~32,000 unresectable patients per year |
|
|
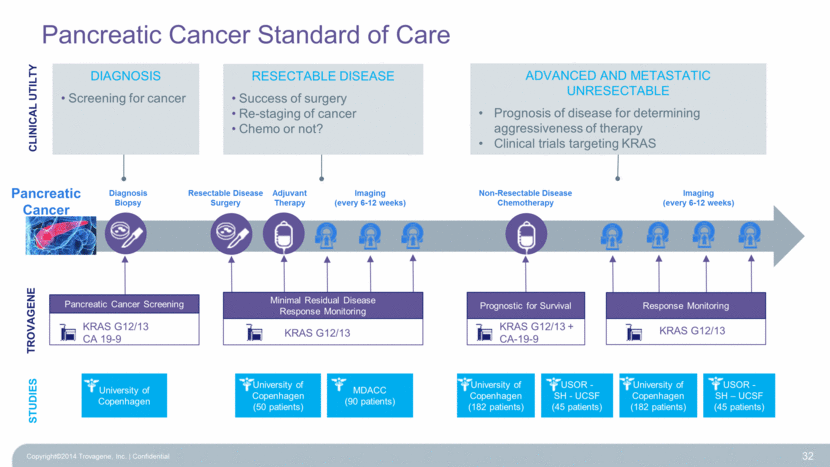
Pancreatic Cancer Standard of Care Copyright©2014 Trovagene, Inc. Confidential 32 TROVAGENE Pancreatic Cancer Diagnosis Biopsy Adjuvant Therapy Imaging (every 6-12 weeks) Imaging (every 6-12 weeks) Resectable Disease Surgery Non-Resectable Disease Chemotherapy CLINICAL UTILTY University of Copenhagen University of Copenhagen (50 patients) MDACC (90 patients) University of Copenhagen (182 patients) USOR - SH - UCSF (45 patients) University of Copenhagen (182 patients) USOR - SH – UCSF (45 patients) STUDIES Prognostic for Survival KRAS G12/13 + CA-19-9 KRAS G12/13 KRAS G12/13 Minimal Residual Disease Response Monitoring Pancreatic Cancer Screening KRAS G12/13 CA 19-9 Response Monitoring Diagnosis Screening for cancer RESECTABLE DISEASE Success of surgery Re-staging of cancer Chemo or not? Advanced and Metastatic Unresectable Prognosis of disease for determining aggressiveness of therapy Clinical trials targeting KRAS |
|
|
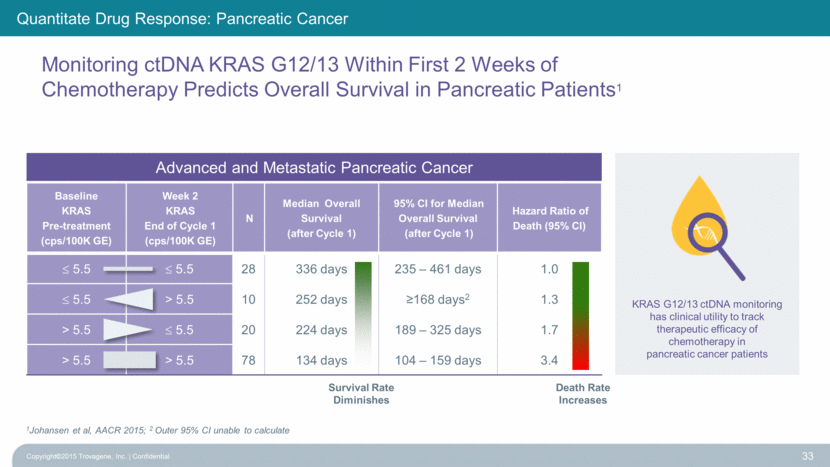
Baseline KRAS Pre-treatment (cps/100K GE) Week 2 KRAS End of Cycle 1 (cps/100K GE) N Median Overall Survival (after Cycle 1) 95% CI for Median Overall Survival (after Cycle 1) Hazard Ratio of Death (95% CI) 5.5 5.5 28 336 days 235 – 461 days 1.0 5.5 > 5.5 10 252 days >168 days2 1.3 > 5.5 5.5 20 224 days 189 – 325 days 1.7 > 5.5 > 5.5 78 134 days 104 – 159 days 3.4 Monitoring ctDNA KRAS G12/13 Within First 2 Weeks of Chemotherapy Predicts Overall Survival in Pancreatic Patients1 Copyright©2015 Trovagene, Inc. Confidential 33 1Johansen et al, AACR 2015; 2 Outer 95% CI unable to calculate KRAS G12/13 ctDNA monitoring has clinical utility to track therapeutic efficacy of chemotherapy in pancreatic cancer patients Advanced and Metastatic Pancreatic Cancer Quantitate Drug Response: Pancreatic Cancer Survival Rate Diminishes Death Rate Increases |
|
|
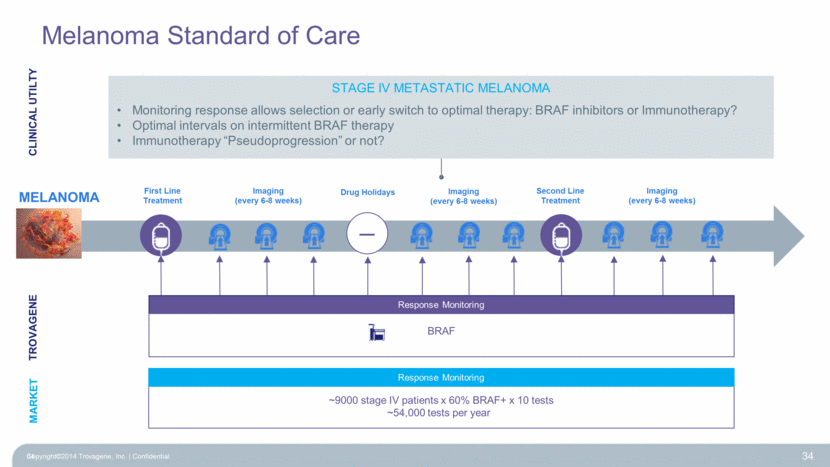
Melanoma Standard of Care Copyright©2014 Trovagene, Inc. Confidential 34 TROVAGENE MELANOMA First Line Treatment Second Line Treatment Imaging (every 6-8 weeks) Imaging (every 6-8 weeks) CLINICAL UTILTY Response Monitoring BRAF MARKET Response Monitoring ~9000 stage IV patients x 60% BRAF+ x 10 tests ~54,000 tests per year – Drug Holidays Imaging (every 6-8 weeks) Stage IV Metastatic MELANOMA Monitoring response allows selection or early switch to optimal therapy: BRAF inhibitors or Immunotherapy? Optimal intervals on intermittent BRAF therapy Immunotherapy “Pseudoprogression” or not? 34 |
|
|
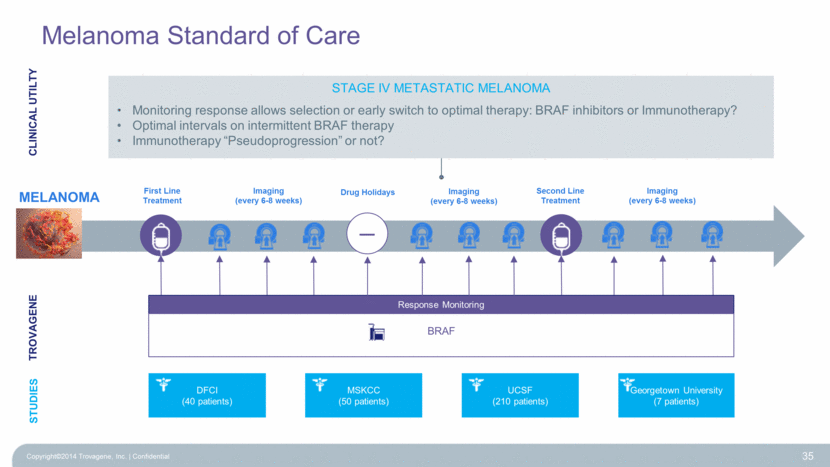
Melanoma Standard of Care Copyright©2014 Trovagene, Inc. Confidential 35 TROVAGENE MELANOMA First Line Treatment Second Line Treatment Imaging (every 6-8 weeks) Imaging (every 6-8 weeks) CLINICAL UTILTY STUDIES Response Monitoring BRAF – Drug Holidays Imaging (every 6-8 weeks) Georgetown University (7 patients) UCSF (210 patients) MSKCC (50 patients) DFCI (40 patients) Stage IV Metastatic MELANOMA Monitoring response allows selection or early switch to optimal therapy: BRAF inhibitors or Immunotherapy? Optimal intervals on intermittent BRAF therapy Immunotherapy “Pseudoprogression” or not? |
|
|
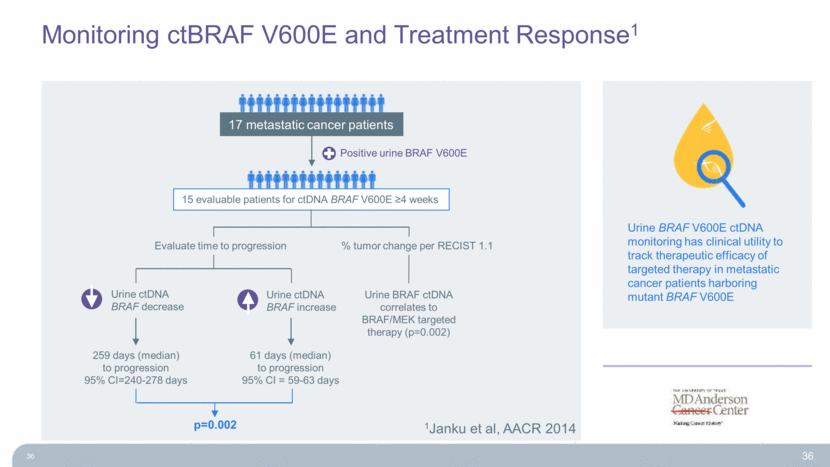
Monitoring ctBRAF V600E and Treatment Response1 36 17 metastatic cancer patients 15 evaluable patients for ctDNA BRAF V600E >4 weeks Evaluate time to progression % tumor change per RECIST 1.1 Urine ctDNA BRAF decrease Urine ctDNA BRAF increase Urine BRAF ctDNA correlates to BRAF/MEK targeted therapy (p=0.002) Urine BRAF V600E ctDNA monitoring has clinical utility to track therapeutic efficacy of targeted therapy in metastatic cancer patients harboring mutant BRAF V600E Positive urine BRAF V600E 259 days (median) to progression 95% CI=240-278 days 61 days (median) to progression 95% CI = 59-63 days p=0.002 1Janku et al, AACR 2014 36 |
|
|
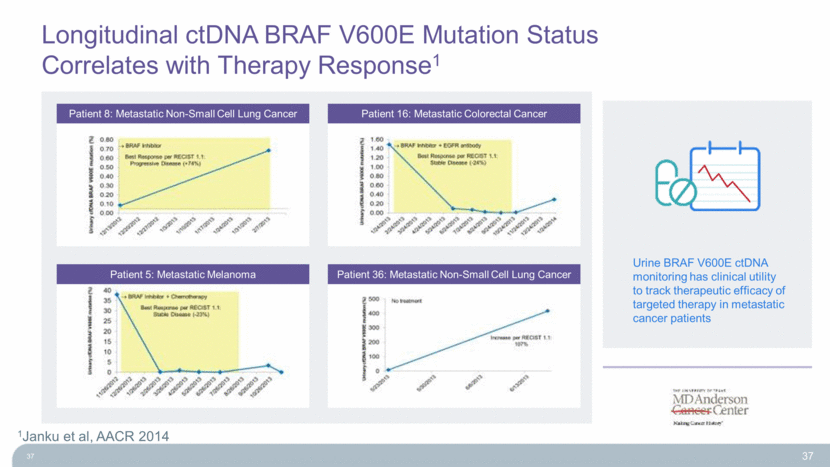
Patient 5: Metastatic Melanoma Patient 36: Metastatic Non-Small Cell Lung Cancer Longitudinal ctDNA BRAF V600E Mutation Status Correlates with Therapy Response1 37 Patient 8: Metastatic Non-Small Cell Lung Cancer Patient 16: Metastatic Colorectal Cancer Urine BRAF V600E ctDNA monitoring has clinical utility to track therapeutic efficacy of targeted therapy in metastatic cancer patients 1Janku et al, AACR 2014 37 |
|
|
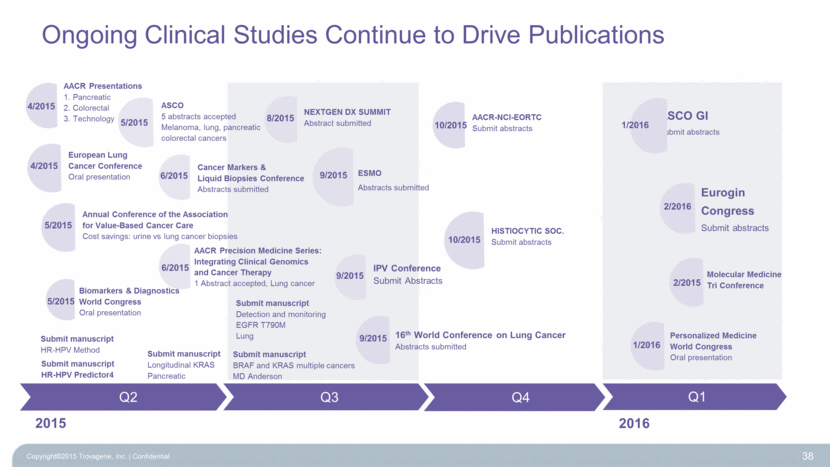
Ongoing Clinical Studies Continue to Drive Publications Copyright©2015 Trovagene, Inc. Confidential 38 2015 AACR-NCI-EORTC Submit abstracts HISTIOCYTIC SOC. Submit abstracts Q3 Q4 Q1 10/2015 10/2015 Submit manuscript BRAF and KRAS multiple cancers MD Anderson AACR Presentations 1. Pancreatic 2. Colorectal 3. Technology IPV Conference Submit Abstracts 4/2015 ASCO 5 abstracts accepted Melanoma, lung, pancreatic colorectal cancers 5/2015 8/2015 9/2015 Submit manuscript Longitudinal KRAS Pancreatic NEXTGEN DX SUMMIT Abstract submitted 16th World Conference on Lung Cancer Abstracts submitted 9/2015 European Lung Cancer Conference Oral presentation 4/2015 ESMO Abstracts submitted 9/2015 Q2 2016 Submit manuscript Detection and monitoring EGFR T790M Lung Submit manuscript HR-HPV Method Submit manuscript HR-HPV Predictor4 Cancer Markers & Liquid Biopsies Conference Abstracts submitted 6/2015 Biomarkers & Diagnostics World Congress Oral presentation 5/2015 AACR Precision Medicine Series: Integrating Clinical Genomics and Cancer Therapy 1 Abstract accepted, Lung cancer 6/2015 Annual Conference of the Association for Value-Based Cancer Care Cost savings: urine vs lung cancer biopsies 5/2015 Eurogin Congress Submit abstracts 2/2016 ASCO GI Submit abstracts 1/2016 Personalized Medicine World Congress Oral presentation 1/2016 Molecular Medicine Tri Conference 2/2015 |
|
|
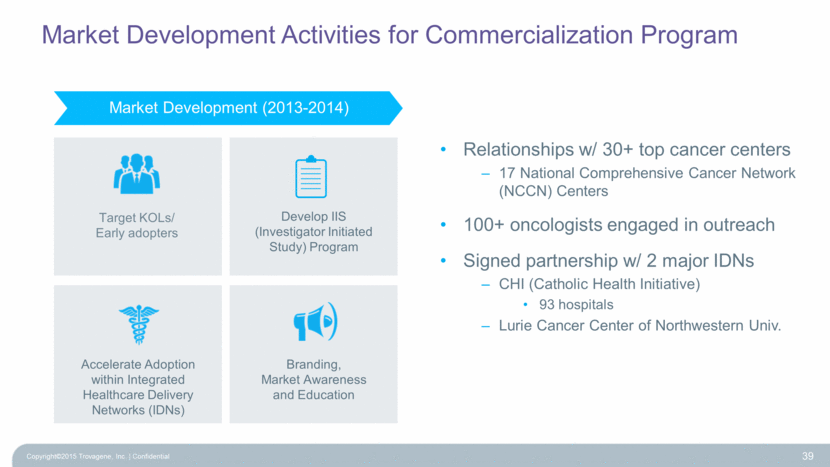
Market Development Activities for Commercialization Program Copyright©2015 Trovagene, Inc. Confidential 39 Target KOLs/ Early adopters Market Development (2013-2014) Full Commercialization (2015) Develop IIS (Investigator Initiated Study) Program Accelerate Adoption within Integrated Healthcare Delivery Networks (IDNs) Branding, Market Awareness and Education Relationships w/ 30+ top cancer centers 17 National Comprehensive Cancer Network (NCCN) Centers 100+ oncologists engaged in outreach Signed partnership w/ 2 major IDNs CHI (Catholic Health Initiative) 93 hospitals Lurie Cancer Center of Northwestern Univ. |
|
|
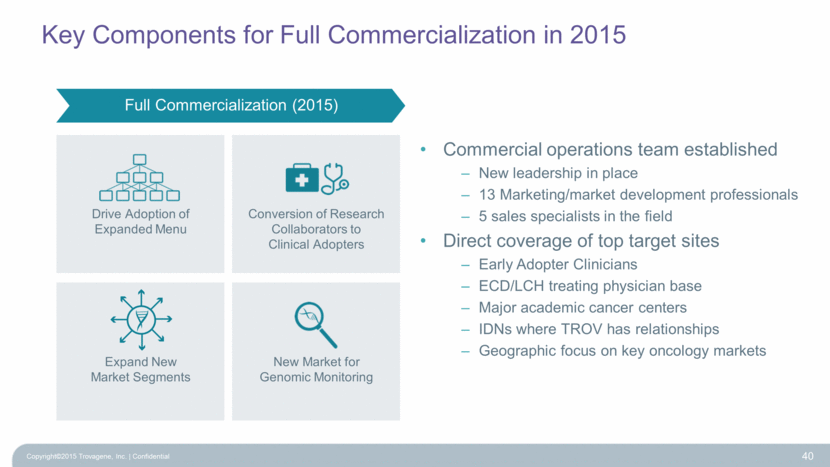
Key Components for Full Commercialization in 2015 Copyright©2015 Trovagene, Inc. Confidential 40 Full Commercialization (2015) Drive Adoption of Expanded Menu Conversion of Research Collaborators to Clinical Adopters Expand New Market Segments New Market for Genomic Monitoring Commercial operations team established New leadership in place 13 Marketing/market development professionals 5 sales specialists in the field Direct coverage of top target sites Early Adopter Clinicians ECD/LCH treating physician base Major academic cancer centers IDNs where TROV has relationships Geographic focus on key oncology markets |
|
|
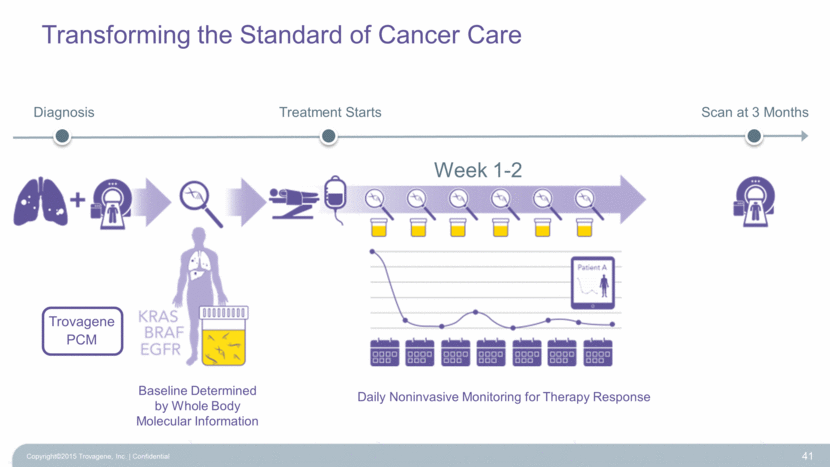
Transforming the Standard of Cancer Care Copyright©2015 Trovagene, Inc. Confidential 41 Treatment Starts Diagnosis Scan at 3 Months Baseline Determined by Whole Body Molecular Information Daily Noninvasive Monitoring for Therapy Response Trovagene PCM Week 1-2 |
|
|
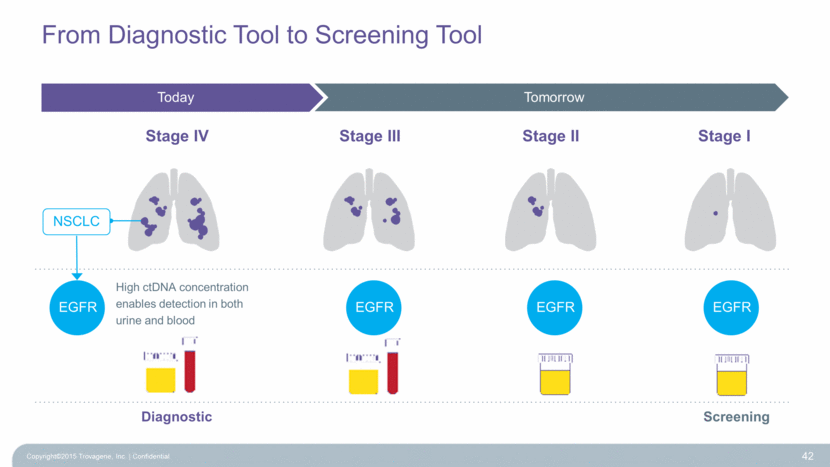
From Diagnostic Tool to Screening Tool Copyright©2015 Trovagene, Inc. Confidential 42 Stage IV High ctDNA concentration enables detection in both urine and blood EGFR Today Stage III Tomorrow Stage II Stage I NSCLC Diagnostic Tomorrow Screening EGFR EGFR EGFR |
|
|
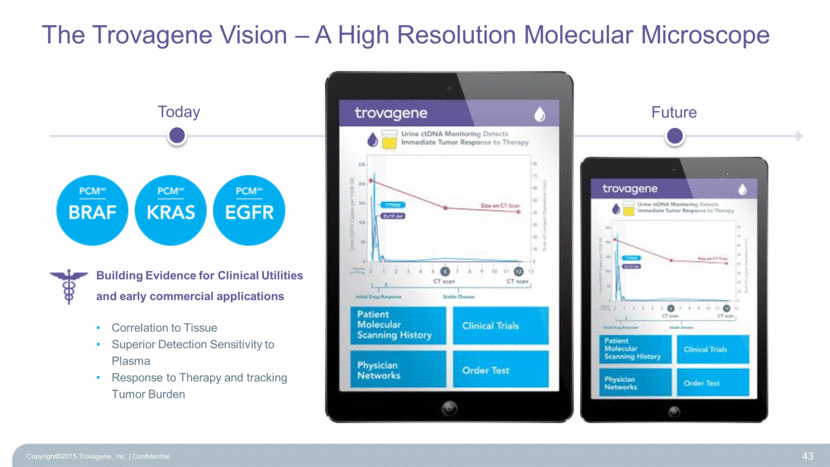
Copyright©2015 Trovagene, Inc. Confidential 43 The Trovagene Vision – A High Resolution Molecular Microscope Future Today Building Evidence for Clinical Utilities and early commercial applications Correlation to Tissue Superior Detection Sensitivity to Plasma Response to Therapy and tracking Tumor Burden |
|
|
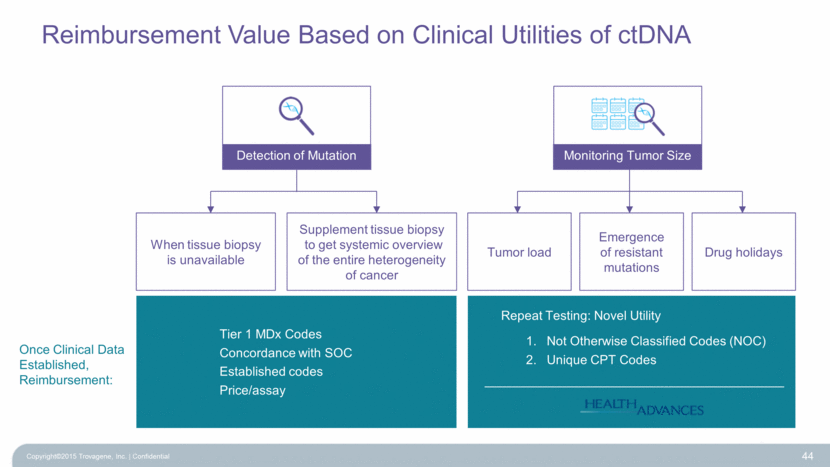
Reimbursement Value Based on Clinical Utilities of ctDNA Copyright©2015 Trovagene, Inc. Confidential 44 Detection of Mutation Monitoring Tumor Size When tissue biopsy is unavailable Tumor load Emergence of resistant mutations Drug holidays Tier 1 MDx Codes Concordance with SOC Established codes Price/assay Repeat Testing: Novel Utility Not Otherwise Classified Codes (NOC) Unique CPT Codes Once Clinical Data Established, Reimbursement: Supplement tissue biopsy to get systemic overview of the entire heterogeneity of cancer |
|
|
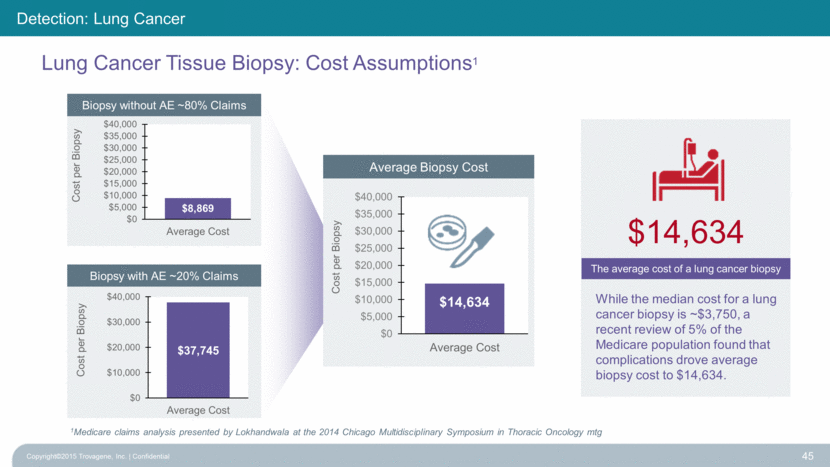
Lung Cancer Tissue Biopsy: Cost Assumptions1 Copyright©2015 Trovagene, Inc. Confidential 45 While the median cost for a lung cancer biopsy is ~$3,750, a recent review of 5% of the Medicare population found that complications drove average biopsy cost to $14,634. 1Medicare claims analysis presented by Lokhandwala at the 2014 Chicago Multidisciplinary Symposium in Thoracic Oncology mtg Detection: Lung Cancer Average Biopsy Cost Biopsy without AE ~80% Claims Biopsy with AE ~20% Claims $14,634 The average cost of a lung cancer biopsy $14,634 $0 $5,000 $10,000 $15,000 $20,000 $25,000 $30,000 $35,000 $40,000 Average Cost Cost per Biopsy $37,745 $0 $10,000 $20,000 $30,000 $40,000 Average Cost Cost per Biopsy $8,869 $0 $5,000 $10,000 $15,000 $20,000 $25,000 $30,000 $35,000 $40,000 Average Cost Cost per Biopsy |
|
|
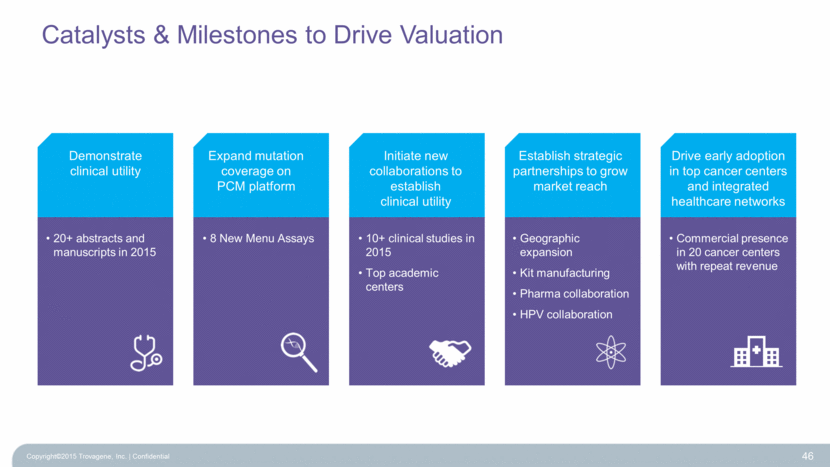
Catalysts & Milestones to Drive Valuation Copyright©2015 Trovagene, Inc. Confidential 46 Demonstrate clinical utility Expand mutation coverage on PCM platform Initiate new collaborations to establish clinical utility Establish strategic partnerships to grow market reach Drive early adoption in top cancer centers and integrated healthcare networks 20+ abstracts and manuscripts in 2015 8 New Menu Assays 10+ clinical studies in 2015 Top academic centers Geographic expansion Kit manufacturing Pharma collaboration HPV collaboration Commercial presence in 20 cancer centers with repeat revenue |
|
|
For further information Please contact: Stephen Zaniboni, CFO szaniboni@trovagene.com Antonius Schuh, CEO aschuh@trovagene.com |

