Attached files
| file | filename |
|---|---|
| 8-K - FORM 8-K - First Internet Bancorp | v411014_8-k.htm |
Exhibit 99.1
Annual Meeting of Shareholders May 18, 2015

PROPOSALS

Election of Directors Proposal 1

Advisory Vote to Approve Executive Compensation Proposal 2

Ratification of Appointment of Independent Registered Public Accounting Firm Proposal 3

VOTING

Safe Harbor This presentation may contain forward - looking statements with respect to the financial condition, results of operations, plans, objectives, future performance or business of the Company. Forward - looking statements are generally identifiable by the use of words such as “believe,” “expect,” “anticipate,” “plan,” “intend,” “estimate,” “may,” “will,” “would,” “could,” “should” or other similar expressions. Forward - looking statements are not a guarantee of future performance or results, are based on information available at the time the statements are made and involve known and unknown risks, uncertainties and other factors that could cause actual results to differ materially from the information in the forward - looking statements. Factors that may cause such differences include: failures of or interruptions in the communications and information systems on which we rely to conduct our business; our plans to grow our commercial real estate and commercial and industrial loan portfolios; competition with national, regional and community financial institutions; the loss of any key members of senior management; fluctuations in interest rates; general economic conditions; risks relating to the regulation of financial institutions; and other factors identified in reports we file with the SEC. All statements in this presentation, including forward - looking statements, speak only as of the date they are made, and the Company undertakes no obligation to update any statement in light of new information or future events.
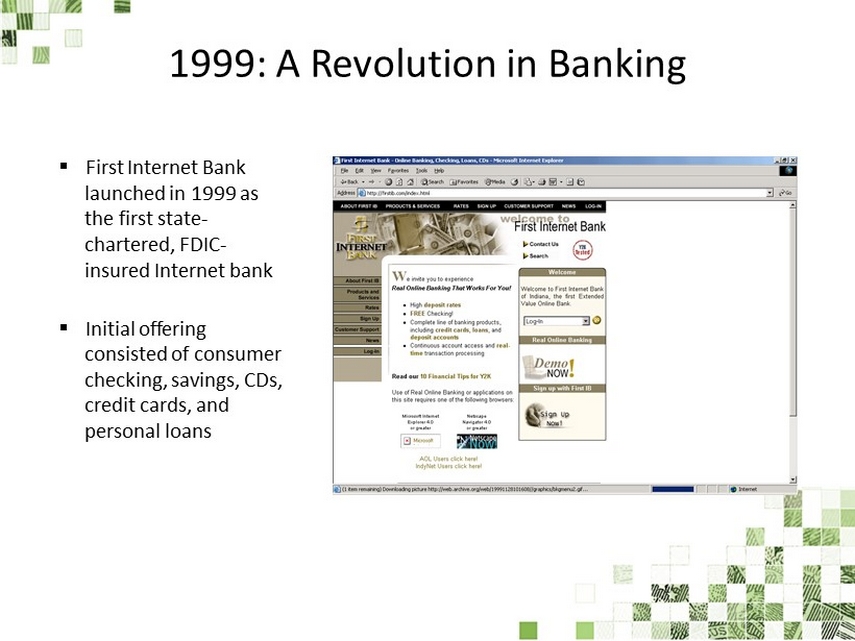
1999: A Revolution in Banking ▪ First Internet Bank launched in 1999 as the first state - chartered, FDIC - insured Internet bank ▪ Initial offering consisted of consumer checking, savings, CDs, credit cards, and personal loans
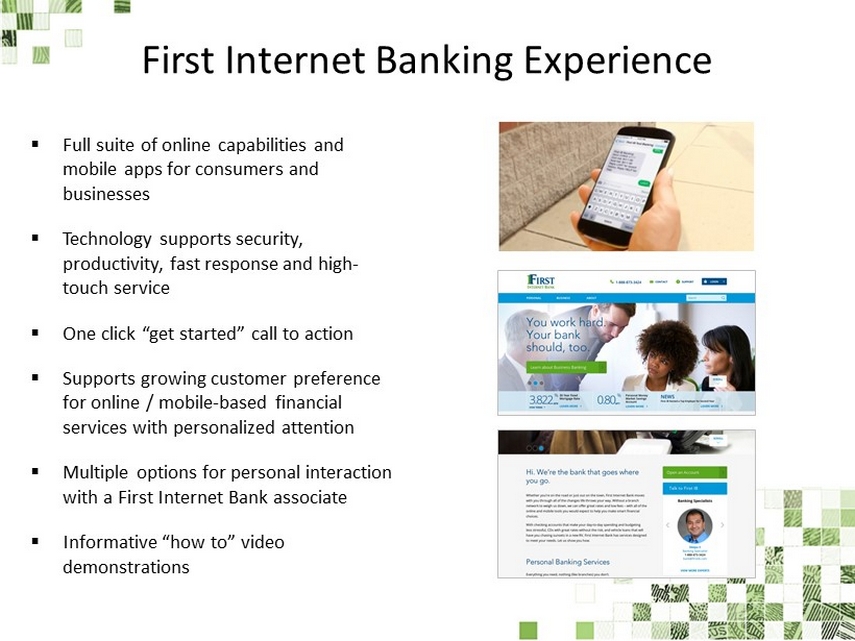
First Internet Banking Experience ▪ Full suite of online capabilities and mobile apps for consumers and businesses ▪ Technology supports security, productivity, fast response and high - touch service ▪ One click “get started” call to action ▪ Supports growing customer preference for online / mobile - based financial services with personalized attention ▪ Multiple options for personal interaction with a First Internet Bank associate ▪ Informative “how to” video demonstrations

Digital Preference ▪ Consumers continue to increasingly embrace digital channels to serve their banking needs ▪ According to a recent study, over 25% of North American consumers would consider switching to a bank with no physical locations Sources: Accenture – The Digital Disruption in Banking; Backbase , December 19, 2014; ABA Survey Preferred Banking Method 2014

Demographics of Digital Banking Sources: Pew Research Center, August 7, 2013; AlixPartners – The Innovation Commitment, May 2014 ▪ According to Pew Research Center, 61% of Internet users bank online and 35% of cell phone users bank using their mobile device ▪ Online and mobile banking users represent attractive demographic segments ▪ Additional research shows that digitally oriented consumers also tend to be desirable and loyal customers ▪ Mobile banking adopters tend to maintain deeper relationships with their primary bank as measured by the average number of products Digital Bankers by Household Income 48% 57% 71% 75% 31% 32% 45% 44% < $30k $30k - $49k $50k - $74k $75k + Mobile Online

2015: Evolution of the Revolution ▪ Commercial and consumer banking services ▪ Asset class and geographic diversity provides ability to generate top tier balance sheet and revenue growth funded by a loyal, efficient and growing deposit base
Strategic Objectives Asset Growth ▪ Expand asset generation channels to continue growth and increase profitability ▪ Maintain strong asset quality and focus on disciplined risk management Revenue Growth ▪ Drive revenue growth and positive operating leverage ▪ Achieve consistent strong profitability Results

ASSET GROWTH Strategic Objective:


Balance Sheet Growth $335.2 $358.2 $501.2 $732.4 $767.7 $585.4 $636.4 $802.3 $970.5 $1,035.7 2011 2012 2013 2014 1Q15 Total Loans Total Assets Source: Company data and SNL Financial. Financial data as of March 31, 2015. Peer data represents media value of component companies. SNL Micro Cap US Banks represent publicly traded micro cap banks with a market capitalization of less than $250 million. Peer data based on index components as of May 15, 2015. Dollar value of Total Loans and Total Assets in millions. Five-Year Total Asset Growth 17% 104% SNL Micro Cap US Banks INBK Total Loans & Total Assets Five-Year Total Loan Growth Five Year Total Deposit Growth 15% 142% SNL Micro Cap US Banks INBK
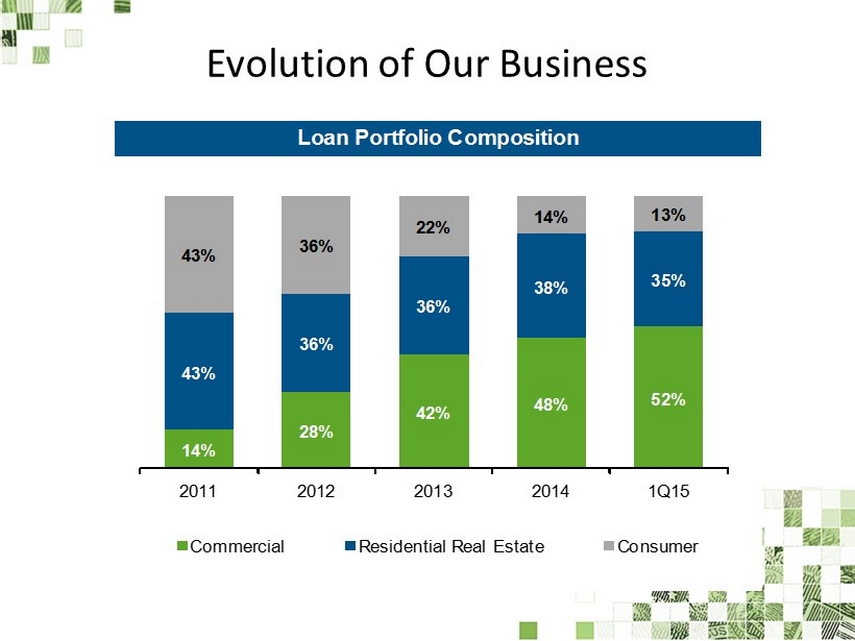
Evolution of Our Business Loan Portfolio Composition 14% 28% 42% 48% 52% 43% 36% 36% 38% 35% 43% 36% 22% 14% 13% 2011 2012 2013 2014 1Q15 Commercial Residential Real Estate Consumer
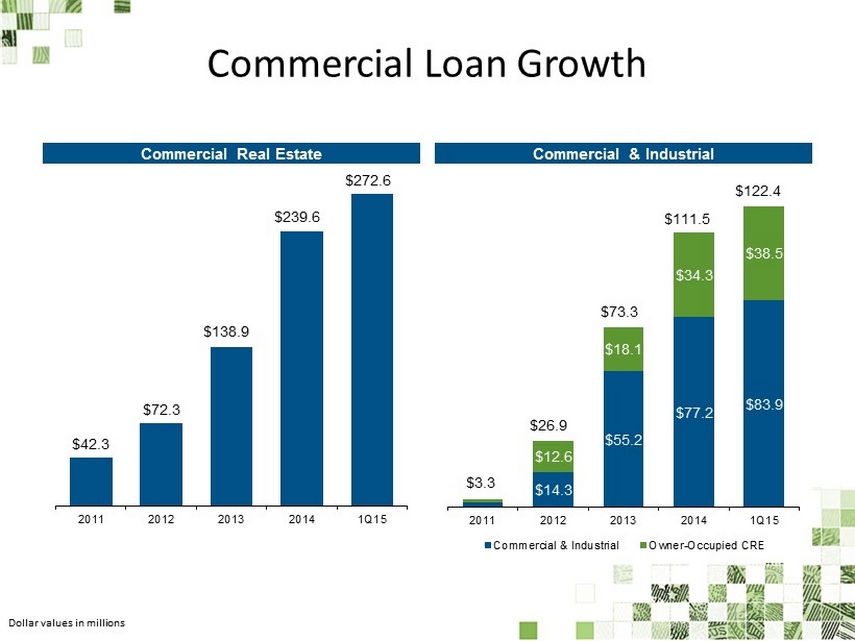
Commercial Loan Growth $42.3 $72.3 $138.9 $239.6 $272.6 2011 2012 2013 2014 1Q15 $14.3 $55.2 $77.2 $83.9 $12.6 $18.1 $34.3 $38.5 2011 2012 2013 2014 1Q15 Commercial & Industrial Owner-Occupied CRE $3.3 $26.9 $73.3 $111.5 $122.4 Commercial Real Estate Commercial & Industrial Dollar values in millions

Asset Quality NPAs / Total Assets NPLs / Total Loans Allowance for Loan Losses / NPLs Net Charge-Offs (Recoveries) / Average Loans 2.29% 1.62% 0.90% 0.50% 0.47% 2011 2012 2013 2014 1Q15 2.64% 1.23% 0.37% 0.04% 0.03% 2011 2012 2013 2014 1Q15 64.6% 133.3% 293.0% 1,959.5% 2,592.7% 2011 2012 2013 2014 1Q15 1.05% 0.69% 0.19% 0.03% - 0.07% 2011 2012 2013 2014 1Q15

REVENUE GROWTH Strategic Objective:

Record Quarterly Net Income $600 $977 $1,282 $1,465 $2,063 $0.13 $0.22 $0.28 $0.32 $0.46 1Q14 2Q14 3Q14 4Q14 1Q15 Net Income Diluted EPS Quarterly net income dollar values in thousands

Net Interest Margin 2.51% 2.61% 2.68% 2.78% 2.84% 1Q14 2Q14 3Q14 4Q14 1Q15

Growth Brings Economies of Scale Dollar values in thousands

Declining Cost of Funds $486.7 $530.7 $673.1 $758.6 $821.2 2.03% 1.58% 1.35% 1.18% 1.12% 2011 2012 2013 2014 1Q15 Deposits Cost of Total Interest-Bearing Liabilities Dollar values in millions

RESULTS Strategic Objective:

Price Performance Comparison 1 Price performance comparison for January 1, 2012 through May 15, 2015. S ource : SNL Financial

Investor Relations www.firstinternetbancorp.com investors@firstib.com NASDAQ: INBK