Attached files
| file | filename |
|---|---|
| 8-K - 8-K - LANDAUER INC | ldr-20150515x8k.htm |
| EX-99.1 - EX-99.1 - LANDAUER INC | ldr-20150515ex9913bb87b.htm |
| EX-99.3 - EX-99.3 - LANDAUER INC | ldr-20150515ex993af4b6d.htm |
 Respect Innovation Honesty Reliability Investor PresentationSecond Quarter 2015 Earnings Presentation
 Safe Harbor Statement Someoftheinformationsharedhere(including,inparticular,thesectiontitled“Fiscal2014Outlook”)constitutesforward-lookingstatementsthatarebasedonassumptionsandinvolvecertainrisksanduncertainties.Theseincludethefollowing,withoutlimitation: assumptions,risksanduncertaintiesassociatedwiththeCompany’sfutureperformance,theCompany’sdevelopmentandintroductionofnewtechnologiesingeneral;theabilitytoprotectandutilizetheCompany’sintellectualproperty;continuedcustomeracceptanceoftheInLighttechnology;theadaptabilityofopticallystimulatedluminescence(OSL)technologytonewplatformsandformats;militaryandothergovernmentfundingforthepurchaseofcertainoftheCompany’sequipmentandservices;theimpactonsalesandpricingofcertaincustomergrouppurchasingarrangements;changesinspendingorreimbursementformedicalproductsorservices;thecostsassociatedwiththeCompany’sresearchandbusinessdevelopmentefforts;theusefulnessofoldertechnologiesandrelatedlicensesandintellectualproperty;theeffectivenessofandcostsassociatedwiththeCompany’sITplatformenhancements;theanticipatedresultsofoperationsoftheCompanyanditssubsidiariesorventures;valuationoftheCompany’slong-livedassetsorbusinessunitsrelativetofuturecashflows;changesinpricingofservicesandproducts;changesinpostalanddeliverypractices;theCompany’sbusinessplans;anticipatedrevenueandcostgrowth;theabilitytointegratetheoperationsofacquiredbusinessesandtorealizetheexpectedbenefitsofacquisitions;therisksassociatedwithconductingbusinessinternationally;costsincurredforpotentialacquisitionsorsimilartransactions;otheranticipatedfinancialevents;theeffectsofchangingeconomicandcompetitiveconditions,includinginstabilityincapitalmarketswhichcouldimpactavailabilityofshortandlong-termfinancing;thetimingandextentofchangesininterestrates;thelevelofborrowings;foreignexchangerates;governmentregulations;accreditationrequirements;changesinthetradingmarketthataffectthecostsofobligationsundertheCompany’sbenefitplans;andpendingaccountingpronouncements.Theseassumptionsmaynotmaterializetotheextentassumed,andrisksanduncertaintiesmaycauseactualresultstobedifferentfromwhatisanticipatedtoday.TheserisksanduncertaintiesalsomayresultinchangestotheCompany’sbusinessplansandprospects,andcouldcreatetheneedfromtimetotimetowritedownthevalueofassetsorotherwisecausetheCompanytoincurunanticipatedexpenses. AdditionalinformationmaybeobtainedbyreviewingtheinformationsetforthinItem1A“RiskFactors”andItem7A“QuantitativeandQualitativeDisclosuresaboutMarketRisk”andinformationcontainedintheCompany'sAnnualReportonForm10-KfortheyearendedSeptember30,2014andotherreportsfiledbytheCompany,fromtimetotime,withtheSecuritiesandExchangeCommission.TheCompanydoesnotundertake,andexpresslydisclaims,anydutytoupdateanyforward-lookingstatementwhetherasaresultofnewinformation,futureeventsorchangesintheCompany’sexpectations,exceptasrequiredbylaw.
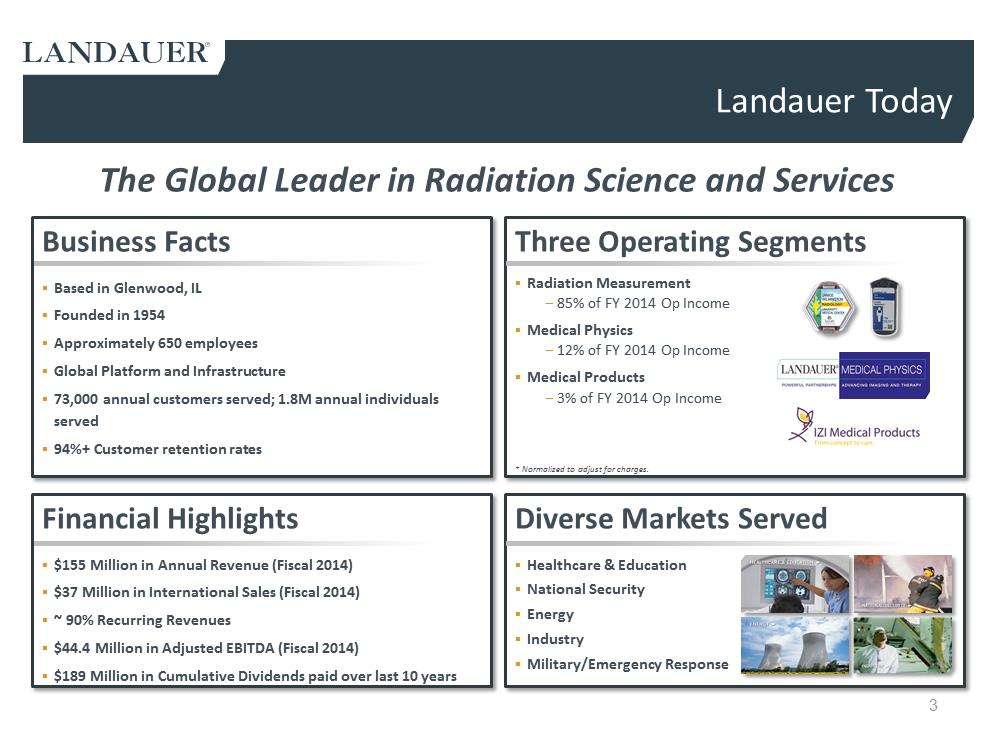 Business Facts Financial Highlights The Global Leader in Radiation Science and Services Landauer Today .$155 Million in Annual Revenue (Fiscal 2014) .$37 Million in International Sales (Fiscal 2014) .~ 90% Recurring Revenues .$44.4 Million in Adjusted EBITDA (Fiscal 2014) .$189 Million in Cumulative Dividends paid over last 10 years .Based in Glenwood, IL .Founded in 1954 .Approximately 650 employees .Global Platform and Infrastructure .73,000 annual customers served; 1.8M annual individuals served .94%+ Customer retention rates Three Operating Segments Diverse Markets Served W:\Logos\Company Logos\IJKL\izi med.jpg Luxel_Waist.png inlight_clip_holder_front_L.png Untitled-1.png .Healthcare & Education .National Security .Energy .Industry .Military/Emergency Response .Radiation Measurement -85% of FY 2014 Op Income .Medical Physics -12% of FY 2014 Op Income .Medical Products -3% of FY 2014 Op Income * Normalized to adjust for charges.
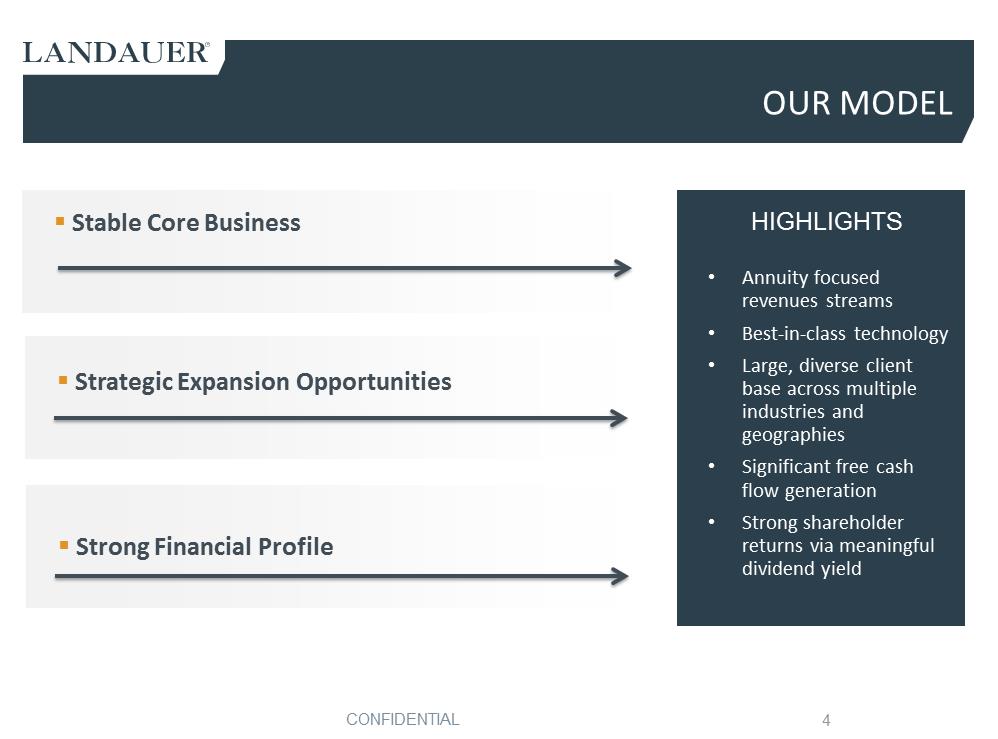 OUR MODEL HIGHLIGHTS •Annuity focused revenues streams •Best-in-class technology •Large, diverse client base across multiple industries and geographies •Significant free cash flow generation •Strong shareholder returns via meaningful dividend yield .Stable Core Business .Strong Financial Profile .Strategic Expansion Opportunities
 Financial Leadership Transition •Dan Fujii named Chief Financial Officer •Kara Venegas named Corporate Controller and Chief Accounting Officer Bolstered Leadership Team •Strengthened internal controls •Returned to normal reporting cycle •Actively working to remediate control issues identified in latest Form 10-K filing Financial Controls Stabilization •Unfavorable foreign currency rates impacted both revenues and operating expenses for the second quarter of 2015 •Adverse impact of foreign currency exchange rates expected to result in financial performance near the lower end of FY’15 revenue guidance Forex Impact Recent Developments
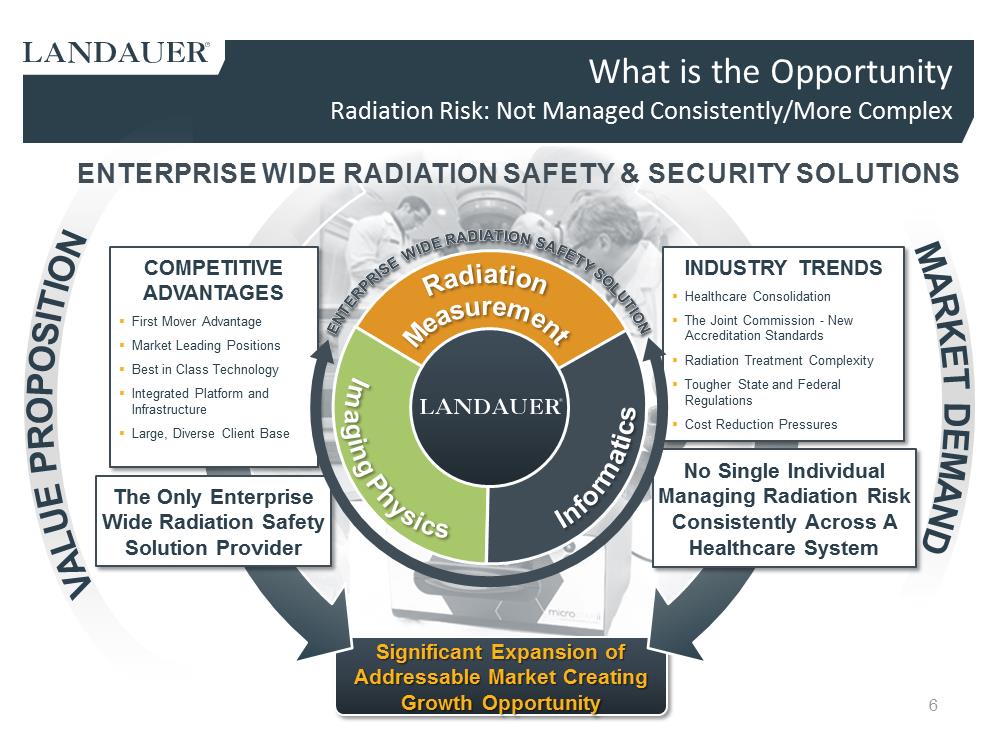 Significant Significant Expansion of Expansion of Addressable Market Creating Addressable Market Creating Growth Opportunity Growth Opportunity V A L U E P R O P O S I T I O N M A R K E T D E M A N D COMPETITIVE ADVANTAGES .First Mover Advantage .Market Leading Positions .Best in Class Technology .Integrated Platform and Infrastructure .Large, Diverse Client Base INDUSTRY TRENDS .Healthcare Consolidation .The Joint Commission -New Accreditation Standards .Radiation Treatment Complexity .Tougher State and Federal Regulations .Cost Reduction Pressures What is the OpportunityRadiation Risk: Not Managed Consistently/More Complex R a d i a t i o n M e a s u r e m e n t I m a g i n g P h y s i c s I n f o r m a t i c s The Only Enterprise Wide Radiation Safety Solution Provider No Single Individual Managing Radiation Risk Consistently Across A Healthcare System E N T E R P R I S E W I D E R A D I A T I O N S A F E T Y S O L U T I O N E N T E R P R I S E W I D E R A D I A T I O N S A F E T Y S O L U T I O N ENTERPRISE WIDE RADIATION SAFETY & SECURITY SOLUTIONS
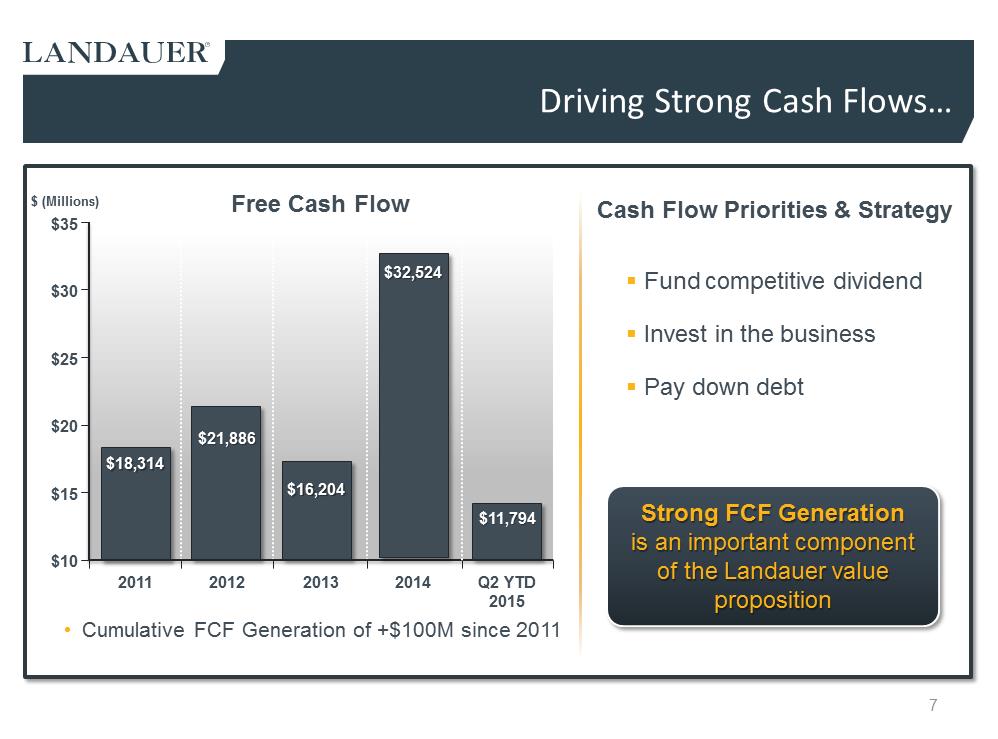 to Driving Strong Cash Flows… .Fund competitive dividend .Invest in the business .Pay down debt 2011 2012 2013 2014 $18,314 $18,314 $10 $20 $21,886 $21,886 $16,204 $16,204 Q2 YTD 2015 $11,794 $11,794 $25 $30 $35 $15 Free Cash Flow •Cumulative FCF Generation of +$100M since 2011 Cash Flow Priorities & Strategy Strong FCF Generation Strong FCF Generation is an important component is an important component of the Landauer value of the Landauer value proposition proposition $ (Millions) $32,524 $32,524
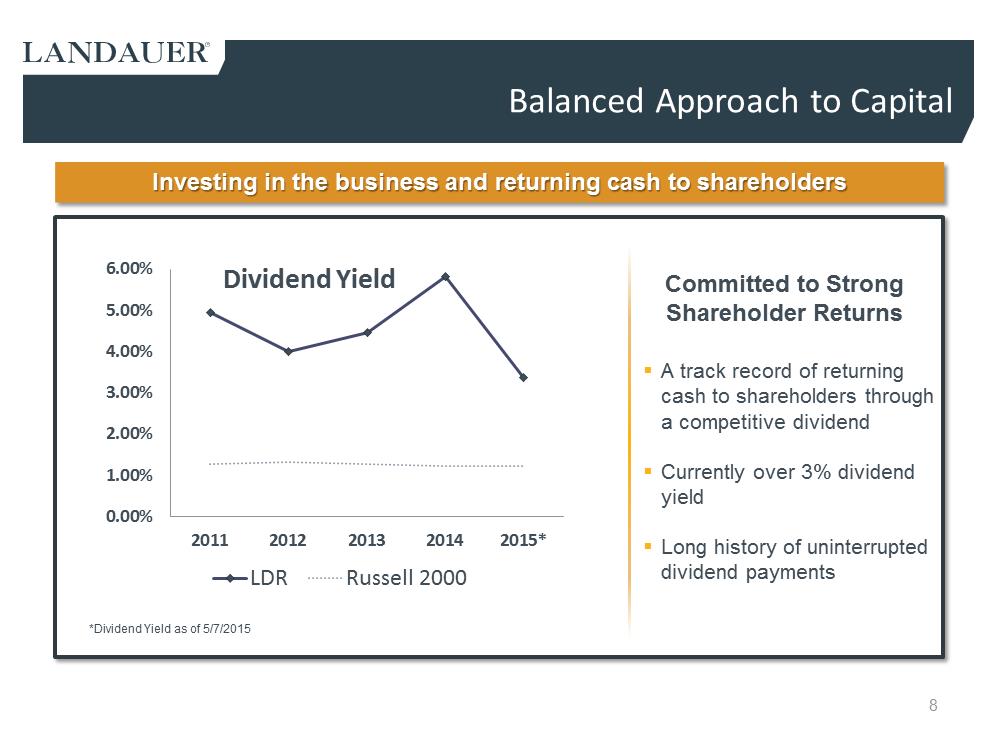 Balanced Approach to Capital Investing in the business and returning cash to shareholders Investing in the business and returning cash to shareholders .A track record of returning cash to shareholders through a competitive dividend .Currently over 3% dividend yield .Long history of uninterrupted dividend payments Committed to Strong Shareholder Returns 0.00% 1.00% 2.00% 3.00% 4.00% 5.00% 6.00% 2011 2012 2013 2014 2015* Dividend Yield LDR Russell 2000 *Dividend Yield as of 5/7/2015
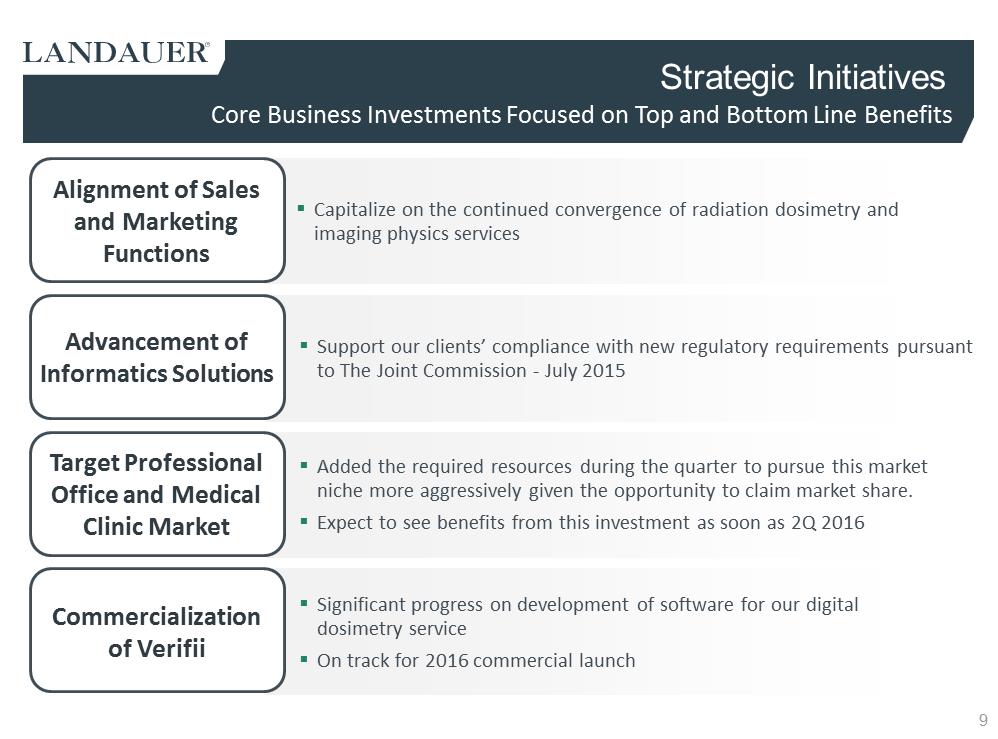 .Capitalize on the continued convergence of radiation dosimetry and imaging physics services .Support our clients’ compliance with new regulatory requirements pursuant to The Joint Commission -July 2015 .Significant progress on development of software for our digital dosimetry service .On track for 2016 commercial launch .Added the required resources during the quarter to pursue this market niche more aggressively given the opportunity to claim market share. .Expect to see benefits from this investment as soon as 2Q 2016 Strategic Initiatives Alignment of Sales and Marketing Functions Target Professional Office and Medical Clinic Market Commercialization of Verifii Advancement of Informatics Solutions Core Business Investments Focused on Top and Bottom Line Benefits
 Financial Overview Respect
Innovation Honesty Reliability 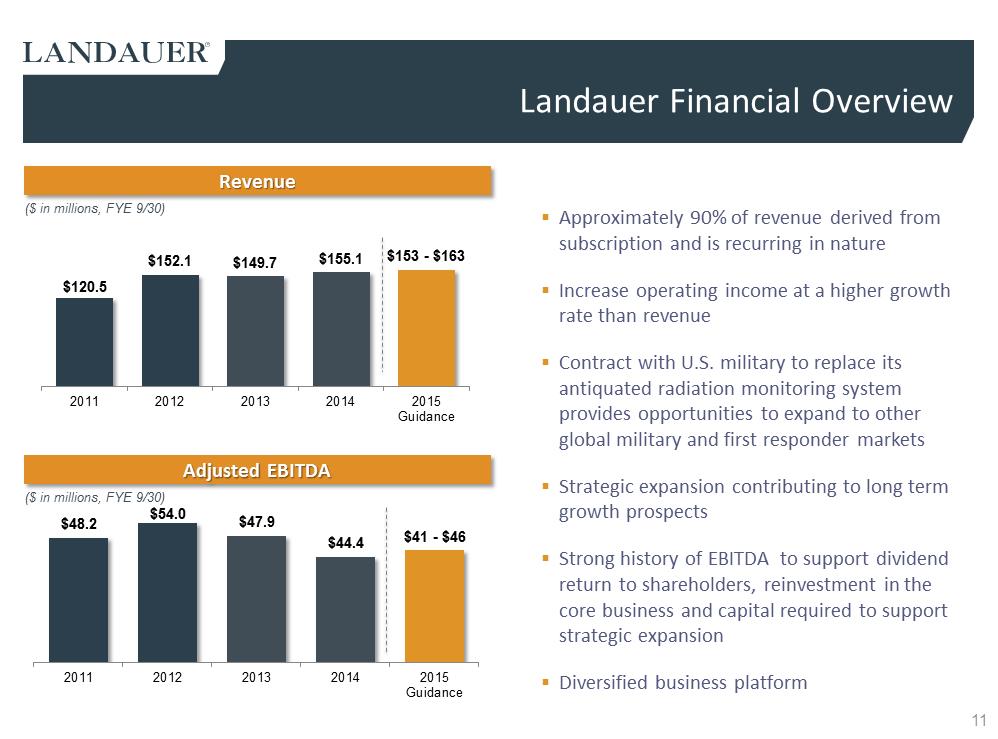 Landauer Financial Overview ($ in millions, FYE 9/30) Revenue Revenue $120.5 $152.1 $149.7 $155.1 $153 -$163 2011 2012 2013 2014 2015Guidance ($ in millions, FYE 9/30) Adjusted EBITDA Adjusted EBITDA $48.2 $54.0 $47.9 $44.4 $41 -$46 2011 2012 2013 2014 2015Guidance .Approximately 90% of revenue derived from subscription and is recurring in nature .Increase operating income at a higher growth rate than revenue .Contract with U.S. military to replace its antiquated radiation monitoring system provides opportunities to expand to other global military and first responder markets .Strategic expansion contributing to long term growth prospects .Strong history of EBITDA to support dividend return to shareholders, reinvestment in the core business and capital required to support strategic expansion .Diversified business platform
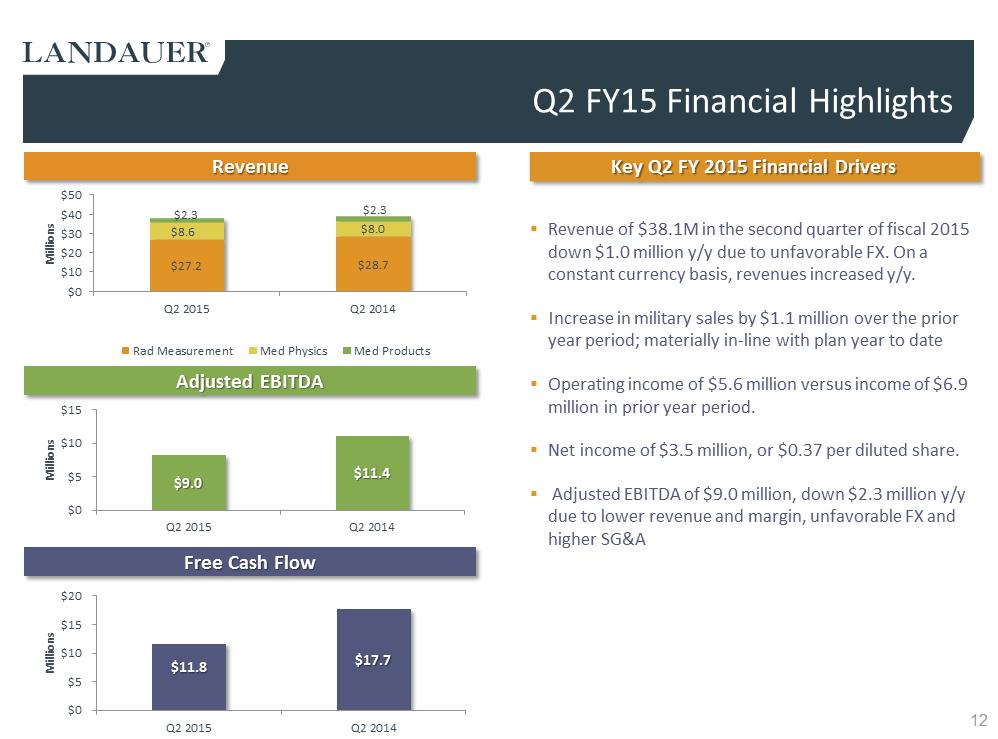 Q2 FY15 Financial Highlights Adjusted EBITDA Adjusted EBITDA .Revenue of $38.1M in the second quarter of fiscal 2015 down $1.0 million y/y due to unfavorable FX. On a constant currency basis, revenues increased y/y. .Increase in military sales by $1.1 million over the prior year period; materially in-line with plan year to date .Operating income of $5.6 million versus income of $6.9 million in prior year period. .Net income of $3.5 million, or $0.37 per diluted share. .Adjusted EBITDA of $9.0 million, down $2.3 million y/y due to lower revenue and margin, unfavorable FX and higher SG&A $9.0 $9.0 $ $11.4 11.4 $0 $5 $10 $15 Q2 2015 Q2 2014 Millions Revenue Revenue Free Cash Flow Free Cash Flow $11.8 $11.8 $17.7 $17.7 $0 $5 $10 $15 $20 Q2 2015 Q2 2014 Millions $27.2 $28.7 $8.6 $8.0 $2.3 $2.3 $0 $10 $20 $30 $40 $50 Q2 2015 Q2 2014 Millions Rad Measurement Med Physics Med Products Key Q2 FY 2015 Financial Drivers Key Q2 FY 2015 Financial Drivers
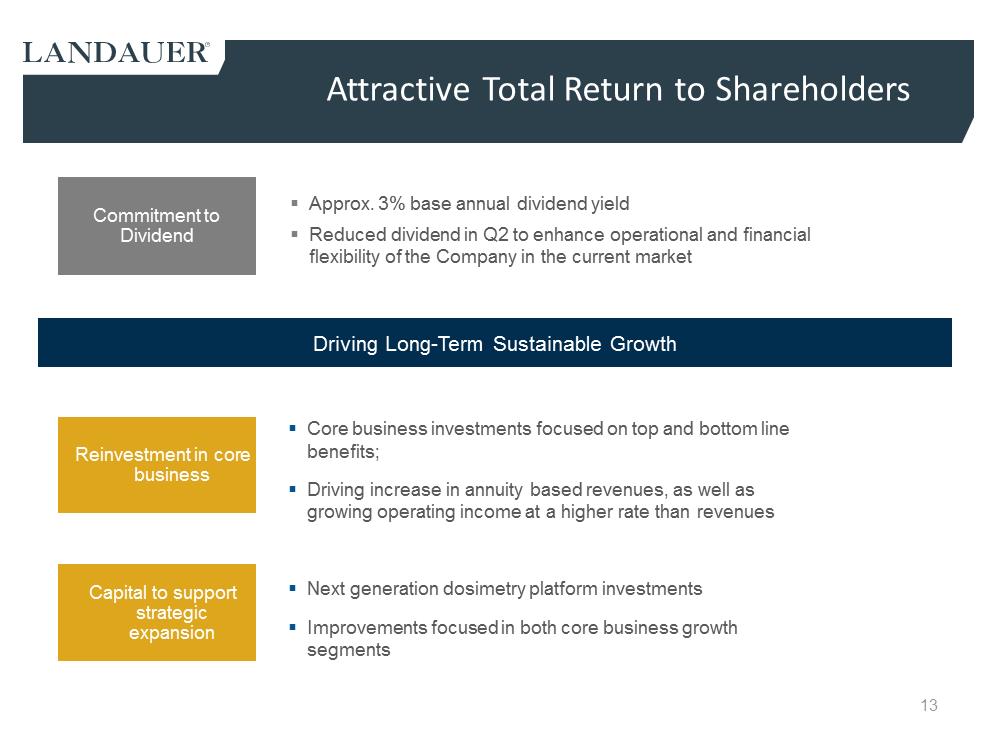 Attractive Total Return to Shareholders Driving Long-Term Sustainable Growth .Approx. 3% base annual dividend yield .Reduced dividend in Q2 to enhance operational and financial flexibility of the Company in the current market Capital to support strategic expansion Reinvestment in core business Commitment to Dividend .Core business investments focused on top and bottom line benefits; .Driving increase in annuity based revenues, as well as growing operating income at a higher rate than revenues .Next generation dosimetry platform investments .Improvements focused in both core business growth segments
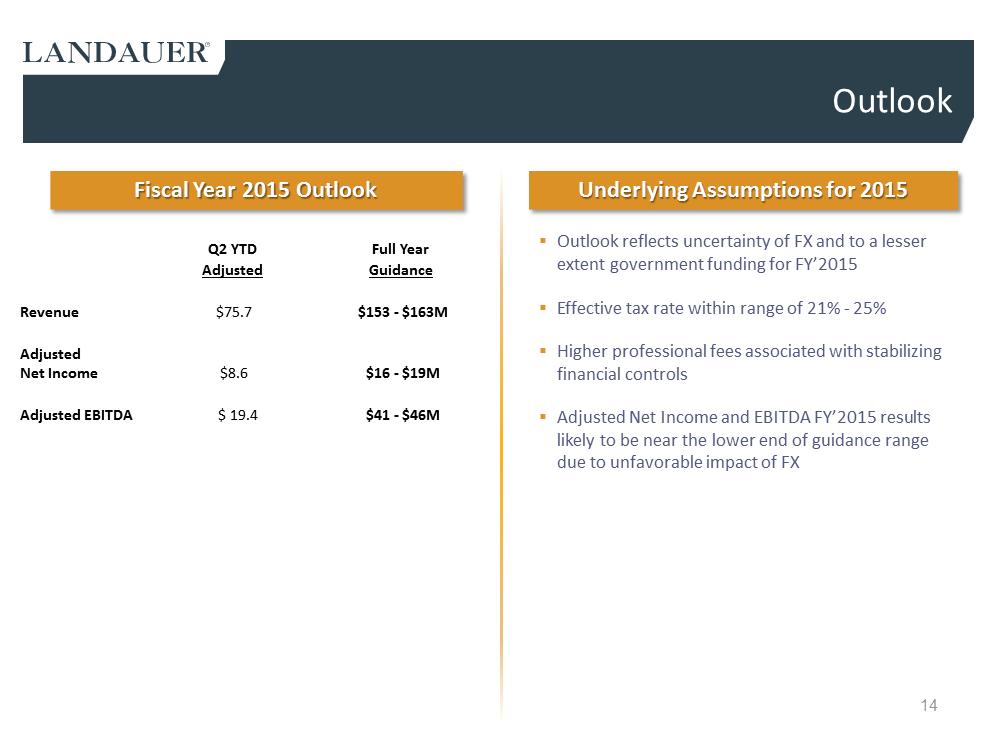 Underlying Assumptions for 2015 Underlying Assumptions for 2015 Fiscal Year Fiscal Year 2015 Outlook 2015 Outlook Outlook .Outlook reflects uncertainty of FX and to a lesser extent government funding for FY’2015 .Effective tax rate within range of 21% -25% .Higher professional fees associated with stabilizing financial controls .Adjusted Net Income and EBITDA FY’2015 results likely to be near the lower end of guidance range due to unfavorable impact of FX Q2 YTD Full Year Adjusted Guidance Revenue $75.7 $153 -$163M Adjusted Net Income $8.6 $16 -$19M Adjusted EBITDA $ 19.4 $41 -$46M
 Appendix Respect Innovation
Honesty Reliability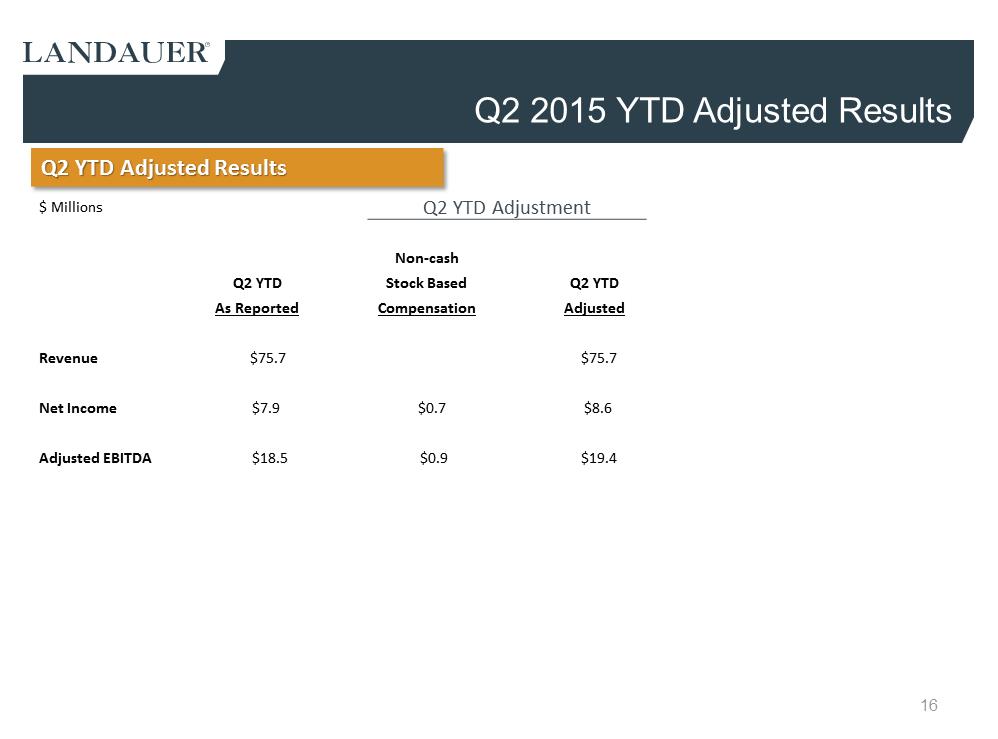 Q2 2015 YTD Adjusted Results $ Millions Q2 YTD Adjustment Non-cash Q2 YTD Stock Based Q2YTD As Reported Compensation Adjusted Revenue $75.7 $75.7 Net Income $7.9 $0.7 $8.6 Adjusted EBITDA $18.5 $0.9 $19.4 Q2 YTD Adjusted Results Q2 YTD Adjusted Results