Attached files
| file | filename |
|---|---|
| 8-K/A - 8-K/A - SOLAREDGE TECHNOLOGIES, INC. | zk1516769.htm |
| EX-99.3 - EXHIBIT 99.3 - SOLAREDGE TECHNOLOGIES, INC. | exhibit_99-3.htm |
Exhibit 99.2

| 1 |
Third Fiscal Quarter 2015
Earnings summary
May 7, 2015

| 2 |
SAFE HARBOR
Use of Forward-Looking Statements
This presentation contains forward-looking statements within the meaning of the Private Securities Litigation Reform Act of 1995. These forward looking
statements include information, among other things, concerning: our possible or assumed future results of operations; future demands for solar energy
solutions; business strategies; technology developments; financing and investment plans; dividend policy; competitive position; industry and regulatory
environment; general economic conditions; potential growth opportunities; and the effects of competition.
Forward-looking statements are only predictions based on our current expectations and are inherently subject to risks and uncertainties. They should not be
considered guarantees of future results, which could differ materially from the results set forth in, contemplated by, or underlying this presentation.
considered guarantees of future results, which could differ materially from the results set forth in, contemplated by, or underlying this presentation.
Factors that could cause actual results to differ materially from our expectations are described in the reports filed by SolarEdge with the Securities and
Exchange Commission and we encourage you to review our filings carefully, especially the sections entitled “Risk Factors” in our Registration Statement on
Form S-1 (including the related prospectus).
Exchange Commission and we encourage you to review our filings carefully, especially the sections entitled “Risk Factors” in our Registration Statement on
Form S-1 (including the related prospectus).
SolarEdge undertakes no duty or obligation to update any forward-looking statements contained in this presentation as a result of new information, future
events or changes in its expectations.
events or changes in its expectations.
This presentation describes non-GAAP net income and non-GAAP net diluted earnings per share, which are not measures prepared in accordance with U.S.
GAAP (i.e. "Non-GAAP" measures). The Non-GAAP measures are presented in this presentation as we believe that they provide investors with a means of
evaluating and understanding how SolarEdge’s management evaluates the company’s operating performance. These Non-GAAP measures should not be
considered in isolation from, as substitutes for, or superior to financial measures prepared in accordance with U.S. GAAP.

| 3 |
KEY OPERATING METRICS
$$$
946K optimizers
shipped
shipped
39K inverters
shipped
shipped
248 Megawatts
shipped
shipped
$86M revenues

| 4 |
FISCAL THIRD QUARTER HIGHLIGHTS
Financial highlights
Record revenue of $86.4 million, up 18% from QoQ; 183% YoY
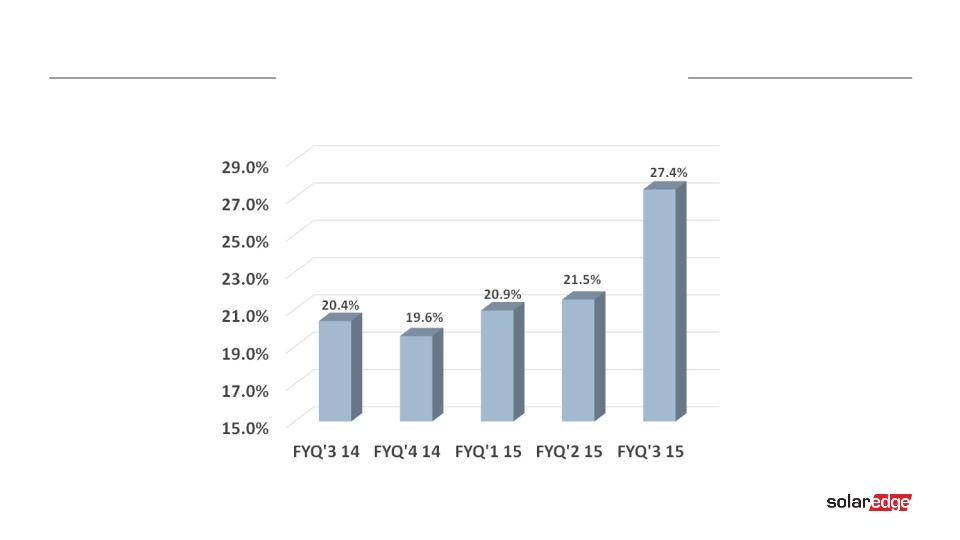
GAAP gross margin of 27.4%
GAAP net income of $6.0 million
Non-GAAP net income of $8.7 million
Business highlights
Increased capacity with contract manufacturers
248 Megawatts AC inverters shipped
946K optimizers and 39K inverters shipped

| 5 |
NOTEWORTHY
Continued on-time development of next generation products to further improve
usability, compliance and efficiency at reduced cost
usability, compliance and efficiency at reduced cost
Inverter prices in the US face pressure, especially from European manufacturers
benefitting from lower Euro/Dollar exchange rate
benefitting from lower Euro/Dollar exchange rate
Natural hedging is required to overcome unstable Euro/Dollar exchange rate

| 6 |
STRATEGY AND TECHNOLOGY
After years of market decline in Germany, we see stabilization of this market
In recent years, while the European market shrunk in size, SolarEdge successfully
increased market share. We are now expecting further growth, primarily in Germany,
the UK and the Netherlands as well as from new potential opportunities in Turkey and
South Africa
increased market share. We are now expecting further growth, primarily in Germany,
the UK and the Netherlands as well as from new potential opportunities in Turkey and
South Africa
We continue to increase our commercial offering with anticipated introduction of a
larger three phase inverter in FYQ4 15
larger three phase inverter in FYQ4 15
Development of storage solutions, mainly for US and Europe expected to create new
business
business
| 7 |
FINANCIAL RESULTS
|
|
USD in millions*
|
FYQ3 '15
|
FYQ2 '15
|
FYQ3 '14
|
|
|
Revenues
|
86.4
|
73.3
|
30.6
|
|
|
Gross margin
|
27.4%
|
21.5%
|
20.4%
|
|
|
Operating expenses
|
13.9
|
11.5
|
10.8
|
|
|
Operating income
|
9.8
|
4.2
|
-4.5
|
|
|
Net income
|
6.0
|
3.4
|
-5.2
|
|
|
Net diluted earnings per share
|
0.01
|
0.00
|
-1.87
|
*with the exception of gross margin and per share data

| 8 |
NON-GAAP FINANCIAL RESULTS
*with the exception of gross margin and per share data
|
|
USD in millions*
|
FYQ3 '15
|
FYQ2 '15
|
FYQ3 '14
|
|
|
Revenues
|
86.4
|
73.3
|
30.6
|
|
|
Gross margin
|
27.6%
|
21.6%
|
20.5%
|
|
|
Operating expenses
|
13.1
|
11.2
|
10.5
|
|
|
Operating income
|
10.8
|
4.7
|
-4.3
|
|
|
Net income
|
8.7
|
4.1
|
-5.0
|
|
|
Net diluted Earnings Per Share
|
0.20
|
0.12
|
-0.19
|

| 9 |
REVENUE GROWTH
183% YoY
USD millions

| 10 |
UNITS SHIPPED
Optimizers shipped
Inverter shipped
K units
Units
| 11 |
GROSS MARGINS

| 12 |
OPERATING EXPENSES
35.3%
25.0%
17.4%
15.8%
16.1%*
* 15.4% excluding IPO related expenses

| 13 |
USD thousands
USD thousands

| 14 |
BALANCE SHEET & CASH FLOW
*FYQ3 ‘15 includes $3.5M related to leasehold improvements
|
|
USD in millions
|
FYQ3 '15
|
FYQ2 '15
|
FYQ3 '14
|
|
|
Cash and investments
|
138.8
|
27.2
|
12.9
|
|
|
Inventory
|
64.5
|
47.6
|
25.2
|
|
|
Capital Expenditures*
|
5.1
|
2.1
|
0.8
|
|
|
Total Debt
|
-
|
4.7
|
19.1
|
|
|
Cash Flow From Operations
|
-13.0
|
9.7
|
-4.9
|

| 15 |
FISCAL FOURTH QUARTER OUTLOOK
Revenues to be within the range of $92-96 million
Gross margin to be within the range of 26%-28%

| 16 |
Appendix

| 17 |
RECONCILIATION OF GAAP TO NON-GAAP
|
|
|
Reconciliation of GAAP to Non-GAAP Gross Profit
|
||||
|
|
|
FYQ3 '15
|
|
FYQ2 '15
|
|
FYQ3 '14
|
|
Gross profit (GAAP)
|
|
23,701
|
|
15,781
|
|
6,229
|
|
Stock-based compensation
|
|
140
|
|
77
|
|
33
|
|
Gross profit (Non-GAAP)
|
|
23,841
|
|
15,858
|
|
6,262
|
|
|
|
|
|
|
|
|
|
|
|
Reconciliation of GAAP to Non-GAAP Gross Margin
|
||||
|
|
|
FYQ3 '15
|
|
FYQ2 '15
|
|
FYQ3 '14
|
|
Gross margin (GAAP)
|
|
27.4%
|
|
21.5%
|
|
20.4%
|
|
Stock-based compensation
|
|
0.2%
|
|
0.1%
|
|
0.1%
|
|
Gross margin (Non-GAAP)
|
|
27.6%
|
|
21.6%
|
|
20.5%
|
|
|
|
|
|
|
|
|
|
|
|
Reconciliation of GAAP to Non-GAAP Operating expenses
|
||||
|
|
|
FYQ3 '15
|
|
FYQ2 '15
|
|
FYQ3 '14
|
|
Operating expenses (GAAP)
|
|
13,902
|
|
11,547
|
|
10,774
|
|
Stock-based compensation R&D
|
|
183
|
|
155
|
|
102
|
|
Stock-based compensation S&M
|
|
292
|
|
152
|
|
74
|
|
Stock-based compensation G&A
|
|
355
|
|
76
|
|
69
|
|
Operating expenses (Non-GAAP)
|
|
13,072
|
|
11,164
|
|
10,529
|

| 18 |
RECONCILIATION OF GAAP TO NON-GAAP
|
|
|
Reconciliation of GAAP to Non-GAAP Operating income (loss)
|
||||
|
|
|
FYQ3 '15
|
|
FYQ2 '15
|
|
FYQ3 '14
|
|
Operating income (loss) (GAAP)
|
|
9,799
|
|
4,234
|
|
(4,545)
|
|
Stock-based compensation
|
|
970
|
|
460
|
|
278
|
|
Operating income (loss) (Non-GAAP)
|
|
10,769
|
|
4,694
|
|
(4,267)
|
|
|
|
|
|
|
|
|
|
|
|
Reconciliation of GAAP to Non-GAAP Finance expenses
|
||||
|
|
|
FYQ3 '15
|
|
FYQ2 '15
|
|
FYQ3 '14
|
|
Finance expenses (GAAP)
|
|
3,436
|
|
458
|
|
626
|
|
Warrants remeasurement
|
|
1,800
|
|
280
|
|
(8)
|
|
Finance expenses (Non-GAAP)
|
|
1,636
|
|
178
|
|
634
|
|
|
|
|
|
|
|
|
|
|
|
Reconciliation of GAAP to Non-GAAP Net income (loss)
|
||||
|
|
|
FYQ3 '15
|
|
FYQ2 '15
|
|
FYQ3 '14
|
|
Net income (loss) (GAAP)
|
|
5,965
|
|
3,375
|
|
(5,238)
|
|
Stock-based compensation
|
|
970
|
|
460
|
|
278
|
|
Warrants remeasurement
|
|
1,800
|
|
280
|
|
(8)
|
|
Net income (loss) (Non-GAAP)
|
|
8,735
|
|
4,115
|
|
(4,968)
|

| 19 |
RECONCILIATION OF GAAP TO NON-GAAP
|
|
|
Reconciliation of GAAP to Non-GAAP Net basic EPS
|
||||
|
|
|
FYQ3 '15
|
|
FYQ2 '15
|
|
FYQ3 '14
|
|
Net basic earnings (loss) per share (GAAP)
|
|
0.01
|
|
0.00
|
|
(1.87)
|
|
Stock-based compensation
|
|
0.03
|
|
0.00
|
|
0.01
|
|
Warrants remeasurement
|
|
0.04
|
|
0.01
|
|
----
|
|
Additional earnings per share giving effect to IPO and conversion of
preferred stock at the beginning of the periods (1) |
|
0.14
|
|
0.12
|
|
1.67
|
|
Net basic earnings (loss) per share (Non-GAAP)
|
|
0.22
|
|
0.13
|
|
(0.19)
|
|
|
|
|
|
|
|
|
|
|
|
Reconciliation of GAAP to Non-GAAP No. of shares used in net basic EPS
|
||||
|
|
|
FYQ3 '15
|
|
FYQ2 '15
|
|
FYQ3 '14
|
|
Number of shares used in computing net basic earnings (loss) per
share (GAAP) |
|
2,822,893
|
|
2,815,694
|
|
2,806,044
|
|
Additional shares giving effect to IPO and conversion of preferred
stock at the beginning of the periods |
|
36,297,931
|
|
28,202,001
|
|
23,697,300
|
|
Number of shares used in computing net basic earnings (loss) per
share (Non-GAAP) |
|
39,120,824
|
|
31,017,695
|
|
26,503,344
|

| 20 |
RECONCILIATION OF GAAP TO NON-GAAP
|
|
|
Reconciliation of GAAP to Non-GAAP Net diluted EPS
|
||||
|
|
|
FYQ3 '15
|
|
FYQ2 '15
|
|
FYQ3 '14
|
|
Net diluted earnings (loss) per share (GAAP)
|
|
0.01
|
|
0.00
|
|
(1.87)
|
|
Stock-based compensation
|
|
0.02
|
|
0.00
|
|
0.01
|
|
Warrants remeasurement
|
|
0.04
|
|
0.01
|
|
----
|
|
Additional earnings per share giving effect to IPO and conversion of
preferred stock at the beginning of the periods (1) |
|
0.13
|
|
0.11
|
|
1.67
|
|
Net diluted earnings (loss) per share (Non-GAAP)
|
|
0.20
|
|
0.12
|
|
(0.19)
|
|
|
|
|
|
|
|
|
|
|
|
Reconciliation of GAAP to Non-GAAP No. of shares used in net diluted EPS
|
||||
|
|
|
FYQ3 '15
|
|
FYQ2 '15
|
|
FYQ3 '14
|
|
Number of shares used in computing net diluted earnings (loss) per
share (GAAP) |
|
7,099,046
|
|
2,815,694
|
|
2,806,044
|
|
Additional shares related Stock-based compensation
|
|
647,474
|
|
3,173,096
|
|
|
|
Additional shares relate to warrants remeasurement adjustment
|
|
103,777
|
|
6,739
|
|
|
|
Additional shares giving effect to IPO and conversion of preferred stock
at the beginning of the periods (1) |
|
36,297,931
|
|
28,202,001
|
|
23,697,300
|
|
Number of shares used in computing net diluted earnings (loss) per
share (Non-GAAP) |
|
44,148,228
|
|
34,197,530
|
|
26,503,344
|
|
|
|
|
|
|
|
|
|
(1) Assumes shares of common stock outstanding after accounting for (i) the automatic conversion of the shares of preferred stock then outstanding
into common stock at the beginning of fiscal year 2015; and (ii) the issuance of 8,050,000 shares of common stock (associated with our initial public offering) at the beginning of the third fiscal quarter instead of the IPO closing date, March 31, 2015. |
||||||

| 21 |
NASDAQ | SEDG