Attached files
| file | filename |
|---|---|
| 8-K - FORM 8-K - RigNet, Inc. | d925361d8k.htm |
 Jefferies TMT Conference
May 13, 2015
“ENABLING THE DIGITAL OIL FIELD”
Exhibit 99.1 |
 Forward-looking Statements
2
Certain
statements
made
in
this
presentation
may
constitute
"forward-
looking
statements"
within
the
meaning
of
the
safe
harbor
provisions
of
the
United
States
Private
Securities
Litigation
Reform
Act
of
1995
—
that
is,
statements
related
to
the
future,
not
past,
events.
Forward-looking
statements
are
based
on
current
expectations
and
include
any
statement
that
does
not
directly
relate
to
a
current
or
historical
fact.
In
this
context,
forward-looking
statements
often
address
our
expected
future
business
and
financial
performance,
and
often
contain
words
such
as
"anticipate,"
"believe,"
"intend,"
"expect,"
"plan"
or
other
similar
words.
Forward-looking
statements
included
in
this
presentation
include,
without
limitation,
statements
regarding
future
average
bandwidth
for
offshore
rigs,
future
ultra-deep
water
rig
supply,
projected
revenue,
EBITDA,
UFCF,
Cash
Earnings
and
Cash
EPS
numbers
for
RigNet.
These
forward-looking
statements
involve
certain
risks
and
uncertainties
that
ultimately
may
not
prove
to
be
accurate.
Actual
results
and
future
events
could
differ
materially
from
those
anticipated
in
such
statements.
Factors
that
could
cause
actual
results
to
differ
materially
from
those
contemplated
in
our
forward-looking
statements
include,
among
others:
adverse
changes
in
economic
conditions
in
the
markets
we
operate;
the
extent,
timing
and
overall
effects
of
competition
in
our
industry;
the
impact
of
new,
emerging
or
competing
technologies;
material
changes
in
the
communications
industry
that
could
adversely
affect
vendor
relationships
with
equipment
and
network
suppliers
and
customer
relationships
with
wholesale
customers;
unfavorable
results
of
litigation
or
intellectual
property
infringement
claims
asserted
against
us;
unanticipated
increases
or
other
changes
in
our
future
cash
requirements;
the
effects
of
federal
and
state
legislation,
and
rules
and
regulations
governing
the
communications
industry;
the
impact
of
equipment
failure,
natural
disasters
or
terrorist
acts;
and
those
additional
factors
set
forth
under
the
caption
“Risk
Factors”
and
other
factors
described
in
our
filings
with
the
SEC,
including
under
the
section
“Management’s
Discussion
and
Analysis
of
Financial
Condition
and
Results
of
Operations”
in
our
Form
10-K
for
the
fiscal
year
December
31,
2014,
and
in
our
Form
10-Q
for
the
quarter
ending
March
31,
2015,
which
is
incorporated
by
reference
herein.
RigNet
undertakes
no
obligation
and
does
not
intend
to
update
these
forward-looking
statements
to
reflect
events
or
circumstances
occurring
after
this
press
release.
You
are
cautioned
not
to
place
undue
reliance
on
these
forward-looking
statements,
which
speak
only
as
of
the
date
of
this
press
release.
All
forward-looking
statements
are
qualified
in
their
entirety
by
this
cautionary
statement.
In
addition
to
U.S.
GAAP
financials,
this
presentation
includes
certain
non-GAAP
financial
measures.
These
non-GAAP
measures
are
in
addition
to,
not
a
substitute
for
or
superior
to,
measures
of
financial
performance
prepared
in
accordance
with
GAAP.
Definitions
of
these
non-GAAP
measures
and
reconciliations
between
certain
GAAP
and
non-GAAP
measures
are
included
in
the
appendix
to
this
presentation. |
 RigNet
Investment Highlights 3
Strong Historic Organic Growth within the Oil and Gas Industry
Growing and Attractive Long-Term Market Runway in the Digital
Oilfield
High Operating Leverage / Free Cash Flow
RigNet (NASDAQ: RNET) provides digital technology solutions for offshore and
onshore drilling rigs, production facilities, energy maritime vessels and
other remote locations, effectively spanning the global oil and gas
industry Strong Balance Sheet with Significant Debt Capacity to Support
Growth
Leverages Best in Class Remote Communications Technologies
Low Customer Churn, Stable End-User Pricing and High Barriers
to Entry |
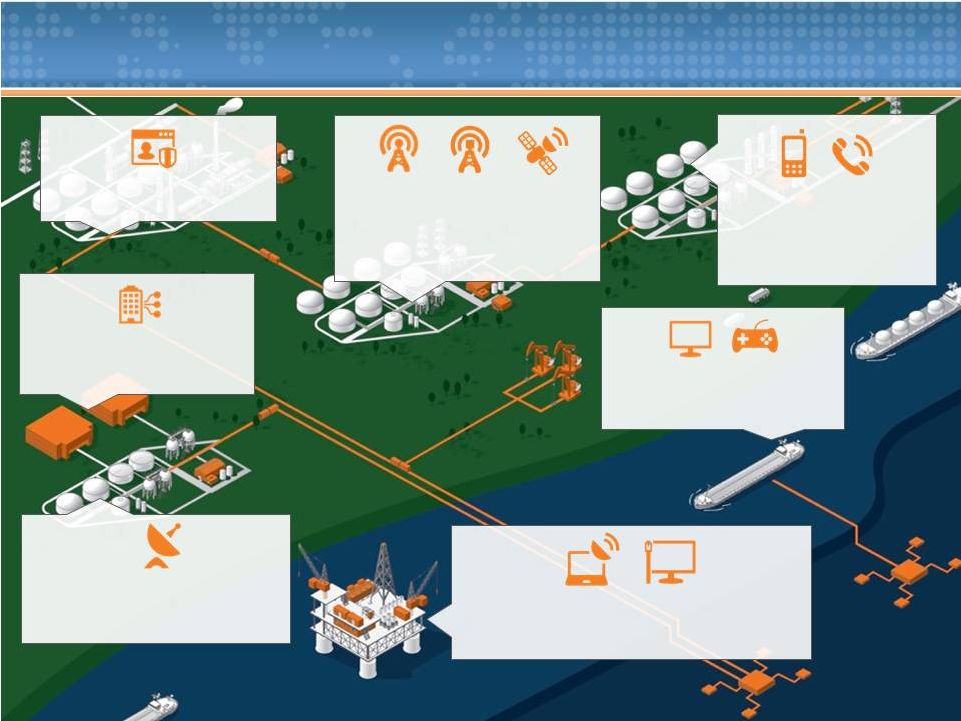
 RigNet
Provides Mission Critical Technology Solutions for the Digital
Oilfield… RigNet
has the experience to provide
“Life of the Field”
solutions beyond just
telecommunications.
•
•
•
RigNet
provides solutions ranging from:
•
•
•
Leverage our digital communications technology
to enhance customers’
productivity
Expertise applies equally to remote
job sites and back-office IT infrastructure
More than 1,200 remote sites in over
50 countries on six continents
Fully-managed voice and data networks
Video
conferencing
and real-time
data
services
Bandwidth intensive “big data”
applications |
 …That Allow Oil and Gas Companies to Operate in a
Productive, Efficient and Safe Manner
5
HARDWARE
Remotely managed appliances
Managed Solution with 24x7 Support
SOLUTIONS
A rich portfolio of innovative
products and collaborative
solutions that allow for improved
performance, minimized risk and
increased efficiency
CONNECTIVITY
Fully managed communication
solution with multiple connectivity
technologies for best performance
capabilities
Complete managed services
solution for Global Connectivity |
 What
Does Fully Managed Digital Technology Mean for RigNet and its Customers?
6
RigNet
provides a fully managed
communications package, bundling network
services and value-added offerings such as
crew welfare enhancements.
This end-to-end connectivity solution
maximizes uptime, reliability and security.
In turn, RigNet benefits from multiple
revenue growth streams:
•
•
•
A majority of this revenue comes from
recurring, multi-tenant business models
under long-term contracts.
Additional sites
ARPU growth from advanced solutions
Multi-tenancy |
 Two Way Radio
and Telephony systems
improve crew
connectivity
and
operational safety
while
reducing NPT
Security systems protect capital
investments
on site and online
Entertainment Systems enhance
crew welfare, training
effectiveness
and
skill retention
Cellular, Microwave and Satellite
Backhaul link services at the edge to
core networks,
delivering true end-
to-end Digital Technology
Solutions worldwide
VSAT and Microwave Systems enable
future proof access, adaptable to
changing bandwidth needs
Remote Access and LAN/WAN Networks
enable Big Data, Industrial Internet of Things and other
data-intensive needs in real time at the edge
End-to-End HQ Integration
improves system performance
and
operational productivity
RigNet Helps Enable The Digital Oilfield
1
NPT –
Non-Productive Time
1 |
 Large
and Attractive Core “Life of the Field” Energy
Market
8
Life of the Field Energy Market
Offshore rigs
(a)
U.S. Onshore
(b)
Production
(a)
Energy Maritime
(a)
Intl land
(b)
Assets
Jackups,
Semisubmersibles
and Drillships
Rigs, Remote
Offices, Man
Camps, etc.
Fixed and Floating
Installations
Supply, Seismic,
Support and
Construction
Rigs, Remote
Offices, Man
Camps, etc.
Characteristics
Highly complex
and regulated
drilling operations
Smaller
installations with
shorter contracts
Long lived assets;
large crew size
drives data needs
Global fleets that
are highly mobile
Stable and growing
markets
Addressable units
760+
850+
8,980+
4,080+
2,300+
RigNet market share
32%
15%
NA
NA
NA
Management estimates that RigNet’s communications day rates
represent <1% of offshore rig day rates
(a) Addressable units exclude scrapped, canceled, cold stacked and assets not yet
delivered (b) Addressable units include only rigs; Intl land count excludes
Russia and Central Asia NA = Not Available
Source: IHS-Petrodata (January 1, 2015), Baker Hughes Rig Count (February 27,
2015), Spears and Associates (December 2014), Company Estimates |
 9
Oil & Gas Asset owners
Oil & Gas Operators
Contractors/Service Companies
Diverse customer base with no excessive concentration
RigNet Supports the Digital Oilfield Needs of a
Blue-Chip Customer Base |
 10
Bandwidth Needs Growing at the Edge
Source:
Northern
Sky
Research,
Energy
Markets
via
Satellite
5 Edition
(February
2015)
1
NPT –
Non-Productive Time
2
TPE –
Transponder Equivalent
Total Oil & Gas VSAT Market
Fixed-Service Satellite (FSS) and
High-Throughput Satellite (HTS)
2014 –
2024 Capacity Demand
Key drivers
•
•
•
Overseeing and directing offshore activities from
onshore decision centers
•
•
Aftermath of BP Macondo spill
•
•
Keeping crews happy and healthy in their off hours
•
•
More remote, harsh and complex
•
Average bandwidth per offshore rig expected
to increase from 1.0 Mbps in 2012 to 2.2
Mbps in 2017
•
Favorable technology changes in downhole
communications and satellite backhaul
(high-throughput satellites)
Video-related services
Integrated operations (reducing NPT
1
)
Safety focus / increased regulatory oversight
Crew welfare
Ultra-deep water exploration
5.0
10.0
15.0
20.0
25.0
30.0
0
20
40
60
80
100
120
2014
2016
2018
2020
2022
2024
Oil & Gas Markets Capacity Demand
By Bands
FSS C-band
FSS Ku-band
GEO-HTS, C
GEO-HTS, Ku
GEO-HTS, Ka
Non-GEO HTS
th |
 Outlook for Ultra-Deep Water (UDW) Market Strong Over the Long-
Term Will Drive the Need for Reliable Remote Communications
(1) Current UDW activity defined as rigs with 7,500’+ water depth capability
and contracted as of March 1, 2015 (2) Visible supply includes rigs with
7,500’+ water depth capability either currently under construction, planned or on order
Source: IHS-Petrodata RigBase Current Activity Data (March 1, 2015)
Future UDW Rig Supply
Current UDW Activity
•
UDW drilling is more complex and remote with high safety, operational and
performance requirements
•
Additional UDW markets are expanding, which requires robust, remote communications in new
areas •
UDW rig supply growing to meet demand
11
38
29
50
Existing UDW
Markets
Emerging UDW
Markets
1
2
1
5
2
5
8
6
RigNet POP
RigNet Offices
RigNet Teleport
RigNet CoreHUB
146
146
146
146
146
146
146
22
25
42
56
65
69
70
168
171
188
202
211
215
216
2014
2015
2016
2017
2018
2019
2020
Delivered
Visable supply
1
2 |
 Growth Driven by Market Share Gains
12
Global Market Share by Revenue
•
RigNet is the only major provider to have grown market share over the past few years
– RigNet’s managed services model is preferred to transport providers
•
RigNet delivers on criteria important to demanding oil and gas customers
•
RigNet is the last remaining independent global provider of remote communications to
the oil and gas industry after recent provider consolidation wave
•
Customer quote from recent industry study: “RigNet is flexible, pragmatic, responsive and they smell like
oil people” (a) 2013 shows RigNet and Stratos market share combined to
illustrate RigNet’s acquisition of the Inmarsat Energy Broadband business
Source: Various; Company analysis
Industry Ranking vs. Key Success Criteria
Global Footprint
Strong
Value-Added
Solutions
Strong
Network
Reliability
Strong
Customer
Support
Strong
’05-’13
7%
15%
22%
30%
38%
14%
6%
7%
6%
51%
48%
44%
43%
43%
27%
31%
26%
21%
19%
100%
100%
100%
100%
100%
2005
2007
2009
2011
2013(a)
RigNet
Stratos
Harris Caprock
Other |
 History of Strong Growth
13
Revenue
1
$ in millions
(1)
2007 –
2013 financials exclude Inmarsat Energy Broadband transaction
(2)
UFCF
defined
as
net
income
(loss)
plus
interest
expense,
income
tax
expense
(benefit),
depreciation
and
amortization,
impairment
of
goodwill,
foreign
exchange
impact
of
intercompany
financing
activities,
(gain)
loss
on
retirement
of
property,
plant
and
equipment,
change
in
fair
value
of
derivatives,
stock-based
compensation, IPO or merger/acquisition costs and related bonuses, restructuring
charges and non-recurring items less capital expenditures Source:
Company data •
High EBITDA margins from operating leverage; favorable free cash
flow
•
Strong balance sheet and debt capacity to support future organic
and inorganic growth
•
All organic growth until Nessco acquired in Q3, 2012 and Inmarsat EE in Q1, 2014
EBITDA and UFCF
1,2
$ in millions
$67
$90
$81
$93
$109
$162
$221
$330
2007
2008
2009
2010
2011
2012
2013
2014
$18
$30
$29
$30
$33
$44
$56
$74
$10
$22
$19
$16
$14
$22
$26
$33
2007
2008
2009
2010
2011
2012
2013
2014
EBITDA
UFCF |
 % margin
21.6%
22.0%
21.4%
8.7%
11.6%
10.8%
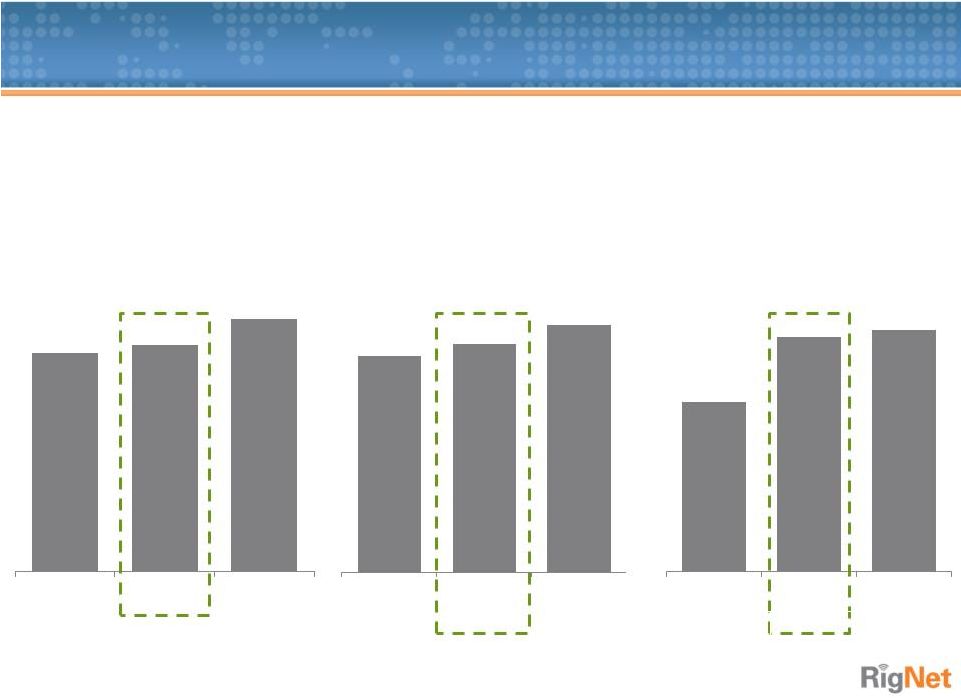
Q1’15 Performance
14
Revenue
$ in millions
EBITDA
$ in millions
UFCF
1
$ in millions
(1)
UFCF
defined
as
net
income
(loss)
plus
interest
expense,
income
tax
expense
(benefit),
depreciation
and
amortization,
impairment
of
goodwill,
foreign
exchange
impact
of
intercompany
financing
activities,
(gain)
loss
on
retirement
of
property,
plant
and
equipment,
change
in
fair
value
of
derivatives,
stock-based
compensation, IPO or merger/acquisition costs and related bonuses, restructuring
charges and non-recurring items less capital expenditures •
Revenue increased to $77.7 million in Q1’15 up 3.5% compared to the same
quarter last year •
Achieved
quarterly
adjusted
EBITDA
of
$17.1
million
up
5.6%
over
the
same
quarter
last
year
•
UFCF
1
of $9.0 million, up 37.9% over the same quarter last year
•
Capital expenditures of $8.1MM were $1.6 million below the same quarter last year,
contributing to even higher cash conversion from lower capital expenditures
in times of cyclically lower volume growth $75.0
$77.7
$86.7
Q1'14
Q1'15
Q4'14
$16.2
$17.1
$18.5
Q1'14
Q1'15
Q4'14
$6.6
$9.0
$9.3
Q1'14
Q1'15
Q4'14 |
 Outstanding Share Price Performance
15
Source: FactSet
5/8/2015:
Up
202% since IPO;
RNET stock price at
$36.28 per share
7/5/2012
Announced
Nessco acquisition;
RNET stock price at
$16.90 per share
12/14/2010:
IPO
priced at $12 per
share
8/1/2013:
Announced acquisition of
Inmarsat Energy Broadband assets and GX
commercial distribution agreement; RNET
stock price at $27.93 per share
8/20/2013:
KKR announced
agreement to acquire 27% of
RigNet from Cubera ; RNET
stock price at $33.63 per share
S&P 500 (indexed)
Annotations
$10.00
$15.00
$20.00
$25.00
$30.00
$35.00
$40.00
$45.00
$50.00
$55.00
$60.00
12/15/2010
9/8/2011
6/2/2012
2/24/2013
11/19/2013
8/13/2014
5/8/2015 |
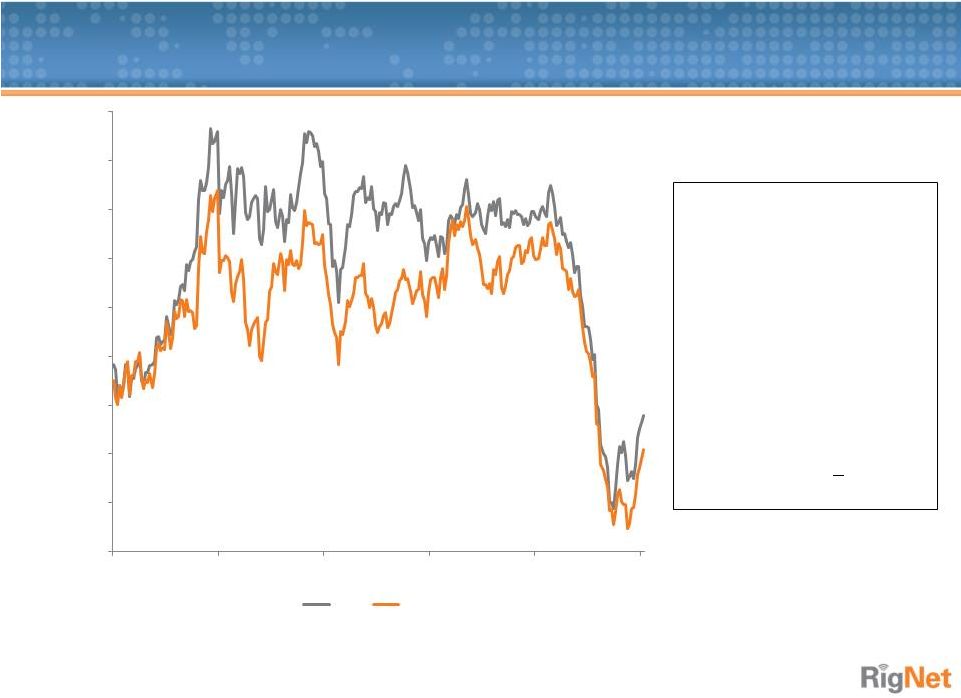 Five
Year Oil Price Chart 16
Source: FactSet
•
Five market downturns
since the late 1980’s
•
Each downturn has lasted 1
–
2 years on average
•
This downturn has occurred
quicker than any other
•
Question is not if
there will
be a recovery, but………
$40.00
$50.00
$60.00
$70.00
$80.00
$90.00
$100.00
$110.00
$120.00
$130.00
5/7/2010
5/6/2011
5/4/2012
5/3/2013
5/2/2014
5/1/2015
Brent
WTI |
 RigNet Investment Highlights
17
Strong Historic Organic Growth within the Oil and Gas Industry
Growing and Attractive Long-Term Market Runway in the Digital
Oilfield
High Operating Leverage / Free Cash Flow
RigNet (NASDAQ: RNET) provides digital technology solutions for offshore and
onshore drilling rigs, production facilities, energy maritime vessels and
other remote locations, effectively spanning the global oil and gas
industry Strong Balance Sheet with Significant Debt Capacity to Support
Growth
Leverages Best in Class Remote Communications Technologies
Low Customer Churn, Stable End-User Pricing and High Barriers
to Entry |
 THANK YOU
18 |
 APPENDIX
19 |
 Reconciliation of Net Income to Adj. EBITDA
20
($ in thousands)
2011
2012
2013
Q1’14
Q2’14
Q3’14
Q4’14
2014
Q1’15
Net income (loss)
$9,752
$12,021
$16,544
$2,308
$5,748
$5,930
$1,997
$15,983
$(942)
Interest expense
1,249
1,552
2,283
481
565
588
551
2,185
511
Depreciation and
amortization
14,584
17,534
21,049
6,797
7,280
7,530
7,855
29,462
8,096
Impairment of goodwill
0
0
0
0
0
0
2,719
2,719
0
Foreign exchange impact
of intercompany financing
activities
0
0
0
0
0
0
856
856
0
(Gain) loss on retirement
of property and
equipment
(165)
(131)
66
(73)
(10)
74
(35)
(44)
(12)
Stock based
compensation
1,534
2,502
2,963
1,148
1,195
1,307
602
4,252
949
Restructuring costs
0
0
0
0
0
0
0
0
6,198
Acquisition costs
0
1,372
4,115
2,332
590
0
0
2,922
0
Income tax expense
6,502
8,733
9,158
3,215
3,438
4,751
3,996
15,400
2,314
Adjusted EBITDA (non-
GAAP measure)
$33,456
$43,583
$56,178
$16,208
$18,806
20,180
18,541
73,735
$17,114 |
 Reconciliation of Net Income to Cash EPS and
Unlevered Free Cash Flow
21
($ in thousands)
Q1’15
Net income (loss)
$(942)
Interest expense
511
Depreciation and amortization
8,096
Impairment of goodwill
0
Foreign exchange impact of intercompany financing activities
0
(Gain) on retirement of property and equipment
(12)
Stock based compensation
949
Restructuring costs
6,198
Acquisition costs
0
Income tax expense
2,314
Adjusted EBITDA (non-GAAP measure)
$17,114
Interest Expense
(511)
Income Tax Expense
(2,314)
Cash Earnings (non-GAAP measure)
$14,289
Diluted Shares
17,463
Cash EPS (non-GAAP measure)
$0.82
Adjusted EBITDA (non-GAAP measure)
$17,114
Capital expenditures
8,073
Unlevered Free Cash Flow (non-GAAP measure)
$9,041 |