Attached files
| file | filename |
|---|---|
| 8-K - 8-K - OMNICARE INC | a8-kshellxboamlhcc2015.htm |

Bank of America Merrill Lynch 2015 Health Care Conference May 2015

2 Forward-Looking Statements Certain of the statements made today and listed within the following presentation slides are forward-looking statements within the meaning of the Private Securities Litigation Reform Act of 1995. These forward-looking statements include, but are not limited to, all statements regarding the intent, belief or current expectations regarding the matters discussed in this presentation. Such forward-looking statements are based on management’s current expectations and involve known and unknown risks, uncertainties, contingencies and other factors that could cause results, performance or achievements to differ materially from those stated. The most significant of these risks and uncertainties are described in the Company’s Form 10-K, Form 10-Q and Form 8-K reports filed with the Securities and Exchange Commission. Investors are cautioned that such statements are only predictions and that actual events or results may differ materially. These forward-looking statements speak only as of the date this presentation was originally given. We undertake no obligation to update such forward-looking statements to reflect events or circumstances after today or to reflect the occurrence of unanticipated events. To facilitate comparisons and enhance understanding of core operating performance, certain financial measures have been adjusted from the comparable amount under Generally Accepted Accounting Principles (GAAP). A detailed reconciliation of adjusted numbers to the most comparable GAAP numbers is posted under “Supplemental Financial Data” in the Investors section of our website at http://ir.omnicare.com. Additionally, all amounts are presented on a continuing operations basis, unless otherwise stated.

3 Agenda Omnicare Background Long-Term Care Group Specialty Care Group 1 2 3 Financial Overview 5 Multi-Layered Growth Strategy 4

1 Omnicare Background

5 Company Journey Transition to an Integrated Healthcare Services Entity Restructuring our business into six core platforms has enabled better integration of our operations and more visibility into growth opportunities Skilled Nursing Pharmacy Assisted Living Pharmacy Brand Support Services Supply Chain Solutions Patient Support Services Specialty Pharmacy Long-Term Care Group Specialty Care Group 2010 Today

6 Omnicare’s Primary Businesses Six Platforms, One Common Value Proposition 1. Revenue for the twelve months ended March 31, 2015 Platforms Customers Market Position Revenue(1) Skilled Nursing Pharmacy Assisted Living Pharmacy Long-Term Care Group Specialty Care Group Brand Support Services Supply Chain Solutions Patient Support Services Specialty Pharmacy Skilled nursing, assisted living, other chronic care settings Industry leader $4.8 billion Patients, providers, caregivers, nurses, physicians, manufacturers Varies by operating platform $1.8 billion Leading provider of complex pharmacy services expanding across patient populations, care settings and pharmaceutical product types

7 Company Journey Business Mix Reflects More Diversification 1. Data for 1Q10 and 1Q15, respectively 2010 Revenue Mix(1) 90.5% 9.5% Long-Term Care Specialty Care 2015 Revenue Mix(1) 72.0% 28.0% Long-Term Care Specialty Care Rapid growth within our Specialty Care Group has accelerated our objective of becoming a diversified healthcare service provider

2 Long-Term Care Group

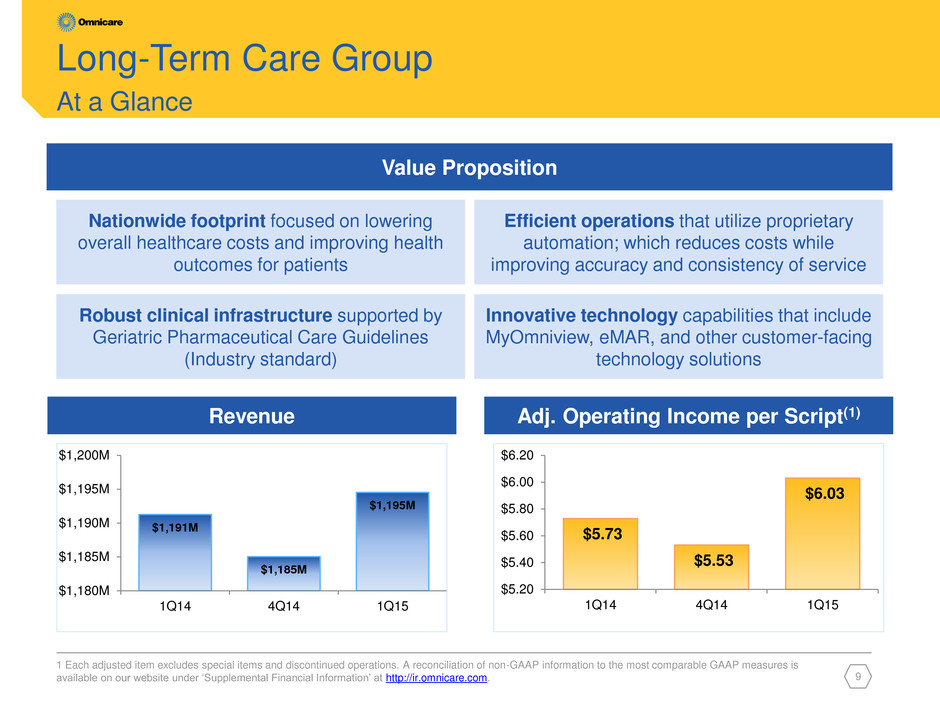
9 Long-Term Care Group At a Glance 1 Each adjusted item excludes special items and discontinued operations. A reconciliation of non-GAAP information to the most comparable GAAP measures is available on our website under ‘Supplemental Financial Information’ at http://ir.omnicare.com. Value Proposition Nationwide footprint focused on lowering overall healthcare costs and improving health outcomes for patients Efficient operations that utilize proprietary automation; which reduces costs while improving accuracy and consistency of service Robust clinical infrastructure supported by Geriatric Pharmaceutical Care Guidelines (Industry standard) Innovative technology capabilities that include MyOmniview, eMAR, and other customer-facing technology solutions $1,191M $1,185M $1,195M $1,180M $1,185M $1,190M $1,195M $1,200M 1Q14 4Q14 1Q15 Revenue Adj. Operating Income per Script(1) $5.73 $5.53 $6.03 $5.20 $5.40 $5.60 $5.80 $6.00 $6.20 1Q14 4Q14 1Q15

10 Market Dynamics Long-Term Care Aging Population Shaping US Healthcare System(1) • Senior population expected to grow 21% by 2020(1) • Seniors’ utilization of pharmaceuticals is more than three times higher than the general population(2) 1. U.S. Census Bureau. 2. IMS – The Use of Medicines in the United States: Review of 2011 250 300 350 400 450 In M il li o n s M il li on s Aged 85+ Aged 65 - 84 Under 65

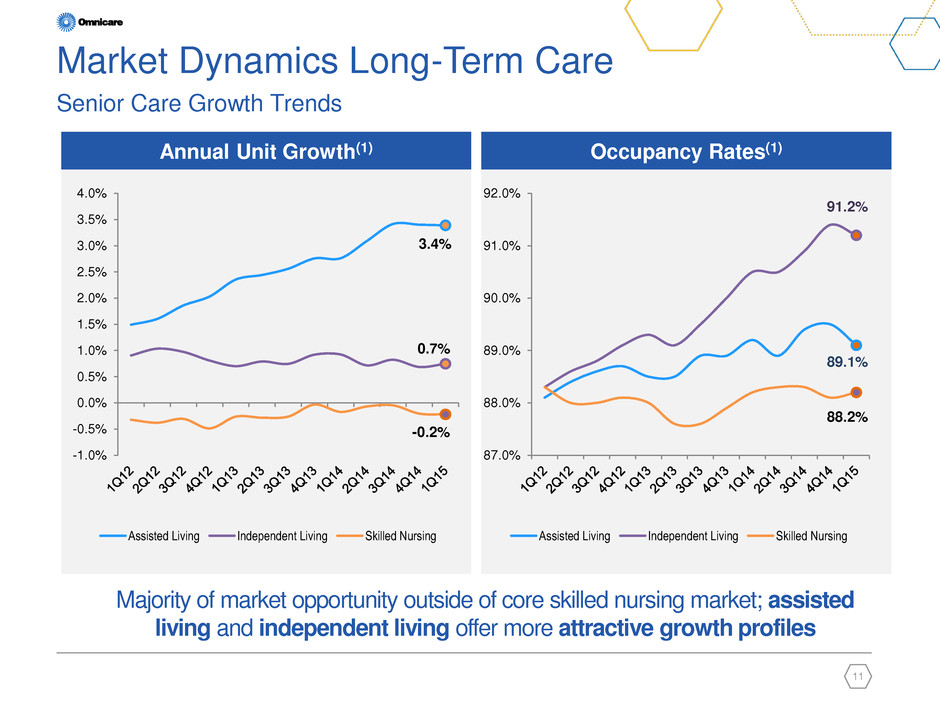
11 Annual Unit Growth(1) Occupancy Rates(1) 3.4% 0.7% -0.2% -1.0% -0.5% 0.0% 0.5% 1.0% 1.5% 2.0% 2.5% 3.0% 3.5% 4.0% Assisted Living Independent Living Skilled Nursing 89.1% 91.2% 88.2% 87.0% 88.0% 89.0% 90.0% 91.0% 92.0% Assisted Living Independent Living Skilled Nursing Market Dynamics Long-Term Care Senior Care Growth Trends Majority of market opportunity outside of core skilled nursing market; assisted living and independent living offer more attractive growth profiles

3 Specialty Care Group

13 Specialty Care Group At a Glance Value Proposition Manufacturer partner programs providing customized integrated solutions Dedicated clinical specialists manage programs that improve access to therapy Coordination and adherence programs reduce costs and lead to improved patient outcomes Enhanced capabilities and infrastructure supporting the unique needs of biologics $380M $443M $465M $200M $275M $350M $425M $500M 1Q14 4Q14 1Q15 Revenue Physician Sales Referrals (Average/Day) 47.1 57.5 69.6 - 15.0 30.0 45.0 60.0 75.0 1Q14 4Q14 1Q15

14 Growth in Specialty Market Specialty products expected to account for 41% of U.S. sales by 2020(1) 1. EvaluatePharma®: World Preview 2014, Outlook to 2020 – June 2014, and proprietary reporting from EvaluatePharma® Within the top 100 prescription products, biologics have seen a rapid increase in share from 21% in 2006 to an expected 52% by 2020 Omnicare Distribution Center and Repackaging Facility 10% 15% 20% 25% 30% 35% 40% 45% 2006 2007 2008 2009 2010 2011 2012 2013 2014 2015 2016 2017 2018 2019 2020 Share of U.S. Biotechnology Sales Top 100 Prescription Products 21% 79% Biotech Conventional 45% 55% Biotech Conventional 52% 48% Biotech Conventional 2006 2013 2020

15 Specialty Market Overview Increased Pharm Outsourcing Driving Commercialization Service Providers 1. Contract Pharma Outsourcing Survey (2009, 2013) Pharma outsourcing increasing due to industry consolidation and manufacturers’ increased focus on agility, core competencies, and R&D % Change in Pharma Outsourcing Expected During Next Year(1) 39% 25% 36% Increase No Change Decrease 47% 24% 29% Increase No Change Decrease 2009 2013

4 Multi-Layered Growth Strategy

17 Multi-Layered Growth Strategy Key Components to 2015 Growth Objectives Omnicare Distribution Center and Repackaging Facility Long-Term Care Specialty Care Commercialization Efforts Capture share in SNF; capitalize on market growth in ALF Generic sourcing strategy opportunities Expand into adjacent markets (e.g., MRDD, PACE) Value-based payer relationships LTC operational enhancements Capitalize on strong fee-for-service pipeline Robust specialty pharmacy growth Innovative model developments Operating Efficiencies Branded and specialty drug procurement optimization Capital Structure and Allocation Leverage existing infrastructure and optimize footprint Enterprise-wide process standardization Information technology and business process efficiencies Align capital structure with growth strategy Continued investments in business, bolt-on acquisitions Return capital to shareholders

5 Financial Overview

19 Financial Results Consolidated Quarter Trends 1. Each adjusted item excludes special items and discontinued operations. A reconciliation of non-GAAP information to the most comparable GAAP measures is available on our website under ‘Supplemental Financial Information’ at http://ir.omnicare.com 2. 2014 cash flow from operations excludes the impact of the $120 million settlement payment made in 3Q14. Percent returned calculated off reported cash flows $390M $355M $492M $828M $475M(2) $612M(2) $948M(2) 2Q14 3Q14 4Q14 1Q15 53% of CFFO Returned to Shareholders(2) Adjusted Cash EPS(1) Cumulative Cash Flow from Operations Adjusted EBITDA(1) Revenue $1,611M $1,608M $1,628M $1,660M 2Q14 3Q14 4Q14 1Q15 $176M $180M $184M $190M 2Q14 3Q14 4Q14 1Q15 $0.91 $0.94 $0.96 $1.02 2Q14 3Q14 4Q14 1Q15

20 First Quarter Successful Beginning to 2015(1) Disciplined Approach to Growth Through Optimization of Core Competencies and Driving Efficiency in Operations 1. Percentages represent year-over-year increases from 1Q 2014 Increase in Revenue 6% Increase in Adjusted Cash Earnings per Share 12% Increase in Cash Flows From Continuing Operations 96%
