Attached files
| file | filename |
|---|---|
| 8-K - FORM 8-K - Manitex International, Inc. | d923742d8k.htm |
| EX-99.1 - EX-99.1 - Manitex International, Inc. | d923742dex991.htm |
 “Focused manufacturer
of engineered lifting
equipment”
Manitex International, Inc.
(NASDAQ:MNTX)
Conference Call
First Quarter 2015
May 11th, 2015
Exhibit 99.2 |
 2
Forward Looking Statements &
Non GAAP Measures
“Focused manufacturer
of engineered lifting
equipment”
Safe Harbor Statement under the U.S. Private Securities Litigation Reform Act of
1995: This presentation contains statements that are forward-looking in
nature which express the beliefs and expectations of management including
statements regarding the Company’s expected results of operations or liquidity;
statements concerning projections, predictions, expectations, estimates or forecasts
as to our business, financial and operational results and future economic
performance; and statements of management’s goals and objectives and
other similar expressions concerning matters that are not historical facts. In some
cases, you can identify forward-looking statements by terminology such as
“anticipate,” “estimate,”
“plan,”
“project,”
“continuing,”
“ongoing,”
“expect,”
“we believe,”
“we intend,”
“may,”
“will,”
“should,”
“could,”
and similar expressions. Such statements are based on current plans, estimates and
expectations and involve a number of known and unknown risks, uncertainties
and other factors that could cause the Company's future results, performance
or achievements to differ significantly from the results, performance or
achievements expressed or implied by such forward-looking statements. These factors and additional
information are discussed in the Company's filings with the Securities and Exchange
Commission and statements in this presentation should be evaluated in light of
these important factors. Although we believe that these statements are based
upon reasonable assumptions, we cannot guarantee future results.
Forward-looking statements speak only as of the date on which they are made, and
the Company undertakes no obligation to update publicly or revise any
forward-looking statement, whether as a result of new information, future
developments or otherwise. Non-GAAP
Measures:
Manitex
International
from
time
to
time
refers
to
various
non-GAAP
(generally
accepted accounting principles) financial measures in this presentation.
Manitex believes that this information is useful to understanding its
operating results without the impact of special items. See Manitex’s
First Quarter 2015 Earnings Release on the Investor Relations section of our website
www.manitexinternational.com
for a description and/or reconciliation of these measures.
|
 3
“Focused manufacturer
of engineered lifting
equipment”
Overview
•
Cost reductions through sourcing and operating efficiency initiatives
•
Continued integration of ASV and PM Group
•
Optimize our capital allocation, multi year process:
Invest in and grow our higher margin businesses-PM, ASV, Manitex are our
portfolio’s “top producers”
with respect to margins and addressable markets
Consider
“addition
by
subtraction”
for
lower
margin
units
that
could
have
synergies elsewhere
All proceeds to retire debt and bring our capital ratios to historic ranges
|
 4
“Focused manufacturer
of engineered lifting
equipment”
Commercial Overview
Q1 market conditions generally slow.
Growth of 2% over 12/31/2014
Broad based order book: ASV 10%, PM 15% Manitex 75%
3/31/15 Backlog of $109.6 million (12/31/14, $107.3 million; 3/31/14,
$100.0 million): PM
ASV
Significant
activity
and
interest
related
to
our
new
acquisition
products.
Oil and gas demand significantly lower
N. American general construction demand for our equipment flat in the
quarter European and international markets modest improvement,
together with benefit from more competitive Euro.
|
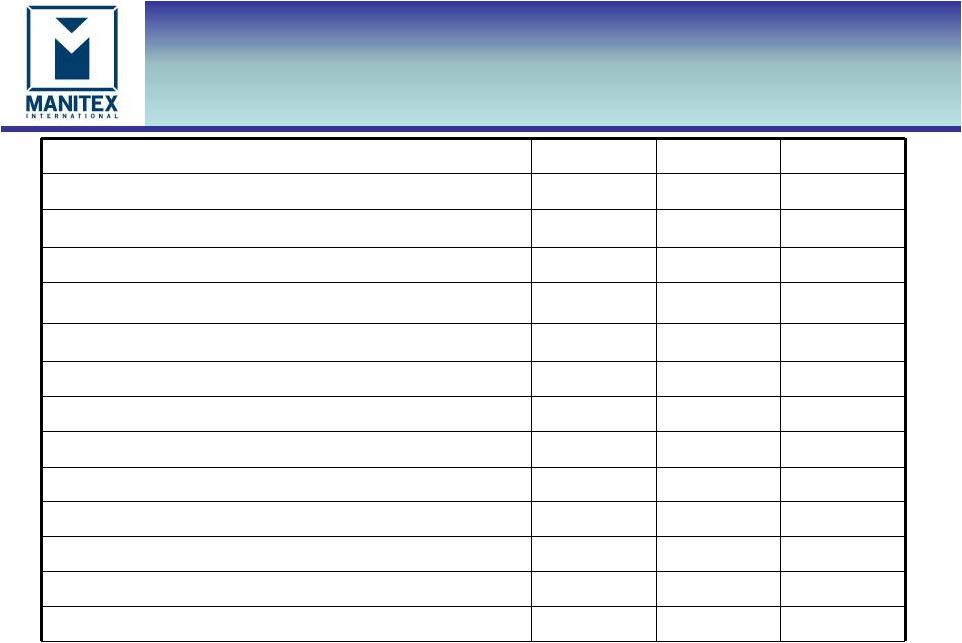 5
Key Figures -
Quarterly
“Focused manufacturer
of engineered lifting
equipment”
USD thousands
Q1-2015*
Q1-2014
Q4-2014*
Net sales
$105,882
$62,576
$66,909
% change in Q1-2015 to prior period
69.2%
58.3%
Gross profit
21,163
11,604
12,623
Gross margin %
20.0%
18.5%
18.9%
Operating expenses
15,993
7,993
8,531
Adjusted Net Income
$1,518
1,877
2,185
Adjusted Earnings Per Share
$0.10
$0.14
$0.16
Adjusted Ebitda
8,030
4,722
5,330
Adjusted Ebitda % of Sales
7.6%
7.5%
8.0%
Working capital
98,938
75,171
89,970
Current ratio
1.8
2.5
2.1
Backlog
109,625
100,023
107,327
% change in Q1-2015 to prior period
9.6%
2.1%
*As adjusted. See reconciliation to US GAAP on appendix
|
 6
“Focused
manufacturer of
engineered lifting
equipment”
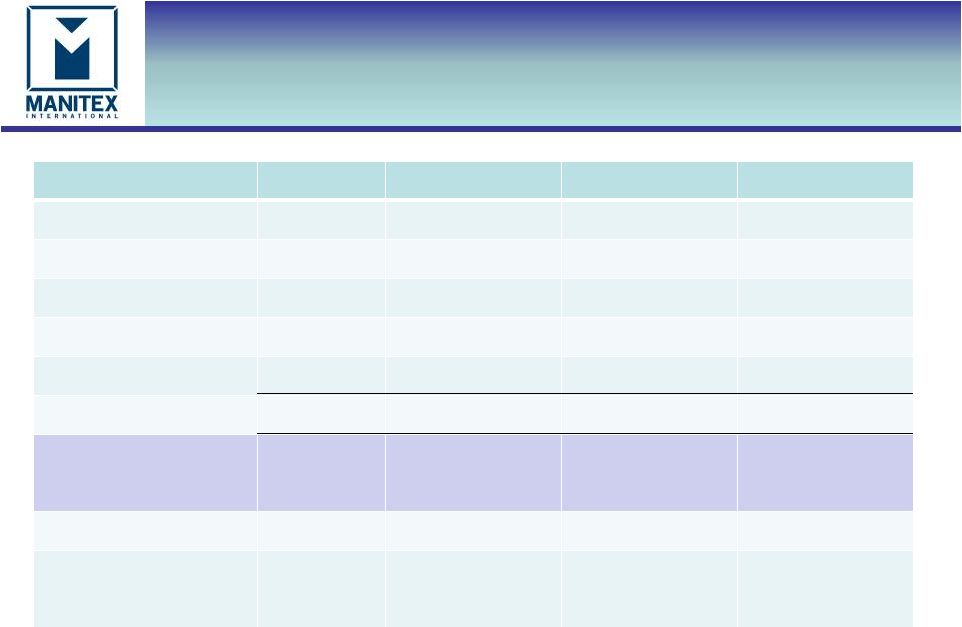
Q1-2015 Operating Performance
$m
Q1-2014 sales
$62.6
Currency translation
(3.4)
Sales from acquisitions
48.6
Volume
(1.9)
Q1-2015 sales
$105.9
$m
Q1-2014 Net income
$1.9
Increase in gross margin from sales
9.6
Operating expenses from acquisitions
(9.0)
Reduced SG&A & R&D
1.0
Interest expense
(2.1)
Other income (expense)
0.9
Tax & other
(0.1)
Attributable to noncontrolling interest
(0.7)
Q1-2015 Adjusted net income
$1.5 |
 7
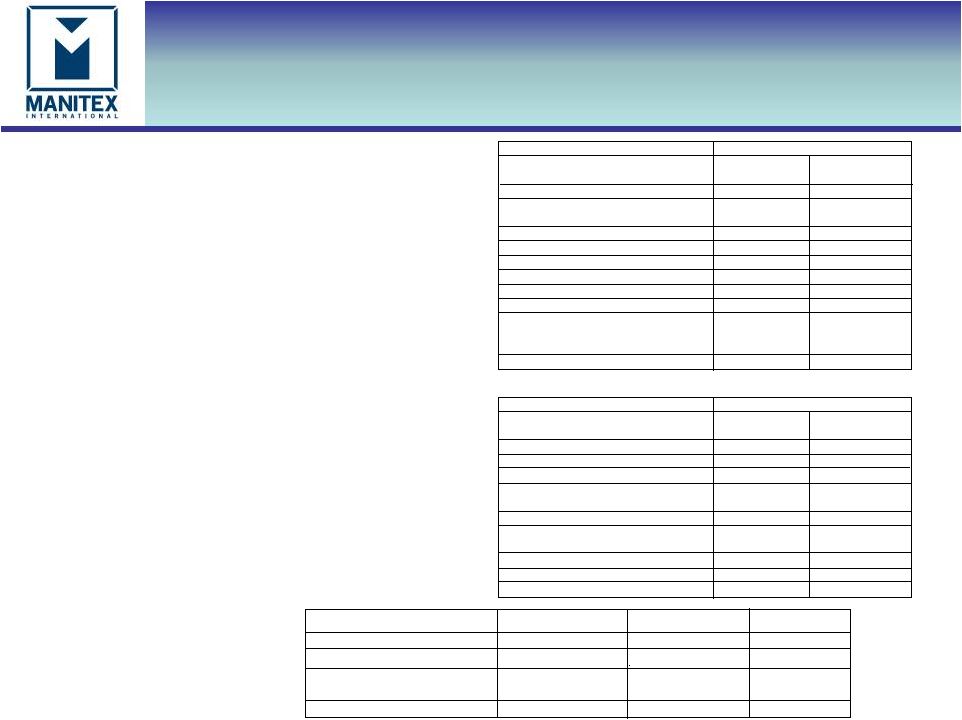
Working Capital
“Focused manufacturer
of engineered lifting
equipment”
$000
March 31,
2015
December 31,
2014
Working Capital
$98,938
$89,470
Days sales outstanding (DSO)
74
83
Days payable outstanding (DPO)
62
60
Inventory turns
2.8
2.2
Current ratio
1.8
2.1
Operating working capital
147,943
122,031
Operating working capital % of annualized LQS
34.9%
45.6%
Operating working capital increase of $25.9m of which $20.3m from PM
acquisition Working capital ratios now reflect higher
proportion of international activity. N. America based
operations DSO is 66 days and DPO is 45 days Current ratio
would be 2.1 at March 2015 adjusting for PM working capital facilities of
$20.3m that are transactional and therefore current, (compared to
N. American term lines of credit that are long term)
|
 8
“Focused manufacturer
of engineered lifting
equipment”
$000
March 31,
2015
December 31,
2014
Total Cash
$5,578
$4,370
Total Debt
200,375
112,294
Total Equity
135,186
128,006
Net capitalization
$329,983
$235,930
Net debt / capitalization
59.0%
45.7%
Adjusted EBITDA (for three months ended)
$8,030
$5,330
Adjusted EBITDA % of sales
7.6%
8.0%
Repayments of debt principal of $2.8m in Q1-2015; This
includes prepayment of $1.5m on Comerica term loan.
Availability,
based
on
collateral,
under
working
capital
lines
in
N.
America
of
$14.8m
and
$6.6m
in
ASV
Average Debt Cost approximates 6%
Debt & Liquidity
•
Net capitalization is the sum of debt plus equity minus cash
•
Net debt is total debt less cash |
 9
“Focused manufacturer
of engineered lifting
equipment”
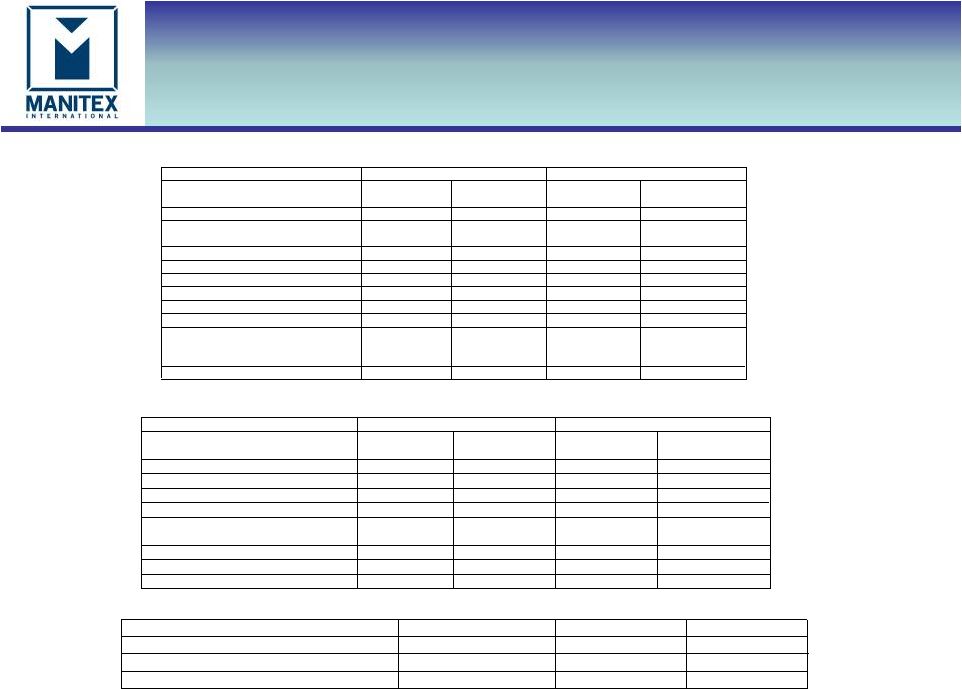
Debt
As at March 31, 2015
PM
ASV
Other
Total
Working capital facilities
20,295
16,219
46,225
82,739
Term debt
36,002
39,500
12,000
87,502
Capital leases
4,983
4,983
Convertible notes
20,951
20,951
Other acquisition notes
4,200
4,200
$56,297
$55,719
$88,359
$200,375
Note:
Non-recourse to Manitex
International Inc.
$56,297
$55,719
$112,016
Interest cost for three
months ended March
31, 2015
$2,934 |
 10
Summary
“Focused manufacturer
of engineered lifting
equipment”
Implementation and execution of integration of PM & ASV JV
Progression on cost savings
Decrease working capital
Reduce outstanding debt
Begin program of strategic rationalization
|
 11
APPENDIX
“Focused manufacturer
of engineered lifting
equipment”
Reconciliation of Q1-2015 Adjusted net income and adjusted EPS
Reconciliation of Q1-2015 Adjusted EBITDA to GAAP net income
Q1-2015 Acquisition and other expense
Three Months Ended
March 31,
2015
March 31,
2014
Net (loss) income
(224)
1,877
Net income attributable to noncontrolling
interest
294
-
Income tax
34
905
Interest expense
2,934
805
Foreign currency transaction losses (gain)
(945)
11
Other (income) expense
10
13
Acquisition and other expense
3,027
-
Depreciation & Amortization
2,900
1,111
Adjusted Earnings before interest,
taxes, depreciation and amortization
(Adjusted EBITDA)
$8,030
$4,722
Adjusted EBITDA % to sales
7.6%
7.5%
Three Months Ended
March 31,
2015
March 31,
2014
Net (loss) income as reported
(224)
1,877
Pre – tax acquisition and other expenses
3,027
--
Tax effect based on jurisdictional blend
(879)
--
Increase in net income to noncontrolling
interest
(406)
Adjusted Net Income
$1,518
$1,877
Weighted average diluted shares
outstanding
15,836,423
13,840,506
Diluted earnings per share as reported
($0.01)
$0.14
Total EPS Effect
$0.11
--
Adjusted Diluted earnings per share
$0.10
$0.14
First
Quarter 2015
Pre-tax
After-tax
EPS
Deal transaction related
$2,6
87
$1,
903
$0.12
Exceptional operating cost
$357
$245
$0.02
Change
in noncontrolling
interest
$(406)
$(406)
$(0.03)
Total
$2,638
$1,742
$0.11 |
 12
APPENDIX
“Focused manufacturer
of engineered lifting
equipment”
Reconciliation of Q4-2014 Adjusted net income and adjusted EPS
Reconciliation of Q4-2014 Adjusted EBITDA to GAAP net income
Q4-2014 Acquisition and other expense
Three Months Ended
Twelve Months Ended
December 31,
2014
December 31,
2013
December 31,
2014
December 31,
2013
Net income as reported
472
2,991
7,103
10,178
Pre – tax acquisition and other expenses
2,517
--
2,517
-
Tax effect based on jurisdictional blend
(804)
--
(804)
-
Adjusted Net Income
$2, 185
$2,991
$8,816
$10,178
Weighted average diluted shares
outstanding
14,029,205
13,821,352
13,904,289
12,717,575
Diluted earnings per share as reported
$0.03
$0.22
$0.51
$0.80
Total EPS Effect
$0.13
--
$0.12
--
Adjusted Diluted earnings per share
$0.16
$0.22
$0.63
$0.80
Three Months Ended
Twelve Months Ended
December 31,
2014
December 31,
2013
December 31,
2014
December 31,
2013
Net income
472
2,991
7,103
10,178
Net loss attributable to noncontrolling
interest
(136)
--
(136)
--
Income tax
393
1,182
3,676
4,269
Interest expense
958
765
3,150
2,946
Foreign currency transaction losses (gain)
80
23
107
95
Other (income) expense
(31)
59
36
50
Acquisition and other expense
2,356
-
2,356
-
Depreciation & Amortization
1,238
1,205
4,572
3,945
Adjusted Earnings before interest,
taxes, depreciation and amortization
(Adjusted EBITDA)
$5,330
$6,225
$20,864
$21,483
Adjusted EBITDA % to sales
8.0%
9.5%
7.9%
8.8%
Fourth Quarter 2014
Pre-tax
After-tax
EPS
Deal transaction related
$2,176
$1,481
$0.11
Exceptional operating cost
341
232
0.02
Total
$2,517
$1,713
$0.12
|