Attached files
| file | filename |
|---|---|
| 8-K - FORM 8-K - MID AMERICA APARTMENT COMMUNITIES INC. | v410312_8k.htm |
Exhibit 99.1
CAPITAL MARKETS UPDATE MAY 2015 WWW.MAAC.COM
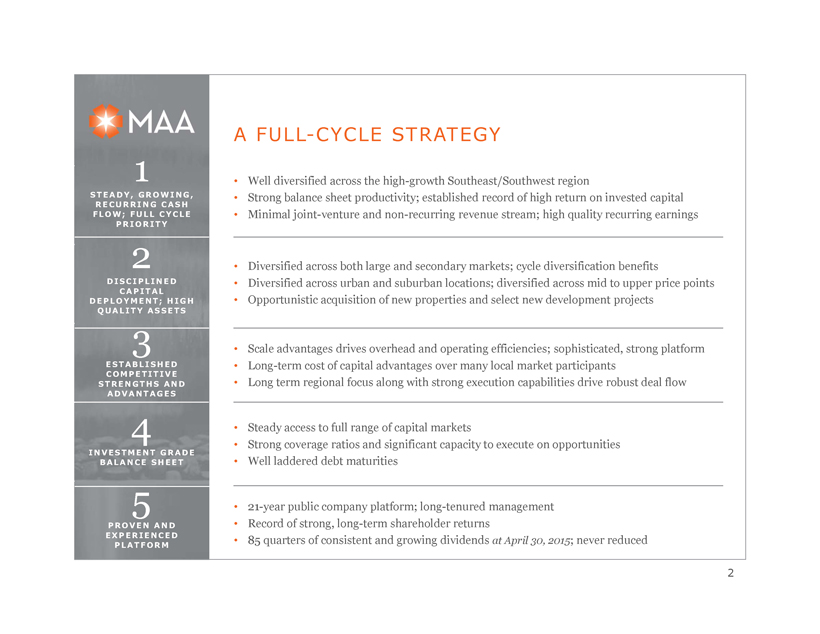
2 DISCIPLINED CAPITAL DEPLOYMENT; HIGH QUALITY ASSETS 3 ESTABLISHED COMPETITIVE STRENGTHS AND ADVANTAGES 4 INVESTMENT GRADE BALANCE SHEET A FULL-CYCLE STRATEGY • Well diversified across the high-growth Southeast/Southwest region • Strong balance sheet productivity; established record of high return on invested capital • Minimal joint-venture and non-recurring revenue stream; high quality recurring earnings 2 • Scale advantages drives overhead and operating efficiencies; sophisticated, strong platform • Long-term cost of capital advantages over many local market participants • Long term regional focus along with strong execution capabilities drive robust deal flow • Steady access to full range of capital markets • Strong coverage ratios and significant capacity to execute on opportunities • Well laddered debt maturities • 21-year public company platform; long-tenured management • Record of strong, long-term shareholder returns • 85 quarters of consistent and growing dividends at April 30, 2015; never reduced 5 PROVEN AND EXPERIENCED PLATFORM 1 STEADY, GROWING, RECURRING CASH FLOW; FULL CYCLE PRIORITY • Diversified across both large and secondary markets; cycle diversification benefits • Diversified across urban and suburban locations; diversified across mid to upper price points • Opportunistic acquisition of new properties and select new development projects

BALANCED PORTFOLIO SUPPORTS FULL CYCLE PERFORMANCE DIVISION OFFICES 3 ATLANTA CHARLOTTE DALLAS JACKSONVILLE NASHVILLE Large Markets % of Q1 2015 NOI 1 Atlanta, GA 8.3% 2 Austin, TX 7.9% 3 Charlotte, NC 7.0% 4 Raleigh/Durham, NC 6.9% 5 Fort Worth, TX 5.9% 6 Dallas, TX 5.6% 7 Nashville, TN 5.3% 8 Tampa,FL 4.5% 9 Orlando,FL 4.3% 10 Houston, TX 3.5% Secondary Markets % of Q1 2015 NOI 1 Jacksonville, FL 4.4% 2 Charleston, SC 4.1% 3 Savannah, GA 3.3% 4 Richmond, VA 2.4% 5 Memphis,TN 2.0% 6 Birmingham, AL 2.0% 7 Greenville, SC 1.9% 8 San Antonio, TX 1.6% 9 Huntsville, AL 1.5% 10 Norfolk/Hampton/ Virginia Beach, VA 1.5% (1) Distribution based on total Same Store NOI for the period presented. 64% of total1 36% of total1 Nevada Arizona Texas Mississippi Arkansas Missouri Kentucky Virginia North Carolina South Carolina Alabama Florida Georgia Tennessee LARGE MARKET* SECONDARY MARKET* *Individual MSAs 0.7% or greater of Q1 2015 total Same Store NOI presented „« 79,866 units in 255 communities at April 30, 2015 „« Diversified across high-growth Large and Secondary markets in the Southeast and Southwest US „« Properties in both Urban and Suburban locations „« Wide range of industry exposure - tech, finance, logistics, manufacturing „« Mix of high-quality A and B class product

„X Scale and efficiency „X Recruit/retain top talent „X Margin outperformance STRATEGIC COMPETITIVE CAPABILITIES 4 BUYING OPPORTUNISTICALLY SUPERIOR CAPITAL MANAGEMENT OPERATING AT A SUPERIOR LEVEL ASSET MANAGEMENT SUPERIORITY IN LOCAL MARKETS EXITING INVESTMENTS OPPORTUNISTICALLY „X Off market transactions „X Pre-purchase deals „X Pressured timing „X Experienced revenue mgmt. „X Web based technology „X National contracts/scale „X 13K+ units since 2010(1) „X 13.5% average IRRs (leveraged)(1) „X Investment Grade rated „X Multiple sources of capital „X Significant capacity Stonefield Commons; Charlottesville, VA Strategy Supports Quality Long-term Returns Enhancing Shareholder Value 13% ANNUALIZED 10 YEAR TOTAL SHAREHOLDER RETURN At 3/31/15 (1) Includes disposals from 1/1/2010 through 4/30/2015 as well as 2015 transactions under contract

(3) Acquisition metrics reflect expected stabilization performance for acquired non-stabilized deals. 4 26 Acq Disp SIGNIFICANT PORTFOLIO REPOSITIONING SINCE 2010 5 Improved Margin and Internal Growth Prospects Transaction Volume(1) (in millions) Age(2) (in years) Effective Rent per Unit(2)(3) Units(2) NOI Margin(2)(3) After Capex NOI Margin(2)(3) $1,936 $751 Acq Disp $1,194 $715 Disp Acq 61.5% 54.1% Disp Acq 740 bps 57.7% 44.1% Disp Acq 1,360 bps (1) Includes midpoint of 2015 transaction guidance 12,031 13,064 Acq Disp (2) Inclusive of transactions from 2010 through 2015 (closed and under contract)

$716 $750 $799 $863 $910 $965 $4,463 $4,684 $5,164 $5,766 $6,141 $6,259 $4,000 $4,500 $5,000 $5,500 $6,000 $6,500 $700 $750 $800 $850 $900 $950 $1,000 2010* 2011* 2012* 2013* 2014^ 2015F^ Same Store Effective Rent/Unit After Capex NOI/Unit MAA TODAY – HIGHER QUALITY PORTFOLIO AND STRONGER INTERNAL GROWTH PROSPECTS 6 Same Store NOI Margin after Capex Same Store Effective Rent & After Capex NOI/Unit Rent CAGR of 6.1% NOI/Unit CAGR of 7% 47.9% 48.0% 49.9% 51.8% 52.0% 53.4% 47.0% 48.0% 49.0% 50.0% 51.0% 52.0% 53.0% 54.0% 2010* 2011* 2012* 2013* 2014^ 2015F^ * Legacy MAA portfolio ^ Combined portfolio Enclave; Charlotte, NC CR at Medical District; Dallas, TX

DEVELOPMENT STRATEGY; STRONG VALUE CREATION Recently completed and active development pipeline totaling approximately $400 million with an average NOI yield of about 7.5% and average rents of $1,250 Expected Cost Active Developments MSA Total Units Total (in millions) Per Unit (in thousands) CG at Bellevue, II Nashville 220 $ 38.2 $ 141 220 Riverside Jacksonville 294 $ 42.7 $ 145 Station Square at Cosner's Corner, II Fredericksburg 120 $ 20.1 $ 168 Total Active Development 634 $ 101.0 $ 148 7 Completed Developments MSA Year Venue at Cool Springs Nashville 2012 Ridge at Chenal Valley Little Rock 2012 1225 South Church, II Charlotte 2013 River’s Walk Charleston 2013 CG at Randal Lakes Orlando 2014 CR at South End Charlotte 2014 CG at Lake Mary, III Orlando 2014 Venue at Cool Springs; Nashville, TN

MEANINGFUL REDEVELOPMENT OPPORTUNITY; STRONG VALUE CREATION 8 Redevelopment Opportunity • Redevelopments performed on turn at select communities, resulting in minimized down time and efficiency in evaluating effectiveness of program for real-time improvements to product mix and scope • 30%-50% of the legacy CLP portfolio identified as a target for redevelopment; 15,000 to 20,000 units across same store portfolio • 4,549 units redeveloped in 2014 at an average cost of $3,649/unit and achieving an average rental rate increase of 9.3% • Approximately 4,000 units identified for redevelopment in 2015 at an average cost of $4,350/unit – in Q1 of 2015, we redeveloped 1,022 units at an average cost of $4,455 per unit, achieving rental rate increases of 9.4% • Assuming an $80 per month increase, every 4,000 units redeveloped creates $3.6 million of additional NOI opportunity once fully leased (assuming 95% occupancy) or $65 million of additional value at a 5.5% cap rate Allure in Buckhead Village; Atlanta, GA • Cabinets and Countertops • New Appliances • Plumbing and Light Fixtures • Flooring Unit Redevelopment Updates

STRONG OPERATING PLATFORM DRIVES COMPETITIVE ADVANTAGE ACROSS REGIONAL FOCUS Regional Market Leading Expertise • 21 years of institutional property management experience in markets we serve • Onsite team has seen multiple cycles of the apartment markets in the same cities • We understand up and down performance at the market, sub-market and property level • 9 years of yield management system expertise • Competitive advantage in key markets vs. less sophisticated fee managers and smaller owner/ operators Innovative Asset Management Programs • Robust revenue management capabilities • Unit interior redevelopment program • Centrally monitored delinquency, screening and resident selection process • Expertise in optimizing customer integration and interface through both technology, onsite sales and customer service • Technical experts dedicated to supporting onsite service lowering resident turnover and increasing efficiency • Landscape group focused on superior curb appeal, vendor management and cost efficiency Proven Performance; CLP Portfolio Turn-Around • Improved CLP operating margin 80 bps • Revenue management platform drove 150bps of above market comparison effective rent per unit • Proprietary system customizations increased fee per move-in from $84 to $178 (increase of 111%) • Reduced bad debt from 0.57% of rent to 0.35% of rent • Reduced same store personnel costs by 7% 9 COMPETITIVE ADVANTAGES ADD VALUE During 2014:

BEST ONLINE REPUTATION Among Public Multifamily REITs and NMHC’s Top 50 Apartment Managers(1) OPERATIONS FOCUSED ON EXCEPTIONAL SERVICE Implemented training and customer service process on CLP portfolio following merger Since merger, increased “recommend rate” for CLP portfolio on national third party rating site by 37 percentage points* Third party administered customer service survey jumped 6 percentage points and is now 12 percentage points above our competitors* Key customer focus on overall product and quality with 2,600 resident engagement events and over 360,000 surveys distributed* 10 DEDICATED TO EXCEEDING OUR RESIDENTS’ EXPECTATIONS (1) J Turner ORA© Power Ranking at 4/30/2015 *Data as of 12/31/14

SOLID INVESTMENT GRADE BALANCE SHEET 11 Credit metrics MAA LT Target Total unencumbered assets to book value 70.5% >70% Net debt / recurring EBITDA 6.2x 6.0x Net debt / gross assets1 42.1% 40%-43%GAV Secured debt / gross assets1 17.7% 15%-20% Fixed charge coverage ratio2 4.0x > 4.0x Note: As of 3/31/15 (1) Gross assets is defined as total assets plus accumulated depreciation (2) Fixed charge coverage represents Recurring EBITDA divided by interest expense adjusted for mark-to-market debt adjustment $316 $193 $490 $474 $2,006 2015 2016 2017 2018 2019+ % 0.0% 10.8% 6.1% 13.5% maturing Credit ratings Agency Rating Outlook Fitch Ratings3 BBB Positive Moody’s Investors Service4 Baa2 Stable S&P Ratings Services3 BBB Stable Debt maturity profile (in millions) (3) Mid-America Apartment Communities, Inc. & Mid-America Apartments, LP (4) Mid-America Apartments LP only • Completed 2 public bond offerings in the last 18 months; over $1 billion of public bonds outstanding • Over $335 million in cash and debt capacity as of 3/31/2015

93% DEBT FIXED OR HEDGED SOLID INVESTMENT GRADE BALANCE SHEET 12 Debt Summary ($ in millions) Secured Debt, 15% Unsecured Common Debt, 21% Equity, 64% Total Capitalization at March 31, 2015 $6.15B Common Equity $3.48B Debt *Total Capitalization equals the total number of shares of common stock and units times the closing stock price at period end plus total debt outstanding. 03/31/15 Secured Debt Fixed or Hedged Rate $1,348.3 Variable Rate 80.8 Total Secured Debt 1,429.1 Unsecured Debt Unsecured Bonds 1,321.4 Unsecured Term Loans 550.0 Unsecured Credit Facilities 179.0 Total Unsecured Debt 2,050.4 Total Debt $3,479.5

$2.55 $2.59 $2.91 $2.99 $3.08 $3.09 $3.30 $3.99 $4.33 $4.28(1) $4.55(2) $2.35 $2.38 $2.42 $2.46 $2.46 $2.46 $2.51 $2.64 $2.78 $2.92 $3.08 2005 2006 2007 2008 2009 2010 2011 2012* 2013* 2014* 2015F* AFFO / Share Dividends SUMMARY 13 Proven platform has become even stronger • Increased market capitalization to over $9.6 billion; higher liquidity and efficiencies • Portfolio transformation/Focus on high-growth region drives robust full cycle performance • Higher efficiencies from larger scale improving earnings potential • Balance sheet strength creating growth opportunities • Significant portfolio transformation driving higher cash flow margins and core growth rate • 21 year history of secure and growing dividend (1) 2014 Core AFFO was depressed from additional capital spending on the Legacy CLP portfolio. (2) Guidance for 2015 core AFFO is in the range $4.43 - $4.67 with a midpoint of $4.55. *Core AFFO/Share Improving Cash Flow And Dividend Coverage 10 year average AFFO growth rate of over 6%
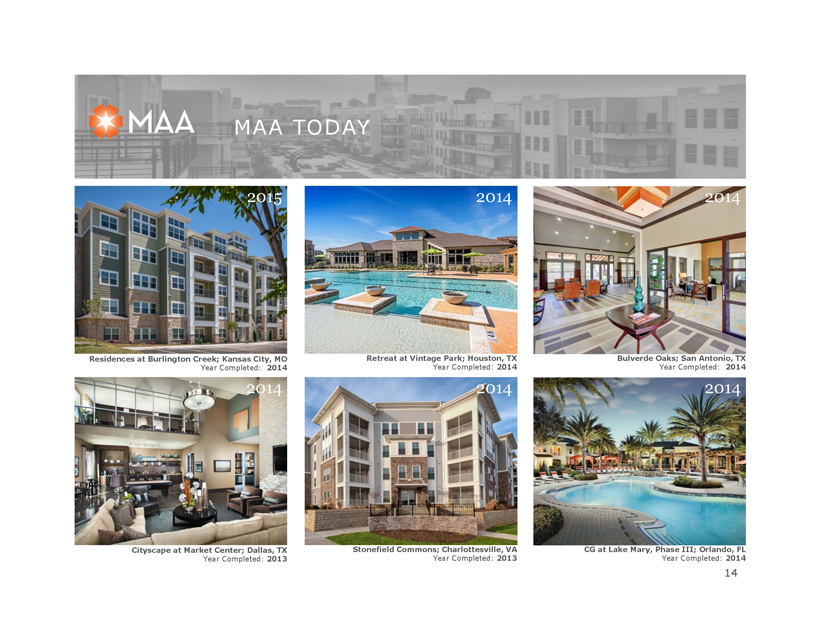
MAA TODAY 14 Residences at Burlington Creek; Kansas City, MO Year Completed: 2014 Retreat at Vintage Park; Houston, TX Year Completed: 2014 Bulverde Oaks; San Antonio, TX Year Completed: 2014 Cityscape at Market Center; Dallas, TX Year Completed: 2013 Stonefield Commons; Charlottesville, VA Year Completed: 2013 CG at Lake Mary, Phase III; Orlando, FL Year Completed: 2014 2015 2014 2014 2014 2014 2014

MAA TODAY 15 CG at Randal Lakes; Orlando, FL Year Completed: 2014 CR at South End; Charlotte, NC Year Completed: 2014 Rivers Walk; Charleston, SC Year Completed: 2013 CR at Frisco Bridges; Dallas, TX Year Completed: 2013 Seasons at Celebrate VA, Phase II; Fredericksburg, VA Year Completed: 2013 1225 South Church, Phase II; Charlotte, NC Year Completed: 2013 2014 2014 2013 2013 2013 2013

FORWARD LOOKING STATEMENTS 16 Certain matters in this presentation may constitute forward-looking statements within the meaning of Section 27-A of the Securities Act of 1933 and Section 21E of the Securities and Exchange Act of 1934. Such statements include, but are not limited to, statements made about anticipated economic and market conditions, expectations for future demographics, expectations for future performance and capture of synergies, and expectations for acquisition and disposition transaction activity. Actual results and the timing of certain events could differ materially from those projected in or contemplated by the forward-looking statements due to a number of factors, including a downturn in general economic conditions or the capital markets, competitive factors including overbuilding or other supply/demand imbalances in some or all of our markets, changes in interest rates and other items that are difficult to control such as the impact of legislation, as well as the other general risks inherent in the apartment and real estate businesses. We undertake no duty to update these statements. Reference is hereby made to the filings of Mid-America Apartment Communities, Inc., with the Securities and Exchange Commission, including quarterly reports on Form 10-Q, reports on Form 8-K, and its annual report on Form 10-K, particularly including the risk factors contained in the latter filing. Eric Bolton Chairman and CEO 901-248-4127 eric.bolton@maac.com Al Campbell EVP, CFO 901-248-4169 al.campbell@maac.com Tim Argo SVP, Finance 901-248-4149 tim.argo@maac.com Jennifer Patrick Investor Relations 901-435-5371 jennifer.patrick@maac.com Contact