Attached files
| file | filename |
|---|---|
| 8-K - CALGON CARBON CORPORATION 8-K - CALGON CARBON Corp | a51094728.htm |
Exhibit 99.1
Annual Stockholder Meeting 2015 © Calgon Carbon Corporation 2015 | Slide 1 Clear Water. Clean Air. Better World.

Welcome
Safe Harbor Statement Today’s presentation contains historical information and forward-looking statements. Forward-looking statements typically contain words such as “expect,” “believe,” “estimate,” “anticipate,” or similar words indicating that future outcomes are uncertain. Statements looking forward in time, including statements regarding future growth and profitability, price increases, cost savings, product lines, enhanced competitive posture and acquisitions, are included in the company’s most recent Annual Report pursuant to the “safe harbor” provision of the Private Securities Litigation Reform Act of 1995. They involve known and unknown risks and uncertainties that may cause the company’s actual results in future periods to be materially different from any future performance suggested herein. Further, the company operates in an industry sector where securities values may be volatile and may be influenced by economic and other factors beyond the company’s control. Some of the factors that could affect future performance of the company are changes in, or delays in the implementation of, regulations that cause a market for our products, acquisitions, higher energy and raw material costs, costs of imports and related tariffs, labor relations, capital and environmental requirements, changes in foreign currency exchange rates, borrowing restrictions, validity of patents and other intellectual property, and pension costs. In the context of the forward-looking information provided in this news release, please refer to the discussions of risk factors and other information detailed in, as well as the other information contained in the company’s most recent Annual Report. © Calgon Carbon Corporation 2015 | Slide 3 Clean Air. Better World.
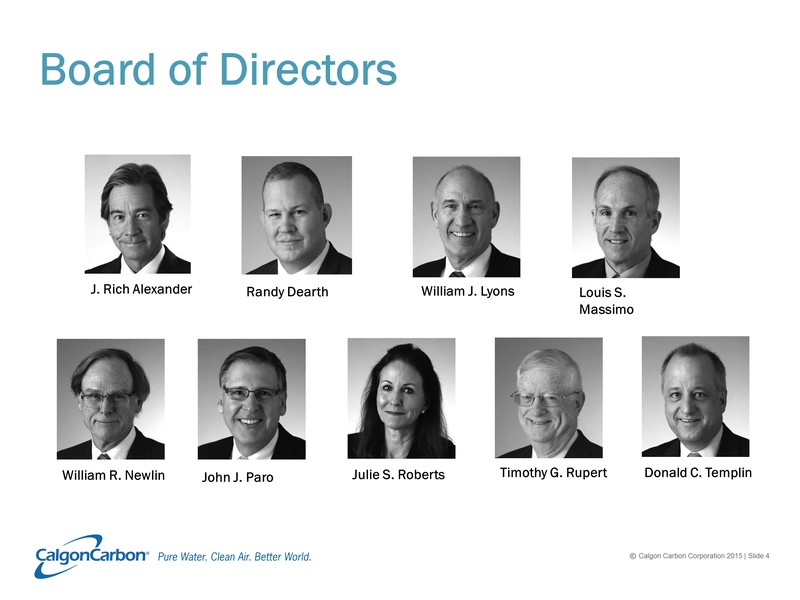
Board of Directors J. Rich Alexander William J. Lyons Louis S. Massimo William R. Newlin John J. Paro Julie S. Roberts Timothy G. Rupert Donald C. Templin © Calgon Carbon Corporation 2015 | Slide 4 Clean Air. Better World.
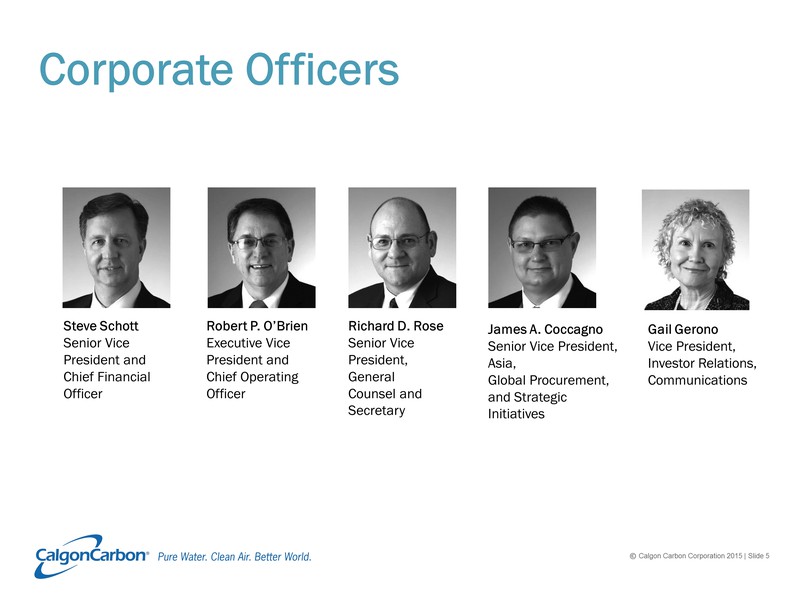
Corporate Officers Steve Schott Senior Vice President and Chief Financial Officer Robert P. O’Brien Executive Vice President and Chief Operating Officer Gail Gerono Vice President, Investor Relations, Communications James A. Coccagno Senior Vice President, Asia, Global Procurement, and Strategic Initiatives Richard D. Rose Senior Vice President, General Counsel and Secretary © Calgon Carbon Corporation 2015 | Slide 5 Clean Air. Better World.
Rules of Conduct
First Proposal Election of Three Directors
Second Proposal Ratification of Auditors

Third Proposal Compensation
Motions

Voting Polls Open
Voting Results
2014 Performance
Agenda 2014 Performance 2014 Accomplishments Drivers for Value Creation Moving Forward © Calgon Carbon Corporation 2015 | Slide 14 Clean Air. Better World.

2014 Performance
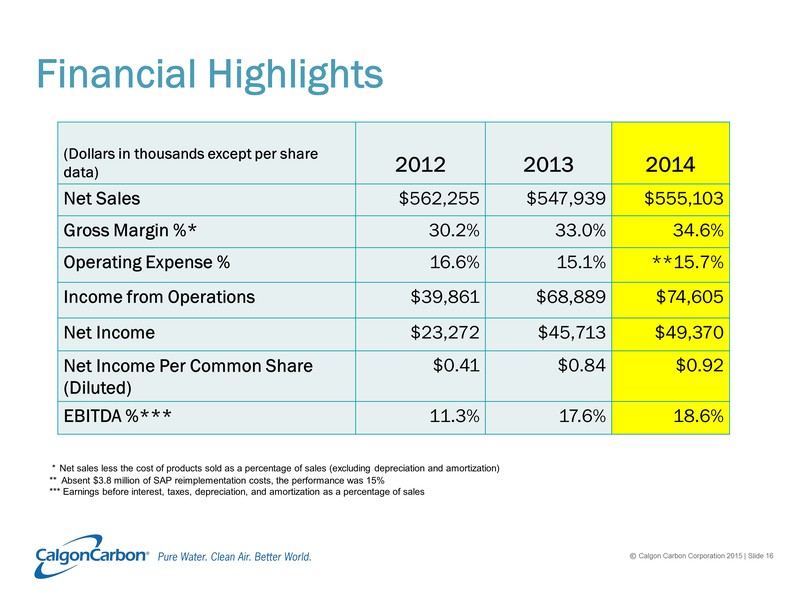
Financial Highlights (Dollars in thousands except per share data) 2012 2013 2014 Net Sales Gross Margin %* Operating Expence % Income from Operations Net Income Net Income Per Common Share (Diluted) EBITDA %*** $562,255 $547,939 $555,103 30.2 33.0 34.6 16.6 15.1 15.7** 39,861 68,889 74,605 23,272 45,713 49,370 0.41 0.84 0.92 11.3 17.6 18.6 * Net sales less the cost of products sold as a percentage of sales (excluding depreciation and amortization) ** Absent $3.8 million of SAP reimplementation costs, the performance was 15% *** Earnings before interest, taxes, depreciation, and amortization as a percentage of sales © Calgon Carbon Corporation 2015 | Slide 16 Clean Air. Better World.
2014 Accomplishments
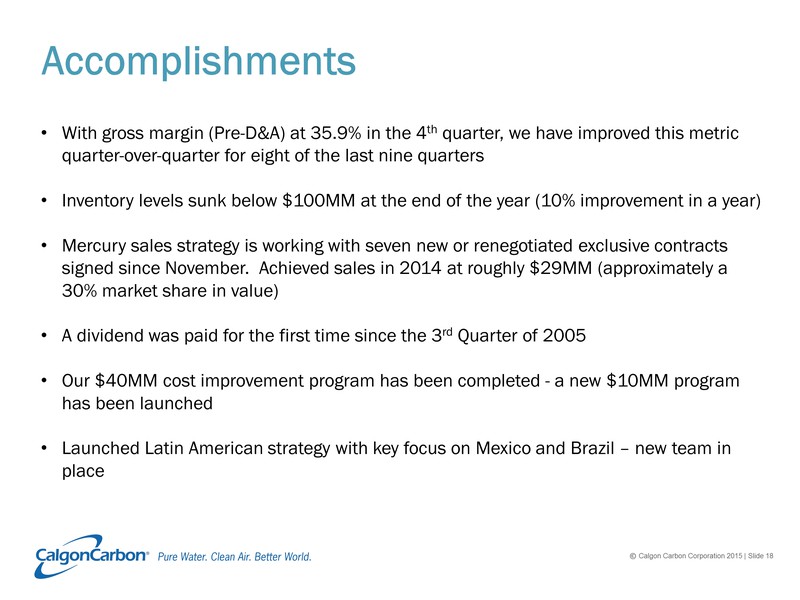
Accomplishments With gross margin (Pre-D&A) at 35.9% in the 4th quarter, we have improved this metric quarter-over-quarter for eight of the last nine quarters Inventory levels sunk below $100MM at the end of the year (10% improvement in a year) Mercury sales strategy is working with seven new or renegotiated exclusive contracts signed since November. Achieved sales in 2014 at roughly $29MM (approximately a 30% market share in value) A dividend was paid for the first time since the 3rd Quarter of 2005 Our $40MM cost improvement program has been completed - a new $10MM program has been launched Launched Latin American strategy with key focus on Mexico and Brazil – new team in place © Calgon Carbon Corporation 2015 | Slide 18 Clean Air. Better World.
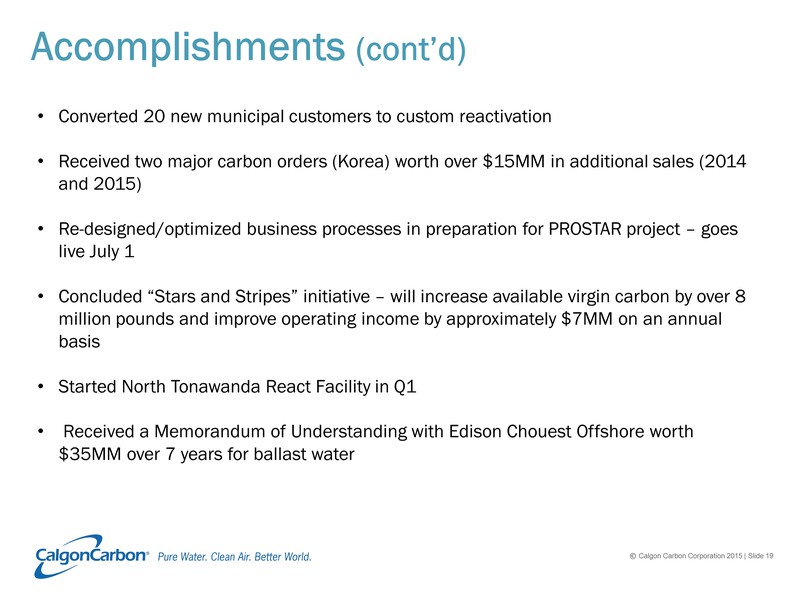
Accomplishments (cont’d) Converted 20 new municipal customers to custom reactivation Received two major carbon orders (Korea) worth over $15MM in additional sales (2014 and 2015) Re-designed/optimized business processes in preparation for PROSTAR project – goes live July 1 Concluded “Stars and Stripes” initiative – will increase available virgin carbon by over 8 million pounds and improve operating income by approximately $7MM on an annual basis Started North Tonawanda React Facility in Q1 Received a Memorandum of Understanding with Edison Chouest Offshore worth $35MM over 7 years for ballast water © Calgon Carbon Corporation 2015 | Slide 19 Clean Air. Better World.
Drivers of Value Creation
Cost Improvement
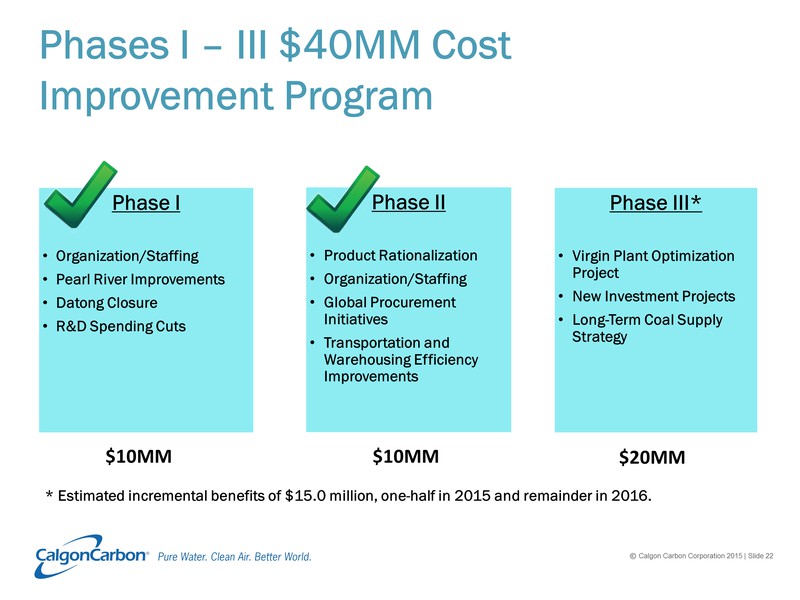
Phases I – III $40MM Cost Improvement Program to Phase I Organization/Staffing Pearl River Improvements Datong Closure R&D Spending Cuts Phase II Product Rationalization Organization/Staffing Global Procurement Initiatives Transportation and Warehousing Efficiency Improvements Phase III* Virgin Plant Optimization Project New Investment Projects Long-Term Coal Supply Strategy $10MM $10MM $20MM * Estimated incremental benefits of $15.0 million, one-half in 2015 and remainder in 2016. © Calgon Carbon Corporation 2015 | Slide 22 Clean Air. Better World.
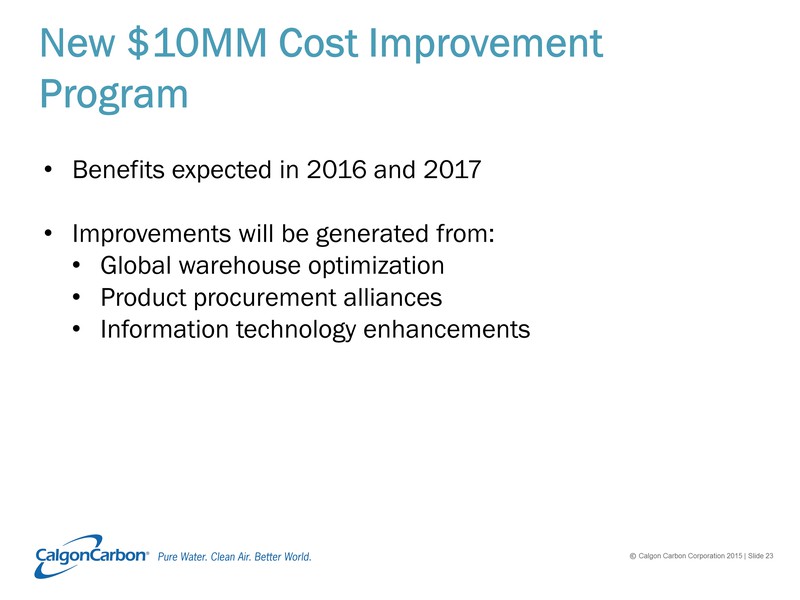
New $10MM Cost Improvement Program Benefits expected in 2016 and 2017 Improvements will be generated from: Global warehouse optimization Product procurement alliances Information technology enhancements © Calgon Carbon Corporation 2015 | Slide 23 Clean Air. Better World.
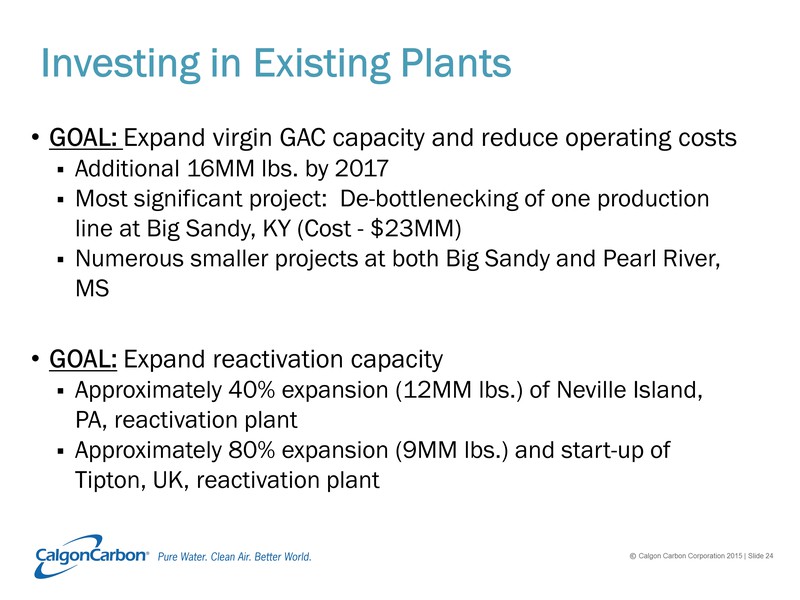
Investing in Existing Plants GOAL: Expand virgin GAC capacity and reduce operating costs Additional 16MM lbs. by 2017 Most significant project: De-bottlenecking of one production line at Big Sandy, KY (Cost - $23MM) Numerous smaller projects at both Big Sandy and Pearl River, MS •GOAL: Expand reactivation capacity ■Approximately 40% expansion (12MM lbs.) of Neville Island, PA, reactivation plant ■Approximately 80% expansion (9MM lbs.) and start-up of Tipton, UK, reactivation plant © Calgon Carbon Corporation 2015 | Slide 24 Clean Air. Better World.
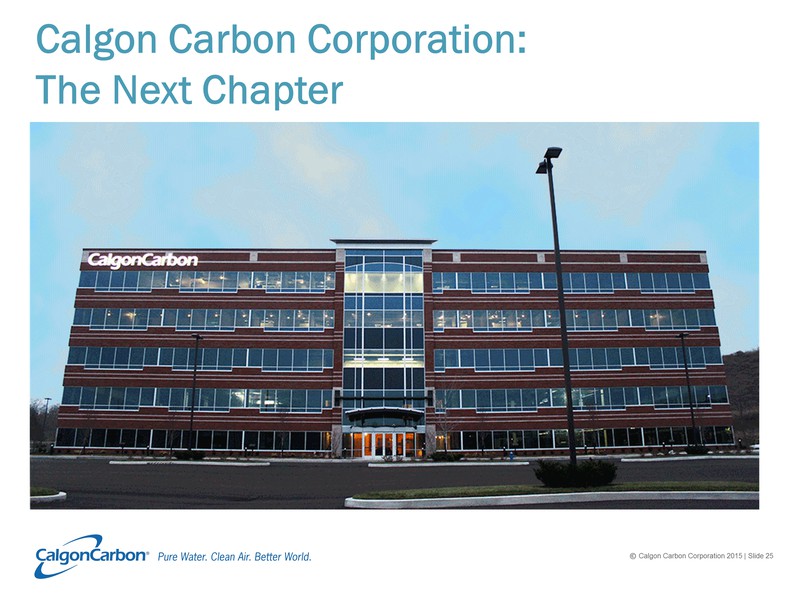
Calgon Carbon Corporation: The Next Chapter © Calgon Carbon Corporation 2015 | Slide 25 Clean Air. Better World.
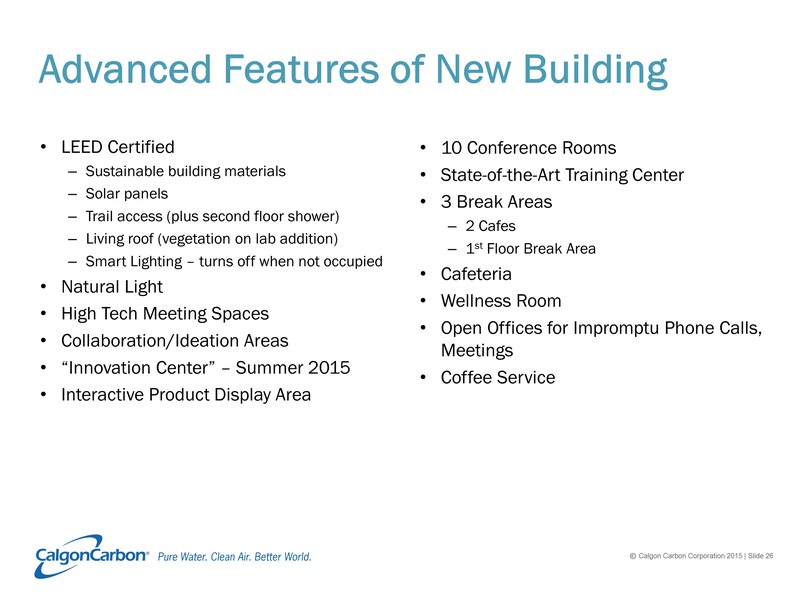
LEED Certified Sustainable building materials Solar panels Trail access (plus second floor shower) Living roof (vegetation on lab addition) Smart Lighting – turns off when not occupied Natural Light High Tech Meeting Spaces Collaboration/Ideation Areas “Innovation Center” – Summer 2015 Interactive Product Display Area 10 Conference Rooms State-of-the-Art Training Center 3 Break Areas 2 Cafes 1st Floor Break Area Cafeteria Wellness Room Open Offices for Impromptu Phone Calls, Meetings Coffee Service © Calgon Carbon Corporation 2015 | Slide 26 Clean Air. Better World.
Q&A
Thank You © Calgon Carbon Corporation 2015 | Slide 28 Clean Air. Better World.