Attached files
| file | filename |
|---|---|
| EX-32.2 - EX-32.2 - CALGON CARBON Corp | ccc-20161231ex3225877a6.htm |
| EX-32.1 - EX-32.1 - CALGON CARBON Corp | ccc-20161231ex3210fc81b.htm |
| EX-31.2 - EX-31.2 - CALGON CARBON Corp | ccc-20161231ex312b16121.htm |
| EX-31.1 - EX-31.1 - CALGON CARBON Corp | ccc-20161231ex311f6d342.htm |
| EX-23.1 - EX-23.1 - CALGON CARBON Corp | ccc-20161231ex23168ea41.htm |
UNITED STATES
SECURITIES AND EXCHANGE COMMISSION
Washington, D.C. 20549
FORM 10-K
(Mark One)
☒Annual Report Pursuant to Section 13 or 15(d) of the Securities Exchange Act of 1934.
For the fiscal year ended December 31, 2016
or
☐Transition Report Pursuant to Section 12 or 15(d) of the Securities Exchange Act of 1934.
For the transition period from to .
Commission file number 1-10776
Calgon Carbon Corporation
(Exact name of registrant as specified in its charter)
|
Delaware |
|
25-0530110 |
|
(State or other jurisdiction of incorporation or organization) |
|
(I.R.S. Employer Identification No.) |
|
|
|
|
|
3000 GSK Drive |
|
|
|
Moon Township, Pennsylvania |
|
15108 |
|
(Address of principal executive offices) |
|
(Zip Code) |
Registrant’s telephone number, including area code: (412) 787-6700
Securities registered pursuant to Section 12(b) of the Act:
|
Title of each class |
|
Name of each exchange on which registered |
|
Common Stock, par value $0.01 per share |
|
New York Stock Exchange |
Securities registered pursuant to Section 12(g) of the Act:
None
(Title of class)
Indicate by check mark if the registrant is a well-known seasoned issuer, as defined in Rule 405 of the Securities Act. Yes ☒ No ☐
Indicate by check mark if the registrant is not required to file reports pursuant to Section 13 or Section 15(d) of the Exchange Act. Yes ☐ No ☒
Indicate by check mark whether the registrant (1) has filed all reports required to be filed by Section 13 or 15(d) of the Securities Exchange Act of 1934 during the preceding 12 months (or for such shorter period that the registrant was required to file such reports), and (2) has been subject to such filing requirements for the past 90 days. Yes ☒ No ☐
Indicate by check mark whether the registrant has submitted electronically and posted on its corporate Web site, if any, every Interactive Data File required to be submitted and posted pursuant to Rule 405 of Regulation S-T during the preceding 12 months (or for such shorter period that the registrant was required to submit and post such files). Yes ☒ No ☐
Indicate by check mark if disclosure of delinquent filers pursuant to Item 405 of Regulation S-K is not contained herein, and will not be contained, to the best of registrant’s knowledge, in definitive proxy or information statements incorporated by reference in Part III of this Form 10-K or any amendment to this Form 10-K. ☐
Indicate by check mark whether the registrant is a large accelerated filer, an accelerated filer, a non-accelerated filer, or a smaller reporting company. See the definitions of “large accelerated filer,” “accelerated filer” and “smaller reporting company” in Rule 12b-2 of the Exchange Act.
|
Large accelerated filer ☒ |
|
Accelerated filer ☐ |
|
Non-accelerated filer ☐ |
|
Smaller reporting company ☐ |
|
(Do not check if a smaller reporting company) |
|
|
Indicate by check mark whether the registrant is a shell company (as defined in Rule 12b-2 of the Exchange Act). Yes ☐ No ☒
As of February 15, 2017, there were outstanding 50,645,478 shares of Common Stock, par value of $0.01 per share.
The aggregate market value of the voting stock held by non-affiliates as of June 30, 2016 was $602,502,505.15. The closing price of the Company’s common stock on June 30, 2016, as reported on the New York Stock Exchange was $13.15.
The following documents have been incorporated by reference:
|
Document |
|
Form 10-K Part Number |
|
Proxy Statement filed pursuant to Regulation 14A in connection with registrant’s |
|
III |
|
Annual Meeting of Stockholders to be held on May 4, 2017 |
|
|
2
Forward-Looking Information Safe Harbor
This Annual Report on Form 10-K contains historical information and forward-looking statements. Forward-looking statements typically contain words such as “expect,” “believe,” “estimate,” “anticipate,” or similar words indicating that future outcomes are uncertain. Statements looking forward in time, including statements regarding future growth and profitability, price increases, cost savings, broader product lines, enhanced competitive posture and acquisitions, are included in this Annual Report on form 10-K pursuant to the “safe harbor” provision of the Private Securities Litigation Reform Act of 1995. These forward-looking statements involve known and unknown risks and uncertainties that may cause Calgon Carbon Corporation’s (the Company’s) actual results in future periods to be materially different from any future performance suggested herein. Further, the Company operates in an industry sector where securities values may be volatile and may be influenced by economic and other factors beyond the Company’s control. Factors that could affect future performance of the Company include, without limitation: the Company’s ability to successfully integrate the November 2, 2016 acquisition of the assets and business of the wood-based activated carbon, reactivation, and mineral-based filtration media of CECA, a subsidiary of Arkema Group (New Business) and achieve the expected results of the acquisition, including any expected synergies and the expected future accretion to earnings; changes in, or delays in the implementation of, regulations that cause a market for our products; changes in competitor prices for products similar to ours; higher energy and raw material costs; costs of imports and related tariffs; unfavorable weather conditions and changes in market prices of natural gas relative to prices of coal; changes in foreign currency exchange rates and interest rates; changes in corporate income and cross-border tax policies of the United States and other countries; labor relations; availability of capital and environmental requirements as they relate to both our operations and to those of our customers; borrowing restrictions; validity of patents and other intellectual property; and pension costs. In the context of the forward-looking information provided in this Annual Report on Form 10-K, please refer to the discussions of risk factors and other information detailed in, as well as the other information contained in this Annual Report. Any forward-looking statement speaks only as of the date on which such statement is made and the Company does not intend to correct or update any forward-looking statements, whether as a result of new information, future events or otherwise, unless required to do so by the Federal securities laws of the United States.
In reviewing any agreements incorporated by reference in this Form 10-K, please remember such agreements are included to provide information regarding the terms of such agreements and are not intended to provide any other factual or disclosure information about the Company. The agreements may contain representations and warranties by the Company, which should not in all instances be treated as categorical statements of fact, but rather as a way of allocating the risk to one of the parties should those statements prove to be inaccurate. The representation and warranties were made only as of the date of the relevant agreement or such other date or dates as may be specified in such agreement and are subject to more recent developments. Accordingly, these representations and warranties alone may not describe the actual state of affairs as of the date they were made or at any other time.
3
The Company
Calgon Carbon Corporation (the Company) is a global leader in innovative solutions, high quality products and reliable services designed to protect human health and the environment from harmful contaminants in water, and air. As a leading manufacturer of activated carbon, with broad capabilities in ultraviolet light disinfection, the Company provides purification solutions for drinking water, wastewater, pollution abatement, and a variety of industrial and commercial manufacturing processes.
On November 2, 2016, the Company completed the acquisition of the wood-based activated carbon, reactivation and mineral-based filtration media business of CECA, a subsidiary of Arkema Group (New Business). Due to the complementary nature of the New Business’ products and market applications to those of the Company, and its significant exposure to less regulated, more traditional end markets, the addition of the New Business to the Company creates a more balanced global platform from which the Company can continue to grow by leveraging its now expanded capabilities in the global activated carbon and adjacent filtration media market areas.
The Company was organized as a Delaware corporation in 1967.
Products and Services
The Company offers a diverse range of products, services, and equipment specifically developed for the purification, separation, and concentration, and filtration of liquids, gases, and other media through its reportable business segments: Activated Carbon and Service, Equipment, Consumer, and Other. In 2016, Other is exclusively comprised of the results of the New Business.
|
· |
The Activated Carbon and Service segment manufactures and markets granular and powdered activated carbon for use in many distinct market applications that remove organic compounds from water, air, and other liquids and gases. The Service aspect of this segment consists of carbon reactivation and the leasing, installation, monitoring and maintenance of carbon adsorption equipment. |
|
· |
The Equipment segment provides solutions to customers’ air, water and other liquid purification problems through the design, fabrication, installation and sale of equipment systems that utilize one or more of the Company’s enabling technologies: carbon adsorption, ultraviolet (UV) light (for ballast water, drinking water, and wastewater treatment), and advanced ion-exchange (IX) technologies. |
|
· |
The Consumer segment supplies activated carbon cloth for use in medical, military, and industrial applications. |
|
· |
The New Business, reported in Other, manufactures and markets granular and powdered wood-based activated carbon, coal-based activated carbon reactivation, diatomaceous earth and perlite filtration media for use in various distinct market applications. They are used primarily for decolorization, purification, decontamination, and filtration of liquids in various applications including food and beverage, industrial, fine chemicals and pharmaceuticals. |
For further information, refer to Note 18 to the consolidated financial statements in Item 8 of this Annual Report.
Activated Carbon and Service. The sale of activated carbon is the principal component of the Activated Carbon and Service business segment. The Company is recognized as the leading manufacturer of bituminous coal-based granular activated carbon. Activated carbon is a porous material that removes organic compounds from liquids and gases by a process known as “adsorption.” In adsorption, undesirable organic molecules contained in a liquid or gas are attracted and bound to the surface of the pores of the activated carbon as the liquid or gas is passed through.
The primary raw material used in the production of the Company’s activated carbons is bituminous coal, which is crushed, sized and then processed in rotary kilns followed by high temperature furnaces. This heating process is known as “activation” and develops the pore structure of the carbon. Through adjustments in the activation process, pores of the required size and number are developed for a particular purification application. The Company’s technological expertise in adjusting the pore structure in the activation process has been one of a number of factors enabling the Company to develop many special types of activated carbon available in several particle sizes. The Company also markets activated carbons from other raw materials, including coconut shell and wood.
4
The Activated Carbon and Service business segment produces and sells a broad range of activated, impregnated or acid washed carbons in granular, powdered or pellet form. Granular Activated Carbon (GAC) particles are irregular in shape and generally used in fixed filter beds for continuous flow purification processes. Powdered Activated Carbon (PAC) is carbon that has been pulverized into powder and is often used in batch purification processes, in municipal water treatment applications and for flue gas emissions control. Pelletized activated carbons are extruded particles, cylindrical in shape, and are typically used for gas phase applications due to the low pressure drop, high mechanical strength, and low dust content of the product.
Another important component of the Activated Carbon and Service business segment is the optional services that the Company makes available to purchasers of its products and systems. It offers a variety of treatment services for customers including carbon supply, equipment leasing, installation and demobilization, transportation, and spent carbon reactivation. Other services include feasibility testing, process design, performance monitoring, and major maintenance of Company-owned adsorption equipment.
Spent carbon reactivation and re-supply is a key focus of the Company’s service business. In the reactivation process, the spent GAC is subjected to high temperature remanufacturing conditions that destroy the adsorbed organics and ensure that the activated carbon is returned to usable quality. The Company is permitted to handle and reactivate spent carbons containing hazardous and non-hazardous organic compounds.
Granular carbon reactivation is conducted at numerous locations throughout the world. It is valuable to a customer for both environmental and economic reasons, allowing them to reuse carbon cost-effectively without purchasing more expensive new carbon, and, at the same time, protecting natural resources. The Company provides reactivation services in packages ranging from a fifty-five gallon drum to truckload quantities.
The Company’s custom reactivation process for United States (U.S.) municipal drinking water treatment plants is specially tailored to meet the unique demands of the drinking water industry. Activated carbon reactivation for use in drinking water treatment facilities in the U.S. must adhere to requirements of the American Water Works Association (AWWA) standard B605. Perhaps the most important requirement of this standard is that the reactivator must return to the municipality/water provider its own activated carbon that has been reactivated. Unlike industrial activated carbon reactivation practiced by a number of carbon companies, where carbons from different customers can be co-mingled and reactivated as a pooled material, drinking water carbons are carefully segregated. This means that a drinking water provider’s activated carbon is kept separate not only from industrial customers’ carbons, but from the activated carbon of other providers’ activated carbon as well, to avoid any potential cross-contamination. The Company maintains the integrity of each drinking water provider’s carbon, and its potable reactivation facilities and procedures strictly adhere to AWWA B605. The Company’s Blue Lake, California, Columbus, Ohio, North Tonawanda, New York, and Gila Bend, Arizona plants have received certification from the National Sanitation Foundation International (NSF) under NSF/ANSI Standard 61: Drinking Water System Components - Health Effects for custom reactivated carbon for potable water applications. NSF International is an independent, not-for-profit organization committed to protecting and improving public health and the environment.
European custom reactivation process maintains the segregation of drinking water provider’s activated carbon and ensures returned product fulfills the requirements of European Standard EN12015 as well as specific additional requirements as found in the United Kingdom Drinking Water Inspectorate (DWI) approval list of products and in the KIWA-ATA certification. Custom reactivation for European municipal drinking water treatment plants is performed in reactivation facilities in Belgium, the United Kingdom, and Italy. The site in Feluy, Belgium, which is accredited ISO9001 and ISO14001 for Quality and Environmental management systems, is the only carbon reactivation facility in the world with ISO22000 accreditation for Food Safety Management System (FSMS).
Transportation services are offered via bulk activated carbon deliveries and spent carbon returns through the Company’s private fleet of trailers, capable of transporting both hazardous and non-hazardous material. The Company will arrange transportation for packaged and smaller volumes of activated carbon in appropriate containers and small returnable equipment through a network of commercial and less-than-truckload carriers.
Sales for the Activated Carbon and Service segment were $454.6 million, $486.5 million, and $498.2 million for the years ended December 31, 2016, 2015, and 2014, respectively.
5
Equipment. Along with providing activated carbon products, the Company has developed a portfolio of standardized, pre-engineered, activated carbon adsorption systems—for both liquid and vapor applications—which can be quickly delivered and easily installed at treatment sites. Liquid phase equipment systems are used for potable water treatment, process purification, wastewater treatment, groundwater remediation, and de-chlorination. Vapor phase equipment systems are used to control volatile organic compound (VOC) emissions, off gases from air strippers, and landfill gas production.
Through its UV Technologies LLC subsidiary, the Company also manufactures and sells a broad line of UV (ultraviolet) light disinfection equipment. Following the Company’s introduction of an advanced UV oxidation process to remediate contaminated groundwater, in 1998, its scientists invented a UV disinfection process used to inactivate Cryptosporidium, Giardia and other similar pathogens in surface water, rendering them harmless to humans. In combination with hydrogen peroxide, UV light is effective in destroying many contaminants common in groundwater remediation applications. The Company participates in the marketplace for innovative UV technologies with its Sentinel® line designed to protect municipal drinking water supplies from pathogens, the C3 Series™ open-channel wastewater disinfection product line for municipal wastewater disinfection, and Rayox® UV advanced oxidation equipment for treatment of contaminants in groundwater, process water, and industrial wastewater. UV oxidation equipment can also be combined with activated carbon to provide effective solutions for taste and odor removal in municipal drinking water and for water reuse.
Under the trade name Hyde Marine, which was acquired in 2010, the Company also manufactures and sells UV ballast water management systems (BWMS) that combine filtration and UV disinfection to treat and disinfect the ballast water taken in by a ship in one location, and discharged in another, to prevent the spread of non-indigenous aquatic organisms. Invasion of non-native species via ballast water is considered to be one of the greatest threats to the world’s waterways and marine environment. The Company competes in this market with its Hyde GUARDIAN® BWMS – an easy-to-use, cost-effective, and chemical-free ballast water management solution. The International Maritime Organization (IMO) type approved system meets the needs of ship owners committed to operating their vessels in a responsible, sustainable, and economic way through its proven reliability, flexible and compact design, and low operating costs. In 2017, the Company is planning to complete the testing of its BWMS in order to apply to become type approved by the U.S. Coast Guard (USCG) for treating ballast water discharged in U.S. waterways.
The Company also manufactures and sells fixed bed and continuous ion exchange equipment. The proprietary continuous ISEP® (Ionic Separator) and CSEP® (Chromatographic Separator) units are used for the purification, separation and recovery of many products in the food and beverage, pharmaceutical, mining, chemical, and biotechnology industries. The ISEP® and CSEP® systems are currently used in installations worldwide for a variety of applications in industrial settings, as well as in selected environmental applications including perchlorate and nitrate removal from drinking water. The core technology of these systems is the proprietary rotary distribution valve. This valve technology is offered in combination with a turntable for movement of media vessels, or with static media vessels where vessel-movement is simulated by recent advances in valve technology.
The Company assembles its equipment using parts that are both manufactured internally as well as purchased from other suppliers. During periods of heightened demand, manufacturing and assembly may be outsourced to other qualified manufacturers.
Sales for the Equipment segment were $38.9 million, $39.3 million, and $45.3 million for the years ended December 31, 2016, 2015, and 2014, respectively.
Consumer. The primary product offered in the Consumer segment is carbon cloth. Carbon cloth, which is activated carbon in cloth form, is manufactured in the United Kingdom (UK) and sold to the medical, military, and specialty markets. First developed in the 1970’s, activated carbon cloth was originally used in military clothing and masks to protect wearers against nuclear, biological and chemical agents. Today, activated carbon cloth can be used in numerous additional applications, including sensor protection, filters for ostomy bags, wound dressings, conservation of artifacts, and respiratory masks.
Sales for the Consumer segment were $8.7 million, $9.2 million, and $11.6 million for the years ended December 31, 2016, 2015, and 2014, respectively.
6
Other. As mentioned previously, the Company’s New Business is reported in Other. In summary, the New Business is a leading European manufacturer of wood-based activated carbon, coal-based activated carbon reactivation, and diatomaceous earth and perlite filtration media, and a leading distributor of such products and services primarily throughout the European region and into Asia. With four manufacturing facilities located in France and two in Italy, the 2016 sales of the New Business were $12.1 million from its date of acquisition on November 2, 2016 through December 31, 2016.
The New Business’ wood-based activated carbon manufacturing facility is located in Parentis en Born, France, which is ideally situated in the heart of a forest in Europe. It is the only European activated carbon facility to have both steam and chemical activation process capabilities on the same site. The New Business’ manufacturing processes impart first-rate physio-chemical properties to the final activated carbon products including high porosity, large adsorption capacity, permeability, and – when combined with a washing process – a high level of purity. Its products are sold primarily in Europe to food, beverage, industrial, fine chemicals and pharmaceutical customers. It also sells product into Asia, primarily India, principally for pharmaceutical end market usage. The Company’s products are well known in the regional market places as Acticarbone® and Anticromos®.
The New Business’ coal-based granular activated carbon reactivation capability is located in northern Italy, which is complementary to the location of the Company’s other European reactivation facilities – which are located in the UK and Belgium. Its capabilities include both food grade and industrial grade reactivation kilns.
The remainder of the New Business is related to the manufacture of diatomaceous earth (DE) and perlite filtration media products. These products, which are primarily used as filter aids in beverage, food, and industrial applications, are marketed and distributed across the European region in relatively close proximity to their manufacturing locations.
For the production of DE products, the New Business is vertically integrated from the raw material source to the final product, as it owns two mineral deposit quarry sources which provide raw materials for its DE manufacturing processes. DE is manufactured from diatomite, which is a lightweight and porous rock formed over many years by the successive accumulation and fossilization of the skeletal remains of single-cell algae – or diatoms – that lived in lakes, and were able to fix soluble silica on their shells. These owned quarries each have 20 or more years of raw material reserves available. The Company manufactures DE through a multi-step process that includes crushing, milling, calcination, and packaging. The New Business’ DE products are sold throughout the European region under the broadly recognized Clarcel® brand name.
The New Business’ perlite products, widely known in Europe as Randalite® and Randafil™, are manufactured from perlite oar, which is a silica rock of volcanic origin that contains fine water droplets. Through the New Business’ manufacturing process it is expanded at high temperature then crushed and grated into final product form. The Company obtains its raw material for perlite manufacturing from mines located in the Mediterranean region.
Markets
The Company participates in six primary markets: Potable Water, Industrial Process, Environmental Water, Environmental Air, Food and Beverage, and Specialty markets. Potable Water applications include municipal drinking water treatment as well as point of entry and point of use devices. Applications in the Industrial Process Market include catalysis, product recovery and purification of chemicals, specialty chemicals and pharmaceuticals, as well as process water treatment. The major applications for the two Environmental markets include wastewater treatment, groundwater remediation, ballast water treatment, VOC removal from vapors, and mercury control in flue gas streams. Food and Beverage applications include wine, bottling, brewing, amino acids, and sweetener purification. Medical, personal protection (military and industrial), automotive, consumer, and precious metals applications comprise the Specialty Market.
Potable Water Market. The Company sells activated carbons, equipment, custom reactivation services, ion exchange technology, and UV technologies to municipalities for the treatment of potable water. The activated carbon adsorption technology is used to remove both regulated and non-regulated contaminants of concern, including disinfection by-products precursors, perfluorinated compounds, pesticides, carcinogenic volatile organic compounds, algal toxins, other dissolved organic materials, and taste and odor compounds to meet regulated limits or to make the water quality acceptable to the public. The Company also sells to original equipment manufacturers (OEMs) of home water purification systems. Granular and powdered activated carbon products are sold in this market and in many cases the
7
granular activated carbon functions both as the primary filtration media as well as an adsorption media to remove contaminants from the water. Ion exchange resins are sold for use in both fixed beds and continuous counter-current operations to meet strict regulatory guidelines for perchlorate in water. UV advanced oxidation systems are sold for the destruction of waterborne contaminants, and UV disinfection systems are sold for the inactivation of pathogens in surface water.
Industrial Process Market. In industrial processing, the Company’s activated carbon and DE filtration media products are used either for purification, separation or concentration of customers’ products in the manufacturing process. The Company sells a wide range of activated carbons to the chemical, petroleum refining, and process industries for the purification of organic and inorganic chemicals, amines and vitamins. Further, activated carbon is used in treatment of natural gas, biogas and other high purity gases to remove unwanted contamination. The liquefied natural gas industry uses activated carbons to remove mercury compounds that would otherwise corrode process equipment. Activated carbons are also sold for gasoline vapor recovery equipment. The Company has a range of high purity activated carbons that are ideally suited as catalyst carriers and for use in the fine chemicals and pharmaceutical industries. The Company’s advanced ion exchange technology is used for a variety of industrial processes including separation and recovery in hydrometallurgy applications, decolorization in pulp and paper, the production of organic and inorganic chemicals, and the purification of brine.
Environmental Water and Air Markets. The Company offers its products and services to assist various industries in meeting the stringent environmental requirements imposed by various government entities. Products used for wastewater and ballast water treatment, the cleanup of contaminated groundwater, surface impoundments, and accidental spills comprise a significant need in this market. The Company provides products and services employing both activated carbon adsorption and UV technologies for emergency and temporary cleanup services as well as for permanent installations.
The Company’s reactivation service is an especially important element if the customer has contaminants that are hazardous organic chemicals. Reactivation of spent carbon protects the environment and eliminates the customers’ expense, potential liability, and difficulty in securing disposal options (such as landfills) for hazardous organic chemicals.
Activated carbon is also used in the chemical, pharmaceutical, and refining industries for purification of air discharge to remove contaminants such as benzene, toluene, and other volatile organics. In addition, reduction of mercury emissions from coal-fired power plants in the U.S. and Canada is a significant market, and is served by the Company with its broad line of FLUEPAC® powdered activated carbons.
The Company’s Rayox® UV System is an industry staple for the destruction of groundwater pollutants, as well as for the removal of alcohol, phenol and acetone in process water and total organic compound (TOC) reduction in wastewater treatment.
The Company’s Hyde GUARDIAN® BWMS is a fully automated system that can be integrated into a ship’s ballast control system. The compact design can be skid mounted for new construction or can be made modular for easy installation in crowded machinery spaces on existing vessels. It is capable of providing complete ballast water management solutions for a variety of vessels including cruise ships, cargo and container ships, offshore supply vessels, and military vessels.
Food and Beverage Market. In this market, sweetener manufacturers are principal purchasers of the Company’s activated carbon products, and also use the Company’s DE and perlite filtration media products. The Company’s wood-based and coal-based activated carbon products are used in the purification of dextrose and high fructose corn syrup. Activated carbons are also sold for use in the purification of cane sugar. The Company’s DE and perlite filtration media and high performing activated carbons are used in applications such as the wine, beer, and flavoring markets. Other food and beverage processing applications include de-colorization and purification of many different foods and beverages and for purifying water, liquids and gases prior to usage in brewing and bottling. Continuous ion-exchange systems are also used in this market for the production of lysine and vitamin E as well as purification of dextrose, high fructose corn syrup and sugar cane.
Specialty Market. The Company is a major supplier of specialty activated carbons to manufacturers of gas masks for the U.S. and European military as well as protective respirators and collective filters for first responders and private
8
industry. The markets for collective filters for U.S. and European military equipment, indoor air quality, and air containment in incineration and nuclear applications are also serviced.
Additional industries using activated carbons include precious metals producers to recover gold and silver from low-grade ore. The Company’s activated carbon cloth product is used in medical and other specialty applications.
Sales and Marketing
In the U.S., the Company operates primarily through a direct sales force. In some markets and regions, the Company also sells through agents and distributors. In Latin America and Canada, the Company maintains a sales office in Sao Paulo, Brazil, and sells through agent/distributor relationships.
In the Asia Pacific Region, the Company maintains sales offices in Suzhou, Jiangsu Province, China; Hong Kong; Osaka, Japan; Tokyo, Japan; Singapore; and Taipei, Taiwan, and uses direct sales as well as agents and distributors.
In Europe, the Company maintains sales offices in Feluy, Belgium; Kolding, Denmark; Paris, France; Beverungen, Germany; Milan, Italy; Ashton-in-Makerfield, United Kingdom; Houghton-le-Spring, United Kingdom; and Gothenburg, Sweden, and operates through a direct sales force. The Company also has a network of agents and distributors that conduct sales in certain countries in Europe, the Middle East, and Africa.
Many offices can play a role in sales of products or services from each of the Company’s segments. Geographic sales information can be found in Note 18 to the consolidated financial statements in Item 8 of this Annual Report. Also refer to Risk Factors in Item 1A.
Over the past three years, no single customer accounted for more than 10% of the total sales of the Company in any year.
Backlog
The Company had a sales backlog of $10.1 million and $15.4 million as of January 31, 2017 and 2016, respectively, in the Equipment segment. The $5.3 million decrease was a result of regulatory delays for ballast water treatment systems and several large contracts that were completed during 2016 that more than offset new contracts. The Company expects to carry approximately $1.3 million of the 2017 backlog into 2018 and $0.5 million into 2019.
Competition
With respect to the production and sale of activated carbon related products, the Company has a major global presence, and has several competitors in the worldwide market. Norit, a subsidiary of Cabot Corporation, Ingevity Corporation, formerly the Specialty Chemicals Division of WestRock Company, a U.S. company, Jacobi Carbons, a Swedish company, and Evoqua Water Technologies (formerly Siemens Water Technologies), a U.S. company, are the primary competitors. Chinese producers of coal-based activated carbon and certain East Asian producers of coconut-based activated carbon participate in the market on a worldwide basis and sell principally through numerous resellers. Competition in activated carbons, carbon equipment and services is based on quality, performance, and/or price. Other sources of competition for the Company’s activated carbon services and systems are alternative technologies for purification, filtration, and extraction processes that do not employ activated carbons.
A number of other smaller competitors engage in the production and sale of activated carbons and in local markets, but do not compete with the Company on a global basis. These companies compete with the Company in the sale of specific types of activated carbons, but do not generally compete with a broad range of products in the worldwide activated carbon business. For example, ADA Carbon Solutions, owned by Energy Capital Partners, competes with the Company in the America’s market for the removal of mercury from coal-fired power plant flue gas.
With respect to the Company’s DE and perlite filtration media products, due to their low weight, low density physical properties, the Company primarily distributes these products throughout the European region. Competitors in the region include EP Minerals, Imerys and Dicalite. Similar to activated carbon, competition for these products is primarily based on quality, performance and/or price.
9
The Company competes with several small regional companies for the sale of its reactivation services and carbon equipment in the U.S., Europe, Japan, and China.
The Company’s UV technologies product line has primary competition from Trojan Technologies, Inc., a Canadian company owned by Danaher Corporation, a U.S. company, and Xylem Inc, headquartered in White Plains, N.Y., a U.S. company.
Competition for The Company’s UV technologies Hyde Marine ballast water treatment systems utilizing UV and filtration includes Panasia of Busan, Korea, Alfa Laval of Sweden and Optimarin of Norway. As of December 31, 2016, more than 60 treatment systems have been granted IMO Type Approval, while three systems have been granted USCG Type Approval.
Raw Materials
The principal raw material purchased by the Company for its Activated Carbon and Service segment is bituminous coal from mines primarily in the U.S. purchased under long term and annual supply contracts, as well as spot purchases.
The Company purchases natural gas from various suppliers for use in its Activated Carbon and Service segment production facilities. In both the U.S. and Europe, natural gas is purchased pursuant to various annual and multi-year contracts, as well as spot purchases.
The Company buys various metals, acids and other additives that are used within the activated carbon production process to enhance the performance of certain products. These materials are bought under multi-year and annual contracts, as well as on a spot basis.
The purchase of key equipment components and fabrications are coordinated through agreements with various suppliers for UV, ISEP® and the carbon equipment markets.
With the recent addition of the New Business, the Company also purchases wood from a local forest in Europe. The Company owns two mineral deposit quarry sources, which provide raw materials for its DE manufacturing processes. These quarries each have 20 or more years of raw material reserves available. The Company obtains its crude perlite oar raw material from mines located in the Mediterranean region.
The Company does not presently anticipate any significant problems in obtaining adequate supplies of its raw materials or equipment components.
Research and Development
The Company’s primary research and development (R&D) activities are conducted at an innovation center in Pittsburgh, Pennsylvania with an additional facility in Japan. The Pittsburgh facility is used for the evaluation of experimental activated carbon and equipment and application development. Experimental systems are also designed and evaluated at this location.
The principal goals of the R&D’s research program are to improve the Company’s position as a technological leader in solving customers’ problems with its products, services and equipment; develop new products and services; and provide technical support to customers and operations of the Company. Research programs include new and improved methods for manufacturing and utilizing new and enhanced activated carbons.
The Company performs R&D to continuously advance the application of UV technologies to pathogens as well as new and emerging contaminants. Additionally, R&D is devoted to continual product advancement for reduction of life cycle cost to the customer and to ensure compliance with U.S. and international regulations. This includes R&D work on Advanced Oxidation for treatment of taste and odor compounds (MIB and Geosmin), nitrosamines, pesticide/herbicides and pharmaceutical/personal care products.
For ballast water treatment, Hyde Marine has active R&D for continued ballast treatment efficacy testing in multiple marine environments and new product development to extend the range, usability and end application.
10
Research and development expenses were $5.4 million, $6.4 million, and $6.4 million for the years ended December 31, 2016, 2015, and 2014, respectively.
Patents and Trade Secrets
The Company possesses a substantial body of technical knowledge and trade secrets and owns 49 U.S. patent applications and/or patents as well as 156 patent applications and/or patents in other countries. The issued patents expire in various years from 2017 through 2033.
The technology embodied in these patents, trade secrets, and technical knowledge applies to all phases of the Company’s business including production processes, product formulations, and application engineering. The Company considers this body of technology important to the conduct of its business.
Regulatory Matters
The Company is subject to various environmental health and safety laws and regulations of a nature considered normal to its business. It is the Company’s policy to accrue for amounts related to these matters when it is probable that a liability has been incurred and the loss amount is reasonably estimable. Refer to Note 16 to the consolidated financial statements in Item 8 of this Annual Report, which is incorporated herein by reference, for further details.
Employee Relations
As of December 31, 2016, the Company employed 1,334 persons on a full-time basis, 723 of whom were salaried and non-union hourly production, office, supervisory and sales personnel. The United Steelworkers represent 228 hourly personnel in the U.S. The current contracts with the United Steelworkers expire on July 31, 2018, at the Pittsburgh, Pennsylvania facility, February 17, 2019 at the Columbus, Ohio facility and June 9, 2017 at the Company’s Catlettsburg, Kentucky facility. The 66 hourly personnel at the Company’s Belgian facility are represented by two national labor organizations with contracts that expired on December 31, 2016 and are in the process of being renegotiated. The 63 hourly personnel at the Company’s facilities in Italy are represented by two national labor organizations with one contract that expired on December 31, 2016 and is in the process of being renegotiated and two that will expire on December 31, 2017. The 254 hourly personnel at the Company’s facilities in France are represented by multiple national labor organizations with contracts that will expire on February 2, 2018.
Copies of Reports
The periodic and current reports of the Company filed with the SEC pursuant to Section 13(a) of the Securities Exchange Act of 1934 are available free of charge, as soon as reasonably practicable after the same are filed with or furnished to the SEC, at the Company’s website at www.calgoncarbon.com. All other filings with the SEC are available on the SEC’s website at www.sec.gov.
Copies of Corporate Governance Documents
The following Company corporate governance documents are available free of charge at the Company’s website at www.calgoncarbon.com and such information is available in print to any stockholder who requests it by contacting the Secretary of the Company at 3000 GSK Drive, Moon Township, PA 15108.
|
· |
Corporate Governance Guidelines |
|
· |
Audit Committee Charter |
|
· |
Compensation Committee Charter |
|
· |
Governance Committee Charter |
|
· |
Investment Committee Charter |
|
· |
Code of Business Conduct and Ethics |
|
· |
Code of Ethical Business Conduct Supplement for Chief Executive and Senior Financial Officers |
|
· |
Related Party Transaction Policy |
11
Risks relating to our business
Increases in U.S. and European imports of Chinese or other foreign manufactured activated carbon could have an adverse effect on our financial results.
We face pressure and competition in our U.S. and European markets from brokers of low cost imported activated carbon products, primarily from China. We believe we offer the market technically superior products and related customer support. However, in some applications, low cost imports have become accepted as viable alternatives to our products because they have been frequently sold at less than fair value in the market. If the markets in which we compete experience an increase in these imported low cost carbons, especially if sold at less than fair value, we could see declines in net sales. In addition, the sales of these low cost activated carbons may make it more difficult for us to pass through raw material price increases to our customers.
In response to a petition from the U.S. activated carbon industry filed in March 2006, the U.S. Department of Commerce (Commerce Department) announced the imposition of anti-dumping duties starting in October 2006. The Commerce Department announcement was based on extensive economic analysis of the operations and pricing practices of the Chinese producers and exporters. The Commerce Department announcement required U.S. Customs and Border Protection to require importers of steam activated carbon from China to post a provisional bond or cash deposit in the amount of the duties. The anti-dumping duties are intended to offset the amount by which the steam activated carbon from China is sold at less than fair value in the U.S.
Annual reviews of duties begin to occur in April of the year following the twelve month period then completed. The significant anti-dumping duties originally imposed by the Commerce Department, and the affirmative decision by the International Trade Commission (ITC), has had an adverse impact on the cost of Chinese manufactured activated carbon imported into the U.S. However, the anti-dumping duties could be further reduced or eliminated in the future which could adversely affect demand or pricing of our product.
We have operations in multiple foreign countries and, as a result, are subject to foreign exchange translation risk, which could have an adverse effect on our financial results.
We conduct significant business operations in several foreign countries. Of our 2016 net sales, approximately 47% were sales to customers outside of the U.S., and 2016 net sales denominated in non-U.S. dollars represented approximately 32% of our overall net sales. With the acquisition of the New Business, these percentages are expected to increase. We conduct business in the local currencies of each of our foreign subsidiaries or affiliates. Those local currencies are then translated into U.S. dollars at the applicable exchange rates for inclusion in our consolidated financial statements. The exchange rates between some of these currencies and the U.S. dollar in recent years have fluctuated significantly and may continue to do so in the future. Changes in exchange rates, particularly the strengthening of the U.S. dollar, could significantly reduce our sales and profitability from foreign subsidiaries or affiliates from one period to the next as local currency amounts are translated into fewer U.S. dollars.
Our European and Japanese activated carbon businesses are sourced from both the U.S. and China, which subjects these businesses to foreign exchange transaction risk.
Our virgin activated carbon is produced primarily in the U.S. We also source significant quantities of activated carbon in China. Produced and sourced activated carbons are provisioned to all of our global operations. Purchases of these carbons are typically denominated in U.S. dollars yet are ultimately sold in other currencies thereby creating foreign currency exchange transaction risk. We generally execute foreign currency derivative contracts of not more than eighteen months in duration to cover a portion of our known or projected foreign currency exposure. However, those contracts do not protect us from longer-term trends of a strengthening U.S. dollar, which could significantly increase our cost of activated carbon delivered to our European and Japanese markets, and we may not be able to offset these costs by increasing our prices.
12
Our financial results could be adversely affected by an interruption of supply or an increase in the price of raw materials we use, such as coal and wood.
We use bituminous coal as the main raw material in our activated carbon production process. Based upon our current projected usage and price, we estimate that our 2017 coal costs in the U.S. will be approximately $26.6 million excluding the cost of transportation to our carbon manufacturing facilities. We have various annual and multi-year contracts in place for the supply of our coal that expire at various intervals in 2017 and 2018 and cover approximately 88% of our expected 2017 tonnage. Interruptions in coal supply caused by mine accidents, labor disputes, transportation delays, breach of supplier contractual obligations, floods or other events for other than a temporary period could have an adverse effect on our ability to meet customer demand. We use very specific high quality metallurgical coals for many of our products. Our inability to obtain these high-quality coals at competitive prices in a timely manner due to changing market conditions with limited high-quality suppliers could also have an adverse affect on our financial results. In addition, increases in the prices we pay for coal under our supply contracts could adversely affect our financial results by significantly increasing production costs. Based upon the current estimated usage and price of coal in 2017, a hypothetical 10% increase in the price of coal, excluding transportation costs, that is not covered by our supply contracts, would result in $0.5 million of additional pre-tax expense to us. We may not be able to pass through raw material price increases to our customers.
Additionally, as a result of our acquisition of the New Business in late 2016, wood has become an important raw material for us. We have various contracts in place to secure nearly half of our wood requirement through 2017. Since we require a certain quality of wood, our inability to secure this product could affect our ability to meet customer demand for our products. Our inability to obtain this quality at a reasonable price in a timely manner could affect our operations or financial position. We may not be able to pass through these raw material price increases to our customers.
A planned or unplanned shutdown at one of our production facilities could have an adverse effect on our financial results.
We operate multiple facilities and source product from strategic partners who operate facilities which are close to water or in areas susceptible to floods, hurricanes, and earthquakes. An unplanned shutdown at any of our or our strategic partners’ facilities for more than a temporary period as a result of a hurricane, typhoon, earthquake, flood or other natural disaster, or as a result of fire, explosions, war, terrorist activities, political conflict or other hostilities, or as a result of unforeseen mechanical problems, could significantly affect our ability to meet our demand requirements, thereby resulting in lost sales and profitability in the short-term or eventual loss of customers in the long term. In addition, a prolonged planned shutdown of any of our production facilities due to a change in the business conditions could result in impairment charges that could have an adverse impact on our financial results.
Delays in enactment of new state or federal regulations could restrict our ability to reach our strategic growth targets and lower our return on invested capital.
Our strategic growth initiatives are reliant upon more restrictive environmental regulations being enacted for the purpose of making water and air cleaner and safer. Examples include regulation of mercury emissions, drinking water disinfection by-products, and ship ballast water. If stricter regulations are delayed or are not enacted or enacted but subsequently repealed or amended to be less strict, or enacted with prolonged phase-in periods, our sales growth targets could be adversely affected and our return on invested capital could be reduced.
For example, our Hyde GUARDIAN® ballast water treatment system received type approval from the IMO in April 2009. However, the IMO Ballast Water Management Convention, which mandates the use of IMO approved ballast water treatment systems for ships in international traffic, was not ratified until September 2016 and is not scheduled to go into force until September 2017. Similarly, the USCG regulates ballast water in U.S. waters, and will not follow the IMO convention. We, along with several other ballast water treatment system manufacturers have received Alternate Management System designation from the USCG, but this is a temporary designation while full USCG type approval is pursued. In December 2015, the USCG decided it would not allow us, and several other manufacturers of ultraviolet light-based ballast water treatment systems, to use the Most Probable Number (MPN) test method for purposes of testing the Company’s system to apply for type approval under USCG regulations. Consequently, we have redesigned our Hyde GUARDIAN® system under USCG testing protocols and are embarking on testing to support our application for USCG Type Approval in the fourth quarter of 2017. The first USCG type approvals were granted to competitors in December 2016 and two of these approvals were for UV light-based systems. While we remain confident in our product’s
13
capabilities, there can be no assurance that we will receive USCG type approval or that additional approval of competing systems will not have an adverse effect on the Company’s ability to compete in the market for ballast water treatment systems for vessels discharging ballast water in U.S. waterways and ports.
Our required capital expenditures may exceed estimates.
Our capital expenditures were $31.9 million in 2016 and are forecasted to be approximately $70 million to $80 million in 2017, including capital expenditures related to the New Business. Future capital expenditures may be significantly higher and may vary substantially if we are required to undertake certain actions to comply with new regulatory requirements or compete with new technologies. We may not have the capital to undertake the capital investments. If we are unable to do so, we may not be able to effectively compete.
Encroachment into our markets by competitive technologies could adversely affect our financial results.
Activated carbon is utilized in various applications as a cost-effective solution to solve customer problems. If other competitive technologies, such as membranes, ozone and UV, are advanced to the stage in which such technologies could cost effectively compete with activated carbon technologies, we could experience a decline in net sales, which could adversely affect our financial results.
Our industry is highly competitive. If we are unable to compete effectively with competitors having greater resources than we do, our financial results could be adversely affected.
Our activated carbon and service business faces significant competition principally from Cabot Norit, the MWV (MeadWestvaco) Specialty Chemicals Division of WestRock Company and Evoqua Water Technologies, as well as from Chinese and European activated carbon producers and East Asian producers of coconut-based activated carbon. Our UV technology products face significant competition principally from Trojan Technologies, Inc., which is owned by Danaher Corporation, and Xylem. Our competitors include major manufacturers and diversified companies, a number of which have revenues and capital resources exceeding ours, which they may use to develop more advanced or more cost-effective technologies, increase market share or leverage their distribution networks. We could experience reduced net sales as a result of having fewer resources than these competitors.
Our international operations are subject to political and economic risks for conducting business in corrupt environments.
We conduct business in developing countries, and we are focusing on increasing our sales in regions such as South America, Southeast Asia, India, China and the Middle East, which are less developed, have less stability in legal systems and financial markets, and are generally recognized as potentially more corrupt business environments than the U.S. and therefore, present greater political, economic and operational risks. We emphasize compliance with the law and have policies in place, procedures and certain ongoing training of employees with regard to business ethics and key legal requirements such as the U.S. Foreign Corrupt Practices Act (FCPA), the United Kingdom Bribery Act (UKBA) and all applicable export control laws and regulations of the U.S. and other countries (the Export Regulations); however, there can be no assurances that our employees will adhere to our code of business conduct, other Company policies, the FCPA, the UKBA or the Export Regulations. If we fail to enforce our policies and procedures properly or maintain internal accounting practices to accurately record our international transactions or if we violate any of these laws or regulations, we may be subject to severe criminal or civil sanctions and penalties, including fines, debarment from export privileges and loss of authorizations needed to conduct aspects of our international business. We could incur significant costs for investigation, litigation, fees, settlements and judgments which, in turn, could negatively affect our business, financial condition and results of operations.
Significant stockholders or potential stockholders may attempt to effect changes at the Company or acquire control over the Company, which could adversely affect the Company’s results of operations and financial condition.
Stockholders of the Company may from time to time engage in proxy solicitations, advance stockholder proposals or otherwise attempt to effect changes or acquire control over the Company. Campaigns by stockholders to effect changes at publicly traded companies are sometimes led by investors seeking to increase short-term stockholder value through actions such as financial restructuring, increased debt, special dividends, stock repurchases or sales of assets or the entire
14
company. Responding to proxy contests and other actions by activist stockholders can be costly and time-consuming, disrupting the Company’s operations and diverting the attention of the Company’s Board of Directors and senior management from the pursuit of business strategies. As a result, stockholder campaigns could adversely affect the Company’s results of operations and financial condition.
Failure to innovate new products or applications could adversely affect our ability to meet our strategic growth targets.
Part of our strategic growth and profitability plans involve the development of new products or new applications for our current products in order to replace more mature products or markets that have seen increased competition. If we are unable to develop new products or applications, our financial results could be adversely affected.
Our inability to successfully negotiate new collective bargaining agreements upon expiration of the existing agreements could have an adverse effect on our financial results.
We have collective bargaining agreements in place at six production facilities covering approximately 46% of our full-time workforce as of December 31, 2016. Those collective bargaining agreements expire through 2019. Any work stoppages as a result of disagreements with any of the labor unions or our failure to renegotiate any of the contracts as they expire could disrupt production and significantly increase product costs as a result of less efficient operations caused by the resulting need to rely on temporary labor.
Our business is subject to a number of global economic risks.
Financial markets in the U.S., Europe, and Asia continue to experience disruption, including, among other things, volatility in security prices, diminished liquidity and credit availability, rating downgrades of certain investments and declining valuations of others. Governments have taken actions intending to address these market conditions that include restricted credit and declines in values of certain assets.
An economic downturn in the businesses or geographic areas in which we sell our products could reduce demand for our products and result in a decrease in sales volume that could have a negative impact on our results of operations. Continued volatility and disruption of financial markets in the U.S., Europe and Asia could limit our customers’ ability to obtain adequate financing or credit to purchase our products or to maintain operations, and result in a decrease in sales volumes that could have a negative impact on our results of operations.
Our international operations expose us to political and economic uncertainties and risks from abroad, which could negatively affect our results of operations.
We have manufacturing facilities and sales offices throughout the world which are subject to economic conditions and political factors within the respective countries which, if changed in a manner adverse to us, could negatively affect our results of operations and cash flow. Political risk factors include, but are not limited to, taxation, nationalization, inflation, currency fluctuations, foreign exchange restrictions, increased regulation and quotas, tariffs and other protectionist measures. Approximately 79% of our sales in 2016 were generated by products sold in the U.S., Canada, and Western Europe while the remaining sales were generated in other areas of the world, such as Asia, Eastern Europe, and Latin America.
Environmental compliance and remediation and potential climate change could result in substantially increased capital requirements and operating costs.
Our production facilities are subject to environmental laws and regulations in the jurisdictions in which they operate or maintain properties. Costs may be incurred in complying with such laws and regulations. Each of our domestic production facilities require permits and licenses issued by local, state and federal regulators which regulate air emissions, water discharges, and solid waste handling. These permits are subject to renewal and, in some circumstances, revocation. International environmental requirements vary and could have substantially lesser requirements that may give competitors a competitive advantage. Additional costs may be incurred if environmental remediation measures are required. In addition, the discovery of contamination at any of our current or former sites or at locations at which we dispose of waste may expose us to cleanup obligations and other damages. In addition, there is currently vigorous debate over the effect of CO² gas releases and the effect on climate change. Many of our activities create CO² gases.
15
Should legislation or regulation be enacted, it could have a material adverse effect upon our ability to expand our operations or perhaps continue to operate as we currently do.
Our financial results could be adversely affected by shortages in energy supply or increases in energy costs.
The price for and availability of energy resources could be volatile as it is affected by political and economic conditions that are outside our control. We utilize natural gas as a key component in our activated carbon reactivation manufacturing process at many of our facilities. If shortages of, or restrictions on the delivery of natural gas occur, production at our activated carbon reactivation facilities would be reduced, which could result in missed deliveries or lost sales. We also have exposure to fluctuations in energy costs as they relate to the transportation and distribution of our products. We may not be able to pass through natural gas and other fuel price increases to our customers.
Our business includes capital equipment sales which could have fluctuations due to the cyclical nature of that type of business.
Our Equipment segment represented approximately 8% of our 2016 net sales. This business generally has a long project life cycle from bid solicitation to project completion and often requires customers to make large capital commitments well in advance of project execution. In addition, this business is usually affected by the general health of the overall economy. As a result, sales and earnings from the Equipment segment could be volatile.
Our products could infringe the intellectual property rights of others, which may cause us to pay unexpected litigation costs or damages or prevent us from selling our products.
Although it is our intention to avoid infringing or otherwise violating the intellectual property rights of others, our products may infringe or otherwise violate the intellectual property rights of others. We may be subject to legal proceedings and claims, including claims of alleged infringement by us of the patents and other intellectual property rights of third parties. Intellectual property litigation is expensive and time-consuming, regardless of the merits of any claim.
If we were to discover or be notified that our products potentially infringe or otherwise violate the intellectual property rights of others, we may need to obtain licenses from these parties or substantially re-engineer our products in order to avoid infringement. We might not be able to obtain the necessary licenses on acceptable terms, or at all, or be able to re-engineer our products successfully. Moreover, if we are sued for infringement and lose the suit, we could be required to pay substantial damages and/or be enjoined from using or selling the infringing products. Any of the foregoing could cause us to incur significant costs and prevent us from selling our products.
Declines in the operating performance of one of our business segments could result in an impairment of the segment’s goodwill.
As of December 31, 2016, we had consolidated goodwill of approximately $66.3 million, of which $41.0 million is related to the acquisition of the New Business reported in Other. The remaining $25.3 million of goodwill is primarily from our Activated Carbon and Service and Equipment segments. We test our goodwill on an annual basis or when an indication of possible impairment exists in order to determine whether the carrying value of our assets is still supported by the fair value of the underlying business. To the extent that it is not, we are required to record an impairment charge to reduce the asset to fair value. A decline in the operating performance of any of our business segments could result in a goodwill impairment charge which could have a material effect on our financial results.
Our pension plans are currently underfunded, and we could be subject to increases in pension contributions to our defined benefit pension plans, thereby restricting our cash flow.
We sponsor various pension plans in the U.S. and Europe that are underfunded and may require significant cash payments. We contributed $0.7 million and $1.3 million to our U.S. pension plans and $1.7 million and $1.8 million to our European pension plans in 2016 and 2015, respectively. We currently expect to contribute in 2017 approximately $2.9 million to our U.S. plans and $1.7 million to our European plans to meet minimum funding requirements, in accordance with our funding policy.
16
The funding status of our pension plans is determined using many assumptions, such as inflation, rates of return on investments, mortality, turnover and interest rates, any of which could prove to be different than projected. If the performance of the assets in our pension plans does not meet our expectations, or if other actuarial assumptions are modified, or not realized, we may be required to contribute more to our pension plans than we currently expect. For example, an approximate 25-basis point decline in the funding target interest rate under Section 430 of the Internal Revenue Code, as added by the Pension Protection Act of 2006 for minimum funding requirements, would increase our minimum required funding policy contributions to our U.S. pension plans by approximately $1.0 million to $2.0 million over the next three fiscal years. This amount reflects the provisions of Moving Ahead for Progress in the 21st Century Act (MAP-21) and the Highway and Transportation Funding Act of 2014 (HAFTA), both of which affect pension plan funding.
Our pension plans are underfunded in the aggregate by approximately $38 million as of December 31, 2016 based on comparing the projected benefit obligation, calculated using actuarial assumptions in accordance with Accounting Standards Codification (ASC) 715 “Compensation — Retirement Benefits,” to the fair value of plan assets. Our U.S. pension plans, which were underfunded by approximately $22 million as of December 31, 2016, are subject to ERISA. In the event our U.S. pension plans are terminated for any reason while the plans are less than fully funded, we will incur a liability to the Pension Benefit Guaranty Corporation that may be equal to the entire amount of the underfunding at the time of the termination. In addition, changes in required pension funding rules that were affected by the enactment of the Pension Protection Act of 2006 have significantly increased funding requirements, which could have an adverse effect on our cash flows. If cash flows from operations are insufficient to fund our worldwide pension liability, we may be required to reduce or delay capital expenditures, or to seek additional capital. Refer to Note 9 to the consolidated financial statements in Item 8 of this Annual Report.
We have identified a material weakness in our internal controls over financial reporting that, if not properly corrected, could have a material adverse effect on our operations and result in material misstatements in our financial statements.
As described in the Report of Management in "Item 8. Financial Statements and Supplementary Data," we have concluded that our internal control over financial reporting was ineffective as of December 31, 2016 because a material weakness existed in our internal control over financial reporting related to the recognition of revenue for a subset of transactions within the U.S. potable water market.
Management has identified actions that the Company intends to implement immediately in order to remediate this material weakness. However, we have not completed all of the corrective actions that we believe are necessary. As we continue to evaluate and work to remediate the material weakness, we may implement additional measures. The actions we are taking to remediate the material weakness are subject to ongoing senior management review, as well as oversight by the Audit Committee of our Board of Directors.
If our remedial measures are insufficient to address the material weakness, or if additional material weaknesses or significant deficiencies in our internal control over financial reporting are discovered or occur in the future, our consolidated financial statements may contain material misstatements and we could be required to restate our financial results, which could adversely affect our stock price and result in our inability to maintain compliance with applicable stock exchange listing requirements.
Existing and future laws, regulations and other legal requirements relating to our business may increase our costs of doing business and may expose us to liability.
We are subject to laws, regulations and other legal requirements enacted or adopted by federal, state and local authorities, as well as foreign authorities relating to various matters, including the protection of our workers, our consumers and the environment. Complying with these requirements has had, and will continue to have an effect on our costs of operations and competitive position. In addition, there is the possibility that we could incur substantial costs as a result of violations under these laws or be subject to governmental orders which cause us to alter our operations or expend substantial resources to comply with such orders. Any additional laws, regulations and other legal requirements enacted or adopted by federal, state and local authorities, as well as foreign authorities or new interpretations of existing legal requirements by regulatory bodies could further affect our costs of operations and competitive position. For example, as a result of our acquisition of the New Business in late 2016, we may be subject to additional regulations currently under consideration related to the effects of crystalline silica. If such regulations are ultimately adopted, we
17
may need to expend substantial resources to comply with these regulations and if we fail to comply with these new regulations we could be subject to fines, penalties and other liabilities.
Our future success may be dependent upon the successful integration of our acquisitions and reaping the anticipated benefits from those acquisitions.
We may make acquisitions of businesses that complement or expand our current business. No assurance can be given that we will be able to identify suitable acquisition opportunities, negotiate acceptable terms, obtain financing for acquisitions on acceptable terms or successfully acquire the identified targets. The success of any completed acquisition will depend on our ability to effectively integrate the acquired business into our existing operations and obtain the benefits contemplated at the time we made the acquisition. The process of integrating and operating any acquired business may involve unforeseen difficulties and may require a disproportionate amount of our managerial and financial resources. Our failure to successfully integrate the acquired businesses and assets into our existing operations and achieve the anticipated benefits from those acquisitions could have a material adverse effect on our financial condition and results of operations.
Our certificate of incorporation and bylaws and Delaware law contain provisions that may delay or prevent an otherwise beneficial takeover attempt of our Company.
Certain provisions of our certificate of incorporation and bylaws and Delaware law could make it more difficult for a third party to acquire us, even if doing so would be beneficial to our stockholders. These include provisions:
|
· |
providing for a board of directors with staggered, three-year terms; |
|
· |
requiring super-majority voting to affect certain amendments to our certificate of incorporation and bylaws; |
|
· |
limiting the persons who may call special stockholders’ meetings; |
|
· |
limiting stockholder action by written consent; |
|
· |
establishing advance notice requirements for nominations for election to the board of directors or for proposing matters that can be acted upon at stockholders’ meetings; and |
|
· |
allowing our board of directors to issue shares of preferred stock without stockholder approval. |
These provisions, alone or in combination with each other, may discourage transactions involving actual or potential changes of control, including transactions that otherwise could involve payment of a premium over prevailing market prices to holders of our common stock, or could limit the ability of our stockholders to approve transactions that they may deem to be in their best interest.
The security of our information technology systems could be compromised, which could adversely affect our ability to operate.
Increased global information technology security requirements, threats and sophisticated and targeted computer crime pose a risk to the security of our systems, networks and the confidentiality, availability and integrity of our data. Despite our efforts to protect sensitive information and confidential and personal data, our facilities and systems may be vulnerable to security breaches. This could lead to negative publicity, theft, modification or destruction of proprietary information or key information, manufacture of defective products, production downtimes and operational disruptions, which could adversely affect our reputation, competitiveness and results of operations.
Item 1B. Unresolved Staff Comments:
None
18
The Company believes that the production facilities, warehouses, service centers, sales offices, and quarries are adequate and suitable for its current operating needs. The following table sets forth the locations utilized by the Company:
|
Description |
|
Location |
|
Property Interest |
|
|
|
|
|
|
|
|
|
Carbon Manufacturing Plant |
|
Catlettsburg, Kentucky |
|
Owned |
|
|
Carbon Manufacturing Plant |
|
Pearlington, Mississippi |
|
Owned |
|
|
Carbon Manufacturing Plant |
|
Parentis-en-Born, France |
|
Owned |
|
|
Carbon Reactivation Plant |
|
Pittsburgh, Pennsylvania |
|
Owned |
|
|
Carbon Reactivation Plant |
|
Blue Lake, California |
|
Owned |
|
|
Carbon Reactivation Plant |
|
Feluy, Seneffe, Belgium |
|
Owned |
|
|
Carbon Reactivation Plant |
|
Gila Bend, Arizona |
|
Owned |
|
|
Carbon Reactivation Plant |
|
Columbus, Ohio |
|
Owned |
|
|
Carbon Reactivation Plant |
|
Grays, United Kingdom |
|
Owned |
|
|
Carbon Reactivation Plant |
|
Tipton, Dudley, United Kingdom |
|
Owned |
|
|
Carbon Reactivation Plant |
|
San Pietro di Legnago, Italy |
|
Owned |
|
|
Carbon Reactivation Plant |
|
Fukui, Japan |
|
Owned |
|
|
Carbon Reactivation Plant |
|
Suzhou, China |
|
Owned |
|
|
Equipment & Assembly Plant |
|
Pittsburgh, Pennsylvania |
|
Owned |
|
|
Diatomaceous Earth Plant |
|
Riom-ès-Montagnes, France |
|
Owned |
|
|
Diatomaceous Earth Plant |
|
Saint Bauzile, Chomerac, France |
|
Owned |
|
|
Diatomite Quarry |
|
Virargues, France |
|
Owned |
|
|
Diatomite Quarry |
|
Saint-Bauzile, France |
|
Owned |
|
|
Perlite Plant |
|
Foggia, Italy |
|
Owned |
|
|
2 Warehouses |
|
Pittsburgh, Pennsylvania |
|
Owned |
|
|
Carbon Reactivation Plant |
|
North Tonawanda, New York |
|
Leased |
|
|
Carbon Reactivation Plant |
|
Ashton-in-Makerfield, United Kingdom |
|
Leased |
|
|
UV Manufacturing & Fabrication Plant |
|
Coraopolis, Pennsylvania |
|
Leased |
|
|
Carbon Cloth Fabrication Plant |
|
Houghton-le-Spring, United Kingdom |
|
Leased |
|
|
Corporate Headquarters & Innovation Center |
|
Moon Township, Pennsylvania |
|
Leased |
|
|
Field Service Center |
|
Joliet, Illinois |
|
Leased |
|
|
Field Service Center |
|
St. Catherines, Ontario, Canada |
|
Leased |
|
|
Field Service Center |
|
Westlake, Louisiana |
|
Leased |
|
|
Field Service Center |
|
Douglasville, Georgia |
|
Leased |
|
|
Service Center |
|
Downingtown, Pennsylvania |
|
Leased |
|
|
Service Center |
|
Rutland, Massachusetts |
|
Leased |
|
|
Sales Office & Service Center |
|
Houston, Texas |
|
Leased |
|
|
Sales Office |
|
São Paulo, Brazil |
|
Leased |
|
|
Sales Office |
|
Beverungen, Germany |
|
Leased |
|
|
Sales Office |
|
Gothenburg, Sweden |
|
Leased |
|
|
Sales Office |
|
Paris, France |
|
Leased |
|
|
Sales Office |
|
Singapore, Singapore |
|
Leased |
|
|
Sales Office |
|
Taipei, Taiwan |
|
Leased |
|
|
Sales Office |
|
Osaka, Japan |
|
Leased |
|
|
Sales Office |
|
Hong Kong, China |
|
Leased |
|
|
Operational Office |
|
Malmaison, France |
|
Leased |
|
|
Operational Office |
|
Milan, Italy |
|
Leased |
|
|
Operational Office |
|
Tokyo, Japan |
|
Leased |
|
|
Office & Warehouse |
|
Tianjin, China |
|
Leased |
|
|
Office & Warehouse |
|
Ashton-in Makerfield, United Kingdom |
|
Leased |
|
|
Warehouse & Maintenance Facility |
|
Abidos, France |
|
Leased |
|
|
Warehouse, Service Center & Office |
|
Kolding, Denmark |
|
Leased |
|
|
4 Warehouses |
|
Huntington, West Virginia |
|
Leased |
|
|
3 Warehouses |
|
North Tonawanda, New York |
|
Leased |
|
|
Warehouse |
|
Coraopolis, Pennsylvania |
|
Leased |
|
|
Warehouse |
|
Santa Fe Springs, California |
|
Leased |
|
19
|
Warehouse |
|
Stockton, California |
|
Leased |
|
|
Warehouse |
|
Tempe, Arizona |
|
Leased |
|
|
Warehouse |
|
Kenova, West Virginia |
|
Leased |
|
|
Warehouse |
|
Phoenix, Arizona |
|
Leased |
|
|
Warehouse |
|
South Point, Ohio |
|
Leased |
|
|
Warehouse |
|
Singapore, Singapore |
|
Leased |
|
|
Warehouse |
|
Nitro, West Virginia |
|
Leased |
|
The Catlettsburg, Kentucky plant is the Company’s largest facility, with plant operations occupying approximately 50 acres of a 226-acre site. This plant, which serves the Activated Carbon and Service segment, produces granular and powdered activated carbons and acid washed granular activated carbons and reactivates spent granular activated carbons.
The Pittsburgh, Pennsylvania carbon production plant occupies a 15-acre site which serves the Activated Carbon and Service segment. Operations at the plant include the reactivation of spent granular activated carbons, the impregnation of granular activated carbons and the grinding of granular activated carbons into powdered activated carbons. The plant also has the capacity to finish coal-based or coconut-based specialty activated carbons. The plant is now partially idle while a 36,000 square foot warehouse is being constructed, which is expected to be completed in the first quarter of 2018.
The Pearlington, Mississippi plant occupies a site of approximately 100 acres. The plant has one production line that produces granular and powdered activated carbons for the Activated Carbon and Service segment.
The Columbus, Ohio plant occupies approximately 27 acres. Operations at the plant include the reactivation of spent granular activated carbons, impregnation of activated carbon, crushing activated carbon to fine mesh, acid and water washing, filter-filling, and various other value added processes to granular activated carbon for the Activated Carbon and Service segment.
The Pittsburgh, Pennsylvania Equipment and Assembly plant is located on Neville Island and is situated within a 16-acre site that includes a 300,000 square foot building. The Equipment and Assembly plant occupies 85,000 square feet with the remaining space used as a centralized warehouse for carbon inventory. The plant, which serves both the Equipment and Activated Carbon and Service segments, manufactures and assembles fully engineered carbon and ISEP® equipment for purification, concentration and separation systems. This plant also serves as the East Coast staging and refurbishment point for carbon service equipment.
The Coraopolis, Pennsylvania Equipment plants consist of a 44,000-square foot production facility and a 16,691-square foot production facility located near Pittsburgh, Pennsylvania. The facilities are adjacent properties and the primary focus is the manufacture of UV and Hyde GUARDIAN® equipment, including mechanical and electrical assembly, controls systems integration and validation testing of equipment. This location also serves as the Pilot Testing facility for Process Development, as well as the spare parts distribution center for UV and Hyde GUARDIAN® systems. These plants serve the Equipment segment.
The Gila Bend, Arizona facility occupies a 20-acre site. Operations at the plant include the reactivation of spent granular activated carbons for the Activated Carbon and Service segment.
The North Tonawanda, New York plant consists of 12,500 square feet. The facility houses a dry feed system, screening tower, reactivation furnace, storage tanks, and packaging system and services customers for the Activated Carbon and Service segment.
The Blue Lake plant, located near the city of Eureka, California, occupies approximately 2 acres. The primary operation at the plant includes the reactivation of spent granular activated carbons for the Activated Carbon and Service segment. The plant is currently idled.
The Feluy, Seneffe plant occupies a site of approximately 38 acres located 30 miles south of Brussels, Belgium. Operations at the plant include both the reactivation of spent granular activated carbons and the grinding of granular activated carbons into powdered activated carbons for the Activated Carbon and Service segment.
20
The Tipton plant, located near the city of Dudley, United Kingdom, occupies approximately 4 acres and became operational in 2016 after several years undergoing operational upgrades. It is a reactivation plant of spent granular activated carbon that serves the Activated Carbon and Service segment.
The Ashton-in-Makerfield plant occupies a 1.6-acre site, 20 miles west of Manchester, United Kingdom. Operations at the plant include the impregnation of granular activated carbons for the Activated Carbon and Service segment. The plant also has the capacity to finish coal-based or coconut-based activated carbons.
The Houghton le-Spring plant, located near the city of Newcastle, United Kingdom, occupies approximately 2 acres. Operations at the plant include the manufacture of woven and knitted activated carbon textiles and their impregnation and lamination for the Consumer segment.
The Grays plant occupies a 3-acre site near London, United Kingdom. Operations at the plant include the reactivation of spent granular activated carbons for the Activated Carbon and Service segment. The plant is currently idled.
The Fukui, Fukui Prefecture, Japan plant, that serves the Activated Carbon and Service segment, occupies a site of approximately 6 acres and has two production lines for carbon reactivation.
The Suzhou, China plant occupies approximately 11 acres and is licensed to export activated carbon products. This plant is a reactivation facility that serves the Activated Carbon and Service segment.
In November 2016, the following locations were acquired upon the consummation of the purchase of the New Business, which is being reported as Other in 2016 for segment reporting purposes:
The Parentis-en-Born plant occupies approximately 62 acres and is located in Landes Forest in Southwestern France. The plant is approximately 860,000 square feet and it is a virgin wood-based activation carbon plant.
The Riom-ès-Montagnes plant occupies approximately 3 acres and is located in south-central France. The plant produces Clarcel® brand diatomaceous earth which is mined from the diatomite quarry also acquired from CECA which is located in Viragues, France, approximately 23 miles from Riom-ès-Montagnes. The plant is approximately 30,000 square feet and the quarry is approximately 118 acres.
The Saint Bauzile plant, located in Chomerac, France produces Clarcel® brand diatomaceous earth which is mined from the diatomite quarry also acquired from CECA which is located in Saint-Bauzile, France. The plant occupies a 17 acre site, and is approximately 163,000 square feet.
The Foggia, Italy plant produces Randalite® and Randafil™ brands perlite filtration media and it is located in southern Italy. The plant occupies 8 acres and consists of approximately 353,000 square feet.
The San Peitro di Legnago plant, located in northern Italy, occupies approximately 5 acres. The primary operation at the plant, which consists of approximately 54,000 square feet, includes the reactivation of spent granular activated carbons.
The Company is involved in various legal proceedings, lawsuits and claims, including employment, product warranty and environmental matters of a nature considered normal to its business. It is the Company’s policy to accrue for amounts related to the legal matters when it is probable that a liability has been incurred and the loss amount is reasonably estimable.
On February 21, 2017, the Japan Fair Trade Commission (the JFTC) informed the Company’s subsidiary, Calgon Carbon Japan (CCJ) that it is investigating CCJ along with several other manufacturers and distributors that participate in the activated carbon market in Japan over concerns of anti-competitive conduct. The JFTC is investigating whether manufacturers and sellers of activated carbon used in water purification plants, garbage incineration plants and other similar facilities in Japan have acted in concert with each other in violation of the Japan Anti-Monopoly Act. JFTC agents searched the offices of CCJ, reviewing and collecting contracts and other business records and interviewed certain CCJ employees. At this early stage of the investigation, it is difficult to predict the outcome of this matter or what remedies, if any, may be imposed by the JFTC. CCJ is cooperating with the JFTC as it conducts its investigation.
21
Refer to Note 16 to the consolidated financial statements in Item 8 of this Annual Report, which is incorporated herein by reference.
Item 4. Mine Safety Disclosures:
Not applicable.
Item 5. Market for Registrant’s Common Equity, Related Stockholder Matters, and Issuer Repurchases of Equity Securities:
Common Shares and Market Information
Common shares are traded on the New York Stock Exchange under the trading symbol CCC. There were 980 registered stockholders as of December 31, 2016.
Quarterly Common Stock Price Ranges and Dividends
|
|
|
2016 |
|
2015 |
|
||||||||||||||
|
Fiscal Quarter |
|
High |
|
Low |
|
Dividend |
|
High |
|
Low |
|
Dividend |
|
||||||
|
First |
|
$ |
17.53 |
|
$ |
13.67 |
|
$ |
0.05 |
|
$ |
21.59 |
|
$ |
19.02 |
|
$ |
0.05 |
|
|
Second |
|
$ |
16.59 |
|
$ |
12.75 |
|
$ |
0.05 |
|
$ |
23.20 |
|
$ |
19.26 |
|
$ |
0.05 |
|
|
Third |
|
$ |
15.77 |
|
$ |
12.70 |
|
$ |
0.05 |
|
$ |
19.69 |
|
$ |
14.90 |
|
$ |
0.05 |
|
|
Fourth |
|
$ |
18.80 |
|
$ |
14.45 |
|
$ |
0.05 |
|
$ |
18.22 |
|
$ |
14.72 |
|
$ |
0.05 |
|
On February 18, 2015, the Company’s Board of Directors reinstated its common stock dividend program. Quarterly dividends of $0.05 per share were declared in each of the four quarters for the years ended December 31, 2016 and 2015. The Company did not declare or pay any dividends in 2014. Dividend declaration and payout are at the discretion of the Board of Directors. Future dividends will depend on the Company’s earnings, cash flows, and capital investment plans to pursue long-term growth opportunities.
The information appearing in Item 12 of Part III below regarding common stock issuable under the Company’s equity compensation plan is incorporated herein by reference.
Stockholder Return Performance Graph
The following performance graph and related information shall not be deemed “filed” with the Securities and Exchange Commission, nor shall such information be incorporated by reference into any future filing under the Securities Act of 1933 or Securities Exchange Act of 1934, each as amended, except to the extent that the Company specifically incorporates it by reference into such filing.
The graph below compares the yearly change in cumulative total stockholder return of the Company’s common stock with the cumulative total return of the Standard & Poor’s (S&P) 500 Stock Composite Index and the Peer Group. The Company believes that its core business consists of purifying air, water and other products. As such, the Company’s selected peer group consists of companies that are involved in lines of business that are similar to the Company’s core business. The Peer Group is comprised of five companies: Cabot Corporation, CLARCOR, Inc., Donaldson Company, Inc., ESCO Technologies Inc., and Lydall, Inc.
22
Comparison of Five-Year Cumulative Total Return*
Among Calgon Carbon’s Common Stock, S&P 500 Composite Index, and Peer Group
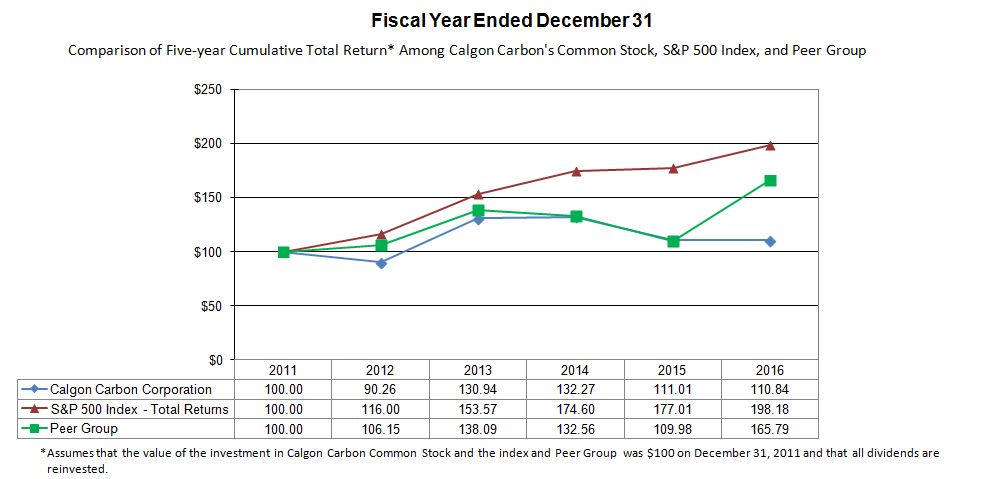
Issuer Repurchases of Equity Securities
|
|
|
|
|
|
|
|
|
|
(d) Maximum Number |
|
|
|
|
|
|
|
|
|
|
(c) Total Number of |
|
(or Approximate |
|
|
|
|
|
|
|
|
|
|
Shares Purchased |
|
Dollar Value) |
|
|
|
|
|
(a) Total |
|
|
|
|
as Part of Publicly |
|
of Shares that May |
|
|
|
|
|
Number |
|
(b) Average |
|
Announced |
|
Yet be Purchased |
|
||
|
|
|
of Shares |
|
Price Paid |
|
Repurchase Plans |
|
Under the Plans or |
|
||
|
Period |
|
Purchased (1) |
|
Per Share |
|
or Programs (2) |
|
Programs |
|
||
|
|
|
|
|
|
|
|
|
|
|
|
|
|
October 1 — October 31, 2016 |
|
— |
|
$ |
— |
|
— |
|
$ |
64,131,013 |
|
|
November 1 — November 30, 2016 |
|
— |
|
$ |
— |
|
— |
|
$ |
64,131,013 |
|
|
December 1 — December 31, 2016 |
|
624 |
|
$ |
17.87 |
|
— |
|
$ |
64,131,013 |
|
|
(1) |
Includes 624 shares surrendered to the Company by employees to satisfy tax withholding obligations on restricted share awards issued under the Company’s Equity Incentive Plan. Future purchases under this Plan will be dependent upon employee elections. |
|
(2) |
In December 2013, the Company’s Board of Directors authorized the repurchase of additional common stock, resulting in a total remaining availability of $150 million. There is no expiration date for this program. In April 2016, the Company announced that it would suspend the activities of the share repurchase program. |
23
Item 6. Selected Financial Data:
FIVE-YEAR SUMMARY OF SELECTED FINANCIAL DATA
Calgon Carbon Corporation
|
(Dollars in thousands, except per share data) |
|
2016 (1) |
|
2015 |
|
2014 |
|
2013 |
|
2012 (3) |
|
|||||
|
Income Statement Data: |
|
|
|
|
|
|
|
|
|
|
|
|
|
|
|
|
|
Net sales |
|
$ |
514,246 |
|
$ |
535,004 |
|
$ |
555,103 |
|
$ |
547,939 |
|
$ |
562,255 |
|
|
Net income |
|
$ |
13,797 |
|
$ |
43,463 |
|
$ |
49,370 |
|
$ |
45,713 |
|
$ |
23,272 |
|
|
Net income per common share, basic |
|
$ |
0.27 |
|
$ |
0.84 |
|
$ |
0.93 |
|
$ |
0.85 |
|
$ |
0.41 |
|
|
Net income per common share, diluted |
|
$ |
0.27 |
|
$ |
0.82 |
|
$ |
0.92 |
|
$ |
0.84 |
|
$ |
0.41 |
|
|
Cash dividends declared per common share |
|
$ |
0.20 |
|
$ |
0.20 |
|
$ |
— |
|
$ |
— |
|
$ |
— |
|
|
|
|
|
|
|
|
|
|
|
|
|
|
|
|
|
|
|
|
Balance Sheet Data (as of year end): |
|
|
|
|
|
|
|
|
|
|
|
|
|
|
|
|
|
Total assets |
|
$ |
775,218 |
|
$ |
656,518 |
|
$ |
621,661 |
|
$ |
590,078 |
|
$ |
577,769 |
|
|
Long-term debt (2) |
|
$ |
220,000 |
|
$ |
103,941 |
|
$ |
70,448 |
|
$ |
32,114 |
|
$ |
44,408 |
|
|
(1) |
Includes $15.7 million of costs related to the acquisition of the New Business, consisting primarily of $14.0 million of transaction costs. Total assets and long-term debt increased in 2016 as a result of the acquisition of the New Business. Refer to Note 20 of the consolidated financial statements in Item 8 of this Annual Report for further information. |
|
(2) |
Excludes $5.0 million and $7.5 million of debt which is classified as the current portion of long-term debt as of December 31, 2016 and 2015, respectively. Refer to Note 8 of the consolidated financial statements in Item 8 of this Annual Report for further information. Excludes $0.8 million, $2.2 million and $19.6 million of debt which was classified as current as of December 31, 2014, 2013, and 2012, respectively. |
|
(3) |
Includes $10.2 million of restructuring charges and $1.7 million of multi-employer pension charges. Also includes a $1.7 million charge related to an agreement with the Company’s former Chief Executive Officer. |
24
Item 7. Management’s Discussion and Analysis of Financial Condition and Results of Operations:
Overview
On November 2, 2016, the Company completed the acquisition of the wood-based activated carbon, reactivation and mineral-based filtration media business of CECA, a subsidiary of Arkema Group (New Business). Due to the complementary nature of the New Business’ products and market applications to those of the Company, and its significant exposure to less regulated, more traditional end markets, the addition of the New Business to the Company creates a more balanced global platform from which the Company can continue to grow by leveraging its now expanded capabilities in the global activated carbon and adjacent filtration media market areas.
The Company reported net income of $13.8 million or $0.27 per diluted share for 2016, as compared to net income of $43.5 million or $0.82 per diluted share for 2015. Net sales decreased $20.8 million or 3.9% in 2016 as compared to 2015. Without the $12.1 million net sales of the New Business for the two month period in 2016, net sales would have declined $32.9 million or 6.1% in 2016 as compared to 2015. The total negative impact of foreign currency translation due to a stronger U.S. dollar in the United Kingdom and China, partially offset by a weaker U.S. dollar in Japan on consolidated net sales was $2.8 million.
The Company’s results were impacted by acquisition related costs, a slowing global economy and the negative impact of a strong U.S. dollar. The Company continued to increase shareholder value through its common stock dividend program and its open market share repurchase program through April 2016.
Results of Operations
2016 Versus 2015
Net sales for the Activated Carbon and Service segment decreased $32.0 million or 6.6% from 2015. Included in this change was the negative impact of foreign currency translation which totaled $1.8 million.
|
|
|
Increase (Decrease) in Net Sales |
|
|||||||
|
|
|
|
|
|
Foreign |
|
Net of Foreign |
|
||
|
(Dollars in millions) |
|
As Reported |
|
Currency Impact |
|
Currency Impact |
|
|||
|
Environmental Air market |
|
$ |
(10.8) |
|
$ |
(0.6) |
|
$ |
(11.4) |
|
|
Environmental Water market |
|
|
(14.2) |
|
|
(0.6) |
|
|
(14.8) |
|
|
Food and Beverage market |
|
|
(3.1) |
|
|
— |
|
|
(3.1) |
|
|
Industrial market |
|
|
(5.1) |
|
|
— |
|
|
(5.1) |
|
|
Potable Water market |
|
|
(3.7) |
|
|
1.9 |
|
|
(1.8) |
|
|
Specialty Carbon market |
|
|
6.4 |
|
|
1.0 |
|
|
7.4 |
|
|
Other |
|
|
(1.5) |
|
|
0.1 |
|
|
(1.4) |
|
|
Total Activated Carbon and Service |
|
$ |
(32.0) |
|
$ |
1.8 |
|
$ |
(30.2) |
|
Contributing to the year over year decline was lower demand in the Environmental Air market resulting from a legacy customer that was using standard product and switched suppliers in 2016 as well as a number of coal-fired electric generation units permanently changing over to gas fired units due to very low natural gas prices. In addition, the unseasonably warmer winter weather conditions in the early part of the year coupled with the low natural gas prices reduced the operational requirements of certain customers’ coal-fired electric generating units in 2016. This decline was partially offset by an increase in demand for activated carbon pellets for treating sulfur and nitrogen oxide emissions. The Environmental Water market was negatively impacted by a customer plant closure in Asia, along with a decline in industrial environmental activity due to a slow economy and large orders in 2015 that did not repeat in 2016. Lower demand in the Industrial and the Food and Beverage markets was largely due to soft economic conditions, customers optimizing their processes resulting in a rationalization of carbon usage, and a general slowness in project related activity. An increase in the Specialty Carbon market for metal recovery carbon products in the Americas and for respirator carbon products in Asia partially offset the decline in the other markets.
25
Net sales for the Equipment segment declined slightly as compared to 2015. Foreign currency translation effects in the Equipment segment were not significant.
|
|
|
|
|
|
|
|
|
Increase (Decrease) |
|
|
|
(Dollars in millions) |
|
in Net Sales |
|
|
|
Carbon adsorption equipment |
|
$ |
5.9 |
|
|
Ballast water treatment systems |
|
|
(4.9) |
|
|
Traditional ultraviolet light systems |
|
|
(0.3) |
|
|
Ion exchange systems |
|
|
(1.1) |
|
|
Total Equipment |
|
$ |
(0.4) |
|
Net sales for ballast water treatment systems were lower due to continued regulatory delays and a decline in sales of equipment to offshore service vessels, the demand from which has been impacted by ongoing low oil prices. In addition, sales of ion exchange equipment were lower due to several large projects in 2015 that did not repeat in 2016. These declines were offset by several large projects for carbon adsorption equipment, including $3.3 million related to treatment of perfluorinated compounds in drinking water, in 2016 as compared to the prior year.
Net sales for the Consumer segment decreased $0.5 million or 5.1% from 2015 as higher demand for defense application products was more than offset by the negative impact of foreign currency translation which totaled $0.9 million due to the weaker British Pound Sterling.
Net sales of $12.1 million related to the New Business subsequent to the acquisition in November 2016 were reported in Other. Refer to additional discussion of the acquisition in Notes 18 and 20 to the consolidated financial statements in Item 8 of this Annual Report.
Net sales less cost of products sold (excluding depreciation and amortization), as a percentage of net sales, was 32.6% for 2016 compared to 35.8% for the comparable 2015 period, a 3.2 percentage point or $16.5 million decrease. Approximately $11.3 million of this decrease resulted from a decline in the volume of higher margin products, including FLUEPAC® products for mercury removal coupled with an increase in volume of lower margin products compared to the prior year. The Company incurred higher post retirement costs of approximately $0.9 million for the U.S. plans in 2016 as compared to 2015. In 2015, the Company benefited from refunds for import duties paid of $1.3 million which did not repeat in the 2016 period. A business interruption insurance settlement of $0.9 million received in 2016 provided a partial offset to the aforementioned items, all of which primarily impacted the Activated Carbon and Service segment. In addition, the Equipment segment incurred higher warranty costs of approximately $1.2 million in 2016 as compared to the prior year. Also contributing to the decline was $1.5 million of additional costs related to the inventory fair value step up, and $1.0 million in costs related to scheduled plant maintenance outages at certain of the New Business’ production facilities reported in Other. The Company’s cost of products sold excludes depreciation and amortization; therefore it may not be comparable to that of other companies.
Depreciation and amortization increased $2.6 million in 2016 as compared to 2015. The increase was primarily due to higher depreciation expense related to the completion of several large projects such as the improvement and upgrades to the Company’s manufacturing facilities, the new headquarters facility, and the SAP re-implementation project and $1.4 million incurred by the New Business reported in Other for the two month period ended December 31, 2016.
Selling, general and administrative expenses increased $15.0 million or 17.7% in 2016 as compared to 2015. During 2016, $13.4 million of additional transaction costs related to the acquisition of the New Business have been incurred with approximately half in the Activated Carbon and Service segment and half in Other. The Company experienced higher employee related costs of $0.8 million, of which $0.7 million was a result of higher pension settlement costs in 2016 versus the comparable period in 2015, primarily impacting the Activated Carbon and Services segment. These increases were partially offset by outside consulting services incurred in 2015, largely related to the SAP re-implementation project, which did not repeat, but were partially offset by other project costs in 2016. In addition, 2016 expenses included $1.7 million incurred by the New Business for the two month period ended December 31, 2016 reported in Other.
Research and development expenses decreased $1.0 million in 2016 versus the comparable 2015 period. This decrease was largely due to expenses related to the Company’s new research and development innovation center that were incurred in 2015 but did not repeat in 2016.
26
Interest income in 2016 was comparable to 2015.
Interest expense increased $1.6 million in 2016 as compared to 2015 due to an increase in the average outstanding borrowings under the Company’s debt agreements resulting from the Company’s purchase of the New Business, coupled with slightly higher interest rates in 2016.
The additional expense of $1.5 million in other income (expense) – for 2016 as compared to 2015 was largely related to foreign exchange and income reported in 2015 for a decline in the earn-out liability related to a 2010 acquisition that did not repeat in 2016.
The income tax provision for 2016 was $6.3 million as compared to $19.9 million in 2015. The income tax provision decreased $13.6 million in 2016 as compared to 2015 predominately due to a decline in pre-tax earnings.
The effective tax rate for 2016 was 31.3% compared to 31.4% for the similar 2015 period. The 2016 effective rate was lower than the U.S. statutory rate mainly due to the mix of income throughout foreign jurisdictions, the majority of which was related to China, the UK and Singapore, which reduced the rate by 6.5%. The decrease of the 2016 rate was partially offset by state income taxes which increased the overall 2016 tax rate by 2.9%. In addition, the 2016 rate was increased by 3.2% for permanent items including non-deductible transaction costs in the U.S. This increase was partially offset by the benefit realized from the enactment of the U.S. Internal Revenue Code Section 987 Treasury Regulations, which were finalized and issued on December 7, 2016. The benefit realized from the issuance of the final regulations reduced the 2016 rate by 2.7%.
2015 Versus 2014
Net sales for the Activated Carbon and Service segment decreased $11.7 million or 2.3% from 2014. Included in this change was the negative impact of foreign currency translation which totaled $21.9 million.
|
|
|
Increase (Decrease) in Net Sales |
|
|||||||
|
|
|
|
|
|
Foreign |
|
Net of Foreign |
|
||
|
(Dollars in millions) |
|
As Reported |
|
Currency Impact |
|
Currency Impact |
|
|||
|
Environmental Air market |
|
$ |
27.0 |
|
$ |
2.6 |
|
$ |
29.6 |
|
|
Environmental Water market |
|
|
(4.4) |
|
|
4.3 |
|
|
(0.1) |
|
|
Food and Beverage market |
|
|
(10.8) |
|
|
4.0 |
|
|
(6.8) |
|
|
Industrial market |
|
|
(6.1) |
|
|
3.8 |
|
|
(2.3) |
|
|
Potable Water market |
|
|
(14.9) |
|
|
5.7 |
|
|
(9.2) |
|
|
Specialty Carbon market |
|
|
(4.4) |
|
|
1.2 |
|
|
(3.2) |
|
|
Other |
|
|
1.9 |
|
|
0.3 |
|
|
2.2 |
|
|
Total Activated Carbon and Service |
|
$ |
(11.7) |
|
$ |
21.9 |
|
$ |
10.2 |
|
The decrease in net sales for the Activated Carbon and Service segment is principally due to the negative impact of foreign currency translation. Absent the negative impact of foreign currency, sales for the Activated Carbon and Service Segment increased in 2015 as compared to 2014. The increase was principally due to higher sales in the Americas Environmental Air market of approximately $29.5 million due to additional sales volume as a result of customers complying with mercury removal regulations promulgated by 19 states and certain Canadian provinces, as well as the Mercury and Air Toxics Standards. This increase was partially offset by the decline in the Americas Food and Beverage market due to certain non-repeat orders and Americas Specialty market due to continued lower demand for respirators from the U.S. government. In addition, the Asian Potable Water market declined approximately $8.2 million primarily due to certain large orders in 2014 that did not repeat in 2015, along with a softer growth rate.
Net sales for the Equipment segment decreased $6.0 million or 13.3% from 2014. Foreign currency translation effect in the Equipment segment was $0.3 million.
27
|
|
|
|
|
|
|
|
|
|
|
Increase (Decrease) |
|
|
|
(Dollars in millions) |
|
|
in Net Sales |
|
|
|
Carbon adsorption equipment |
|
|
$ |
(3.6) |
|
|
Ballast water treatment systems |
|
|
|
(3.4) |
|
|
Traditional ultraviolet light systems |
|
|
|
— |
|
|
Ion exchange systems |
|
|
|
1.3 |
|
|
Total Equipment |
|
|
$ |
(6.0) |
|
The decline in sales was due to lower demand for carbon adsorption equipment resulting from the completion of projects for installations for certain customers related to the initial Disinfectants and Disinfection Byproducts Rule and a decline in project related discretionary spending as well as lower sales for ballast water treatment systems due to continued regulatory delays and a decline in sales of our equipment to offshore service vessels, the demand from which has been impacted by ongoing low oil prices. This decline was partially offset by the higher sales for ion exchange systems.
Net sales in the Consumer segment decreased $2.4 million or 20.8% from 2014 due to higher demand from a single customer in 2014 that did not repeat in 2015, as well as the negative impact of foreign currency translation which totaled $0.6 million for the Consumer segment.
Net sales less cost of products sold (excluding depreciation and amortization), as a percentage of net sales, was 35.8% for 2015 compared to 34.6% in 2014, a 1.2 percentage point or $6.4 million increase which was primarily in the Activated Carbon and Service segment. Approximately $3.0 million of this improvement resulted from higher margin products sold, including FLUEPAC® products for mercury removal, coupled with a decline in volume of lower margin products. The Company’s cost improvement programs, including lower coal costs of approximately $2.2 million, primarily from two long-term coal contracts, contributed to margin improvement in all geographic regions. In addition, the Company benefited from refunds for import duties paid of approximately $1.3 million under the Trade Preferences Extension Act of 2015 pertaining to purchases of coconut carbons. In the Equipment segment, improved margins on projects in progress contributed approximately $0.5 million to the improvement as compared to the prior year. The Company’s cost of products sold excludes depreciation and amortization; therefore it may not be comparable to that of other companies.
Depreciation and amortization increased by $5.0 million or 16.4% in 2015 as compared to 2014. The increases were primarily due to higher depreciation expense related to improvements to the Company’s Catlettsburg, Kentucky virgin carbon manufacturing facility and the July 2015 completion of the SAP re-implementation project. Also contributing to the increase was accelerated depreciation expense of approximately $3.0 million in 2015 related to certain assets that have been or will be replaced as the result of new projects, including the Company’s SAP re-implementation project.
Selling, general and administrative expenses increased by $4.0 million or 4.9% in 2015 as compared to 2014. The increase was due to costs related to an SAP re-implementation project which commenced in January 2014 aimed at improving functionality of the Company’s enterprise resource planning system of approximately $1.0 million. The Company re-implemented SAP as of July 1, 2015. In addition, outside consulting services increased by $4.4 million. The Company experienced higher employee related costs of $2.0 million, of which $0.7 million was a result of higher pension costs. Partially offsetting these increases, which were primarily in the Activated Carbon and Service segment, was the positive impact of foreign currency translation of $3.1 million due to the stronger U.S. dollar which was also primarily within the Activated Carbon and Service segment. Selling, general and administrative expenses declined in the Equipment segment by $0.4 million in 2015 as compared to 2014, as a result of successful cost improvements, including a reduction in headcount.
Research and development expenses were comparable in 2015 as compared to 2014.
The Company recorded $0.3 million of restructuring income in 2014 which represents reductions in the estimated accrual and a pre-tax gain for the sale of a warehouse in Belgium.
Interest income was comparable in 2015 versus 2014.
Interest expense increased $0.5 million in 2015 as compared to 2014 due to an increase in the outstanding borrowings under the Company’s debt agreements.
28
The additional income in other expense — net of $1.2 million for 2015 as compared to 2014 was largely related to foreign exchange.
The income tax provision for 2015 was $19.9 million as compared to $23.1 million in 2014. For 2015, tax expense decreased approximately $3.2 million compared to 2014 predominately due to a decrease in pre-tax earnings of $9.1 million. In the fourth quarter of 2015, the Company completed a U.S. research and development tax credit study for the prior years 2012 — 2014. The Company recognized a benefit of $1.1 million related to the research and development credit. Compared to 2014, the Company’s state income taxes decreased by $0.5 million related to state apportionment changes. The 2014 tax expense includes a net $1.4 million benefit related to a completed Internal Revenue Service (IRS) examination and the effective settlement and release of uncertain tax positions.
The effective tax rate for 2015 was 31.4% compared to 31.9% for the similar 2014 period. The 2015 effective rate was lower than the U.S. statutory rate mainly due to the mix of income throughout foreign jurisdictions, the majority of which was related to the UK and Singapore, which reduced the rate 3.1%. The aforementioned research and development credit reduced the 2015 effective tax rate by 1.7%. The decrease of the 2015 rate was partially offset by state income taxes which increased the overall 2015 tax rate by 1.8%.
Liquidity and Capital Resources
The Company has had sufficient financial resources to meet its operating requirements and to fund capital spending, the acquisition, dividend payments, share repurchases and pension plans.
Cash flows provided by operating activities were $69.0 million in 2016, as compared to $69.9 million in 2015. Net cash flow was comparable between the two periods as a net favorable working capital change offset the lower operating results in 2016. Cash flows provided by operating activities declined in 2015 as compared to $84.3 million in 2014 primarily due to unfavorable working capital changes from higher inventories. The Company made contributions to its pension plans, which included $0.6 million and $1.2 million of discretionary contributions to the U.S. pension plans during 2016 and 2015, respectively.
The Company received $0.6 million and $1.8 million in 2016 and 2014, respectively, of proceeds related to government grants in Asia and Europe. Grants related to income were reported within operating activities, while grants related to assets were reported as cash flows from investing activities. Refer to Note 19 to the consolidated financial statements in Item 8 of this Annual Report.
Cash flows used in investing activities increased significantly in 2016 as compared to 2015 and 2014 as a result of the acquisition of the New Business for $153.6 million, net of cash acquired. Refer to Note 20 to the consolidated financial statements in Item 8 of this Annual Report for further information.
Capital expenditures were $31.9 million, $62.3 million, and $63.5 million, in 2016, 2015 and 2014, respectively. Expenditures for 2016 were primarily for improvements to manufacturing facilities. Expenditures for 2015 included $19.3 million for improvements to the Company’s Catlettsburg, Kentucky manufacturing facility, $5.8 million of upgrades to the Tipton plant in the UK, expenditures of $11.3 million related to the Company’s new headquarters facility, which includes the research and development innovation center; and $4.1 million for a SAP re-implementation project. Expenditures for 2014 included $48.9 million for improvements to manufacturing facilities including approximately $38.6 million for the Company’s Catlettsburg, Kentucky and Pearlington, Mississippi facilities, along with expenditures for a SAP re-implementation project of approximately $6.2 million. Capital expenditures for 2017, which includes expected spending for the upgrade of the Company’s Pittsburgh, Pennsylvania reactivation plant and the New Business, are currently projected to be approximately $70 million to $80 million. The aforementioned expenditures are expected to be funded by operating cash flows, cash on hand, and borrowings.
Proceeds for sales of property, plant and equipment were $1.2 million in 2016 and not significant in 2015 or 2014.
Cash flows provided by financing activities increased significantly in 2016 as compared to 2015 and 2014 as a result of the incremental borrowings required under the Company's debt arrangements to fund the acquisition of the New Business.
On October 4, 2016, the Company entered into the First Amended and Restated Credit Agreement (Amended Credit Agreement) which amended the Company’s existing U.S. Credit Agreement (Credit Agreement). The Amended Credit
29
Agreement increases the Company’s total borrowing capacity to $400 million, comprised of a $300 million revolving credit facility (Amended Revolver) and a $100 million term loan facility (Term Loan). The Amended Credit Agreement extends the term of the Amended Revolver to October 4, 2021 and the maturity date of the Term Loan to October 4, 2023.
The full amount of the Term Loan was borrowed on the closing date, with the proceeds used to repay all outstanding term loan and revolving credit facility borrowings under the Credit Agreement. The Amended Revolver was used to fund the acquisition of the New Business, and is available for working capital requirements and general corporate purposes. The total debt outstanding increased $113.6 million in 2016 as a result of the acquisition of the New Business. Total availability under the Amended Credit Agreement was $172.5 million as of December 31, 2016.
Beginning January 1, 2017, the Company will be required to make quarterly repayments under the Term Loan equal to 1.25% of the outstanding balance until January 1, 2019, at which time the quarterly repayments will increase to 2.0% until the remaining balance is due on the October 4, 2023 maturity date.
Certain domestic subsidiaries of the Company unconditionally guarantee all indebtedness and obligations related to borrowings under the Amended Credit Agreement. The Company’s obligations under the Amended Credit Agreement are unsecured. The Amended Credit Agreement contains customary affirmative and negative covenants for credit facilities of this type. The Company has to comply with certain financial covenants including minimum interest coverage ratio and a maximum leverage ratio as defined within the Amended Credit Agreement. The Company was in compliance with all such covenants as of December 31, 2016.
In February 2017, an amendment was signed to the Amended Credit Agreement, which, among other things, removes the quarterly leverage ratio requirement for the Company to pay dividends to its stockholders and replaces it with an annual dividend dollar restriction of $14.0 million.
On March 24, 2016, Calgon Carbon Japan (CCJ) entered into a 2.0 billion Japanese Yen unsecured revolving loan facility agreement (Japanese Credit Agreement) which expires on March 24, 2019. The Company is jointly and severally liable as the guarantor of CCJ’s obligations under the Japanese Credit Agreement. Total availability under the Japanese Credit Agreement was 2.0 billion Japanese Yen as of December 31, 2016.
Refer to Note 8 to the consolidated financial statements in Item 8 of this Annual Report, which is incorporated herein by reference, for further details on the Company’s borrowing arrangements.
In December 2013, the Company’s Board of Directors approved a share repurchase program with a total of $150 million of purchases authorized. As of December 31, 2016, the Company had repurchased a total of 4,598,661 shares at an average price of $18.67 per share under this program. All of the above mentioned repurchases were funded from operating cash flows, cash on hand, and borrowings and the shares are held as treasury stock. Subsequent to these repurchases, the Company’s remaining authorization to repurchase its common stock is approximately $64.1 million. In April 2016, the Company suspended the activities of the share repurchase program.
On February 18, 2015, the Company’s Board of Directors reinstated its common stock dividend program. Quarterly dividends of $0.05 per share were declared and paid in each of the four quarters for the years ended December 31, 2016 and 2015. No common stock dividends were declared or paid in 2014. In addition, in February 2017, a common stock dividend of $0.05 per share was declared. Dividend declaration and payout are at the discretion of the Board of Directors. Future dividends will depend on the Company’s earnings, cash flows, capital investment plans to pursue long-term growth opportunities, and share repurchases, if any.
The Company currently expects that cash from operating activities plus cash balances and available external financing will be sufficient to meet its cash requirements for the next twelve months. The cash needs of each of the Company’s reporting segments are principally covered by the segment’s operating cash flow on a standalone basis. Any additional needs will be funded by cash on hand or borrowings under the Company’s credit facilities. The Equipment and Consumer segments historically have not required extensive capital expenditures. The Company believes that operating cash flows, cash on hand and borrowings will adequately support each of the segments cash needs.
Cash and cash equivalents include $27.4 million and $45.1 million held by the Company’s foreign subsidiaries as of December 31, 2016 and 2015, respectively. Generally, cash and cash equivalents held by foreign subsidiaries are not
30
readily available for use in the U.S. without adverse tax consequences. The Company’s principal sources of liquidity are its cash flows from its operating activities or borrowings directly from its credit facilities. The Company does not believe the level of its non-U.S. cash position will have an adverse effect on working capital needs, planned growth, repayment of maturing debt, or benefit plan funding.
Contractual Obligations
The Company is obligated to make future payments under various contracts such as debt agreements, lease agreements, and unconditional purchase obligations. The following table represents the significant contractual cash obligations and other commercial commitments of the Company as of December 31, 2016:
|
|
|
Payments due by period |
|
|||||||||||||
|
(Dollars in thousands) |
|
Total |
|
Less than 1 year |
|
1-3 years |
|
3-5 years |
|
More than 5 years |
|
|||||
|
Long-term debt, including current portion |
|
$ |
225,000 |
|
$ |
5,000 |
|
$ |
13,000 |
|
$ |
141,000 |
|
$ |
66,000 |
|
|
Interest (1) |
|
|
28,700 |
|
|
5,693 |
|
|
10,953 |
|
|
9,369 |
|
|
2,685 |
|
|
Operating leases |
|
|
41,320 |
|
|
8,174 |
|
|
9,958 |
|
|
4,651 |
|
|
18,537 |
|
|
Unconditional purchase obligations (2) |
|
|
47,792 |
|
|
21,375 |
|
|
24,790 |
|
|
1,627 |
|
|
— |
|
|
Total contractual cash obligations |
|
$ |
342,812 |
|
$ |
40,242 |
|
$ |
58,701 |
|
$ |
156,647 |
|
$ |
87,222 |
|
|
(1) As of December 31, 2016, the weighted average effective interest rate was approximately 2.56% on the Company’s total borrowings of $225.0 million. The Company’s debt carries variable interest rates. The interest amounts have been estimated based on the applicable interest rate per annum as of December 31, 2016, and the outstanding debt balances as of December 31, 2016, adjusted for the future required repayments shown above. |
|
(2) Primarily for the purchase of raw materials and information systems and services. |
The long-term tax payable of $0.9 million, pertaining to the tax liability related to the accounting for uncertainty in income taxes, has been excluded from the above table due to the fact that the Company is unable to determine the period in which the liability will be resolved.
The Company does not have any special-purpose entities.
The Company maintains qualified defined benefit pension plans, which cover certain non-union and union employees in the U.S. and Europe. The fair value of the Company’s pension plan assets has decreased slightly to $116.2 million as of December 31, 2016 from $118.7 million as of December 31, 2015. During 2016 and 2015, the Company made lump sum payments of $5.2 million and $3.8 million, respectively, to certain eligible terminated vested participants. The Pension Protection Act, passed into law in August 2006, prescribes a new methodology for determining the minimum amount that must be contributed to U.S. defined benefit pension plans which began in 2008. During the years ended December 31, 2016 and 2015, respectively, the Company funded its pension plans with $2.4 million and $3.1 million in contributions. The Company expects that it will be required, in accordance with its funding policy, to fund the plans with approximately $4.6 million in contributions for the year ending December 31, 2017. The Company may make additional contributions to the plans in 2017 beyond the required funding. Additional voluntary contributions would be dependent upon, among other things, the Company’s ongoing operating results and liquidity.
Off-Balance Sheet Arrangements
The Company’s off-balance sheet arrangements include the operating leases and unconditional purchase obligations disclosed above as well as letters of credit and guarantees as discussed in Note 8 to the consolidated financial statements in Item 8 of this Annual Report.
Contingencies
The Company is involved in various legal proceedings, lawsuits and claims, including employment, product warranty and environmental matters of a nature considered normal to its business. It is the Company’s policy to accrue for amounts related to these legal matters when it is probable that a liability has been incurred and the loss amount is reasonably estimable. Refer to Note 16 to the consolidated financial statements in Item 8 of this Annual Report, which is incorporated herein by reference, for further details.
31
Critical Accounting Policies
Management of the Company has evaluated the accounting policies used in the preparation of the financial statements and related footnotes and believes the policies to be reasonable and appropriate. The preparation of the financial statements in accordance with accounting principles generally accepted in the U.S. requires management to make judgments, estimates, and assumptions regarding uncertainties that affect the reported amounts of assets and liabilities, disclosure of contingent assets and liabilities, and the reported amounts of revenues and expenses. Management uses historical experience and all available information to make these judgments and estimates, and actual results will inevitably differ from those estimates and assumptions that are used to prepare the Company’s financial statements at any given time. Despite these inherent limitations, management believes that Management’s Discussion and Analysis (MD&A) and the financial statements and related footnotes provide a meaningful and fair perspective of the Company.
The following are the Company’s critical accounting policies impacted by management’s judgments, assumptions, and estimates. Management believes that the application of these policies on a consistent basis enables the Company to provide the users of the financial statements with useful and reliable information about the Company’s operating results and financial condition.
Revenue Recognition
The Company recognizes revenue and related costs when goods are shipped or services are rendered to customers provided that ownership, persuasive evidence of an arrangement exists and risk of loss have passed to the customer, the price to the customer is fixed or determinable, and collection is reasonably assured. Revenue for major equipment projects is recognized under the percentage of completion method. The Company’s major equipment projects generally have a long project life cycle from bid solicitation to project completion. The nature of the contracts are generally fixed price with milestone billings. The Company recognizes revenue for these projects based on the fixed sales prices multiplied by the percentage of completion. In applying the percentage of completion method, a project’s percent complete as of any balance sheet date is computed as the ratio of total costs incurred to date divided by the total estimated costs at completion. As changes in the estimates of total costs at completion and/or estimated total losses on projects are identified, appropriate earnings adjustments are recorded during the period that the change is identified. The Company has a history of making reasonably dependable estimates of costs at completion on contracts that follow the percentage of completion method; however, due to uncertainties inherent in the estimation process, it is possible that actual project costs at completion could vary from their estimates. The principal components of costs include material, direct labor, subcontracts, and allocated indirect costs. Indirect costs primarily consist of administrative labor and associated operating expenses, which are allocated to the respective projects on actual hours charged to the project utilizing a standard hourly rate.
Goodwill and Other Intangible Assets
Goodwill represents the excess of the cost of an acquired business over the fair value of the identifiable tangible and intangible assets acquired and liabilities assumed in a business combination. Identifiable intangible assets acquired in business combinations are recorded based on their fair values at the date of acquisition. In accordance with guidance within ASC 350 “Intangibles — Goodwill and Other” goodwill and identifiable intangible assets with indefinite lives are not subject to amortization but must be evaluated for impairment.
On November 2, 2016, the Company completed the acquisition of the New Business. The transaction was accounted for under the acquisition method of accounting in accordance with ASC 805 “Business Combinations.” Under the acquisition method of accounting, the tangible and identifiable intangible assets acquired and liabilities assumed are recorded based on their fair value at the acquisition date, with excess consideration paid over the net assets acquired recorded as goodwill. The fair value was determined based on the preliminary acquisition valuation which included the use of estimates based on information available to the Company. As a result of the acquisition, the Company has recorded various intangible assets, including trade names and trademarks, unpatented technology, and customer relationships. The trade names and trademarks acquired have indefinite lives, while all remaining acquired identifiable intangible assets have finite lives. The goodwill associated with the acquisition of the New Business is reported as Other for segment reporting purposes and has not been allocated below this level as of December 31, 2016.
The Company evaluates goodwill and indefinite-lived intangible assets for impairment annually, or when events occur or circumstances change that may reduce the fair value of the asset below its carrying amount. The Company has elected to
32
perform the annual impairment test of its goodwill and indefinite-lived intangible assets, as required, on December 31 of each year by initially comparing the fair value of each of the Company’s reporting units to their related carrying values. The Company will also perform an impairment test between annual tests whenever events or circumstances indicate that the carrying value of a reporting unit may exceed its fair value. If the fair value of the reporting unit is less than its carrying value, the Company performs an additional step to determine the implied fair value of the goodwill. The implied fair value of goodwill is determined by first allocating the fair value of the reporting unit to all of the assets and liabilities of the unit and then computing the excess of the unit’s fair value over the amounts assigned to the assets and liabilities. If the carrying value of goodwill exceeds the implied fair value of goodwill, such excess represents the amount of goodwill impairment, and the Company recognizes such impairment accordingly. Fair values are estimated using discounted cash flows and other valuation methodologies, such as the guideline public company method, that are based on projections of the amounts and timing of future revenues and cash flows, assumed discount rates and other assumptions as deemed appropriate. The Company also considers such factors as historical performance, anticipated market conditions, operating expense trends and capital expenditure requirements. Each reporting unit periodically prepares discrete operating forecasts and uses these forecasts as the basis for assumptions used in the discounted cash flow analysis and guideline public company method. The Company has consistently used a discount rate commensurate with its cost of capital which ranges 10.0% to 14.0%, adjusted for inherent business risks within its respective reporting units and has consistently used a terminal growth factor of 3.0%. The Company also reconciles the estimated aggregate fair value of its reporting units as derived from the discounted cash flow analysis and guideline public company method to the Company’s overall market capitalization. The Company has historically had six reporting units for purposes of goodwill evaluation. These reporting units consist of (1) the Activated Carbon and Service segment which is segregated into two regional reporting units, the Americas/Asia and Europe, (2) the Equipment segment which is segregated by technology (a) carbon adsorption, (b) ultraviolet light, and (c) ion exchange, and (3) the Consumer segment which includes the charcoal cloth reporting unit. The Company continually monitors its reporting units for impairment indicators and updates assumptions used in the most recent calculation of the fair value of a reporting unit as appropriate. The fair value of the Company’s reporting units substantially exceeds the carrying value of its goodwill as of December 31, 2016.
Given the preliminary nature of the purchase price allocation and the relatively short time period between the acquisition date and December 31, 2016, the Company did not perform a full evaluation of the acquired goodwill and indefinite-lived intangible assets, but rather performed a qualitative assessment that did not result in an indication of impairment for the New Business as of December 31, 2016. For further information, refer to Notes 18 and 20 to the consolidated financial statements in Item 8 of this Annual Report.
The Company’s identifiable intangible assets other than goodwill and trade names and trademarks have finite lives. Certain of these intangible assets, such as customer relationships, are amortized using an accelerated methodology while others, such as patents, are amortized on a straight-line basis over their estimated useful lives. In addition, intangible assets with finite lives are evaluated for impairment whenever events or circumstances indicate that their carrying amount may not be recoverable, as prescribed by guidance within ASC 360 “Property, Plant, and Equipment.”
Pensions
The Company maintains defined benefit pension plans covering certain union and non-union employees in the U.S. and Europe. As of December 31, 2016, all of the U.S. plans are closed to new hires. In addition, future benefit accruals are frozen for a number of the plans. During 2016, the Company offered certain eligible terminated vested participants in the U.S. pension plans the opportunity to elect a lump sum payment of their respective pension benefits. As a result of these elections, and significant lump sum payouts in the European plans, the Company paid benefits of $5.2 million, and incurred a settlement charge of $1.5 million in 2016. In 2015, the Company incurred settlement charges in both the U.S. and European plans that totaled $0.8 million as a result of employee retirements, and paid $3.8 million from plan assets. In 2014, the Company offered certain eligible terminated vested participants in the U.S. pension plans the opportunity to elect a lump sum payment of their respective pension benefits, and as a result, incurred a settlement charge of $1.0 million and paid benefits of $4.4 million. As a result of the acquisition of the New Business, the projected benefit obligation of the European plans increased $3.9 million in 2016.
Net periodic pension cost, which totaled $4.4 million, $2.0 million, and $0.8 million in 2016, 2015,and 2014, respectively, is calculated based upon a number of actuarial assumptions. These assumptions include the long-term rate of return on the defined benefit plans’ assets, funding levels, discount rates, and various other factors related to
33
employees and retirees participating in the defined benefit plans, including retirement age, salary increases, and mortality assumptions.
In 2016 and 2015, the Company assumed an expected weighted average long-term rate of return on the Company’s defined benefit plans’ assets ranging from 5.28% to 7.00% and 5.54% to 7.50%, respectively. For 2017, the expected weighted average rate of return on assets will range from 4.46% to 6.87%. In developing the expected long-term rate of return assumption, the Company evaluated input from its investment advisors, including their review of asset class return expectations as well as long-term inflation assumptions. The Company also considered historical returns on asset classes and the investment mix. The expected long-term return on the U.S. defined benefit plans’ assets is based on a targeted asset allocation assumption of approximately 40%-50% with equity securities, 45%-55% with fixed-income securities, and 5% with other investments. The European defined benefit plans’ assets are based on a targeted asset allocation assumption of approximately 20%-30% with equity securities, 55%-65% with fixed-income securities, and 10%-20% with other investments. The Company regularly reviews its asset allocation and periodically rebalances its investments to the targeted allocation when considered appropriate.
During 2016, the Company funded its defined benefit plans with $2.4 million in contributions. The Company expects that it will be required, in accordance with its funding policy, to fund its defined benefit plans with approximately $4.6 million in contributions in 2017.
The discount rate that the Company utilizes for its defined benefit plans to determine pension obligations is based on a review of long-term bonds that receive one of the two highest ratings given by a recognized rating agency. The weighted average discount rate determined on this basis has decreased from a range of 3.15% to 4.38% as of December 31, 2015 to a range of 2.11% to 4.09% as of December 31, 2016.
During 2014, the Society of Actuaries released a new mortality table — RP-2014, and a new projection scale — MP-2014. As a result of these new tables, the Company changed its mortality assumptions for its U.S. plans in 2014. The Company adopted the new RP-2014 mortality table and a modified version of the new MP-2014 projection scale for the U.S. defined benefit plans. The Company has continued to use the same mortality tables and the modified version of the projection scale in 2015 and 2016. For the European defined benefit plans, the Company utilizes country-specific mortality tables and has used the same tables for the majority of its European plans since 2014. In 2016, the Company updated the mortality tables used for the UK plans which did not cause a significant increase to the projected benefit obligations for those plans.
Amortization of the actuarial net gain or loss as a result of experience differing from that assumed and from changes in assumptions is included as a component of net periodic pension cost for the year. The Company uses a 10% corridor such that if, as of the beginning of the year, the net gain or loss exceeds 10% of the greater of the projected benefit obligation or the market-related value of plan assets, the amortization is that excess divided by the average future working lifetime of participating employees expected to receive benefits under the plan or the average remaining life expectancy of the plan’s participants if the percentage of actives is less than 10% of the total population. As only the excess actuarial gain or loss is amortized, this approach will not fully amortize the net actuarial gain or loss. The Company considers participants whose benefits are frozen to be active participants, and considers the plan population to be “all or almost all” inactive when at least 90% of the population is inactive. Under this methodology, the accumulated net actuarial gain/loss amounts recognized in accumulated other comprehensive income (loss) are not expected to be fully recognized in net periodic pension cost until the plan is terminated (or an earlier event, like a settlement, triggers recognition) because the average expected remaining service of active participants expected to benefit under the plan or the average expected remaining lifetime of inactive participants over which the amounts are amortized is re-determined each year and actuarial gains or losses that fall within the corridor described above are not amortized.
The Company estimates that it will record net periodic pension cost for the defined benefit pension plans that will approximate $3.1 million in 2017. The Company recorded net periodic pension cost of $4.4 million in 2016, which included a $1.5 million settlement charge. Thus, the 2017 expected net periodic pension cost is consistent with the 2016 expense, absent the 2016 settlement charge. Future actual net periodic pension cost will depend on future investment performance, funding levels, changes in discount rates and various other factors related to the populations participating in its defined benefit plans, including lump sum payouts, which could result in the recognition of additional settlement charges. The Company will continue to evaluate its actuarial assumptions at least annually, and will adjust as necessary.
34
A sensitivity analysis of the projected incremental effect of a hypothetical one percent change in the significant assumptions used in the pension calculations is provided in the following table:
|
|
|
Hypothetical Rate Increase (Decrease) |
|
||||||||||
|
|
|
U.S. Plans |
|
European Plans |
|
||||||||
|
(Dollars in thousands) |
|
(1%) |
|
1% |
|
(1%) |
|
1% |
|
||||
|
Discount rate |
|
|
|
|
|
|
|
|
|
|
|
|
|
|
Pension liabilities as of December 31, 2016 |
|
$ |
14,784 |
|
$ |
(12,981) |
|
$ |
8,643 |
|
$ |
(6,664) |
|
|
Pension costs for the year ended December 31, 2016 |
|
$ |
1,260 |
|
$ |
(1,081) |
|
$ |
310 |
|
$ |
(109) |
|
|
Indexation (1) |
|
|
|
|
|
|
|
|
|
|
|
|
|
|
Pension liabilities as of December 31, 2016 |
|
$ |
— |
|
$ |
— |
|
$ |
(1,890) |
|
$ |
2,078 |
|
|
Pension costs for the year ended December 31, 2016 |
|
$ |
— |
|
$ |
— |
|
$ |
(148) |
|
$ |
162 |
|
|
Expected return on plan assets |
|
|
|
|
|
|
|
|
|
|
|
|
|
|
Pension costs for the year ended December 31, 2016 |
|
$ |
861 |
|
$ |
(862) |
|
$ |
270 |
|
$ |
(270) |
|
|
Compensation |
|
|
|
|
|
|
|
|
|
|
|
|
|
|
Pension liabilities as of December 31, 2016 |
|
$ |
(994) |
|
$ |
1,011 |
|
$ |
(1,152) |
|
$ |
1,671 |
|
|
Pension costs for the year ended December 31, 2016 |
|
$ |
(175) |
|
$ |
199 |
|
$ |
(158) |
|
$ |
233 |
|
|
(1) Pension indexation related to the Company’s German Qualified Plan is regulated by German pension law. The law dictates that a pension that is already in payment must be adjusted for inflation every 3 years which is measured by the published German price index for the same time interval. Pension indexation related to the Company’s UK Chemviron Plan is based on the Consumer Price Index (CPI) in the UK. For this plan, the index is capped at 5% per annum for pensions accrued prior to January 1, 2008 and is capped at 2.5% per annum for pensions accrued after December 31, 2007. For purposes of the Company’s UK Sutcliffe Speakman plan, the indexation is fixed at 3% per annum for pensions accrued prior to April 6, 1997. For those pensions accrued from April 6, 1997 to July 31, 2005, the index is subject to a minimum of 3% per annum and a maximum of 5% per annum. For those pensions accrued after July 31, 2005, the index is capped at 2.5% per annum. |
Income Taxes
During the ordinary course of business, there are many transactions and calculations for which the ultimate tax determination is uncertain. Significant judgment is required in determining the Company’s annual effective tax rate and in evaluating tax positions. The Company utilizes guidance within ASC 740 “Income Taxes” regarding the accounting for uncertainty in income taxes. This guidance contains a two-step approach to recognizing and measuring uncertain tax positions taken or expected to be taken in a tax return. The first step is to evaluate the tax position for recognition by determining if the weight of available evidence indicates that it is more likely than not that the position will be sustained on audit, including resolution of related appeals or litigation processes, if any. The second step is to measure the tax benefit as the largest amount that is more than 50% likely of being realized upon settlement.
Although the Company believes it has adequately reserved for its uncertain tax positions, no assurance can be given that the final tax outcome of these matters will not be different. The Company adjusts these reserves in light of changing facts and circumstances, such as the closing of a tax audit, the refinement of an estimate, or a lapse of a tax statute. To the extent that the final tax outcome of these matters is different than the amounts recorded, such differences will impact the provision for income taxes in the period in which such determination is made. The provision for income taxes includes the impact of reserve provisions and changes to reserves that are considered appropriate, as well as the related penalties and net interest.
The Company is subject to varying statutory tax rates in the countries where it conducts business. Fluctuations in the mix of the Company’s income between countries will result in changes to the Company’s overall effective tax rate.
The Company recognizes benefits associated with foreign and domestic net operating loss and credit carryforwards when the Company believes that it is more likely than not that its future taxable income in the relevant tax jurisdictions will be sufficient to enable the realization of the tax benefits. As of December 31, 2016, the Company had recorded total deferred tax assets of $44.4 million, of which $7.8 million represents tax benefits resulting from $0.2 million of unused U.S. foreign tax credits, $4.9 million of net operating losses, $1.4 million of state tax credits, and a capital loss carryover of $0.8 million. State operating loss carryforwards of $0.5 million, net, expire from 2018 to 2036, of which approximately 92% will begin to expire after 2021, if not utilized.
35
The Company periodically reviews the need for a valuation allowance against deferred tax assets and recognizes these deferred tax assets to the extent that realization is more likely than not. Based upon a review of earnings history and trends, forecasted earnings and the relevant expiration of carryforwards, the Company believes that the valuation allowances provided are appropriate. As of December 31, 2016, the Company has recorded a valuation allowance of approximately $2.5 million related to foreign net operating losses, domestic capital loss carryovers, U.S. passive foreign tax credits and state tax credits.
Approximately 88% of the Company’s deferred tax assets, or $39.2 million, represent temporary differences associated with pensions, accruals, and inventories. Approximately 73% of the Company’s deferred tax liabilities of $62.1 million as of December 31, 2016 relate to temporary differences associated with property, plant and equipment. These temporary differences will reverse in the future due to the realization of temporary differences between annual book and tax reporting. The Company believes that the deferred tax liabilities generally will impact taxable income of the same character (ordinary income), timing, and jurisdiction as the deferred tax assets.
Contingencies
The Company is involved in various asserted and unasserted legal claims. An estimate is made to accrue for a loss contingency relating to any of these legal claims if it is probable that a liability was incurred at the date of the financial statements and the amount of loss can be reasonably estimated. Because of the subjective nature inherent in assessing the outcome of legal claims and because the potential that an adverse outcome in a legal claim could have a material impact on the Company’s legal position or results of operations, such estimates are considered to be critical accounting estimates. Legal fees associated with defending these various lawsuits and claims are expensed when incurred. The Company will continue to evaluate all legal matters as additional information becomes available. Reference is made to Note 16 of the consolidated financial statements in Item 8 of this Annual Report for a discussion of litigation and contingencies.
Long-Lived Assets
The Company evaluates long-lived assets under the provisions of ASC 360 “Property, Plant, and Equipment” which addresses financial accounting and reporting for the impairment of long-lived assets, and for disposal of long-lived assets. For assets to be held and used, the Company groups a long-lived asset or assets with other assets and liabilities at the lowest level for which identifiable cash flows are largely independent of the cash flows of other assets and liabilities. An impairment loss for an asset group reduces only the carrying amounts of a long-lived asset or assets of the group being evaluated. The loss is allocated to the long-lived assets of the group on a pro-rata basis using the relative carrying amounts of those assets, except that the loss allocated to an individual long-lived asset of the group does not reduce the carrying amount of that asset below its fair value whenever that fair value is determinable without undue cost and effort. Estimates of future cash flows used to test the recoverability of a long-lived asset group include only the future cash flows that are directly associated with and that are expected to arise as a direct result of the use and eventual disposition of the asset group.
New Accounting Pronouncements
Refer to Note 1 to the consolidated financial statements in Item 8 of this Annual Report, which is incorporated herein by reference, for details on recently issued accounting guidance.
Outlook
Activated Carbon and Service
According to the Company and independent market research estimates, demand for activated carbon is forecasted to increase at a 3% - 6% compound annual growth rate from 2016 through 2021. This estimated growth is expected to be driven by increasing global demand for clean air and drinking water as a result of expected economic growth generally, heightened public and consumer awareness of the harmful impacts to human health of contaminants in air and water supplies, and new and continuing government regulations. In addition, expected long-term growth of the economies of both mature and developing countries around the world are expected to increase the demand for activated carbon for use in industrial and food and beverage production processes and related wastewater treatment applications.
36
The ultimate pace of future demand growth for activated carbon will be dependent upon many factors, including: the ultimate pace of global economic growth, including potential negative impacts of short or prolonged economic slowdowns in any one or several geographic regions. Future demand growth is also dependent on the impact and timing of potential new air and water regulations as well as potential changes to existing regulations, including the potential impact of environmental policies of the new Presidential administration installed in the U.S. in January of 2017. Changes in corporate income tax and cross-border tax policies in the U.S. and other countries, and, as it relates more specifically to the Company, potential negative impacts of a stronger U.S. dollar versus other global currencies could also impact future demand growth.
As a result of the Company’s significant participation in providing high performing virgin activated carbon and reactivated carbon and services to meet the market requirements, the Company expects demand for its activated carbon products and services to increase over the longer term. Globally, the Company derives approximately one-third of its sales from industrial sector customers through providing activated carbon and services for their industrial process, environmental water and environmental air end market application needs. During 2016, the Company experienced a decline in sales of its products due to soft global industrial sector market conditions. As 2016 came to a close, the Company believes that market conditions impacting industrial sector customers were stabilizing and that it was beginning to see early indications that the industrial sector economic environment may be improving. While this provides the Company with cautious optimism about the potential for an industrial sector recovery and a related increase in revenues from these customers in 2017, the Company currently expects 2017 sales in this sector to be approximately level with 2016.
The Company currently expects growth in sales over 2016 for certain municipal drinking water applications and for mercury removal from flue gas emissions of coal-fired power plants. Increased public awareness of the presence and human health impacts of man-made chemicals and naturally occurring contaminants in drinking water is expected to contribute to growth of the Company’s municipal drinking water business in 2017 and into the future. Chemicals from industrial processes and other activities can contaminate groundwater wells and surface water sources. Many of these chemicals are currently unregulated and the U.S. Environmental Protection Agency (EPA) and other state-level agencies may or may not regulate these contaminants in the future. The Company has seen recent activity at the consumer level demonstrating that communities are demanding drinking water that is free from contaminants regardless of the current regulatory status of those contaminants. Chemical releases that impact sources of drinking water highlight the need for utilities to provide barrier defenses against such events in both groundwater and surface water. Granular activated carbon (GAC) is an ideal technology for this purpose and the Company expects utilities to look to install GAC to provide protection against spills and contamination. Most recently, concern regarding the presence of perfluorinated compounds (PFCs) in drinking water sources has led to an increase in both inquiries and orders from numerous utilities as well as remediation projects across the U.S. In May 2016, after a large number of community water systems found PFC contamination in drinking water sources, the U.S. EPA issued a health advisory limit for PFOA and PFOS, the two most common PFCs. A health advisory limit is non-enforceable and non-regulatory and is meant to inform state agencies and public health officials about the subject contaminants. Many utilities have measured PFC levels above the EPA health advisory limit, resulting in “do not drink” alerts in many communities. In addition, several states are currently considering issuing maximum contaminant levels that are considerably lower than the health advisory limits established by the EPA. As a result, the Company has won a number of projects across the country related to PFC removal and is continuing to pursue additional active projects in this area. A substantial portion of the sales of an initial PFC removal project tends to be related to the procurement of carbon adsorption equipment that is provided by the Company’s Equipment segment. In a similar vein, 1,2,3-Trichloropropane (1,2,3-TCP) in groundwater has become a major issue in California, and to a lesser extent in New York and New Jersey, and the Company has received equipment orders in California and New Jersey and is presently handling inquiries for several more. Harmful algal blooms can also present a human health risk to community drinking water supplies; both GAC and powdered activated carbon (PAC) have been used successfully to protect against the intrusion of algal toxins in drinking water systems. Use of GAC can protect water treatment plants from the harmful effects of algal bloom toxicity, while increased dosing of PAC can also help when algal blooms are detected.
In addition, the Company expects to see ongoing business as municipalities continue to adopt the usage of GAC to comply with the U.S. EPA’s Stage 2 Disinfection Byproducts (DBP) Rule, for which the compliance requirements became effective between 2013 and 2015. While the Company has been successful in attracting municipalities to utilize GAC for Stage 2 DBP compliance, many utilities currently use alternative disinfectants, such as chloramines, as their primary means to comply with the DBP Stage 2 Rule. Disinfection with chloramines, however, can result in the formation of emerging classes of harmful DBP’s, many of which are not currently regulated under the DBP Stage 2 rule.
37
In this regard, the EPA is completing its Six Year Review of the DBP Rule, which could in turn lead to a new Stage 3 DBP Rule, which might include a number of these emerging classes of DBPs and could drive additional municipalities to adopt GAC. Although the Company does not expect a DBP Stage 3 rule limiting the use of chloramines or the DBPs formed by chloramine disinfection to go into effect for a number of years, the volume of GAC required to meet these needs could be significant. The Company estimates that the municipal water systems in nine of the largest cities in the U.S. that currently use chloramines to meet their DBP Stage 2 compliance requirements would need initial installations, in the aggregate, of approximately 330 million pounds of GAC. Some of these utilities are already involved in studies or pilot test programs to evaluate the use of GAC to meet their DBP treatment needs. It is possible that some of these, or other municipalities that are treating for DBPs using chloramines, will choose to switch to GAC prior to the issuance of a DBP Stage 3 regulation. As more municipalities move to install GAC for the various reasons mentioned, the Company expects to see more municipalities adopt the use of its custom municipal reactivation (CMR) services.
In Europe, the Company expects sales growth in 2017 primarily from higher demand for drinking water applications, excluding potential negative impacts of currency translation. In this regard the Company has a multi-year contract with a large water provider in the United Kingdom (UK) and will supply virgin carbon and reactivation services for up to the remaining seven year period from its upgraded Tipton plant in the UK.
China had also announced that it will commit billions of dollars to water and wastewater improvements. Investments are underway, but have been slower than anticipated. The Company continues to monitor this situation closely. China has also tightened the regulations for VOC emissions, which is resulting in new reactivation opportunities.
In the environmental air market, the Company has established itself as a market leading supplier of PAC in North America for the removal of mercury from the flue gas of coal-fired power plants, a significant market that completed its formation in April 2016 in compliance with the Mercury and Air Toxics Standards (MATS) regulation, as well as regulations that had previously been in effect in 19 states and Canada. Based on standard PAC products, the Company estimates the annual demand for mercury removal in North America is between 250 million to 350 million pounds. This annual estimated demand can be impacted by the price of natural gas relative to coal (as electric generating units that are fueled with natural gas do not require PAC to remove mercury emissions as do coal-fired units) and abnormal weather conditions that could lead to higher or lower levels of required electricity generation. The Company’s advanced PAC mercury removal products, which can have carbon usage rates of 50% to 90% less than alternative products, are important to its ongoing success in this market. The Company’s expectation is that its ongoing share of the value of this market will be at least 30%. Based on 2017 representing the first complete year of compliance with MATS, and the Company’s success at capturing net new market share in 2017 relative to 2016, the Company expects its 2017 revenues into this market to experience moderate growth compared to 2016. Over the longer term, it is expected that the number of coal fired generating units utilized in North America will ultimately decline and lead to a decline in the annual estimated market size.
In addition to mercury regulations in North America, China has announced plans for mercury removal from its coal-fired power plants. The plans, as announced, stipulate levels of mercury removal that would not likely result in large activated carbon sales. However, trials will purportedly be conducted to establish removal requirements.
The Company believes that fair pricing for activated carbon in the U.S. is being achieved via the application of a tariff imposed on Chinese steam activated carbon. Under the anti-dumping rules, importers of steam activated carbon from China are potentially required to pay anti-dumping duties. The U.S. Department of Commerce (Commerce Department) conducts reviews in order to determine whether changes (increases or decreases) should be made to the anti-dumping tariff rate applicable to any foreign exporter. These retrospective reviews occur annually while the anti-dumping duty order (the order) is in effect (the current order is scheduled to expire in March 2018). Refer to Note 16 of the consolidated financial statements in Item 8 of this Annual Report for further details.
Through a series of initiatives that began in 2012, including additional capital investment; plant efficiency studies; and, product rationalization, the Company successfully increased its virgin carbon manufacturing capacity from an estimated 142 million pounds per year to approximately 164 million pounds per year. In addition, over this same timeframe, the Company has been successfully promoting its reactivation offerings to U.S. drinking water customers. Increasing the utilization of the Company’s available reactivation capacity has also had the intended impact of freeing up – and effectively increasing – its virgin activated carbon capacity available for customers requiring virgin activated carbon products. No significant virgin bituminous coal-based activated carbon capacity expansion projects are planned for
38
2017. However, the previously planned project to refurbish and expand the Company’s Pittsburgh, Pennsylvania reactivation facility is expected to continue in 2017 and into early 2018.
Raw material costs for production in 2017 are expected to be comparable to 2016. The Company’s most significant raw material cost is coal. The quantity of coal consumed varies based on the overall production levels achieved as well as the mix of products manufactured during the year. As of December 31, 2016, the Company has approximately 88% of its anticipated coal requirements for the remainder of 2017 under contract or in inventory.
Equipment
The Company’s equipment business is somewhat cyclical in nature and depends on both regulations and the general health of the overall economy. In 2017, the Company expects moderate growth from 2016 due to expected higher demand for activated carbon adsorption equipment related to the treatment of PFC’s and 1,2,3 TCP discussed in the Activated Carbon and Service section above, as well as from expected higher demand in 2017 for ballast water treatment systems (BWTS). The Company believes that global demand for its other UV equipment systems will continue for a variety of applications including drinking water, wastewater, and advanced oxidation.
BWTS are used to filter and disinfect the water carried in the ballast tanks of ships to prevent the transfer of organisms from one aquatic ecosystem to another, where such organisms could be potentially harmful. Driving the future demand for BWTS are the U.S. Coast Guard (USCG) Final Rule applicable to treating ballast water discharges in the U.S., and the International Maritime Organization’s (IMO) International Convention for the Control and Management of Ships’ Ballast Water and Sediments (IMO Convention) applicable to treating ballast water discharges internationally.
Each regulation requires the management of a ship’s ballast water, generally through the use of a Type Approved BWTS. The Company’s Hyde GUARDIAN® UV-based BWTS are one of more than 60 BWTS to have achieved Type Approval under the IMO Convention, and it expects to commence testing in March 2017 to ready itself to apply for Type Approval under the USCG Final Rule in late 2017.
Recent positive regulatory developments in this market include the September 8, 2016 ratification of the IMO Convention – which calls for it to enter into force on September 8, 2017, and the USCG’s December 2016 granting of its first three BWTS Type Approvals, two of which were for UV light-based systems. Although the USCG Final Rule phased into effect on January 1, 2014 and January 1, 2016, the lack of availability of any type approved systems until just recently has led to the USCG issuing over 11,500 vessel compliance extensions as of December 16, 2016.
As a result of these developments, the Company began experiencing a notable increase in customer inquiries for its BWTS compared to activity earlier in 2016. It expects the pace of activity to remain robust throughout 2017, and lead to higher BWTS equipment sales in late 2017 and continuing into 2018. The timing and pace of this expected increase in sales will be dependent upon a number of variables including the Company’s level of success in completing its USCG testing in 2017 as well as the IMO enforcing compliance with its regulation on the September 8, 2017 effective date.
The Company currently estimates the size of the future market for BWTS to be in the range of $18 billion to $28 billion and be applicable to approximately 64,000 vessels (both retrofit and new build vessels), with a majority of these vessels expected to be outfitted with BWTS equipment over the next 5 to 7 years. Factors influencing the size of the market include pricing, the ultimate number of vessels to be retrofit, the future economic health of the shipping industry, the number of manufacturers who are ultimately able to effectively serve this market, and ongoing uncertainty surrounding USCG regulation compliance enforcement, and the ultimate vessel implementation schedule to be enforced for IMO Convention compliance.
Backlog for the Equipment segment as of December 31, 2016 was $10.9 million.
Consumer
The Company’s Consumer segment supplies activated carbon cloth for use in medical, military and specialty applications. The Company anticipates future growth in medical applications for wound care as its cloth aids in the healing process while providing odor control. The Company continues to focus additional marketing and sales resources to this area of its business, and expects to see modest annual growth in 2017.
39
Other
The activities included in Other are exclusively comprised of the New Business acquired by the Company in November 2016, and primarily consists of the manufacture and sale of wood-based activated carbon and diatomaceous earth (DE) filtration media in Europe and Asia.
The New Business’ wood-based activated carbon activities – with annual production capacity located in France of approximately 22 million pounds – are a component of the global activated carbon market described above in the discussion of the Activated Carbon and Service segment. However, its current activities are not dependent upon environmental regulations, and are primarily leveraged to industrial (including fine chemicals and pharmaceutical production) and food and beverage market applications. The Company estimates these markets will grow in line with the general health of the overall economy.
Similarly, the New Business’ DE filtration media capabilities are primarily leveraged to food and beverage and industrial end markets. With annual capacity located in France of approximately 160 million pounds, the Company expects to see a continuation of solid and steady demand for its DE products, particularly in Europe where only approximately 60% of that region’s annual demand is satisfied by the capacity of the Company and other regional manufacturers.
The Company currently expects the New Business to contribute approximately $100 million to the Company’s sales in 2017.
40
Item 7A. Quantitative and Qualitative Disclosures About Market Risk:
Commodity Price Risk
In the normal course of its business, the Company is exposed to market risk or price fluctuations related to the production of activated carbon products. Coal and natural gas, which are significant to the manufacturing of activated carbon, have market prices that fluctuate regularly. Based on the estimated 2017 usage and price of coal and natural gas not under contract as of January 1, 2017, a hypothetical 10% increase (or decrease) in the price of coal and natural gas, would result in the pre-tax loss (or gain) of $0.5 million and $2.5 million, respectively.
To mitigate the risk of fluctuating prices, the Company has entered into long-term contracts or derivative contracts to hedge the purchase of a percentage of the estimated need of coal and natural gas at fixed prices. The future commitments under the long-term contracts, which provide economic hedges, are disclosed within Note 15 of the consolidated financial statements in Item 8 of this Annual Report. The fair value of the cash-flow hedges for natural gas is disclosed in Note 6 of the consolidated financial statements in Item 8 of this Annual Report.
Interest Rate Risk
The Company’s net exposure to interest rate risk consists primarily of borrowings under its U.S. and Japanese credit agreements described within Note 8 of the consolidated financial statements in Item 8 of this Annual Report. The Company’s U.S. Amended Credit Agreement bears interest at rates that are based off of the prime rate, LIBOR, or Fed Funds rate, plus a margin rate based on the Company’s leverage ratio. As of December 31, 2016, the Company had $225.0 million of borrowings under the U.S. Amended Credit Agreement. The Company’s Japanese Credit Agreement also bears interest at variable rates, however there were no borrowings outstanding as of December 31, 2016. A hypothetical one percentage point increase in the interest rates on the December 31, 2016 outstanding balances under the Company’s variable rate borrowing arrangements would cause annual interest costs to increase by approximately $2.3 million.
Foreign Currency Exchange Risk
The Company is subject to risk of price fluctuations related to anticipated revenues and operating costs, firm commitments for capital expenditures, and existing assets and liabilities denominated in currencies other than U.S. dollars. The Company enters into foreign currency forward exchange contracts and purchases options to manage these exposures. A hypothetical 10% strengthening (or weakening) of the U.S. dollar against the British Pound Sterling, Canadian Dollar, Mexican Peso, Brazilian Real, Chinese Yuan, Japanese Yen, Singapore Dollar, Danish Krone, Swedish Krona, and Euro as of December 31, 2016 would result in a pre-tax loss (or gain) of approximately $2.1 million. The foreign currency forward exchange contracts purchased during 2016 have been accounted for according to ASC 815 “Derivatives and Hedging.”
41
Item 8. Financial Statements and Supplementary Data:
Responsibility for Financial Statements
Management is responsible for the preparation of the financial statements included in this Annual Report. The Consolidated Financial Statements were prepared in accordance with accounting principles generally accepted in the United States of America and include amounts that are based on the best estimates and judgments of management.
Management’s Annual Report on Internal Control over Financial Reporting
Management is responsible for establishing and maintaining adequate internal controls over financial reporting as defined in Rules 13a-15(f) or 15d-15(f) under the Securities Exchange Act of 1934. The Company’s internal control system is designed to provide reasonable assurance concerning the reliability of the financial data used in the preparation of the Company’s financial statements, as well as reasonable assurance with respect to safeguarding the Company’s assets from unauthorized use or disposition. However, no matter how well designed and operated, an internal control system can provide only reasonable, not absolute, assurance that the objectives of the control system are met.
During fiscal year 2016, the Company acquired the wood-based activated carbon, reactivation and mineral-based filtration media business of CECA, a subsidiary of Arkema Group (New Business). For purposes of Management’s evaluation of the Company’s internal control over financial reporting as of December 31, 2016, we have elected to exclude the New Business from the scope of management’s assessment as permitted by guidance provided by the U.S. Securities and Exchange Commission. The acquisition was completed on November 2, 2016. The New Business represents approximately 24% of our consolidated assets at December 31, 2016 and contributed 2% of total net sales for the year ended December 31, 2016. Management is in the process of integrating the New Business into the Company’s internal control framework. This acquired business will be included in management’s annual report on the effectiveness of the Company’s internal controls over financial reporting in fiscal year 2017.
Management conducted an evaluation of the effectiveness of the Company’s internal control over financial reporting as of December 31, 2016. In making this evaluation, management used the criteria set forth by the Committee of Sponsoring Organizations of the Treadway Commission (COSO) in Internal Control — Integrated Framework (2013). Management’s evaluation included reviewing the documentation of our controls, evaluating the design effectiveness of controls, and testing their operating effectiveness.
A material weakness is defined as a significant deficiency or combination of significant deficiencies, in internal control over financial reporting such that there is a reasonable possibility that a material misstatement in the annual or interim financial statements will not be prevented or detected on a timely basis. In connection with management’s assessment of our internal control over financial reporting as described above, management concluded there was a material weakness in the design of our internal control over financial reporting as of December 31, 2016 related to the recognition of revenue for a subset of transactions within the U.S. potable water market. In these instances, certain contracts were inappropriately bifurcated and revenue was recognized prior to the completion of the revenue recognition criteria. Management determined the Company’s controls were not designed to properly identify and assess revenue recognition criteria ensuring all such criteria were considered and met prior to the recording of revenue.
Given this material weakness, management concluded the Company did not maintain effective internal control over financial reporting as of December 31, 2016.
Notwithstanding such material weakness, management has concluded that the consolidated financial statements included in the Form 10-K present fairly, in all material respects, our financial position, results of operations and cash flows for the periods presented in conformity with accounting principles generally accepted in the U.S.
The effectiveness of internal control over financial reporting as of December 31, 2016, has been audited by Deloitte & Touche LLP, an independent registered public accounting firm, who also audited our consolidated financial statements. Deloitte & Touche LLP’s attestation report on the effectiveness of our internal control over financial reporting appears after this Report of Management.
42
Remediation of Material Weakness in Internal Control
We are committed to the remediation of the material weakness in a timely manner. We have begun the process of developing a remediation plan that will address the material weakness in internal control over financial reporting. Specifically, we intend to implement the following changes:
|
· |
Revise the Company’s revenue recognition policy with more detailed guidance on the identification and application of revenue recognition criteria, specifically as it relates to contracts within the U.S. potable water market. |
|
· |
Implement training within the appropriate areas of the business regarding the Company’s revenue recognition policy. |
|
· |
Establish a Compliance function that will work with the business units and corporate accounting to assess business processes and enhance internal controls, including those internal controls over the assessment of revenue recognition criteria as it relates to the contracts impacted by the material weakness described above. |
On a quarterly basis, the status of the remediation implementation will be provided to the Company’s Audit Committee. The Company will monitor the effectiveness of these remediation actions once the plans are implemented. We believe the actions described above will strengthen our internal controls over financial reporting related to the revenue recognition process for this subset of transactions, and will, once completed, address the material weakness that we identified in our internal controls over financial reporting as of December 31, 2016.
Changes in Internal Control
There have not been any changes in the Company’s internal controls over financial reporting, other than the above mentioned acquisition, that occurred during the fourth quarter of 2016, which have materially affected, or are reasonably likely to materially affect, the Company’s internal control over financial reporting.
43
INTERNAL CONTROLS — REPORT OF INDEPENDENT REGISTERED PUBLIC ACCOUNTING FIRM
To the Board of Directors and Stockholders of
Calgon Carbon Corporation
Moon Township, Pennsylvania
We have audited Calgon Carbon Corporation’s and subsidiaries’ (the “Company’s”) internal control over financial reporting as of December 31, 2016, based on criteria established in Internal Control — Integrated Framework (2013) issued by the Committee of Sponsoring Organizations of the Treadway Commission. As described in Management’s Annual Report on Internal Control over Financial Reporting, management excluded from its assessment the internal control over financial reporting at the wood-based activated carbon, reactivation and mineral-based filtration media business of CECA (the “New Business”), which was acquired on November 2, 2016 and whose financial statements constitute 24% of consolidated assets and 2% of total net sales of the consolidated financial statement amounts as of and for the year ended December 31, 2016. Accordingly, our audit did not include the internal control over financial reporting at the New Business. The Company’s management is responsible for maintaining effective internal control over financial reporting and for its assessment of the effectiveness of internal control over financial reporting, include in the accompanying Management’s Annual Report on Internal Control over Financial Reporting. Our responsibility is to express an opinion on the Company’s internal control over financial reporting based on our audit.
We conducted our audit in accordance with the standards of the Public Company Accounting Oversight Board (United States). Those standards require that we plan and perform the audit to obtain reasonable assurance about whether effective internal control over financial reporting was maintained in all material respects. Our audit included obtaining an understanding of internal control over financial reporting, assessing the risk that a material weakness exists, testing and evaluating the design and operating effectiveness of internal control based on that risk, and performing such other procedures as we considered necessary in the circumstances. We believe that our audit provides a reasonable basis for our opinion.
A company’s internal control over financial reporting is a process designed by, or under the supervision of, the company’s principal executive and principal financial officers, or persons performing similar functions, and effected by the company’s board of directors, management, and other personnel to provide reasonable assurance regarding the reliability of financial reporting and the preparation of financial statements for external purposes in accordance with generally accepted accounting principles. A company’s internal control over financial reporting includes those policies and procedures that (1) pertain to the maintenance of records that, in reasonable detail, accurately and fairly reflect the transactions and dispositions of the assets of the company; (2) provide reasonable assurance that transactions are recorded as necessary to permit preparation of financial statements in accordance with generally accepted accounting principles, and that receipts and expenditures of the company are being made only in accordance with authorizations of management and directors of the company; and (3) provide reasonable assurance regarding prevention or timely detection of unauthorized acquisition, use, or disposition of the company’s assets that could have a material effect on the financial statements.
Because of the inherent limitations of internal control over financial reporting, including the possibility of collusion or improper management override of controls, material misstatements due to error or fraud may not be prevented or detected on a timely basis. Also, projections of any evaluation of the effectiveness of the internal control over financial reporting to future periods are subject to the risk that the controls may become inadequate because of changes in conditions, or that the degree of compliance with the policies or procedures may deteriorate.
A material weakness is a deficiency, or a combination of deficiencies, in internal control over financial reporting, such that there is a reasonable possibility that a material misstatement of the company’s annual or interim financial statements will not be prevented or detected on a timely basis. The following material weakness has been identified and included in management's assessment: For a subset of transactions within the U.S. potable water market, certain contracts were inappropriately bifurcated and revenue was recognized prior to the completion of the revenue recognition criteria. The Company’s controls were not designed to properly identify and assess revenue recognition criteria ensuring all such criteria were considered and met prior to the recording of revenue. This material weakness was considered in determining the nature, timing, and extent of audit tests applied in our audit of the consolidated financial statements as of and for the year ended December 31, 2016, of the Company and this report does not affect our report on such financial statements.
44
In our opinion, because of the effect of the material weakness identified above on the achievement of the objectives of the control criteria, the Company has not maintained effective internal control over financial reporting as of December 31, 2016, based on the criteria established in Internal Control — Integrated Framework (2013) issued by the Committee of Sponsoring Organizations of the Treadway Commission.
We have also audited, in accordance with the standards of the Public Company Accounting Oversight Board (United States), the consolidated financial statements as of and for the year ended December 31, 2016, of the Company and our report dated March 1, 2017 expressed an unqualified opinion on those financial statements.
|
/s/ DELOITTE & TOUCHE LLP |
|
Pittsburgh, Pennsylvania |
|
March 1, 2017 |
45
FINANCIAL STATEMENTS — REPORT OF INDEPENDENT REGISTERED PUBLIC ACCOUNTING FIRM
To the Board of Directors and Stockholders of
Calgon Carbon Corporation
Moon Township, Pennsylvania
We have audited the accompanying consolidated balance sheets of Calgon Carbon Corporation and subsidiaries (the “Company”) as of December 31, 2016 and 2015, and the related consolidated statements of comprehensive income, stockholders’ equity, and cash flows for each of the three years in the period ended December 31, 2016. These financial statements are the responsibility of the Company’s management. Our responsibility is to express an opinion on these financial statements based on our audits.
We conducted our audits in accordance with the standards of the Public Company Accounting Oversight Board (United States). Those standards require that we plan and perform the audit to obtain reasonable assurance about whether the financial statements are free of material misstatement. An audit includes examining, on a test basis, evidence supporting the amounts and disclosures in the financial statements. An audit also includes assessing the accounting principles used and significant estimates made by management, as well as evaluating the overall financial statement presentation. We believe that our audits provide a reasonable basis for our opinion.
In our opinion, such consolidated financial statements present fairly, in all material respects, the financial position of Calgon Carbon Corporation and subsidiaries as of December 31, 2016 and 2015, and the results of their operations and their cash flows for each of the three years in the period ended December 31, 2016, in conformity with accounting principles generally accepted in the United States of America.
We have also audited, in accordance with the standards of the Public Company Accounting Oversight Board (United States), the Company’s internal control over financial reporting as of December 31, 2016, based on the criteria established in Internal Control — Integrated Framework (2013) issued by the Committee of Sponsoring Organizations of the Treadway Commission and our report dated March 1, 2017, expressed an adverse opinion on the Company’s internal control over financial reporting because of a material weakness.
|
/s/ DELOITTE & TOUCHE LLP |
|
Pittsburgh, Pennsylvania |
|
March 1, 2017 |
46
CONSOLIDATED STATEMENTS OF COMPREHENSIVE INCOME
Calgon Carbon Corporation
|
|
|
Year Ended December 31 |
|
|||||||
|
(Dollars in thousands, except per share amounts) |
|
2016 |
|
2015 |
|
2014 |
|
|||
|
|
|
|
|
|
|
|
|
|
|
|
|
Net sales |
|
$ |
514,246 |
|
$ |
535,004 |
|
$ |
555,103 |
|
|
|
|
|
|
|
|
|
|
|
|
|
|
Cost of products sold (excluding depreciation and amortization) |
|
|
346,398 |
|
|
343,522 |
|
|
363,014 |
|
|
Depreciation and amortization |
|
|
38,070 |
|
|
35,453 |
|
|
30,470 |
|
|
Selling, general and administrative expenses |
|
|
99,815 |
|
|
84,810 |
|
|
80,860 |
|
|
Research and development expenses |
|
|
5,441 |
|
|
6,425 |
|
|
6,406 |
|
|
Restructuring income |
|
|
— |
|
|
— |
|
|
(252) |
|
|
|
|
|
|
|
|
|
|
|
|
|
|
|
|
|
489,724 |
|
|
470,210 |
|
|
480,498 |
|
|
|
|
|
|
|
|
|
|
|
|
|
|
Income from operations |
|
|
24,522 |
|
|
64,794 |
|
|
74,605 |
|
|
|
|
|
|
|
|
|
|
|
|
|
|
Interest income |
|
|
99 |
|
|
58 |
|
|
77 |
|
|
Interest expense |
|
|
(2,385) |
|
|
(773) |
|
|
(263) |
|
|
Other expense — net |
|
|
(2,163) |
|
|
(693) |
|
|
(1,911) |
|
|
|
|
|
|
|
|
|
|
|
|
|
|
Income before income tax provision |
|
|
20,073 |
|
|
63,386 |
|
|
72,508 |
|
|
|
|
|
|
|
|
|
|
|
|
|
|
Income tax provision (Note 14) |
|
|
6,276 |
|
|
19,923 |
|
|
23,138 |
|
|
|
|
|
|
|
|
|
|
|
|
|
|
Net income |
|
|
13,797 |
|
|
43,463 |
|
|
49,370 |
|
|
|
|
|
|
|
|
|
|
|
|
|
|
Other comprehensive income (loss), net of tax (Note 12) |
|
|
|
|
|
|
|
|
|
|
|
Foreign currency translation |
|
|
(10,956) |
|
|
(13,013) |
|
|
(14,850) |
|
|
Defined benefit pension plans |
|
|
(1,899) |
|
|
(116) |
|
|
(11,908) |
|
|
Derivatives |
|
|
886 |
|
|
(991) |
|
|
388 |
|
|
|
|
|
|
|
|
|
|
|
|
|
|
Total other comprehensive loss |
|
|
(11,969) |
|
|
(14,120) |
|
|
(26,370) |
|
|
|
|
|
|
|
|
|
|
|
|
|
|
Total comprehensive income |
|
$ |
1,828 |
|
$ |
29,343 |
|
$ |
23,000 |
|
|
|
|
|
|
|
|
|
|
|
|
|
|
Net income per common share |
|
|
|
|
|
|
|
|
|
|
|
Basic |
|
$ |
0.27 |
|
$ |
0.84 |
|
$ |
0.93 |
|
|
Diluted |
|
$ |
0.27 |
|
$ |
0.82 |
|
$ |
0.92 |
|
|
|
|
|
|
|
|
|
|
|
|
|
|
Dividends per common share |
|
$ |
0.20 |
|
$ |
0.20 |
|
$ |
— |
|
|
|
|
|
|
|
|
|
|
|
|
|
|
Weighted average shares outstanding, in thousands |
|
|
|
|
|
|
|
|
|
|
|
Basic |
|
|
50,259 |
|
|
51,902 |
|
|
53,042 |
|
|
Diluted |
|
|
51,023 |
|
|
52,709 |
|
|
53,941 |
|
The accompanying notes are an integral part of these consolidated financial statements.
47
Calgon Carbon Corporation
|
|
|
December 31 |
|
||||
|
(Dollars in thousands) |
|
2016 |
|
2015 |
|
||
|
|
|
|
|
|
|
|
|
|
Assets |
|
|
|
|
|
|
|
|
Current assets: |
|
|
|
|
|
|
|
|
Cash and cash equivalents |
|
$ |
37,984 |
|
$ |
53,629 |
|
|
Receivables (net of allowance of $1,416 and $1,675) |
|
|
108,056 |
|
|
96,674 |
|
|
Revenue recognized in excess of billings on uncompleted contracts |
|
|
6,998 |
|
|
9,156 |
|
|
Inventories |
|
|
125,115 |
|
|
110,364 |
|
|
Deferred income taxes — current |
|
|
— |
|
|
22,537 |
|
|
Other current assets |
|
|
13,437 |
|
|
15,365 |
|
|
Total current assets |
|
|
291,590 |
|
|
307,725 |
|
|
|
|
|
|
|
|
|
|
|
Property, plant and equipment, net |
|
|
366,442 |
|
|
311,019 |
|
|
Intangibles, net |
|
|
40,543 |
|
|
5,961 |
|
|
Goodwill |
|
|
66,316 |
|
|
25,777 |
|
|
Deferred income taxes — long-term |
|
|
7,957 |
|
|
2,816 |
|
|
Other assets |
|
|
2,370 |
|
|
3,220 |
|
|
Total assets |
|
$ |
775,218 |
|
$ |
656,518 |
|
|
|
|
|
|
|
|
|
|
|
Liabilities and Stockholders’ Equity |
|
|
|
|
|
|
|
|
Current liabilities: |
|
|
|
|
|
|
|
|
Accounts payable and accrued liabilities |
|
$ |
74,493 |
|
$ |
53,716 |
|
|
Billings in excess of revenue recognized on uncompleted contracts |
|
|
4,063 |
|
|
3,581 |
|
|
Payroll and benefits payable |
|
|
15,458 |
|
|
13,753 |
|
|
Accrued income taxes |
|
|
1,641 |
|
|
2,091 |
|
|
Current portion of long-term debt |
|
|
5,000 |
|
|
7,500 |
|
|
Total current liabilities |
|
|
100,655 |
|
|
80,641 |
|
|
|
|
|
|
|
|
|
|
|
Long-term debt |
|
|
220,000 |
|
|
103,941 |
|
|
Deferred income taxes — long-term |
|
|
25,624 |
|
|
41,383 |
|
|
Accrued pension and other liabilities |
|
|
47,796 |
|
|
36,562 |
|
|
Total liabilities |
|
|
394,075 |
|
|
262,527 |
|
|
|
|
|
|
|
|
|
|
|
Commitments and contingencies (Notes 15 and 16) |
|
|
|
|
|
|
|
|
|
|
|
|
|
|
|
|
|
Stockholders’ equity: |
|
|
|
|
|
|
|
|
Common stock, $.01 par value, 100,000,000 shares authorized, 61,531,025 and 61,300,553 shares issued (Note 11) |
|
|
615 |
|
|
613 |
|
|
Additional paid-in capital |
|
|
185,791 |
|
|
181,676 |
|
|
Retained earnings |
|
|
402,286 |
|
|
398,627 |
|
|
Treasury stock, at cost, 10,781,001 and 10,232,612 shares |
|
|
(153,950) |
|
|
(145,295) |
|
|
Accumulated other comprehensive loss |
|
|
(53,599) |
|
|
(41,630) |
|
|
Total stockholders’ equity |
|
|
381,143 |
|
|
393,991 |
|
|
|
|
|
|
|
|
|
|
|
Total liabilities and stockholders’ equity |
|
$ |
775,218 |
|
$ |
656,518 |
|
The accompanying notes are an integral part of these consolidated financial statements.
48
CONSOLIDATED STATEMENTS OF CASH FLOWS
Calgon Carbon Corporation
|
|
|
Year Ended December 31 |
|
|||||||
|
(Dollars in thousands) |
|
2016 |
|
2015 |
|
2014 |
|
|||
|
|
|
|
|
|
|
|
|
|
|
|
|
Cash flows from operating activities |
|
|
|
|
|
|
|
|
|
|
|
Net income |
|
$ |
13,797 |
|
$ |
43,463 |
|
$ |
49,370 |
|
|
Adjustments to reconcile net income to net cash provided by operating activities: |
|
|
|
|
|
|
|
|
|
|
|
Depreciation and amortization |
|
|
38,070 |
|
|
35,453 |
|
|
30,470 |
|
|
Employee benefit plan provisions |
|
|
4,376 |
|
|
2,044 |
|
|
1,186 |
|
|
Stock-based compensation |
|
|
4,058 |
|
|
3,761 |
|
|
3,748 |
|
|
Deferred income tax (benefit) expense |
|
|
(5,392) |
|
|
6,782 |
|
|
9,213 |
|
|
Changes in assets and liabilities — net of effects from foreign exchange: |
|
|
|
|
|
|
|
|
|
|
|
Receivables |
|
|
(3,665) |
|
|
(4,751) |
|
|
(3,137) |
|
|
Inventories |
|
|
3,692 |
|
|
(14,805) |
|
|
7,907 |
|
|
Revenue in excess of billings on uncompleted contracts and other current assets |
|
|
5,302 |
|
|
53 |
|
|
(5,503) |
|
|
Accounts payable and other accrued liabilities |
|
|
11,247 |
|
|
1,112 |
|
|
(4,103) |
|
|
Pension contributions |
|
|
(2,426) |
|
|
(3,056) |
|
|
(3,505) |
|
|
Other items — net |
|
|
(87) |
|
|
(175) |
|
|
(1,298) |
|
|
Net cash provided by operating activities |
|
|
68,972 |
|
|
69,881 |
|
|
84,348 |
|
|
|
|
|
|
|
|
|
|
|
|
|
|
Cash flows from investing activities |
|
|
|
|
|
|
|
|
|
|
|
Proceeds from sale of assets |
|
|
1,234 |
|
|
— |
|
|
451 |
|
|
Purchase of business - net of cash (Note 20) |
|
|
(153,599) |
|
|
— |
|
|
— |
|
|
Capital expenditures |
|
|
(31,870) |
|
|
(62,264) |
|
|
(63,459) |
|
|
Government grants received |
|
|
— |
|
|
— |
|
|
1,209 |
|
|
Net cash used in investing activities |
|
|
(184,235) |
|
|
(62,264) |
|
|
(61,799) |
|
|
|
|
|
|
|
|
|
|
|
|
|
|
Cash flows from financing activities |
|
|
|
|
|
|
|
|
|
|
|
Japanese working capital loan borrowings — short-term |
|
|
— |
|
|
1,643 |
|
|
3,330 |
|
|
Japanese working capital loan repayments — short-term |
|
|
— |
|
|
(2,490) |
|
|
(4,301) |
|
|
Credit agreement borrowings — long-term |
|
|
328,249 |
|
|
111,400 |
|
|
97,200 |
|
|
Credit agreement repayments — long-term |
|
|
(210,650) |
|
|
(70,400) |
|
|
(56,750) |
|
|
Repayment of term loan — long-term |
|
|
(4,002) |
|
|
— |
|
|
— |
|
|
Reductions of debt obligations |
|
|
— |
|
|
— |
|
|
(1,880) |
|
|
Treasury stock purchased |
|
|
(8,655) |
|
|
(35,634) |
|
|
(40,190) |
|
|
Common stock dividends paid |
|
|
(10,138) |
|
|
(10,430) |
|
|
— |
|
|
Proceeds from the exercise of stock options |
|
|
286 |
|
|
1,095 |
|
|
2,199 |
|
|
Other financing |
|
|
5,709 |
|
|
— |
|
|
— |
|
|
Net cash provided by (used in) financing activities |
|
|
100,799 |
|
|
(4,816) |
|
|
(392) |
|
|
|
|
|
|
|
|
|
|
|
|
|
|
Effect of exchange rate changes on cash and cash equivalents |
|
|
(1,181) |
|
|
(2,305) |
|
|
(1,966) |
|
|
|
|
|
|
|
|
|
|
|
|
|
|
Net (decrease) increase in cash and cash equivalents |
|
|
(15,645) |
|
|
496 |
|
|
20,191 |
|
|
Cash and cash equivalents, beginning of period |
|
|
53,629 |
|
|
53,133 |
|
|
32,942 |
|
|
Cash and cash equivalents, end of period |
|
$ |
37,984 |
|
$ |
53,629 |
|
$ |
53,133 |
|
The accompanying notes are an integral part of these consolidated financial statements.
49
CONSOLIDATED STATEMENTS OF STOCKHOLDERS’ EQUITY
Calgon Carbon Corporation
|
|
|
|
|
|
|
|
|
|
|
|
|
|
Accumulated |
|
|
|
|
|
|
|
|
|
|
|
|
|
Common |
|
|
|
|
Additional |
|
|
|
|
Other |
|
Treasury |
|
|
|
|
Total |
|
|||
|
|
|
Stock |
|
Common |
|
Paid-In |
|
Retained |
|
Comprehensive |
|
Stock |
|
Treasury |
|
Stockholders' |
|
||||||
|
(Dollars in thousands) |
|
Shares |
|
Stock |
|
Capital |
|
Earnings |
|
Loss |
|
Shares |
|
Stock |
|
Equity |
|
||||||
|
Balance, December 31, 2013 (Note 11) |
|
60,885,920 |
|
$ |
609 |
|
$ |
170,283 |
|
$ |
316,224 |
|
$ |
(1,140) |
|
6,242,326 |
|
$ |
(69,471) |
|
$ |
416,505 |
|
|
2014 |
|
|
|
|
|
|
|
|
|
|
|
|
|
|
|
|
|
|
|
|
|
|
|
|
Net income |
|
— |
|
|
— |
|
|
— |
|
|
49,370 |
|
|
— |
|
— |
|
|
— |
|
|
49,370 |
|
|
Other comprehensive loss, net of tax (Note 12) |
|
— |
|
|
— |
|
|
— |
|
|
— |
|
|
(26,370) |
|
— |
|
|
— |
|
|
(26,370) |
|
|
Employee and director stock plans |
|
237,339 |
|
|
3 |
|
|
6,155 |
|
|
— |
|
|
— |
|
— |
|
|
— |
|
|
6,158 |
|
|
Share repurchase (Note 11) |
|
— |
|
|
— |
|
|
— |
|
|
— |
|
|
— |
|
1,930,841 |
|
|
(39,725) |
|
|
(39,725) |
|
|
Treasury stock purchased |
|
— |
|
|
— |
|
|
— |
|
|
— |
|
|
— |
|
23,205 |
|
|
(465) |
|
|
(465) |
|
|
Balance, December 31, 2014 (Note 11) |
|
61,123,259 |
|
$ |
612 |
|
$ |
176,438 |
|
$ |
365,594 |
|
$ |
(27,510) |
|
8,196,372 |
|
$ |
(109,661) |
|
$ |
405,473 |
|
|
|
|
|
|
|
|
|
|
|
|
|
|
|
|
|
|
|
|
|
|
|
|
|
|
|
2015 |
|
|
|
|
|
|
|
|
|
|
|
|
|
|
|
|
|
|
|
|
|
|
|
|
Net income |
|
— |
|
|
— |
|
|
— |
|
|
43,463 |
|
|
— |
|
— |
|
|
— |
|
|
43,463 |
|
|
Other comprehensive loss, net of tax (Note 12) |
|
— |
|
|
— |
|
|
— |
|
|
— |
|
|
(14,120) |
|
— |
|
|
— |
|
|
(14,120) |
|
|
Cash dividends |
|
— |
|
|
— |
|
|
— |
|
|
(10,430) |
|
|
— |
|
— |
|
|
— |
|
|
(10,430) |
|
|
Employee and director stock plans |
|
177,294 |
|
|
1 |
|
|
5,238 |
|
|
— |
|
|
— |
|
— |
|
|
— |
|
|
5,239 |
|
|
Share repurchase (Note 11) |
|
— |
|
|
— |
|
|
— |
|
|
— |
|
|
— |
|
2,002,444 |
|
|
(34,952) |
|
|
(34,952) |
|
|
Treasury stock purchased |
|
— |
|
|
— |
|
|
— |
|
|
— |
|
|
— |
|
33,796 |
|
|
(682) |
|
|
(682) |
|
|
Balance, December 31, 2015 (Note 11) |
|
61,300,553 |
|
$ |
613 |
|
$ |
181,676 |
|
$ |
398,627 |
|
$ |
(41,630) |
|
10,232,612 |
|
$ |
(145,295) |
|
$ |
393,991 |
|
|
|
|
|
|
|
|
|
|
|
|
|
|
|
|
|
|
|
|
|
|
|
|
|
|
|
2016 |
|
|
|
|
|
|
|
|
|
|
|
|
|
|
|
|
|
|
|
|
|
|
|
|
Net income |
|
— |
|
|
— |
|
|
— |
|
|
13,797 |
|
|
— |
|
— |
|
|
— |
|
|
13,797 |
|
|
Other comprehensive loss, net of tax (Note 12) |
|
— |
|
|
— |
|
|
— |
|
|
— |
|
|
(11,969) |
|
— |
|
|
— |
|
|
(11,969) |
|
|
Cash dividends |
|
— |
|
|
— |
|
|
— |
|
|
(10,138) |
|
|
— |
|
— |
|
|
— |
|
|
(10,138) |
|
|
Employee and director stock plans |
|
230,472 |
|
|
2 |
|
|
4,115 |
|
|
— |
|
|
— |
|
— |
|
|
— |
|
|
4,117 |
|
|
Share repurchase (Note 11) |
|
— |
|
|
— |
|
|
— |
|
|
— |
|
|
— |
|
518,576 |
|
|
(8,201) |
|
|
(8,201) |
|
|
Treasury stock purchased |
|
— |
|
|
— |
|
|
— |
|
|
— |
|
|
— |
|
29,813 |
|
|
(454) |
|
|
(454) |
|
|
Balance, December 31, 2016 (Note 11) |
|
61,531,025 |
|
$ |
615 |
|
$ |
185,791 |
|
$ |
402,286 |
|
$ |
(53,599) |
|
10,781,001 |
|
$ |
(153,950) |
|
$ |
381,143 |
|
The accompanying notes are an integral part of these consolidated financial statements.
50
NOTES TO THE CONSOLIDATED FINANCIAL STATEMENTS
Calgon Carbon Corporation
(Dollars in thousands, except per share amounts or as otherwise noted)
1. Summary of Accounting Policies
Operations
Calgon Carbon Corporation (the Company) is a global leader in innovative solutions, high quality products and reliable services designed to protect human health and the environment from harmful contaminants in water, and air. As a leading manufacturer of activated carbon, with broad capabilities in ultraviolet light disinfection, the Company provides purification solutions for drinking water, wastewater, pollution abatement, and a variety of industrial and commercial manufacturing processes. The Company’s operations are principally conducted in four business segments: Activated Carbon and Service, Equipment, Consumer, and Other. Each of these segments includes the production, design and marketing of products and services specifically developed for the purification, separation and concentration of liquids and gases and other media. The Activated Carbon and Service segment relies on activated carbon as a base material, while the Equipment segment relies on a variety of methods and materials which involve other products in addition to activated carbon. The Consumer segment supplies activated carbon cloth for use in military, industrial, and medical applications. The Company’s largest markets are in the United States (U.S.), Europe, and Japan. The Company also has markets in Africa, Canada, China, India, Latin America, and in other parts of Asia. On November 2, 2016, the Company completed the acquisition of the wood-based activated carbon, reactivation, and mineral-based filtration media business of CECA, a subsidiary of Arkema Group (New Business). With the complementary New Business located in Europe, the Company becomes an even more global and diverse industry leader in activated carbon, reactivation, and filtration media in the form of diatomaceous earth and perlites. For purposes of reporting the results of its segments in 2016, Other is exclusively comprised of the New Business subsequent to its acquisition. Refer to Notes 18 and 20 for additional information regarding the acquisition.
Principles of Consolidation
The consolidated financial statements include the accounts of majority-owned and controlled subsidiaries. Investments in business entities in which the Company does not have control, but has the ability to exercise significant influence over the operating and financial policies, are accounted for under the equity method. All intercompany transactions and accounts have been eliminated in consolidation.
Use of Estimates
The preparation of financial statements in conformity with accounting principles generally accepted in the U.S. requires management to make estimates and assumptions that affect the reported amounts of assets and liabilities and disclosure of contingent assets and liabilities at the date of the financial statements and the reported amounts of revenues and expenses during the reporting period. Actual results could differ from those estimates.
Reclassifications
Certain prior year amounts have been reclassified to conform to the current year presentation. These reclassifications had no impact on the Company’s previously reported net income, cash flows, or stockholders’ equity.
Foreign Currency
Substantially all assets and liabilities of the Company’s international operations are translated at year-end exchange rates; income and expenses are translated at average exchange rates prevailing during the year. Translation adjustments
51
represent other comprehensive income or loss and are accumulated in a separate component of stockholders’ equity. Transaction gains and losses are included in Other expense-net.
Revenue Recognition
Revenue and related costs are recognized when goods are shipped or services are rendered to customers provided that ownership and risk of loss have passed to the customer, the price to the customer is fixed or determinable, persuasive evidence of an arrangement exists and collection is reasonably assured. Revenue for major equipment projects is recognized under the percentage of completion method. The Company’s major equipment projects generally have a long project life cycle from bid solicitation to project completion. The nature of the contracts are generally fixed price with milestone billings. The Company recognizes revenue for these projects based on the fixed sales prices multiplied by the percentage of completion. In applying the percentage of completion method, a project’s percent complete as of any balance sheet date is computed as the ratio of total costs incurred to date divided by the total estimated costs at completion. As changes in the estimates of total costs at completion and/or estimated total losses on projects are identified, appropriate earnings adjustments are recorded during the period that the change is identified. The Company has a history of making reasonably dependable estimates of costs at completion on contracts that follow the percentage of completion method; however, due to uncertainties inherent in the estimation process, it is possible that actual project costs at completion could vary from estimates. The principal components of costs include material, direct labor, subcontracts, and allocated indirect costs. Indirect costs primarily consist of administrative labor and associated operating expenses, which are allocated to the respective projects on actual hours charged to the project utilizing a standard hourly rate.
Cash and Cash Equivalents
The Company considers all highly liquid, short-term investments made with an original maturity of three months or less to be cash equivalents. From time to time, the Company could have cash deposited with financial institutions in excess of federally insured limits. As of December 31, 2016 and 2015, the Company had $4.8 million and zero, respectively, of cash deposits with U.S. financial institutions in excess of federally insured limits. The Company’s foreign subsidiaries held cash and cash equivalents of $27.4 million and $45.1 million as of December 31, 2016 and 2015, respectively. Generally, cash and cash equivalents held by foreign subsidiaries are not readily available for use in the U.S. without adverse tax consequences.
Concentration of Credit Risk
Financial instruments that potentially expose the Company to concentrations of credit risk consist primarily of cash and cash equivalents and customer receivables. The Company places its cash with financial institutions and invests in low-risk, highly liquid instruments. With respect to customer receivables, the Company believes that it has no significant concentration of credit risk as no single customer accounted for more than 10 percent of gross annual revenues as of December 31, 2016. The Company closely monitors the credit risk associated with its customers and to date has not experienced material losses.
Allowance for Doubtful Accounts
The Company maintains allowances for doubtful accounts for estimated losses resulting from the inability of its customers to make required payments. The amount of allowance recorded is primarily based upon a periodic review of specific customer transactions that remain outstanding at least three months beyond their respective due dates.
Inventories
Inventories are carried at the lower of cost or market. Inventory costs are primarily determined using the first-in, first-out (FIFO) method.
52
Property, Plant and Equipment
Property, plant and equipment is recorded at cost. Repair and maintenance costs are expensed as incurred. Depreciation for financial reporting purposes is computed on the straight-line method over the estimated service lives of the assets, which are from 15 to 30 years for land improvements and buildings, 5 to 15 years for furniture, machinery and equipment, 5 to 10 years for customer capital, 5 years for vehicles, and 5 to 10 years for computer hardware and software. Expenditures for new facilities and improvements that substantially extend the capacity or useful life of an asset are capitalized.
Mineral rights were acquired as part of the acquisition of the New Business. Mineral rights include diatomite ore deposits, and are stated at cost, less accumulated depletion. Depletion is computed for mineral rights using the units-of-production method and is included in the Company’s depreciation expense.
Asset Retirement Obligations
As a result of the acquisition of the New Business, the Company has recognized asset retirement obligations (AROs) related to reclamation obligations associated with the normal operation of the diatomite mining facilities. These AROs consist primarily of costs associated with mine reclamation and landfill closures. The fair values of these AROs are recorded on a discounted basis at the time the obligation is incurred, and accreted over time for the change in present value. Additionally, the Company capitalizes asset retirement costs by increasing the carrying amount of the related long-lived assets and depreciating these assets over the remaining life of the active mining facilities. The Company reviews, on an annual basis, unless otherwise deemed necessary, the reclamation obligation at each active mine site in accordance with accounting guidance for reclamation obligations.
Goodwill and Other Intangible Assets
Goodwill represents the excess of the cost of an acquired business over the fair value of the identifiable tangible and intangible assets acquired and liabilities assumed in a business combination. Identifiable intangible assets acquired in business combinations are recorded based on their fair values at the date of acquisition. In accordance with guidance within Financial Accounting Standards Board (FASB) Accounting Standards Codification (ASC) 350 “Intangibles - Goodwill and Other” goodwill and identifiable intangible assets with indefinite lives are not subject to amortization but must be evaluated for impairment.
As a result of the acquisition of the New Business, the Company has recorded various intangible assets, including trade names and trademarks, unpatented technology, and customer relationships. The trade names and trademarks acquired have indefinite lives and will be tested for impairment annually. All remaining acquired identifiable intangible assets have finite lives.
The Company evaluates goodwill and indefinite-lived intangible assets for impairment annually, or when events occur or circumstances change that may reduce the fair value of the asset below its carrying amount. The Company has elected to perform the annual impairment test of its goodwill and indefinite-lived intangible assets, as required, on December 31 of each year by initially comparing the fair value of each of the Company’s reporting units to their related carrying values. If the fair value of the reporting unit is less than its carrying value, the Company performs an additional step to determine the implied fair value of the goodwill. The implied fair value of goodwill is determined by first allocating the fair value of the reporting unit to all of the assets and liabilities of the unit and then computing the excess of the unit’s fair value over the amounts assigned to the assets and liabilities. If the carrying value of goodwill exceeds the implied fair value of goodwill, such excess represents the amount of goodwill impairment, and the Company recognizes such impairment accordingly. Fair values are estimated using discounted cash flows and other valuation methodologies that are based on projections of the amounts and timing of future revenues and cash flows, assumed discount rates and other
53
assumptions as deemed appropriate. The Company also considers such factors as historical performance, anticipated market conditions, operating expense trends and capital expenditure requirements.
The Company’s identifiable intangible assets other than goodwill and trade names and trademarks have finite lives. Certain of these intangible assets, such as customer relationships, are amortized using an accelerated methodology while others, such as patents, are amortized on a straight-line basis over their estimated useful lives. In addition, intangible assets with finite lives are evaluated for impairment whenever events or circumstances indicate that their carrying amount may not be recoverable, as prescribed by guidance within ASC 360 “Property, Plant, and Equipment.”
Long-Lived Assets
The Company evaluates long-lived assets under the provisions of ASC 360 “Property, Plant, and Equipment” which addresses financial accounting and reporting for the impairment of long-lived assets and for long-lived assets to be disposed of. For assets to be held and used, the Company groups a long-lived asset or assets with other assets and liabilities at the lowest level for which identifiable cash flows are largely independent of the cash flows of other assets and liabilities. An impairment loss for an asset group reduces only the carrying amounts of a long-lived asset or assets of the group being evaluated. The loss is allocated to the long-lived assets of the group on a pro-rata basis using the relative carrying amounts of those assets, except that the loss allocated to an individual long-lived asset of the group does not reduce the carrying amount of that asset below its fair value whenever that fair value is determinable without undue cost and effort. Estimates of future cash flows to test the recoverability of a long-lived asset group include only the future cash flows that are directly associated with and that are expected to arise as a direct result of the use and eventual disposition of the asset group. The future cash flow estimates used by the Company exclude interest charges.
Fair Value
Fair value is defined as the price that would be received to sell an asset or paid to transfer a liability in an orderly transaction between market participants at the measurement date. The fair value hierarchy distinguishes between (1) market participant assumptions developed based on market data obtained from independent sources (observable inputs) and (2) an entity’s own assumptions about market participant assumptions developed based on the best information available in the circumstances (unobservable inputs). The fair value hierarchy consists of three broad levels, which gives the highest priority to unadjusted quoted prices in active markets for identical assets or liabilities (Level 1) and the lowest priority to unobservable inputs (Level 3). The three levels of the fair value hierarchy are described below:
|
· |
Level 1 — Quoted prices (unadjusted) in active markets for identical assets or liabilities; |
|
· |
Level 2 — Inputs, other than the quoted prices in active markets, that are observable either directly or indirectly; and |
|
· |
Level 3 — Unobservable inputs that reflect the reporting entity’s own assumptions. |
The Company’s financial instruments, excluding derivative instruments, consist primarily of cash and cash equivalents, short and long-term debt as well as accounts receivable and accounts payable. The fair value of accounts receivable and accounts payable approximates their carrying value because of the short-term maturity of the instruments.
Derivative Instruments
The Company applies ASC 815 “Derivatives and Hedging” which establishes accounting and reporting standards for derivative instruments, including certain derivative instruments embedded in other contracts and for hedging activities. Derivative financial instruments are utilized by the Company to manage risk exposure to movements in foreign exchange rates or the prices of natural gas. The Company enters into derivative financial instruments with high credit quality counterparties and diversifies its positions among such counterparties. In addition, various master netting arrangements are in place with counterparties to facilitate settlement of gains and losses on these contracts. The
54
Company does not net its derivative positions by counterparty for purposes of balance sheet presentation and disclosure. Changes in the value of the derivative financial instruments are measured at the balance sheet date and recognized in current earnings or other comprehensive income depending on whether the derivative is designated as part of a hedge transaction and meets certain other criteria. The Company does not hold derivative financial instruments for trading purposes.
Pensions
The Company accounts for its pensions in accordance with ASC 715 “Compensation – Retirement Benefits.” Accounting for pensions involves estimating the cost of benefits to be provided well into the future and attributing that cost over the time period each employee works. To accomplish this, extensive use is made of assumptions about inflation, investment returns, mortality, turnover and discount rates. These assumptions are reviewed annually. In determining the expected return on plan assets, the Company evaluates long-term actual return information, the mix of investments that comprise plan assets and future estimates of long-term investment returns. The Company uses country specific mortality tables and updates them periodically as better information becomes available. In determining the discount rates for pension obligations, the Company evaluates long-term corporate bonds that receive one of the two highest ratings given by a recognized rating agency.
Amortization of the actuarial net gain or loss as a result of experience differing from that assumed and from changes in assumptions is included as a component of net periodic pension cost for the year. The Company uses a 10% corridor such that if, as of the beginning of the year, the net gain or loss exceeds 10% of the greater of the projected benefit obligation or the market-related value of plan assets, the amortization is that excess divided by the average future working lifetime of participating employees expected to receive benefits under the plan or the average remaining life expectancy of the plan’s participants if the percentage of actives is less than 10% of the total population. As only the excess actuarial gain or loss is amortized, this approach will not fully amortize the net actuarial gain or loss.
Stock-Based Compensation
The Company applies ASC 718 “Compensation — Stock Compensation.” In accordance with guidance within ASC 718, compensation expense for stock options is recorded over the vesting period using the fair value on the date of grant, as calculated by the Company using the Black-Scholes model. For time vested restricted stock awards, the nonvested restricted stock grant date fair value, which is the market price of the underlying common stock, is expensed over the vesting period. For certain performance based stock awards, the initial grant date fair value of the performance stock awards that vest subject to a market condition is determined using a Monte Carlo simulation model and is expensed on a straight-line basis over the performance period. For certain performance based stock awards that vest subject to a performance condition, the initial grant date fair value is the market price of the underlying common stock. This fair value is expensed on a straight-line basis over the performance period when it is probable that the performance condition will be achieved. The Company’s stock-based compensation plans are more fully described in Note 10.
Net Income per Common Share
Basic net income per common share is computed by dividing net income by the weighted average number of common shares outstanding during the period. Diluted net income per common share is computed by dividing net income by the weighted average number of common shares outstanding plus all potential dilutive common shares outstanding during the period. Potential dilutive common shares are determined using the treasury stock method. Under the treasury stock method, exercise of options is assumed at the beginning of the period when the average stock price during the period exceeds the exercise price of outstanding options and common shares are assumed issued. The proceeds from exercise are assumed to be used to purchase common stock at the average market price during the period. The incremental shares to be issued are considered to be the potential dilutive common shares outstanding.
55
Income Taxes
Deferred tax assets and liabilities are recognized for the future tax consequences of temporary differences between the book and tax basis of assets and liabilities. If it is more likely than not that some portion or all of a deferred tax asset will not be realized, a valuation allowance is recognized. The Company assesses its ability to realize deferred tax assets based on normalized historical performance and on projections of future taxable income in the relevant tax jurisdictions. Normalized historical performance for purposes of this assessment includes adjustments for those income and expense items that are unusual and non-recurring in nature and are not expected to affect results in future periods. Such unusual and non-recurring items include the effects of legal fees or settlements associated with specific litigation matters, acquisition and restructuring costs. The Company’s projections of future taxable income considers known events, such as the passage of legislation or expected occurrences, and do not reflect a general growth assumption. The Company’s estimates of future taxable income are reviewed annually or whenever events or changes in circumstances indicate that such projections should be modified.
The Company utilizes guidance within ASC 740 “Income Taxes” regarding the accounting for uncertainty in income taxes. This guidance prescribes recognition and measurement standards for a tax position taken or expected to be taken in a tax return. According to this guidance, the evaluation of a tax position is a two step process. The first step is the determination of whether a tax position should be recognized in the financial statements. The benefit of a tax position taken or expected to be taken in a tax return is to be recognized only if the Company determines that it is more likely than not that the tax position will be sustained upon examination by the tax authorities based upon the technical merits of the position. In step two, for those tax positions which should be recognized, the measurement of a tax position is determined as being the largest amount of benefit that is greater than 50% likely of being realized upon ultimate settlement.
No provision is made for U.S. income taxes on the undistributed earnings of non-U.S. subsidiaries because these earnings are intended to be indefinitely reinvested outside the U.S. These earnings would become subject to income tax if they were remitted as dividends, were loaned to the Company or a U.S. affiliate, or if the Company were to sell its ownership interest in the subsidiaries.
In November 2015, the FASB issued Accounting Standards Update (ASU) 2015-17, “Balance Sheet Classification of Deferred Taxes” which requires that all deferred tax assets (DTAs) and deferred tax liabilities (DTLs), along with any related valuation allowance, be classified as noncurrent in a classified balance sheet. Netting of DTAs and DTLs by tax jurisdiction is still required under the new guidance. The Company adopted ASU 2015-17 effective December 31, 2016 on a prospective basis. Adoption of this ASU resulted in an initial reclassification of $18.1 million of the Company’s net current deferred income tax asset to the long-term deferred income tax asset in its consolidated balance sheet as of December 31, 2016. Due to required netting by tax jurisdiction, a large portion of this amount was netted against the long-term deferred income tax liability. No prior periods were retrospectively adjusted.
Leases
The Company leases certain facilities, equipment and vehicles. Certain of the Company’s leases contain renewal options, rent escalation clauses and landlord incentives. Renewal terms generally reflect market rates at the time of renewal. Rent expense for noncancelable operating leases with scheduled rent increases or landlord incentives is recognized on a straight-line basis over the lease term, including any applicable rent holidays, beginning with the lease commencement date. The excess of straight-line rent expense over scheduled payment amounts and landlord incentives is recorded as a deferred liability.
56
Contingencies
The Company from time to time is subject to various legal proceedings, lawsuits and claims, including employment, product warranty and environmental matters of the nature considered normal to its business. It is the Company’s policy to accrue for amounts related to legal matters when it is probable that a liability has been incurred and the loss amount is reasonably estimable. Estimates are developed through consultation with legal counsel involved in the defense and are based upon an analysis of probable results, assuming a combination of litigation and settlement strategies. Legal fees associated with defending these various lawsuits and claims are expensed when incurred.
Government Grants
The Company’s policy for accounting for government grants, including non-monetary grants at fair value, is to recognize them only when there is reasonable assurance that (a) the Company will comply with the conditions attached to the grants and (b) the grants will be received. A grant will be recognized over the period necessary to match it to the related costs, for which it is intended to compensate, on a systematic basis. A grant related to assets is presented by deducting it from the asset’s carrying amount and is reported within cash flows from investing activities. A grant related to income will be deducted from the related expense and reported within cash flows from operating activities.
Labor Agreements
Collective bargaining agreements cover approximately 46% of the Company’s full-time labor force as of December 31, 2016 that expire at various dates through 2019. Approximately 6% of the Company’s labor force is operating under contracts that expired on December 31, 2016, which are in the process of being renegotiated.
New Accounting Pronouncements
In May 2014, the FASB issued ASU 2014-09, “Revenue (Topic 606): Revenue from Contracts with Customers” which outlines a single comprehensive model for entities to use in accounting for revenue arising from contracts with customers and supersedes most current revenue recognition guidance, including industry-specific guidance. The core principle of ASU 2014-09 is that an entity should recognize revenue when it transfers promised goods or services to customers in an amount that reflects the consideration to which the entity expects to be entitled in exchange for those goods or services by applying five steps listed in the guidance. ASU 2014-09 also requires disclosure of both quantitative and qualitative information that enables users of financial statements to understand the nature, amount, timing and uncertainty of revenue and cash flows arising from customers. In August 2015, the FASB issued ASU 2015-14, which defers the effective date of ASU 2014-09 by one year. In March 2016, the FASB issued ASU 2016-08, “Revenue from Contracts with Customers (Topic 606): Principal versus Agent Considerations (Reporting Revenue Gross versus Net)” which amends the principal-versus agent implementation guidance and illustrations in FASB’s new revenue standard ASU 2014-09. The new guidance includes indicators to assist an entity in determining whether it controls a specified good or service before it is transferred to the customers. In April 2016, the FASB issued ASU 2016-10, “Identifying Performance Obligations and Licensing” which amends certain aspects of the guidance in ASU 2014-09. For identifying performance obligations, the amendments include: immaterial promised goods and services, shipping and handling activities, and identifying when promises represent performance obligations. In May 2016, the FASB issued ASU 2016-12, “Revenue from Contracts with Customers (Topic 606): Narrow-Scope Improvements and Practical Expedients.” This clarifies the collectability assessment, sales tax presentation and the treatment of contract modifications and completed contracts at transition. In May 2016, the FASB issued ASU 2016-11, “Rescission of SEC Guidance Because of Accounting Standards Update 2014-09” which rescinds certain SEC guidance upon adoption including those related to freight services in process and shipping and handling fees. All of the new guidance is effective for fiscal years, and interim periods within those years, beginning after December 15, 2017. The Company is currently determining the potential impacts of the new standard on its contract portfolio. The approach includes performing a detailed review of key contracts representative of its different businesses and comparing historical accounting policies and practices to the new standard. The Company will continue to evaluate the provisions of this ASU to assess the
57
impact it may have on its consolidated financial statements and related disclosures. The Company is planning to adopt the provisions of the ASU and its subsequent amendments using the modified retrospective transition method for existing transactions that may result in a cumulative effect adjustment as of January 1, 2018.
In July 2015, the FASB issued ASU 2015-11, “Simplifying the Measurement of Inventory” which requires entities to measure most inventory at the lower of cost and net realizable value. This simplifies the current guidance under which an entity measures inventory at the lower of cost or market. Market in this context is defined as one of three different measures, one of which is net realizable value. Net realizable value is the estimated selling prices in the ordinary course of business, less reasonably predictable costs of completion, disposal, and transportation. The new guidance will be applied prospectively, and is effective for fiscal years, and interim periods within those years, beginning after December 15, 2016. The adoption of this ASU is not expected to have a material impact on the Company’s consolidated financial statements.
In February 2016, the FASB issued ASU 2016-02, “Leases (Topic 842)” which introduces a lessee model that brings most leases on the balance sheet, requiring lessees to recognize the right to use assets and lease obligations that arise from lease arrangements exceeding a twelve month term. Lessees will also need to disclose qualitative and quantitative information about lease transactions, such as information about variable lease payments and options to renew and terminate leases. For income statement purposes, the FASB retained a dual model, requiring leases to be classified as either operating or finance. Classification will be based on criteria that are largely similar to those applied in current lease accounting, but without explicit bright lines. Lessor accounting is similar to the current model, but updated to align with certain changes to the lessee model and the new revenue recognition standard. The new guidance is effective for fiscal years, and interim periods within those years, beginning after December 15, 2018. Entities are required to use a modified retrospective transition for existing leases. The Company is evaluating the provisions of this ASU and assessing the impact it may have on the Company’s consolidated financial statements and related disclosures. At a minimum, total assets and total liabilities will increase in the period the ASU is adopted. As of December 31, 2016, the Company’s undiscounted future minimum payments outstanding for lease obligations were approximately $41 million.
In March 2016, the FASB issued ASU 2016-09, “Compensation – Stock Compensation (Topic 718): Improvements to Employee Share-Based Payment Accounting” which simplifies several aspects of the accounting for employee share-based payment transactions, including the accounting for income taxes, forfeitures, and statutory tax withholding requirements, as well as classification in the statement of cash flows. The new guidance is effective for annual reporting periods beginning after December 15, 2016, including interim periods within those annual reporting periods. The Company is planning to adopt the provisions of this ASU using the modified retrospective transition method for existing share-based payment transactions, effective January 1, 2017. The adoption of this ASU is not expected to have a material impact on the Company’s consolidated financial statements.
In June 2016, the FASB issued ASU 2016-13, “Financial Instruments – Credit Losses (Topic 326): Measurement of Credit Losses on Financial Instruments” which adds a Current Expected Credit Loss (CECL) model that is based on expected losses rather than incurred losses, which is applicable to trade receivables. The new guidance is effective for annual reporting periods beginning after December 15, 2019, including interim periods within those annual reporting periods. Entities are required to use the modified retrospective approach. The Company is evaluating the provisions of this ASU and assessing the impact it may have on the Company’s consolidated financial statements and related disclosures.
In August and November 2016, the FASB issued ASU 2016-15, “Statement of Cash Flows (Topic 230): Classification of Certain Cash Receipts and Cash Payments” and ASU 2016-18, “Statement of Cash Flows (Topic 230): Restricted Cash” to add or clarify guidance on the classification of certain cash receipts and payments and restricted cash in the statement of cash flows. The new guidance is effective for annual reporting period beginning after December 15, 2017, including interim periods within those annual reporting periods. Entities must apply the guidance retrospectively to all periods presented, but may apply it prospectively from the earliest date practicable if retrospective application would be
58
impracticable. The adoption of this ASU is not expected to have a material impact on the Company’s consolidated financial statements.
2. Inventories
|
|
|
December 31 |
|
||||
|
|
|
2016 |
|
2015 |
|
||
|
Raw materials |
|
$ |
24,831 |
|
$ |
23,327 |
|
|
Finished goods |
|
|
100,284 |
|
|
87,037 |
|
|
Total |
|
$ |
125,115 |
|
$ |
110,364 |
|
Inventories are recorded net of reserves of $2.6 million and $2.4 million for obsolete and slow-moving items as of December 31, 2016 and 2015, respectively.
3. Property, Plant and Equipment
|
|
|
December 31 |
|
||||
|
|
|
2016 |
|
2015 |
|
||
|
Land and improvements |
|
$ |
37,479 |
|
$ |
32,522 |
|
|
Mineral rights |
|
|
11,240 |
|
|
— |
|
|
Buildings |
|
|
90,385 |
|
|
67,841 |
|
|
Machinery, equipment and customer capital |
|
|
494,722 |
|
|
458,975 |
|
|
Computer hardware and software |
|
|
43,631 |
|
|
41,850 |
|
|
Furniture and vehicles |
|
|
10,893 |
|
|
10,534 |
|
|
Construction-in-progress |
|
|
30,525 |
|
|
32,141 |
|
|
|
|
|
718,875 |
|
|
643,863 |
|
|
Less accumulated depreciation |
|
|
(352,433) |
|
|
(332,844) |
|
|
Property, plant and equipment, net |
|
$ |
366,442 |
|
$ |
311,019 |
|
Depreciation expense for the years ended December 31, 2016, 2015, and 2014 totaled $36.3 million, $33.7 million, and $28.2 million, respectively.
The Company's AROs related to the acquisition of the New Business are for legal obligations associated with the normal operations of the diatomite mining facilities up to the end of the quarries’ exploration. These AROs consist primarily of costs associated with mine reclamation and landfill closures related to the mineral rights. As of December 31, 2016, the $1.8 million liability was recorded as a component of accrued pension and other liabilities.
4. Goodwill and Other Identifiable Intangible Assets
The Company has elected to perform the annual impairment test of its goodwill, as required, on December 31 of each year. For purposes of the test, the Company had historically identified six reporting units as defined within ASC 350 “Intangibles – Goodwill and Other” at a regional level for the Activated Carbon and Service segment and at the technology level for the Equipment segment and has allocated goodwill to these reporting units accordingly. These reporting units consist of the Activated Carbon and Service segment which is segregated into two regional reporting units, the Americas/Asia and Europe, the Equipment segment which is segregated by technology (a) carbon adsorption, (b) ultraviolet light, and (c) ion exchange, and the Consumer segment which includes the charcoal cloth reporting unit. The goodwill associated with the Consumer segment is not material and has not been allocated below the segment level.
59
The goodwill associated with the acquisition of the New Business is reported as Other and has not been allocated below this level as of December 31, 2016. Refer to Notes 18 and 20 for further information. The changes in the carrying amount of goodwill by segment for the years ended December 31, 2016 and 2015 are as follows:
|
|
|
Activated |
|
|
|
|
|
|
|
|
|
|
|
|
|
|
|
|
|
Carbon and |
|
Equipment |
|
Consumer |
|
Other |
|
|
|
|
||||
|
|
|
Service Segment |
|
Segment |
|
Segment |
|
Segment |
|
Total |
|
|||||
|
Balance as of January 1, 2015 |
|
$ |
19,753 |
|
$ |
6,384 |
|
$ |
60 |
|
$ |
— |
|
$ |
26,197 |
|
|
Foreign currency translation |
|
|
(149) |
|
|
(271) |
|
|
— |
|
|
— |
|
|
(420) |
|
|
Balance as of December 31, 2015 |
|
|
19,604 |
|
|
6,113 |
|
|
60 |
|
|
— |
|
|
25,777 |
|
|
Acquisition |
|
|
— |
|
|
— |
|
|
— |
|
|
42,844 |
|
|
42,844 |
|
|
Foreign currency translation |
|
|
(551) |
|
|
47 |
|
|
— |
|
|
(1,801) |
|
|
(2,305) |
|
|
Balance as of December 31, 2016 |
|
$ |
19,053 |
|
$ |
6,160 |
|
$ |
60 |
|
$ |
41,043 |
|
$ |
66,316 |
|
The following is a summary of the Company’s identifiable intangible assets as of December 31, 2016 and 2015, respectively:
|
|
|
December 31, 2016 |
|
|||||||||||||
|
|
|
Weighted |
|
|
|
|
|
|
|
|
|
|
|
|
|
|
|
|
|
Average |
|
Gross |
|
|
|
|
|
|
|
Net |
|
|||
|
|
|
Amortization |
|
Carrying |
|
Foreign |
|
Accumulated |
|
Carrying |
|
|||||
|
|
|
Period |
|
Amount |
|
Exchange |
|
Amortization |
|
Amount |
|
|||||
|
Amortized intangible assets: |
|
|
|
|
|
|
|
|
|
|
|
|
|
|
|
|
|
Customer relationships |
|
18.9 |
Years |
|
$ |
25,035 |
|
$ |
(873) |
|
$ |
(8,900) |
|
$ |
15,262 |
|
|
Product certification |
|
7.4 |
Years |
|
|
8,649 |
|
|
(90) |
|
|
(4,320) |
|
|
4,239 |
|
|
Unpatented technology |
|
20.0 |
Years |
|
|
14,174 |
|
|
(586) |
|
|
(114) |
|
|
13,474 |
|
|
Licenses |
|
20.0 |
Years |
|
|
964 |
|
|
(99) |
|
|
(354) |
|
|
511 |
|
|
|
|
17.3 |
Years |
|
|
48,822 |
|
|
(1,648) |
|
|
(13,688) |
|
|
33,486 |
|
|
Indefinite lived intangible assets: |
|
|
|
|
|
|
|
|
|
|
|
|
|
|
|
|
|
Trade names and trademarks |
|
|
|
|
|
7,362 |
|
|
(305) |
|
|
— |
|
|
7,057 |
|
|
|
|
|
|
|
|
|
|
|
|
|
|
|
|
|
|
|
|
Total |
|
|
|
|
$ |
56,184 |
|
$ |
(1,953) |
|
$ |
(13,688) |
|
$ |
40,543 |
|
|
|
|
December 31, 2015 |
|
|||||||||||||
|
|
|
Weighted |
|
|
|
|
|
|
|
|
|
|
|
|
|
|
|
|
|
Average |
|
Gross |
|
|
|
|
|
|
|
Net |
|
|||
|
|
|
Amortization |
|
Carrying |
|
Foreign |
|
Accumulated |
|
Carrying |
|
|||||
|
|
|
Period |
|
Amount |
|
Exchange |
|
Amortization |
|
Amount |
|
|||||
|
Amortized intangible assets: |
|
|
|
|
|
|
|
|
|
|
|
|
|
|
|
|
|
Patents |
|
20.0 |
Years |
|
$ |
676 |
|
$ |
— |
|
$ |
(656) |
|
$ |
20 |
|
|
Customer relationships |
|
15.9 |
Years |
|
|
10,450 |
|
|
(303) |
|
|
(9,526) |
|
|
621 |
|
|
Product certification |
|
7.2 |
Years |
|
|
10,954 |
|
|
(95) |
|
|
(6,259) |
|
|
4,600 |
|
|
Unpatented technology |
|
20.0 |
Years |
|
|
3,183 |
|
|
— |
|
|
(2,996) |
|
|
187 |
|
|
Licenses |
|
20.0 |
Years |
|
|
964 |
|
|
(119) |
|
|
(312) |
|
|
533 |
|
|
Total |
|
13.8 |
Years |
|
$ |
26,227 |
|
$ |
(517) |
|
$ |
(19,749) |
|
$ |
5,961 |
|
60
For the years ended December 31, 2016, 2015 and 2014, the Company recognized $1.8 million, $1.7 million, and $2.2 million, respectively, of amortization expense related to intangible assets. The Company estimates amortization expense to be recognized during the next five years as follows:
|
For the year ending December 31: |
|
|
|
|
|
2017 |
|
$ |
2,243 |
|
|
2018 |
|
|
2,250 |
|
|
2019 |
|
|
2,041 |
|
|
2020 |
|
|
1,953 |
|
|
2021 |
|
|
1,910 |
|
5. Fair Value Measurements
The following financial instrument assets (liabilities) are presented below at carrying amount, fair value, and classification within the fair value hierarchy (refer to Notes 6 and 8 for details relating to derivative instruments and borrowing arrangements). The only financial instruments measured at fair value on a recurring basis are derivative instruments and the acquisition earn-out liability:
|
|
|
Fair Value |
|
December 31, 2016 |
|
December 31, 2015 |
|
||||||||
|
|
|
Hierarchy |
|
Carrying |
|
Fair |
|
Carrying |
|
Fair |
|
||||
|
|
|
Level |
|
Amount |
|
Value |
|
Amount |
|
Value |
|
||||
|
|
|
|
|
|
|
|
|
|
|
|
|
|
|
|
|
|
Cash and cash equivalents |
|
1 |
|
$ |
37,984 |
|
$ |
37,984 |
|
$ |
53,629 |
|
$ |
53,629 |
|
|
Derivative assets |
|
2 |
|
|
1,168 |
|
|
1,168 |
|
|
468 |
|
|
468 |
|
|
Derivative liabilities |
|
2 |
|
|
(1,452) |
|
|
(1,452) |
|
|
(783) |
|
|
(783) |
|
|
Acquisition earn-out liability |
|
2 |
|
|
(125) |
|
|
(125) |
|
|
(163) |
|
|
(163) |
|
|
Long-term debt, including current portion |
|
2 |
|
|
(225,000) |
|
|
(225,000) |
|
|
(111,441) |
|
|
(111,441) |
|
Accounts receivable and accounts payable included in the consolidated balance sheets approximate fair value and are excluded from the table above. The fair value of cash and cash equivalents are based on quoted prices. The fair value of derivative assets and liabilities are measured based on inputs from market sources that aggregate data based upon market transactions. Fair value for the acquisition earn-out liability is based upon Level 2 inputs which are periodically re-evaluated for changes in future projections and the discount rate. This liability is recorded in accrued pension and other liabilities within the Company’s consolidated balance sheets. The Company’s debt bears interest based on market rates and, accordingly, the carrying value of this obligation approximates fair value.
6. Derivative Instruments
The Company uses foreign currency forward exchange contracts and foreign exchange option contracts to limit the exposure of exchange rate fluctuations on certain foreign currency receivables, payables, and other known and forecasted transactional exposures for periods consistent with the expected cash flow of the underlying transactions. Management’s policy for managing foreign currency risk is to use derivatives to hedge up to 75% of the value of the forecasted exposure. The foreign currency forward exchange and foreign exchange option contracts generally mature within eighteen months and are designed to limit exposure to exchange rate fluctuations.
The Company also uses natural gas forward contracts to limit the exposure to changes in natural gas prices. Management’s policy for managing natural gas exposure is to use derivatives to hedge up to 75% of the forecasted natural gas requirements that are not fixed. The natural gas forward contracts generally mature within twenty-four months.
61
The Company accounts for its derivative instruments under ASC 815 “Derivatives and Hedging.” Hedge effectiveness is measured on a quarterly basis and any portion of ineffectiveness as well as hedge components excluded from the assessment of effectiveness are recorded directly to current earnings, in other expense – net.
The fair value of outstanding derivative contracts in the consolidated balance sheets was as follows:
|
|
|
|
|
December 31 |
|
||||
|
Asset Derivatives |
|
Balance Sheet Locations |
|
2016 |
|
2015 |
|
||
|
Derivatives designated as hedging instruments: |
|
|
|
|
|
|
|
|
|
|
Foreign exchange contracts |
|
Other current assets |
|
$ |
670 |
|
$ |
411 |
|
|
Natural gas contracts |
|
Other current assets |
|
|
255 |
|
|
— |
|
|
Foreign exchange contracts |
|
Other assets |
|
|
179 |
|
|
6 |
|
|
Natural gas contracts |
|
Other assets |
|
|
43 |
|
|
— |
|
|
|
|
|
|
|
|
|
|
|
|
|
Derivatives not designated as hedging instruments: |
|
|
|
|
|
|
|
|
|
|
Foreign exchange contracts |
|
Other current assets |
|
|
21 |
|
|
51 |
|
|
Total asset derivatives |
|
|
|
$ |
1,168 |
|
$ |
468 |
|
|
|
|
|
|
December 31 |
|
||||
|
Liability Derivatives |
|
Balance Sheet Locations |
|
2016 |
|
2015 |
|
||
|
Derivatives designated as hedging instruments: |
|
|
|
|
|
|
|
|
|
|
Foreign exchange contracts |
|
Accounts payable and accrued liabilities |
|
$ |
30 |
|
$ |
13 |
|
|
Natural gas contracts |
|
Accounts payable and accrued liabilities |
|
|
— |
|
|
586 |
|
|
Foreign exchange contracts |
|
Accrued pension and other liabilities |
|
|
1 |
|
|
3 |
|
|
Natural gas contracts |
|
Accrued pension and other liabilities |
|
|
— |
|
|
89 |
|
|
|
|
|
|
|
|
|
|
|
|
|
Derivatives not designated as hedging instruments: |
|
|
|
|
|
|
|
|
|
|
Foreign exchange contracts |
|
Accounts payable and accrued liabilities |
|
|
1,421 |
|
|
92 |
|
|
Total liability derivatives |
|
|
|
$ |
1,452 |
|
$ |
783 |
|
The Company had the following outstanding derivative contracts that were entered into to hedge forecasted transactions:
|
|
|
December 31 |
|
|||||||
|
(in thousands except for mmbtu) |
|
2016 |
|
2015 |
|
2014 |
|
|||
|
Natural gas contracts (mmbtu) |
|
|
540,000 |
|
|
955,000 |
|
|
810,000 |
|
|
Foreign exchange contracts |
|
$ |
199,420 |
|
$ |
37,016 |
|
$ |
41,237 |
|
The Company’s hedging associated with foreign exchange contracts increased significantly as of December 31, 2016 as a result of an intercompany loan relating to the acquisition of the New Business. Related to these non-designated contracts, there was a net $4.4 million gain recognized for the year ended December 31, 2016, of which $5.7 million was realized. The net gain was offset by a foreign exchange unrealized transaction loss of $5.0 million. The amounts are recorded in earnings, in other expense – net.
The use of derivatives exposes the Company to the risk that a counterparty may default on a derivative contract. The Company enters into derivative financial instruments with high credit quality counterparties and diversifies its positions among such counterparties. The aggregate fair value of the Company’s derivative instruments in asset positions
62
represents the maximum loss that the Company would recognize at that date if all counterparties failed to perform as contracted. The Company has entered into various master netting arrangements with counterparties to facilitate settlement of gains and losses on these contracts. These arrangements may allow for netting of exposures in the event of default or termination of the counterparty agreement due to breach of contract. The Company does not net its derivative positions by counterparty for purposes of balance sheet presentation and disclosure.
|
|
|
December 31, 2016 |
|
December 31, 2015 |
|
||||||||
|
|
|
Fair Value |
|
Fair Value |
|
Fair Value |
|
Fair Value |
|
||||
|
|
|
of Assets |
|
of Liabilities |
|
of Assets |
|
of Liabilities |
|
||||
|
Gross derivative amounts recognized in the balance sheet |
|
$ |
1,168 |
|
$ |
1,452 |
|
$ |
468 |
|
$ |
783 |
|
|
Gross derivative amounts not offset in the balance sheet |
|
|
(52) |
|
|
(52) |
|
|
(67) |
|
|
(67) |
|
|
Net amount |
|
$ |
1,116 |
|
$ |
1,400 |
|
$ |
401 |
|
$ |
716 |
|
Derivatives in Cash Flow Hedging Relationships
For derivative instruments that are designated and qualify as cash flow hedges, the effective portion of the gain or loss on the derivative is reported as a component of other comprehensive income (loss) (OCI) and reclassified into earnings in the same period or periods during which the hedged transaction affects earnings. The location of the gain or (loss) reclassified into earnings (effective portion) for derivatives in cash flow hedging relationships is cost of products sold (excluding depreciation and amortization).
|
|
|
Amount of Gain or (Loss) Recognized |
|
|||||||
|
|
|
in OCI on Derivatives (Effective Portion) |
|
|||||||
|
|
|
Year Ended December 31 |
|
|||||||
|
|
|
2016 |
|
2015 |
|
2014 |
|
|||
|
Foreign exchange contracts |
|
$ |
399 |
|
$ |
647 |
|
$ |
2,095 |
|
|
Natural gas contracts |
|
|
835 |
|
|
(984) |
|
|
(782) |
|
|
Total |
|
$ |
1,234 |
|
$ |
(337) |
|
$ |
1,313 |
|
|
|
|
Amount of Gain or (Loss) Recognized from |
|
|||||||
|
|
|
Accumulated OCI into Earnings (Effective Portion) (1) |
|
|||||||
|
|
|
Year Ended December 31 |
|
|||||||
|
|
|
2016 |
|
2015 |
|
2014 |
|
|||
|
Foreign exchange contracts |
|
$ |
206 |
|
$ |
2,077 |
|
$ |
484 |
|
|
Natural gas contracts |
|
|
(339) |
|
|
(941) |
|
|
221 |
|
|
Total |
|
$ |
(133) |
|
$ |
1,136 |
|
$ |
705 |
|
|
(1) |
Assuming market rates remain constant with the rates as of December 31, 2016, a gain of $0.1 million is expected to be recognized in earnings over the next 12 months. |
During the years ended December 31, 2016, 2015, and 2014, there was no gain or (loss) recognized in earnings on derivatives related to the ineffective portion and the amount excluded from effectiveness testing, which would have been recorded in other expense – net.
Derivatives Not Designated as Hedging Instruments
The Company has also entered into certain derivatives to minimize its exposure of exchange rate fluctuations on certain foreign currency receivables, payables, and other known and forecasted transactional exposures. The Company has not
63
qualified these contracts for hedge accounting treatment and therefore, the fair value gains and losses on these contracts are recorded in earnings, in other expense – net as follows:
|
|
|
Amount of Gain or (Loss) Recognized |
|
|||||||
|
|
|
in Earnings on Derivatives |
|
|||||||
|
|
|
Year Ended December 31 |
|
|||||||
|
|
|
2016 |
|
2015 |
|
2014 |
|
|||
|
Foreign exchange contracts |
|
$ |
4,425 |
|
$ |
(1,042) |
|
$ |
(511) |
|
|
Total |
|
$ |
4,425 |
|
$ |
(1,042) |
|
$ |
(511) |
|
7. Product Warranties
The Company establishes a warranty reserve for equipment project sales and estimates the warranty accrual based on the history of warranty claims to total sales, adjusted for significant known claims in excess of established reserves.
Warranty terms are based on the negotiated equipment project contract and typically are either 18 months from shipment date or 12 months from project startup date. The change in the warranty reserve, which is included in accounts payable and accrued liabilities in the consolidated balance sheets, is as follows:
|
|
|
December 31 |
|
||||
|
|
|
2016 |
|
2015 |
|
||
|
Balance as of January 1 |
|
$ |
1,252 |
|
$ |
1,449 |
|
|
Payments and replacement product |
|
|
(1,495) |
|
|
(677) |
|
|
Additions to warranty reserve for warranties issued during the period |
|
|
1,647 |
|
|
485 |
|
|
Change in the warranty reserve for pre-existing warranties |
|
|
(2) |
|
|
(5) |
|
|
Balance as of December 31 |
|
$ |
1,402 |
|
$ |
1,252 |
|
8. Borrowing Arrangements
|
|
|
December 31 |
|
||||
|
|
|
2016 |
|
2015 |
|
||
|
U.S. credit agreement borrowings |
|
$ |
225,000 |
|
$ |
107,700 |
|
|
Japanese term loan borrowings |
|
|
— |
|
|
3,741 |
|
|
Total long-term debt |
|
$ |
225,000 |
|
$ |
111,441 |
|
|
Less current portion of long-term debt |
|
|
(5,000) |
|
|
(7,500) |
|
|
Net long-term debt |
|
$ |
220,000 |
|
$ |
103,941 |
|
U.S. Amended Credit Agreement
On October 4, 2016, the Company entered into the First Amended and Restated Credit Agreement (Amended Credit
Agreement) which amended the Company’s existing U.S. Credit Agreement (Credit Agreement) described below. The Amended Credit Agreement increases the Company’s total borrowing capacity to $400 million, comprised of a $300 million revolving credit facility (Amended Revolver) and a $100 million term loan facility (Term Loan). The Amended Credit Agreement extends the term of the Amended Revolver to October 4, 2021 and the maturity date of the Term Loan to October 4, 2023.
The Amended Revolver contains a $75 million sublimit for the issuance of letters of credit, and a $15 million sublimit for swing loans. The Company also has the option to increase the Amended Revolver by a maximum of $100 million with the consent of the Lenders. Availability under the Amended Credit Agreement is conditioned upon various customary conditions.
64
Upon entering into the Amended Credit Agreement, the Company incurred issuance costs of $0.8 million of which approximately $0.1 million were expensed and the remainder were deferred and are being amortized over the term of the Amended Revolver and Term Loan facilities. A quarterly nonrefundable commitment fee is payable by the Company based on the unused availability under the Amended Revolver and was equal to 0.23% as of December 31, 2016.
The interest rate on amounts owed under the Amended Revolver and Term Loan will be, at the Company’s option, either (i) a fluctuating Base Rate or (ii) an adjusted LIBOR rate plus in each case, an applicable margin based on the Company’s leverage ratio as set forth in the Amended Credit Agreement. The interest rate charged on amounts owed under swing loans will be either (i) a fluctuating Base Rate or (ii) such other interest rates as the lender and the Company may agree to from time to time. The interest rate per annum on outstanding borrowings ranged from 2.51% to 2.62% as of December 31, 2016.
The Company borrowed the full $100 million under the Term Loan on October 4, 2016 and repaid all amounts owed under the Credit Agreement. During the fourth quarter of 2016, the Company borrowed $160 million under the Amended Revolver to finance the acquisition of the New Business. Beginning January 1, 2017, the Company will be required to make quarterly repayments under the Term Loan equal to 1.25% of the outstanding balance until January 1, 2019, at which time the quarterly repayments will increase to 2.0% until the remaining balance is due on the October 4, 2023 maturity date. As a result, $5.0 million is shown as current portion of long-term debt within the consolidated balance sheet as of December 31, 2016.
Total outstanding borrowings and availability under the Amended Revolver as of December 31, 2016 were $125.0 million and $172.5 million respectively, after considering borrowings and outstanding letters of credit of $2.5 million. Total outstanding borrowings under the Term Loan were $100 million and there was no remaining availability as of December 31, 2016. Borrowings and repayments are presented on a gross basis within the Company’s consolidated statement of cash flows.
Certain domestic subsidiaries of the Company unconditionally guarantee all indebtedness and obligations related to borrowings under the Amended Credit Agreement. The Company’s obligations under the Amended Credit Agreement are unsecured.
The Amended Credit Agreement contains customary affirmative and negative covenants for credit facilities of this type. The Company is permitted to pay dividends so long as the sum of availability under the Amended Credit Agreement and the amount of U.S. cash on hand is at least $50.0 million, and debt is less than or equal to 2.75x earnings before interest, taxes, depreciation and amortization. In addition, the Amended Credit Agreement includes limitations on the Company and its subsidiaries with respect to indebtedness, additional liens, disposition of assets or subsidiaries, and transactions with affiliates. The Company must comply with certain financial covenants including a minimum interest coverage ratio and a maximum leverage ratio as defined within the Credit Agreement. The Company was in compliance with all such covenants as of December 31, 2016. The Credit Agreement also provides for customary events of default, including failure to pay principal or interest when due, breach of representations and warranties, certain insolvency or receivership events affecting the Company and its subsidiaries and a change in control of the Company. If an event of default occurs, the lenders would be under no further obligation to make loans or issue letters of credit. Upon the occurrence of certain events of default, all outstanding obligations of the Company automatically would become immediately due and payable, and other events of default would allow the agent to declare all or any portion of the outstanding obligations of the Company to be immediately due and payable.
In February 2017, an amendment was signed to the Amended Credit Agreement, which, among other things, removes the quarterly leverage ratio requirement for the Company to pay dividends to its stockholders and replaces it with an annual dividend dollar restriction of $14.0 million.
65
U.S. Credit Agreement
On November 6, 2013, the Company entered into the Credit Agreement which provided for a senior unsecured revolving credit facility (Revolver) in an amount up to $225.0 million. As a result of amendments, the expiration date of the Revolver was November 6, 2020. In April 2016, an amendment was signed to the Credit Agreement that increased the threshold for a “Permitted Acquisition.” Refer to Note 20 for further information. The Credit Agreement also provided for senior unsecured delayed draw term loans (Delayed Draw Term Loans) in an aggregate amount up to $75.0 million which were scheduled to expire on November 6, 2020. Beginning January 1, 2016, the Company began making quarterly repayments. As a result, as of December 31, 2015, $7.5 million was shown as current portion of long-term debt within the consolidated balance sheet.
Upon entering into the Credit Agreement, the Company incurred issuance costs of $0.8 million, which were deferred and were being amortized over the term of the Revolver and Delayed Draw Term Loan facilities. Upon termination of the Credit Agreement, approximately $0.2 million of these previously deferred issuance costs were written off, while the remainder continued to be deferred and amortized over the life of the Amended Revolver. A quarterly nonrefundable commitment fee was payable by the Company based on the unused availability under the Revolver and was equal to 0.15% as of December 31, 2015. The interest rate options under the Credit Agreement were the same as those under the Amended Credit Agreement described above. The interest rate per annum on outstanding borrowings ranged from 1.25% to 1.40% as of December 31, 2015.
Total outstanding borrowings and availability under the Revolver were $32.7 million and $189.9 million, respectively, as of December 31, 2015, after considering borrowings and outstanding letters of credit of $2.4 million. Total outstanding borrowings under the Delayed Draw Term Loans were $75.0 million as of December 31, 2015 and there was no remaining availability.
Certain domestic subsidiaries of the Company unconditionally guaranteed all indebtedness and obligations related to borrowings under the Credit Agreement. The Company’s obligations under the Credit Agreement were unsecured. The Credit Agreement contained customary affirmative and negative covenants for credit facilities of this type which were similar to the covenants currently in effect for the Amended Credit Agreement. The Company was in compliance with all such covenants as of December 31, 2015.
Japanese Credit Agreement
On March 24, 2016, Calgon Carbon Japan (CCJ) entered into a 2.0 billion Japanese Yen unsecured revolving loan facility agreement (Japanese Credit Agreement) which expires on March 24, 2019. The Japanese Credit Agreement replaced the Term Loan Agreement (Japanese Term Loan) and Working Capital Loan (Japanese Working Capital Loan) agreement that CCJ previously had in place which are described below. As of December 31, 2016, CCJ had no amounts outstanding under the Japanese Credit Agreement. Any outstanding borrowings would be shown as long-term debt within the consolidated balance sheets, and borrowings and repayments are presented on a gross basis within the Company’s consolidated statements of cash flows.
A quarterly nonrefundable commitment fee is payable by CCJ based on the unused availability under the Japanese Credit Agreement and is equal to 0.18%. Total availability under the Japanese Credit Agreement was 2.0 billion Japanese Yen, or $17.1 million as of December 31, 2016. The Japanese Credit Agreement bears interest based on the Tokyo Interbank Offered Rate of interest (TIBOR), plus an applicable margin based on the Company’s leverage ratio as defined in the U.S. Credit Agreement, which averaged 1.31% per annum as of December 31, 2016. The Company is jointly and severally liable as the guarantor of CCJ’s obligations under the Japanese Credit Agreement. CCJ may make voluntary prepayments of principal and interest after providing prior written notice and before the full amount then outstanding is due and payable on the March 24, 2019 expiration date.
66
Prior Japanese Loans
Prior to March 31, 2016, CCJ maintained a Japanese Term Loan and Japanese Working Capital Loan. These agreements were terminated on March 31, 2016, and replaced by the Japanese Credit Agreement described above. The Company was jointly and severally liable as the guarantor of CCJ’s obligations and the Company permitted CCJ to grant a security interest and continuing lien in certain of its assets, including inventory and accounts receivable, to secure its obligations under both loan agreements. The amount of the assets available to be pledged was in excess of the outstanding obligation as of December 31, 2015.
The Japanese Term Loan provided for a principal amount of 1.0 billion Japanese Yen and bore interest based on the Uncollateralized Overnight Call Rate plus an applicable margin which averaged 0.7% per annum as of December 31, 2015. As of December 31, 2015, CCJ had 450 million Japanese Yen or $3.7 million outstanding. The outstanding borrowings were shown as long-term debt within the consolidated balance sheets. Borrowings and repayments were presented on a gross basis within the Company’s consolidated statements of cash flows.
The Japanese Working Capital Loan provided for borrowings up to 1.5 billion Japanese Yen, and bore interest based on the Short-term Prime Rate. As of December 31, 2015, CCJ had no outstanding borrowings under this facility.
Chinese Credit Facility
The Company maintained an Uncommitted Revolving Loan Facility Letter (Facility Letter) which provided for an uncommitted line of credit totaling 5.0 million Renminbi (RMB) or $0.8 million. This Facility Letter was scheduled to expire on July 19, 2016, but was cancelled in April 2016. The Company was jointly and severally liable as the guarantor under the Facility Letter. There were no outstanding borrowings under this facility as of December 31, 2015.
Belgian Credit Facility
The Company maintains an unsecured Belgian credit facility totaling 2.0 million Euros. Bank guarantees of 1.2 million Euros and 0.9 million Euros were issued as of December 31, 2016 and 2015, respectively.
United Kingdom Credit Facility
The Company maintains a United Kingdom credit facility totaling 0.6 million British Pounds Sterling. Bank guarantees of 0.4 million British Pounds Sterling were issued as of December 31, 2016 and 2015, respectively.
Italian Credit Facility
The Company maintains an Italian credit facility totaling 2.9 million Euros. Bank guarantees of 1.7 million Euros were issued as of December 31, 2016. In addition, surety bonds totaling 1.0 million Euros were outstanding as of December 31, 2016.
Maturities of Debt
The Company intends to make principal payments on debt outstanding as of December 31, 2016 of $5.0 million in 2017, $5.0 million in 2018, $8.0 million in 2019, $8.0 million in 2020, and $133.0 million in 2021.
Interest Expense
The Company’s interest expense for the years ended December 31, 2016, 2015, and 2014 totaled $2.4 million, $0.8 million, and $0.3 million, respectively. These amounts are net of interest costs capitalized of $0.3 million, $0.4 million, and $0.6 million for the years ended December 31, 2016, 2015, and 2014, respectively.
67
9. Employee Benefit Plans
The Company sponsors defined benefit pension plans covering certain union and non-union employees in the U.S. and Europe. As of December 31, 2016, all of the U.S. plans are closed to new hires. In addition, future benefit accruals are frozen for a number of the plans. The Company uses a measurement date of December 31 for all of its pension plans.
During 2016, the Company offered certain eligible terminated vested participants in the U.S. pension plans the opportunity to elect a lump sum payment of their respective pension benefits. As a result of these elections, and significant lump sum payouts in the European plans, the Company paid benefits of $5.2 million, and incurred a settlement charge of $1.5 million in 2016. In 2015, the Company incurred settlement charges in both the U.S. and European plans that totaled $0.8 million as a result of employee retirements, and paid $3.8 million from plan assets. In 2014, the Company offered certain eligible terminated vested participants in the U.S. pension plans the opportunity to elect a lump sum payment of their respective pension benefits, and as a result, incurred a settlement charge of $1.0 million and paid benefits of $4.4 million. As a result of the acquisition of the New Business, the projected benefit obligation of the European plans increased $3.9 million in 2016.
In 2014, the Society of Actuaries released a new mortality table – RP-2014, and a new projection scale – MP-2014. The Company adopted the new RP-2014 mortality table and a modified version of the new MP-2014 projection scale for the U.S. plans as of December 31, 2014. The Company has continued to use the same mortality tables and the modified version of the projection scale in 2015 and 2016. For the European defined benefit plans, the Company utilizes country-specific mortality tables and has used the same tables for the majority of its European plans since 2014. In 2016, the Company updated the mortality tables used for the United Kingdom plans which did not cause a significant increase to the projected benefit obligations for those plans.
68
The following table provides a reconciliation of changes in the plans’ benefit obligations and fair value of assets over the two-year period ended December 31, 2016 and the funded status as of December 31 for both years:
|
|
|
U.S. Plans |
|
European Plans |
|
||||||||
|
|
|
2016 |
|
2015 |
|
2016 |
|
2015 |
|
||||
|
Change in projected benefit obligations |
|
|
|
|
|
|
|
|
|
|
|
|
|
|
Projected benefit obligations as of January 1 |
|
$ |
108,938 |
|
$ |
117,319 |
|
$ |
39,201 |
|
$ |
42,886 |
|
|
Service cost |
|
|
957 |
|
|
1,136 |
|
|
395 |
|
|
288 |
|
|
Interest cost |
|
|
4,589 |
|
|
4,499 |
|
|
1,142 |
|
|
1,250 |
|
|
Employee contributions |
|
|
— |
|
|
— |
|
|
73 |
|
|
71 |
|
|
Actuarial loss (gain) |
|
|
4,293 |
|
|
(7,551) |
|
|
7,018 |
|
|
(64) |
|
|
Benefits paid |
|
|
(4,094) |
|
|
(4,022) |
|
|
(1,527) |
|
|
(1,091) |
|
|
Acquisition |
|
|
— |
|
|
— |
|
|
3,899 |
|
|
— |
|
|
Plan amendments |
|
|
— |
|
|
— |
|
|
(91) |
|
|
— |
|
|
Settlement |
|
|
(3,951) |
|
|
(2,443) |
|
|
(1,224) |
|
|
(1,383) |
|
|
Foreign currency exchange rate changes |
|
|
— |
|
|
— |
|
|
(5,391) |
|
|
(2,756) |
|
|
Projected benefit obligations as of December 31 |
|
$ |
110,732 |
|
$ |
108,938 |
|
$ |
43,495 |
|
$ |
39,201 |
|
|
|
|
|
|
|
|
|
|
|
|
|
|
|
|
|
Change in plan assets |
|
|
|
|
|
|
|
|
|
|
|
|
|
|
Fair value of plan assets as of January 1 |
|
$ |
89,382 |
|
$ |
98,395 |
|
$ |
29,351 |
|
$ |
31,025 |
|
|
Actual return on plan assets |
|
|
6,221 |
|
|
(3,830) |
|
|
4,212 |
|
|
646 |
|
|
Employer contributions |
|
|
682 |
|
|
1,282 |
|
|
1,744 |
|
|
1,774 |
|
|
Employee contributions |
|
|
— |
|
|
— |
|
|
73 |
|
|
71 |
|
|
Benefits paid |
|
|
(4,094) |
|
|
(4,022) |
|
|
(1,527) |
|
|
(1,091) |
|
|
Settlement |
|
|
(3,951) |
|
|
(2,443) |
|
|
(1,224) |
|
|
(1,383) |
|
|
Foreign currency exchange rate changes |
|
|
— |
|
|
— |
|
|
(4,693) |
|
|
(1,691) |
|
|
Fair value of plan assets as of December 31 |
|
$ |
88,240 |
|
$ |
89,382 |
|
$ |
27,936 |
|
$ |
29,351 |
|
|
Funded status as of December 31 |
|
$ |
(22,492) |
|
$ |
(19,556) |
|
$ |
(15,559) |
|
$ |
(9,850) |
|
|
|
|
|
|
|
|
|
|
|
|
|
|
|
|
|
Amounts recognized in the balance sheets consist of: |
|
|
|
|
|
|
|
|
|
|
|
|
|
|
Noncurrent asset — Other assets |
|
$ |
— |
|
$ |
273 |
|
$ |
141 |
|
$ |
1,258 |
|
|
Current liability — Payroll and benefits payable |
|
|
(82) |
|
|
(82) |
|
|
(493) |
|
|
(450) |
|
|
Noncurrent liability — Accrued pension and other liabilities |
|
|
(22,410) |
|
|
(19,747) |
|
|
(15,207) |
|
|
(10,658) |
|
|
Net amount recognized |
|
$ |
(22,492) |
|
$ |
(19,556) |
|
$ |
(15,559) |
|
$ |
(9,850) |
|
|
|
|
|
|
|
|
|
|
|
|
|
|
|
|
|
Amounts recognized in accumulated other comprehensive income consist of: |
|
|
|
|
|
|
|
|
|
|
|
|
|
|
Accumulated prior service cost |
|
$ |
— |
|
$ |
— |
|
$ |
(91) |
|
$ |
— |
|
|
Accumulated net actuarial loss |
|
|
38,694 |
|
|
38,741 |
|
|
10,549 |
|
|
8,039 |
|
|
Net amount recognized, before tax effect |
|
$ |
38,694 |
|
$ |
38,741 |
|
$ |
10,458 |
|
$ |
8,039 |
|
The assumptions used to determine benefit obligations are shown in the following table:
|
|
|
U.S. Plans |
|
|
European Plans |
|
||||
|
Weighted average actuarial assumptions as of December 31: |
|
2016 |
|
2015 |
|
|
2016 |
|
2015 |
|
|
Discount rate |
|
4.09 |
% |
4.38 |
% |
|
2.11 |
% |
3.15 |
% |
|
Rate of increase in compensation levels |
|
3.00 |
% |
3.00 |
% |
|
2.87 |
% |
3.37 |
% |
69
The following tables set forth the fair values of the Company’s pension plans assets as of December 31, 2016 and 2015:
|
|
|
U.S. Plans |
|
||||||||||||||||||||||
|
|
|
Fair Value Measurements |
|
Fair Value Measurements |
|
||||||||||||||||||||
|
|
|
as of December 31, 2016 |
|
as of December 31, 2015 |
|
||||||||||||||||||||
|
Asset Category |
|
Level 1 |
|
Level 2 |
|
Level 3 |
|
Total |
|
Level 1 |
|
Level 2 |
|
Level 3 |
|
Total |
|
||||||||
|
Cash and cash equivalents |
|
$ |
4,414 |
|
$ |
— |
|
$ |
— |
|
$ |
4,414 |
|
$ |
262 |
|
$ |
4,038 |
|
$ |
— |
|
$ |
4,300 |
|
|
Equity securities |
|
|
|
|
|
|
|
|
|
|
|
|
|
|
|
|
|
|
|
|
|
|
|
|
|
|
Large cap |
|
|
16,528 |
|
|
— |
|
|
— |
|
|
16,528 |
|
|
19,329 |
|
|
— |
|
|
— |
|
|
19,329 |
|
|
Small/mid cap |
|
|
9,584 |
|
|
— |
|
|
— |
|
|
9,584 |
|
|
9,598 |
|
|
— |
|
|
— |
|
|
9,598 |
|
|
Equities blend (a) |
|
|
— |
|
|
— |
|
|
— |
|
|
— |
|
|
257 |
|
|
— |
|
|
— |
|
|
257 |
|
|
International equity (b) |
|
|
6,377 |
|
|
— |
|
|
— |
|
|
6,377 |
|
|
5,607 |
|
|
— |
|
|
— |
|
|
5,607 |
|
|
Emerging markets (c) |
|
|
5,333 |
|
|
— |
|
|
— |
|
|
5,333 |
|
|
5,056 |
|
|
— |
|
|
— |
|
|
5,056 |
|
|
Fixed income securities |
|
|
|
|
|
|
|
|
|
|
|
|
|
|
|
|
|
|
|
|
|
|
|
|
|
|
Corporate bonds (d) |
|
|
— |
|
|
23,034 |
|
|
— |
|
|
23,034 |
|
|
— |
|
|
23,777 |
|
|
— |
|
|
23,777 |
|
|
Government bonds (e) |
|
|
561 |
|
|
13,785 |
|
|
— |
|
|
14,346 |
|
|
1,487 |
|
|
12,458 |
|
|
— |
|
|
13,945 |
|
|
International bonds (f) |
|
|
— |
|
|
3,966 |
|
|
— |
|
|
3,966 |
|
|
— |
|
|
3,531 |
|
|
— |
|
|
3,531 |
|
|
Commodities (g) |
|
|
2,051 |
|
|
— |
|
|
— |
|
|
2,051 |
|
|
1,768 |
|
|
— |
|
|
— |
|
|
1,768 |
|
|
Real estate (h) |
|
|
2,607 |
|
|
— |
|
|
— |
|
|
2,607 |
|
|
2,214 |
|
|
— |
|
|
— |
|
|
2,214 |
|
|
Total |
|
$ |
47,455 |
|
$ |
40,785 |
|
$ |
— |
|
$ |
88,240 |
|
$ |
45,578 |
|
$ |
43,804 |
|
$ |
— |
|
$ |
89,382 |
|
|
(a) |
This category invests in the common stock of primarily U.S. companies across the capitalization spectrum. |
|
(b) |
This category consists of international equity securities from Europe, Australia and Southeast Asia. |
|
(c) |
This category invests in global emerging markets outside the U.S. The strategy targets broad diversification across various economic sectors in emerging economies. |
|
(d) |
This category invests primarily in investment grade corporate securities. |
|
(e) |
This category includes securities and mutual funds which invest in a diversified portfolio of longer duration bonds. The funds typically invest primarily in U.S. investment grade securities. |
|
(f) |
This includes securities and mutual funds which invest in a diversified portfolio of longer duration foreign bonds. |
|
(g) |
This fund invests in assets of commodity linked derivative instruments and fixed income securities. |
|
(h) |
This fund primarily invests in equity related securities of real estate companies and other real estate securities. A significant portion of the total assets are typically in foreign securities. |
70
|
|
|
European Plans |
|
||||||||||||||||||||||
|
|
|
Fair Value Measurements |
|
Fair Value Measurements |
|
||||||||||||||||||||
|
|
|
as of December 31, 2016 |
|
as of December 31, 2015 |
|
||||||||||||||||||||
|
Asset Category |
|
Level 1 |
|
Level 2 |
|
Level 3 |
|
Total |
|
Level 1 |
|
Level 2 |
|
Level 3 |
|
Total |
|
||||||||
|
Cash and cash equivalents |
|
$ |
2,005 |
|
$ |
— |
|
$ |
— |
|
$ |
2,005 |
|
$ |
1,997 |
|
$ |
— |
|
$ |
— |
|
$ |
1,997 |
|
|
Equity securities |
|
|
|
|
|
|
|
|
|
|
|
|
|
|
|
|
|
|
|
|
|
|
|
|
|
|
M&G PP UK equity passive fund (a) |
|
|
950 |
|
|
— |
|
|
— |
|
|
950 |
|
|
— |
|
|
— |
|
|
— |
|
|
— |
|
|
M&G PP overseas equity passive fund (b) |
|
|
4,291 |
|
|
— |
|
|
— |
|
|
4,291 |
|
|
— |
|
|
— |
|
|
— |
|
|
— |
|
|
LGIM dynamic diversified fund (c) |
|
|
3,758 |
|
|
— |
|
|
— |
|
|
3,758 |
|
|
— |
|
|
— |
|
|
— |
|
|
— |
|
|
W. Blair dynamic diversified allocation fund (d) |
|
|
1,160 |
|
|
— |
|
|
— |
|
|
1,160 |
|
|
— |
|
|
— |
|
|
— |
|
|
— |
|
|
M&G PP discretionary fund (e) |
|
|
— |
|
|
— |
|
|
— |
|
|
— |
|
|
4,673 |
|
|
— |
|
|
— |
|
|
4,673 |
|
|
Global equity 60-40 index (f) |
|
|
— |
|
|
— |
|
|
— |
|
|
— |
|
|
5,412 |
|
|
— |
|
|
— |
|
|
5,412 |
|
|
Fixed income securities |
|
|
|
|
|
|
|
|
|
|
|
|
|
|
|
|
|
|
|
|
|
|
|
|
|
|
Delta Lloyd fixed income (g) |
|
|
— |
|
|
— |
|
|
1,158 |
|
|
1,158 |
|
|
— |
|
|
— |
|
|
1,864 |
|
|
1,864 |
|
|
Corporate bonds (h) |
|
|
428 |
|
|
— |
|
|
— |
|
|
428 |
|
|
5,022 |
|
|
— |
|
|
— |
|
|
5,022 |
|
|
Government bonds (i) |
|
|
10,582 |
|
|
— |
|
|
— |
|
|
10,582 |
|
|
6,913 |
|
|
— |
|
|
— |
|
|
6,913 |
|
|
Real estate (j) |
|
|
2,796 |
|
|
— |
|
|
— |
|
|
2,796 |
|
|
2,211 |
|
|
— |
|
|
— |
|
|
2,211 |
|
|
Insurance reserves (k) |
|
|
— |
|
|
— |
|
|
808 |
|
|
808 |
|
|
— |
|
|
— |
|
|
1,259 |
|
|
1,259 |
|
|
Total |
|
$ |
25,970 |
|
$ |
— |
|
$ |
1,966 |
|
$ |
27,936 |
|
$ |
26,228 |
|
$ |
— |
|
$ |
3,123 |
|
$ |
29,351 |
|
|
(a) |
This fund invests in the shares of UK companies. |
|
(b) |
This fund invests in overseas companies with fixed proportions representing each region’s economic importance. |
|
(c) |
This fund invests in a range of different asset classes, including equities, bonds, properties, commodities, listed infrastructure, private equity, and global real estate companies. |
|
(d) |
This fund utilizes a combination of traditional assets (equities, bonds, currencies, etc.), and investment strategies based on advanced derivative techniques. |
|
(e) |
This fund invests in a mix of UK and overseas equity shares, bonds, property and cash. |
|
(f) |
This index fund invests primarily in the UK Equity Index Fund and secondarily in overseas index funds. |
|
(g) |
This category invests in fixed income investments with Delta Lloyd. |
|
(h) |
This category invests primarily in investment grade corporate bonds, and other debt instruments, including higher yielding corporate bonds, government debt, convertible and preferred stocks, money market instruments and equities. |
|
(i) |
This category invests mainly in long-term gilts. |
|
(j) |
This category invests in commercial properties in the UK and is well diversified in the retail, office, and industrial sectors. |
|
(k) |
This category invests in individual insurance policies in the name of the individual plan members. |
The European plans’ Level 3 investments were valued using significant unobservable inputs. Inputs to these valuations include characteristics and quantitative data relating to the assets and reserves, investment and insurance policy cost,
71
position size, liquidity, current financial condition of the company/insurer and other relevant market data. The following table sets forth changes in the fair value measurements for the years ended December 31, 2016 and 2015:
|
|
|
Delta Lloyd |
|
Insurance |
|
||
|
|
|
Fixed Income |
|
Reserves |
|
||
|
Balance as of January 1, 2015 |
|
$ |
3,481 |
|
$ |
1,299 |
|
|
Purchases |
|
|
— |
|
|
139 |
|
|
Sales/Maturities |
|
|
(1,394) |
|
|
(50) |
|
|
Foreign currency translation |
|
|
(223) |
|
|
(129) |
|
|
Balance as of December 31, 2015 |
|
$ |
1,864 |
|
$ |
1,259 |
|
|
Purchases |
|
|
— |
|
|
101 |
|
|
Sales/Maturities |
|
|
(668) |
|
|
(525) |
|
|
Foreign currency translation |
|
|
(38) |
|
|
(27) |
|
|
Balance as of December 31, 2016 |
|
$ |
1,158 |
|
$ |
808 |
|
The following table provides information on the plans’ projected benefit obligations, accumulated benefit obligations, and the fair value of plan assets:
|
|
|
U.S. Plans |
|
European Plans |
|
||||||||
|
|
|
December 31 |
|
December 31 |
|
||||||||
|
|
|
2016 |
|
2015 |
|
2016 |
|
2015 |
|
||||
|
The projected benefit obligation and accumulated benefit obligation for all defined benefit plans was as follows: |
|
|
|
|
|
|
|
|
|
|
|
|
|
|
Projected benefit obligation |
|
$ |
110,732 |
|
$ |
108,938 |
|
$ |
43,495 |
|
$ |
39,201 |
|
|
Accumulated benefit obligation |
|
|
107,037 |
|
|
105,550 |
|
|
40,886 |
|
|
37,133 |
|
|
Fair value of plan assets |
|
|
88,240 |
|
|
89,382 |
|
|
27,936 |
|
|
29,351 |
|
|
|
|
|
|
|
|
|
|
|
|
|
|
|
|
|
The aggregate projected benefit obligation and fair value of plan assets for plans with projected benefit obligations in excess of plan assets was as follows: |
|
|
|
|
|
|
|
|
|
|
|
|
|
|
Projected benefit obligation |
|
$ |
110,732 |
|
$ |
99,920 |
|
$ |
31,570 |
|
$ |
28,150 |
|
|
Fair value of plan assets |
|
|
88,240 |
|
|
80,091 |
|
|
15,872 |
|
|
17,042 |
|
|
|
|
|
|
|
|
|
|
|
|
|
|
|
|
|
The aggregate accumulated benefit obligation and fair value of plan assets for plans with accumulated benefit obligations in excess of plan assets was as follows: |
|
|
|
|
|
|
|
|
|
|
|
|
|
|
Accumulated benefit obligation |
|
$ |
107,037 |
|
$ |
96,532 |
|
$ |
28,962 |
|
$ |
26,083 |
|
|
Fair value of plan assets |
|
|
88,240 |
|
|
80,091 |
|
|
15,872 |
|
|
17,042 |
|
72
Information about the expected cash flows by year for the pension plans follows:
|
|
|
U.S. Plans |
|
|
European Plans |
|
||
|
Employer contributions |
|
|
|
|
|
|
|
|
|
2017 |
|
$ |
2,885 |
|
|
$ |
1,689 |
|
|
Benefit payments |
|
|
|
|
|
|
|
|
|
2017 |
|
$ |
6,358 |
|
|
$ |
1,251 |
|
|
2018 |
|
|
6,144 |
|
|
|
1,495 |
|
|
2019 |
|
|
6,451 |
|
|
|
1,159 |
|
|
2020 |
|
|
6,841 |
|
|
|
1,294 |
|
|
2021 |
|
|
6,703 |
|
|
|
1,249 |
|
|
2022 - 2026 |
|
|
36,536 |
|
|
|
8,817 |
|
For the European plans, the total benefit payments include both the Company’s share of the benefit cost and the participants’ share of the cost, which is funded by participant contributions to the plans.
|
|
|
U.S. Plans |
|
European Plans |
|
||||||||||||||
|
|
|
Year Ended December 31 |
|
Year Ended December 31 |
|
||||||||||||||
|
|
|
2016 |
|
2015 |
|
2014 |
|
2016 |
|
2015 |
|
2014 |
|
||||||
|
Net periodic pension cost |
|
|
|
|
|
|
|
|
|
|
|
|
|
|
|
|
|
|
|
|
Service cost |
|
$ |
957 |
|
$ |
1,136 |
|
$ |
895 |
|
$ |
395 |
|
$ |
288 |
|
$ |
342 |
|
|
Interest cost |
|
|
4,589 |
|
|
4,499 |
|
|
4,815 |
|
|
1,142 |
|
|
1,250 |
|
|
1,653 |
|
|
Expected return on assets |
|
|
(6,040) |
|
|
(7,070) |
|
|
(7,541) |
|
|
(1,416) |
|
|
(1,705) |
|
|
(1,549) |
|
|
Amortization of prior service cost |
|
|
— |
|
|
15 |
|
|
74 |
|
|
— |
|
|
— |
|
|
— |
|
|
Net actuarial loss amortization |
|
|
3,010 |
|
|
2,606 |
|
|
877 |
|
|
229 |
|
|
219 |
|
|
245 |
|
|
Settlement |
|
|
1,149 |
|
|
607 |
|
|
1,025 |
|
|
361 |
|
|
199 |
|
|
— |
|
|
Net periodic pension cost |
|
$ |
3,665 |
|
$ |
1,793 |
|
$ |
145 |
|
$ |
711 |
|
$ |
251 |
|
$ |
691 |
|
|
|
|
U.S. Plans |
|
European Plans |
|
||||||||||||||
|
|
|
Year Ended December 31 |
|
Year Ended December 31 |
|
||||||||||||||
|
|
|
2016 |
|
2015 |
|
2014 |
|
2016 |
|
2015 |
|
2014 |
|
||||||
|
Amounts recognized in |
|
|
|
|
|
|
|
|
|
|
|
|
|
|
|
|
|
|
|
|
Current year actuarial loss |
|
$ |
(4,112) |
|
$ |
(3,348) |
|
$ |
(19,756) |
|
$ |
(4,222) |
|
$ |
(984) |
|
$ |
(2,117) |
|
|
Amortization of actuarial loss |
|
|
3,010 |
|
|
2,606 |
|
|
877 |
|
|
229 |
|
|
219 |
|
|
245 |
|
|
Current year prior service credit |
|
|
— |
|
|
— |
|
|
— |
|
|
91 |
|
|
— |
|
|
— |
|
|
Amortization of prior service cost |
|
|
— |
|
|
15 |
|
|
74 |
|
|
— |
|
|
— |
|
|
— |
|
|
Settlement |
|
|
1,149 |
|
|
607 |
|
|
1,025 |
|
|
361 |
|
|
199 |
|
|
— |
|
|
Foreign currency exchange |
|
|
— |
|
|
— |
|
|
— |
|
|
1,122 |
|
|
603 |
|
|
818 |
|
|
Total recognized in other comprehensive income (loss) |
|
$ |
47 |
|
$ |
(120) |
|
$ |
(17,780) |
|
$ |
(2,419) |
|
$ |
37 |
|
$ |
(1,054) |
|
|
Total recognized in net periodic pension cost and other comprehensive income (loss) |
|
$ |
(3,618) |
|
$ |
(1,913) |
|
$ |
(17,925) |
|
$ |
(3,130) |
|
$ |
(214) |
|
$ |
(1,745) |
|
73
|
|
|
U.S. Plans |
|
European Plans |
|
||
|
|
|
2017 |
|
2017 |
|
||
|
Amounts expected to be recognized in net periodic pension cost |
|
|
|
|
|
|
|
|
Prior service credit |
|
$ |
— |
|
$ |
(9) |
|
|
Net actuarial loss |
|
|
2,984 |
|
|
424 |
|
|
Total as of December 31 |
|
$ |
2,984 |
|
$ |
415 |
|
The assumptions used in the measurement of net periodic pension cost are shown in the following table:
|
|
|
U.S. Plans |
|
European Plans |
||||||||||
|
|
|
December 31 |
|
December 31 |
||||||||||
|
|
|
2016 |
|
2015 |
|
2014 |
|
|
2016 |
|
2015 |
|
2014 |
|
|
Weighted average actuarial assumptions |
|
|
|
|
|
|
|
|
|
|
|
|
|
|
|
Discount rate |
|
4.38 |
% |
4.01 |
% |
4.88 |
% |
|
2.97 |
% |
3.00 |
% |
3.92 |
% |
|
Expected annual return on plan assets |
|
7.00 |
% |
7.50 |
% |
7.75 |
% |
|
5.28 |
% |
5.54 |
% |
5.23 |
% |
|
Rate of increase in compensation levels |
|
3.00 |
% |
3.00 |
% |
3.50 |
% |
|
3.07 |
% |
3.38 |
% |
3.50 |
% |
The discount rates that the Company utilizes to determine pension obligations for its U.S. plans are based on a review of long-term corporate bonds that receive one of the two highest ratings given by a recognized rating agency.
The expected rate of return on plan assets was determined by the Company based on a review of asset class return expectations, as well as long-term inflation assumptions. Projected returns are based on broad equity and bond indices that the Company uses to benchmark its actual asset portfolio performance. The Company also considered historical returns on asset classes and investment mix. The expected long-term return on the U.S. plans’ assets is based on an asset allocation assumption of approximately 40%-50% equity securities, 45%-55% fixed income securities, and 5% with other investments. The expected long-term return on the European plans’ assets is based on its targeted portfolio mix of approximately 20%-30% equity securities, 55%-65% fixed income securities and 10%-20% other investments. The Company also takes into account the effect on its projected returns from any reasonably likely changes in its asset portfolio when applicable. The Company’s investment strategy is to earn the highest possible long-term total rate of return while minimizing the associated risk to ensure the preservation of the plan assets for the provision of benefits to participants and their beneficiaries. This is accomplished by managing a diversified portfolio of fund styles, asset types, risk characteristics and investment holdings.
Multi-Employer Pension Plan
In addition to the aforementioned European plans, the Company participates in a multi-employer pension plan in Europe. This multi-employer plan almost entirely relates to former employees of operations it has divested. Benefits are distributed by the multi-employer plan. As of both December 31, 2016 and 2015, the Company had a $0.9 million liability recorded as a component of payroll and benefits payable within its consolidated balance sheets. Refer to Note 16 for further information related to this multi-employer plan.
Defined Contribution Plans
The Company sponsors a defined contribution plan for certain U.S. employees. The plan allows for employee contributions, and the Company can make fixed, matching and discretionary contributions to the plan on behalf of its employees. The Company also makes contributions to the USW 401(k) Plan for certain eligible employees. Total expenses related to the defined contribution plans were $3.8 million, $3.1 million, and $2.8 million for the years ended December 31, 2016, 2015, and 2014, respectively.
74
10. Stock Compensation Plans
In 2008, the Company adopted an equity incentive plan for eligible employees, service providers, and non-employee directors of the Company and its subsidiaries. In 2014, the Company amended and restated the 2008 Equity Incentive Plan to increase the aggregate number of shares available for issuance from 2,000,000 to 5,000,000, and to extend the term for a period of ten years. The plan includes a 1,500,000 share fixed sub-limit for the granting of incentive stock options. The awards may be stock options, restricted stock units, performance units or other stock-based awards. Stock options may be non-statutory or incentive. The exercise price for options and stock appreciation rights shall not be less than the fair market value on the date of grant, except if an incentive stock option is granted to a “10% employee,” as defined by the plan, then the option price may not be less than 110% of such fair market value. Options and stock appreciation rights may be exercisable commencing with the grant date, and are no longer exercisable after the expiration of seven or ten years from the grant date.
The former Employee Stock Option Plan and the Non-Employee Directors’ Stock Option Plan (Prior Plans) were terminated and superseded by the 2008 Equity Incentive Plan. The Prior Plans both had stock-based awards outstanding as of December 31, 2016 and 2015. The Prior Plans granted stock options and restricted stock to officers, directors and other key employees of the Company. The stock options were granted at the fair market value on the grant date, became exercisable no less than six months after granted, and, in general, expire ten years after the date of grant.
Stock Options
The following tables show a summary of the status and activity of stock options for the year ended December 31, 2016:
|
|
|
|
|
|
|
|
Weighted- |
|
|
|
|
|
|
|
|
|
Weighted- |
|
Average |
|
|
|
|
|
|
|
|
|
|
Average |
|
Remaining |
|
|
|
|
|
|
|
|
|
|
Exercise Price |
|
Contractual Term |
|
Aggregate |
|
||
|
Employee stock options: |
|
Shares |
|
(per share) |
|
(in years) |
|
Intrinsic Value |
|
||
|
Outstanding as of January 1, 2016 |
|
1,252,136 |
|
$ |
19.08 |
|
5.01 |
|
$ |
645 |
|
|
Granted |
|
508,999 |
|
|
14.06 |
|
|
|
|
|
|
|
Exercised |
|
(13,574) |
|
|
9.10 |
|
|
|
|
|
|
|
Forfeited |
|
(17,907) |
|
|
17.91 |
|
|
|
|
|
|
|
Expired |
|
(62,852) |
|
|
18.33 |
|
|
|
|
|
|
|
Outstanding as of December 31, 2016 |
|
1,666,802 |
|
$ |
17.67 |
|
4.69 |
|
$ |
1,993 |
|
|
Vested and expected to vest as of December 31, 2016 |
|
1,666,802 |
|
$ |
17.67 |
|
4.69 |
|
$ |
1,993 |
|
|
Exercisable as of December 31, 2016 |
|
974,977 |
|
$ |
18.87 |
|
3.85 |
|
$ |
476 |
|
|
|
|
|
|
|
|
|
Weighted- |
|
|
|
|
|
|
|
|
|
Weighted- |
|
Average |
|
|
|
|
|
|
|
|
|
|
Average |
|
Remaining |
|
|
|
|
|
|
|
|
|
|
Exercise Price |
|
Contractual Term |
|
Aggregate |
|
||
|
Non-employee director stock options: |
|
Shares |
|
(per share) |
|
(in years) |
|
Intrinsic Value |
|
||
|
Outstanding as of January 1, 2016 |
|
39,885 |
|
$ |
6.99 |
|
0.81 |
|
$ |
379 |
|
|
Granted |
|
— |
|
|
— |
|
|
|
|
|
|
|
Exercised |
|
(22,320) |
|
|
5.90 |
|
|
|
|
|
|
|
Forfeited |
|
— |
|
|
— |
|
|
|
|
|
|
|
Expired |
|
— |
|
|
— |
|
|
|
|
|
|
|
Outstanding as of December 31, 2016 |
|
17,565 |
|
$ |
8.37 |
|
0.42 |
|
$ |
154 |
|
|
Vested as of December 31, 2016 |
|
17,565 |
|
$ |
8.37 |
|
0.42 |
|
$ |
154 |
|
|
Exercisable as of December 31, 2016 |
|
17,565 |
|
$ |
8.37 |
|
0.42 |
|
$ |
154 |
|
75
The following assumptions were used to calculate the fair values of employee stock option grants in each year:
|
|
|
Year Ended December 31 |
|
|||||||
|
|
|
2016 |
|
2015 |
|
2014 |
|
|||
|
Weighted-average grant date fair value per stock option |
|
$ |
3.11 |
|
$ |
3.30 |
|
$ |
4.48 |
|
|
Expected dividend yield |
|
|
1.10 |
% |
|
0.96 |
% |
|
0.00 |
% |
|
Expected volatility |
|
|
29 |
% |
|
19 |
% |
|
21 - 22 |
% |
|
Risk-free interest rates |
|
|
1.04 |
% |
|
1.48 |
% |
|
1.51 - 1.73 |
% |
|
Expected lives of options |
|
|
4 |
years |
|
4 |
years |
|
4 |
years |
The expected dividend yield is based on the latest annualized dividend rate and the current market price of the underlying common stock at the date of grant. The expected volatility is based on the historical volatility of the Company’s stock and the implied volatility calculated from traded options on the Company’s stock. The risk-free interest rates are based on the U.S. Treasury strip rate for the expected life of the option. For the 2011 through 2016 grants of stock options, the Company used the simplified method for determining the expected life. This method was used since the Company granted stock options to a different population of its employees, and decreased the term from 10 to 7 years. As a result of these changes, the Company does not believe that the historical stock option exercise data provides a reasonable basis upon which to estimate the expected life for the 2011 through 2016 grants.
The total grant date fair value of options vested during the years ended December 31, 2016, 2015, and 2014 was $3.75 per share, $4.49 per share, and $4.80 per share, or $1.5 million, $1.5 million, and $1.3 million, respectively.
During the years ended December 31, 2016, 2015 and 2014, the total intrinsic value of stock options exercised (i.e., the difference between the market price at exercise and the price paid by the employee or non-employee directors to exercise the option) was $0.2 million, $0.4 million, and $1.0 million, respectively. The total amount of cash received from the exercise of options was $0.3 million, $1.1 million, and $2.2 million, for the years ended December 31, 2016, 2015, and 2014, respectively.
Restricted and Performance Based Stock Awards
The grant date fair value of time vested restricted stock awards is the market price of the underlying common stock and is expensed over the vesting period of three years.
Performance stock awards, based on Return on Capital (ROC), vest subject to the satisfaction of this performance condition, at the end of a three-year performance period. The Company’s actual ROC for the performance period is compared to the target set, and the actual award payout is interpolated. The ROC award can vest at between zero and 200 percent of the target award. The grant date fair value of the ROC performance stock is the market price of the underlying common stock. The fair value is expensed on a straight-line basis over the performance period when it is probable that the performance condition will be achieved. No expense was recognized for these awards in 2016, 2015, or 2014 as it was not considered probable that the performance condition would be achieved.
Performance stock awards, based on Total Stockholder Return (TSR), vest subject to the satisfaction of this market condition, at the end of a three-year performance period. The Company’s actual TSR for the performance period is compared to the results of its peer companies for the same period with the Company’s relative position in the group determined by percentile rank. The actual award payout is determined by multiplying the target award by the performance factor percentage based upon the Company’s percentile ranking and can vest at between zero and 200 percent of the target award. The initial grant date fair value of the TSR performance stock is determined using a Monte Carlo simulation model. The grant date fair value is expensed on a straight-line basis over the three-year performance period.
76
The following table shows a summary of the status and activity of employee and non-employee directors’ non-vested stock awards for the year ended December 31, 2016:
|
|
|
|
|
Weighted- |
|
|
|
Weighted- |
|
|
|
Weighted- |
|
|||
|
|
|
|
|
Average |
|
ROC |
|
Average |
|
TSR |
|
Average |
|
|||
|
|
|
Restricted |
|
Grant Date |
|
Performance |
|
Grant Date |
|
Performance |
|
Grant Date |
|
|||
|
|
|
Stock |
|
Fair Value |
|
Stock |
|
Fair Value |
|
Stock |
|
Fair Value |
|
|||
|
|
|
Awards |
|
(per share) |
|
Awards (a) |
|
(per share) |
|
Awards (a) |
|
(per share) |
|
|||
|
Nonvested as of January 1, 2016 |
|
204,689 |
|
$ |
20.28 |
|
76,942 |
|
$ |
19.33 |
|
68,505 |
|
$ |
21.74 |
|
|
Granted |
|
159,938 |
|
|
14.65 |
|
35,719 |
|
|
13.76 |
|
50,880 |
|
|
9.66 |
|
|
Vested |
|
(103,152) |
|
|
19.56 |
|
— |
|
|
— |
|
(22,248) |
|
|
21.92 |
|
|
Forfeited |
|
(10,935) |
|
|
19.43 |
|
(32,713) |
|
|
17.56 |
|
(4,093) |
|
|
21.79 |
|
|
Nonvested as of December 31, 2016 |
|
250,540 |
|
$ |
17.02 |
|
79,948 |
|
$ |
17.56 |
|
93,044 |
|
$ |
15.09 |
|
|
(a) |
The number of shares shown for the performance stock awards is based on the target number of share awards. |
The weighted-average grant date fair value of restricted stock awards granted during the years ended December 31, 2016, 2015, and 2014 was $14.65 per share, $21.06 per share, and $20.83 per share or $2.3 million, $2.4 million, and $2.1 million, respectively. The total fair value of restricted stock awards vested during the years ended December 31, 2016, 2015, and 2014 was $2.0 million, $2.0 million, and $1.5 million, respectively.
The weighted-average grant date fair value of ROC performance stock awards granted during the years ended December 31, 2016, 2015, and 2014 was $13.76 per share, $20.74 per share, and $20.54 per share or $0.5 million, $0.5 million and $0.6 million, respectively. There were no ROC performance stock awards that vested during the years ended December 31, 2016, 2015, and 2014.
The weighted-average grant date fair value of TSR performance stock awards granted during the years ended December 31, 2016, 2015, and 2014, was $9.66 per share, $21.96 per share, and $21.39 per share, or $0.5 million, $0.5 million, and $0.6 million, respectively. The total fair value of TSR performance stock awards vested during the years ended December 31, 2016, 2015, and 2014 was $0.5 million, $0.2 million and $0.1 million, respectively.
The following significant assumptions were used for the TSR performance stock awards:
|
|
|
Year Ended December 31 |
|
||||
|
|
|
2016 |
|
2015 |
|
2014 |
|
|
Dividend yield |
|
1.10 |
% |
0.96 |
% |
0.00 |
% |
|
Expected volatility |
|
26.8 |
% |
25.9 |
% |
31.5 |
% |
|
Risk-free interest rates |
|
0.83 |
% |
0.93 |
% |
0.68 |
% |
|
Performance period |
|
3 |
years |
3 |
years |
3 |
years |
Total Stock-Based Compensation
Compensation expense related to all stock-based compensation totaled $4.1 million, $3.8 million, and $3.7 million for the years ended December 31, 2016, 2015, and 2014, respectively, and was recognized as a component of selling, general and administrative expense. The related income tax benefit was $1.3 million, $1.2 million, and $1.2 million for the years ended December 31, 2016, 2015, and 2014, respectively.
As of December 31, 2016, there was $4.1 million of total future compensation cost related to non-vested share-based compensation arrangements and the weighted-average period over which this cost is expected to be recognized is approximately 1.6 years.
77
11. Stockholders’ Equity
In February, 2015, the Company’s Board of Directors reinstated its common stock dividend program. Quarterly dividends of $0.05 per share were declared in each of the four quarters for the years ended December 31, 2016 and 2015. In addition, in February, 2017, a common stock dividend of $0.05 per share was declared. No common stock dividends were declared during the year ended December 31, 2014.
In December 2013, the Company’s Board of Directors approved a share repurchase program with a total of $150 million of purchases authorized. During 2014, the Company repurchased 1,930,841 shares at an average price of $20.57 per share. During 2015, the Company repurchased 2,002,444 shares at an average price of $17.45 per share. During 2016, the Company repurchased an additional 518,576 shares at an average price of $15.81 per share. As of December 2016, the Company had repurchased a total of 4,598,661 shares at an average price of $18.67 per share under the program. All of the above mentioned repurchases were funded from operating cash flows, cash on hand, and borrowings and the shares are held as treasury stock. Subsequent to these repurchases, the Company’s remaining authorization to repurchase its common stock is approximately $64.1 million. In April 2016, the Company suspended the activities of the share repurchase program.
As of December 31, 2013, the Company had repurchased approximately 2.9 million common stock shares under an accelerated share repurchase program. These repurchases and some employee stock plan activity were inadvertently reflected as a reduction of the total common stock shares issued at that time. The number of common stock shares issued as of December 31, 2013 has been increased to adjust for this. This has also resulted in an increase in the common stock balance reported on the Company’s financial statements as of December 31, 2013 of approximately $37 thousand, with a corresponding decrease to additional paid in capital. There is no impact to historically reported net income or earnings per share.
12. Accumulated Other Comprehensive Income (Loss)
The changes in the components of accumulated other comprehensive income (loss), net of tax, are as follows:
|
|
|
|
|
|
|
|
|
|
|
|
Total |
|
|
|
|
|
Foreign |
|
Defined |
|
|
|
|
Accumulated |
|
|||
|
|
|
Currency |
|
Benefit |
|
|
|
|
Other |
|
|||
|
|
|
Translation |
|
Pension Plan |
|
|
|
|
Comprehensive |
|
|||
|
|
|
Adjustments |
|
Adjustments |
|
Derivatives |
|
Income (Loss) |
|
||||
|
Balance as of December 31, 2013, net of tax |
|
$ |
16,793 |
|
$ |
(18,450) |
|
$ |
517 |
|
$ |
(1,140) |
|
|
Other comprehensive income (loss) before reclassifications |
|
|
(14,850) |
|
|
(12,669) |
|
|
789 |
|
|
(26,730) |
|
|
Amounts reclassified from other comprehensive income (loss) |
|
|
— |
|
|
761 |
|
|
(401) |
|
|
360 |
|
|
Net current period other comprehensive income (loss) |
|
|
(14,850) |
|
|
(11,908) |
|
|
388 |
|
|
(26,370) |
|
|
Balance as of December 31, 2014, net of tax |
|
|
1,943 |
|
|
(30,358) |
|
|
905 |
|
|
(27,510) |
|
|
Other comprehensive loss before reclassifications |
|
|
(13,013) |
|
|
(2,446) |
|
|
(199) |
|
|
(15,658) |
|
|
Amounts reclassified from other comprehensive income (loss) |
|
|
— |
|
|
2,330 |
|
|
(792) |
|
|
1,538 |
|
|
Net current period other comprehensive loss |
|
|
(13,013) |
|
|
(116) |
|
|
(991) |
|
|
(14,120) |
|
|
Balance as of December 31, 2015, net of tax |
|
|
(11,070) |
|
|
(30,474) |
|
|
(86) |
|
|
(41,630) |
|
|
Other comprehensive income (loss) before reclassifications |
|
|
(10,956) |
|
|
(4,879) |
|
|
809 |
|
|
(15,026) |
|
|
Amounts reclassified from other comprehensive income (loss) |
|
|
— |
|
|
2,980 |
|
|
77 |
|
|
3,057 |
|
|
Net current period other comprehensive income (loss) |
|
|
(10,956) |
|
|
(1,899) |
|
|
886 |
|
|
(11,969) |
|
|
Balance as of December 31, 2016, net of tax |
|
$ |
(22,026) |
|
$ |
(32,373) |
|
$ |
800 |
|
$ |
(53,599) |
|
78
|
|
|
Amount Reclassified from |
|
|
|
|||||||
|
|
|
Accumulated Other |
|
|
|
|||||||
|
Details about Accumulated |
|
Comprehensive Income (Loss) (1) |
|
Affected Line Item in the |
|
|||||||
|
Other Comprehensive |
|
Year Ended December 31 |
|
Statement where |
|
|||||||
|
Income (Loss) Components |
|
2016 |
|
2015 |
|
2014 |
|
Net Income is Presented |
|
|||
|
Defined Benefit Pension Plan Adjustments: |
|
|
|
|
|
|
|
|
|
|
|
|
|
Prior-service costs |
|
$ |
— |
|
$ |
(15) |
|
$ |
(74) |
|
(2) |
|
|
Actuarial losses |
|
|
(4,749) |
|
|
(3,631) |
|
|
(1,122) |
|
(2) |
|
|
|
|
|
(4,749) |
|
|
(3,646) |
|
|
(1,196) |
|
Total before tax |
|
|
|
|
|
1,769 |
|
|
1,316 |
|
|
435 |
|
Tax benefit |
|
|
|
|
|
(2,980) |
|
|
(2,330) |
|
|
(761) |
|
Net of tax |
|
|
Derivatives: |
|
|
|
|
|
|
|
|
|
|
|
|
|
Foreign exchange contracts |
|
|
206 |
|
|
2,077 |
|
|
484 |
|
Cost of products sold (excluding |
|
|
Natural gas contracts |
|
|
(339) |
|
|
(941) |
|
|
221 |
|
Cost of products sold (excluding |
|
|
|
|
|
(133) |
|
|
1,136 |
|
|
705 |
|
Total before tax |
|
|
|
|
|
56 |
|
|
(344) |
|
|
(304) |
|
Tax benefit (expense) |
|
|
|
|
|
(77) |
|
|
792 |
|
|
401 |
|
Net of tax |
|
|
Total reclassifications for the period |
|
$ |
(3,057) |
|
$ |
(1,538) |
|
$ |
(360) |
|
Net of tax |
|
|
(1) |
Amounts in parentheses indicate debits to income/loss. |
|
(2) |
These accumulated other comprehensive (loss) components are included in the computation of net periodic pension cost. |
Foreign currency translation adjustments exclude income tax for the earnings of the Company’s non-U.S. subsidiaries as management believes these earnings will be reinvested for an indefinite period of time. Determination of the amount of unrecognized deferred U.S. income tax liability on these unremitted earnings is not practicable.
The income tax benefit associated with ASC 715 “Compensation — Retirement Benefits” included in accumulated other comprehensive loss was $17.7 million, $17.1 million and $17.4 million as of December 31, 2016, 2015, and 2014, respectively. The income tax expense (benefit) associated with the Company’s derivatives included in accumulated other comprehensive income (loss) was $0.4 million, $(0.1) million, and $0.5 million as of December 31, 2016, 2015, and 2014, respectively.
The following table contains the components of income tax expense (benefit) included in other comprehensive income (loss):
|
|
|
Year Ended December 31 |
|
|||||||
|
|
|
2016 |
|
2015 |
|
2014 |
|
|||
|
Defined benefit pension plan |
|
$ |
(647) |
|
$ |
183 |
|
$ |
(7,202) |
|
|
Derivatives |
|
|
519 |
|
|
(521) |
|
|
184 |
|
79
13. Basic and Diluted Net Income Per Common Share
Computation of basic and diluted net income per common share is performed as follows:
|
|
|
Year Ended December 31 |
|
|||||||
|
(Dollars in thousands, except per share amounts) |
|
2016 |
|
2015 |
|
2014 |
|
|||
|
Net income available to common stockholders |
|
$ |
13,797 |
|
$ |
43,463 |
|
$ |
49,370 |
|
|
Weighted average shares outstanding |
|
|
|
|
|
|
|
|
|
|
|
Basic |
|
|
50,259 |
|
|
51,902 |
|
|
53,042 |
|
|
Effect of dilutive securities |
|
|
764 |
|
|
807 |
|
|
899 |
|
|
Diluted |
|
|
51,023 |
|
|
52,709 |
|
|
53,941 |
|
|
|
|
|
|
|
|
|
|
|
|
|
|
Basic net income per common share |
|
$ |
0.27 |
|
$ |
0.84 |
|
$ |
0.93 |
|
|
Diluted net income per common share |
|
$ |
0.27 |
|
$ |
0.82 |
|
$ |
0.92 |
|
For the years ended December 31, 2016, 2015 and 2014, there were 1.2 million, 0.8 million, and 0.3 million stock based compensation awards, respectively, that were excluded from the dilutive calculations as the effect would have been antidilutive.
14. Income Taxes
The components of the provision for income taxes were as follows:
|
|
|
Year Ended December 31 |
|
|||||||
|
|
|
2016 |
|
2015 |
|
2014 |
|
|||
|
Current |
|
|
|
|
|
|
|
|
|
|
|
Federal |
|
$ |
6,481 |
|
$ |
5,967 |
|
$ |
6,200 |
|
|
State and local |
|
|
523 |
|
|
577 |
|
|
1,587 |
|
|
Foreign |
|
|
4,664 |
|
|
6,597 |
|
|
6,138 |
|
|
|
|
|
11,668 |
|
|
13,141 |
|
|
13,925 |
|
|
Deferred |
|
|
|
|
|
|
|
|
|
|
|
Federal |
|
|
(1,795) |
|
|
5,471 |
|
|
7,506 |
|
|
State and local |
|
|
435 |
|
|
563 |
|
|
488 |
|
|
Foreign |
|
|
(4,032) |
|
|
748 |
|
|
1,219 |
|
|
|
|
|
(5,392) |
|
|
6,782 |
|
|
9,213 |
|
|
Provision for income taxes |
|
$ |
6,276 |
|
$ |
19,923 |
|
$ |
23,138 |
|
In the fourth quarter of 2015, the Company completed a U.S. research and development tax credit study for the prior years 2012 – 2014, and the Company recognized a benefit of $1.1 million related to the research and development credit. During 2014, the Internal Revenue Service (IRS) completed its joint committee review of the Company’s 2008 amended income tax return and the Company released net uncertain tax positions including related accrued interest and penalties of $1.4 million, all of which impacted the Company’s effective tax rate in 2014.
Income before income tax provision includes income generated by operations outside the U.S. of $9.6 million, $28.1 million, and $29.0 million for 2016, 2015, and 2014, respectively. No provision has been made for U.S. Federal, state, or additional foreign taxes related to approximately $77.8 million of undistributed earnings of foreign subsidiaries, which have been indefinitely reinvested. Determination of the amount of any such unrecognized deferred income tax liability on this temporary difference is not practicable as such determination involves material uncertainties about the potential extent and timing of any distributions, the availability and complexity of calculating foreign tax credits, and the potential extent and timing of any such distributions, including withholding taxes.
80
The differences between the U.S. federal statutory tax rate and the Company’s effective income tax rate are as follows:
|
|
|
Year Ended December 31 |
|
||||
|
|
|
2016 |
|
2015 |
|
2014 |
|
|
U.S. federal statutory rate |
|
35.0 |
% |
35.0 |
% |
35.0 |
% |
|
State income taxes, net of federal income tax benefit |
|
2.9 |
|
1.8 |
|
2.2 |
|
|
Tax rate differential on foreign income |
|
(6.5) |
|
(3.1) |
|
(2.9) |
|
|
Permanent tax differences |
|
3.2 |
|
(1.6) |
|
0.3 |
|
|
Valuation allowance |
|
0.8 |
|
0.3 |
|
— |
|
|
Settlement of uncertain tax positions |
|
— |
|
— |
|
(1.9) |
|
|
Tax statute expiration |
|
(0.3) |
|
(0.6) |
|
(0.6) |
|
|
Change in uncertain tax positions |
|
0.4 |
|
0.1 |
|
0.1 |
|
|
Deferred tax benefit for Section 987 |
|
(2.7) |
|
— |
|
— |
|
|
Other — net |
|
(1.5) |
|
(0.5) |
|
(0.3) |
|
|
Effective income tax rate |
|
31.3 |
% |
31.4 |
% |
31.9 |
% |
The Company has the following gross operating loss carryforwards and tax credit carryforwards as of December 31, 2016:
|
Type |
|
Amount |
|
Expiration Date |
|
|
|
Foreign tax credits |
|
$ |
183 |
|
2017 |
|
|
Capital loss carryforwards |
|
|
2,009 |
|
2018 |
|
|
State tax credits (1) |
|
|
2,184 |
|
2023 - 2027; unlimited |
|
|
Operating loss carryforwards — federal |
|
|
485 |
|
2029 |
|
|
Operating loss carryforwards — state (2) |
|
|
10,560 |
|
2018 - 2036 |
|
|
Operating loss carryforwards — foreign (3) |
|
|
16,768 |
|
2023 - unlimited |
|
|
(1) |
Of the total state tax credit carryforwards, approximately 50% begin to expire in 2023. |
|
(2) |
Of the total state operating loss-carryforwards, approximately 92% expire in 2021 or later. |
|
(3) |
Of the total foreign tax operating loss carryforwards, approximately 99% have no expiration. The increase from the prior year is primarily due to the New Business. |
The components of deferred taxes consist of the following:
|
|
|
December 31 |
|
||||
|
|
|
2016 |
|
2015 |
|
||
|
Deferred tax assets |
|
|
|
|
|
|
|
|
Net operating loss and credit carryforwards (1) (2) |
|
$ |
7,763 |
|
$ |
4,875 |
|
|
Accruals and other timing items |
|
|
15,824 |
|
|
11,159 |
|
|
Inventories |
|
|
11,181 |
|
|
15,403 |
|
|
Pensions |
|
|
12,186 |
|
|
11,303 |
|
|
Valuation allowance |
|
|
(2,510) |
|
|
(2,682) |
|
|
Total deferred tax assets |
|
|
44,444 |
|
|
40,058 |
|
|
Deferred tax liabilities |
|
|
|
|
|
|
|
|
Property, plant and equipment |
|
$ |
45,300 |
|
$ |
49,272 |
|
|
Goodwill and other intangible assets |
|
|
15,716 |
|
|
6,108 |
|
|
U.S. liability on foreign deferred taxes |
|
|
1,095 |
|
|
708 |
|
|
Total deferred tax liabilities |
|
|
62,111 |
|
|
56,088 |
|
|
Net deferred tax liability |
|
$ |
(17,667) |
|
$ |
(16,030) |
|
81
|
(1) |
Uncertain tax liabilities of approximately $0.2 million partially offset the net operating losses and credit carryforwards in both 2016 and 2015. |
|
(2) |
Net indirect benefits on uncertain tax liabilities of approximately $72 thousand and $61 thousand are included in the U.S. net operating loss and credit carryforwards in 2016 and 2015, respectively. |
A valuation allowance is established when it is more likely than not that a portion of the deferred tax assets will not be realized. The valuation allowance is adjusted based on the changing facts and circumstances, such as the expected expiration of an operating loss carryforward. The Company’s valuation allowance as of December 31, 2016 of $2.5 million pertained to an uncertainty related to the realization of foreign net operating loss carryforwards, domestic capital loss carryforwards, U.S. passive foreign tax credits, and state tax credits. The Company’s valuation allowance as of December 31, 2015 of $2.7 million pertained to an uncertainty related to the realization of foreign net operating loss carryforwards, U.S. foreign tax credits, domestic capital loss carryforwards, and state tax credits.
The Company has classified uncertain tax positions as non-current income tax liabilities unless the amount is expected to be paid within one year. The following is a reconciliation of the unrecognized income tax benefits:
|
|
|
Year Ended December 31 |
|
|||||||
|
|
|
2016 |
|
2015 |
|
2014 |
|
|||
|
Balance as of January 1 |
|
$ |
778 |
|
$ |
1,187 |
|
$ |
3,435 |
|
|
Gross increases for tax positions of current year |
|
|
108 |
|
|
78 |
|
|
75 |
|
|
Lapse of statute of limitations |
|
|
(101) |
|
|
(417) |
|
|
(500) |
|
|
Settlement of uncertain tax positions |
|
|
— |
|
|
(70) |
|
|
(1,823) |
|
|
Balance as of December 31 |
|
$ |
785 |
|
$ |
778 |
|
$ |
1,187 |
|
The Company recognizes accrued interest and penalties related to unrecognized tax benefits in income tax expense. In 2016, the Company accrued interest and penalties of approximately $23 thousand on prior year uncertain tax positions and reversed approximately $3 thousand of interest and penalties due to the expiration of the statute of limitations. In 2015, the Company accrued interest and penalties of approximately $33 thousand on current and prior year uncertain tax positions and reversed approximately $0.1 million of interest and penalties due to the expiration of the statute of limitations. As of both December 31, 2016 and 2015, the amount accrued for the payment of interest and penalties is approximately $0.3 million.
Total uncertain tax positions recorded as a component of accrued pension and other liabilities within its consolidated balance sheets were approximately $0.9 million as of December 31, 2016 and 2015. As of both December 31, 2016, and 2015, approximately $0.6 million of unrecognized tax benefits would reduce the Company’s effective tax rate if recognized. At this time, the Company believes that it is reasonably possible that approximately $0.2 million of the estimated unrecognized tax benefits as of December 31, 2016 will be recognized within the next twelve months based on the expiration of statutory review periods all of which will impact the effective tax rate.
82
As of December 31, 2016, the following tax years remain subject to examination for the major jurisdictions where the Company conducts business:
|
Jurisdiction |
|
Years |
|
|
United States |
|
2012 - 2016 |
|
|
Kentucky |
|
2012 - 2016 |
|
|
Pennsylvania |
|
2013 - 2016 |
|
|
Belgium |
|
2013 - 2016 |
|
|
China |
|
2013 - 2016 |
|
|
Germany |
|
2013 - 2016 |
|
|
United Kingdom |
|
2012 - 2016 |
|
|
Japan |
|
2011,2012,2016 |
|
|
Singapore |
|
2012 - 2016 |
|
|
France |
|
2016 |
|
|
Italy |
|
2012 - 2016 |
|
15. Commitments
The Company has entered into leases covering principally office, research and warehouse space, office equipment and vehicles. Future minimum rental payments required under all operating leases that have remaining non-cancelable lease terms in excess of one year are $8.2 million in 2017, $6.0 million in 2018, $4.0 million in 2019, $2.4 million in 2020, $2.2 million in 2021, and $18.5 million thereafter. Total rental expense on all operating leases was $8.0 million, $8.9 million, and $7.9 million for the years ended December 31, 2016, 2015, and 2014, respectively.
The Company has unconditional purchase obligations for raw materials and information systems and services under long-term supply contracts.
Future minimum purchase requirements under the terms of the aforementioned contracts are as follows:
|
|
|
Due in |
|
|
|
|
|||||||||||||
|
|
|
2017 |
|
2018 |
|
2019 |
|
2020 |
|
2021 |
|
Thereafter |
|
||||||
|
Raw and other materials |
|
$ |
19,190 |
|
$ |
21,049 |
|
$ |
781 |
|
$ |
781 |
|
$ |
781 |
|
$ |
— |
|
|
Information systems and services |
|
|
2,185 |
|
|
2,250 |
|
|
710 |
|
|
65 |
|
|
— |
|
|
— |
|
|
Total contractual cash obligations |
|
$ |
21,375 |
|
$ |
23,299 |
|
$ |
1,491 |
|
$ |
846 |
|
$ |
781 |
|
$ |
— |
|
Total payments made for purchases under these supply contracts were as follows:
|
|
|
December 31 |
|
|||||||
|
|
|
2016 |
|
2015 |
|
2014 |
|
|||
|
Raw and other materials |
|
$ |
21,178 |
|
$ |
27,832 |
|
$ |
38,096 |
|
|
Information systems and services |
|
|
1,384 |
|
|
1,871 |
|
|
2,163 |
|
|
Total payments |
|
$ |
22,562 |
|
$ |
29,703 |
|
$ |
40,259 |
|
16. Contingencies
Waterlink
In conjunction with the February 2004 purchase of substantially all of Waterlink Inc.’s (Waterlink) operating assets and the stock of Waterlink’s UK subsidiary, environmental studies were performed on Waterlink’s Columbus, Ohio property by environmental consulting firms that provided an identification and characterization of certain areas of contamination.
83
In addition, these firms identified alternative methods of remediating the property and prepared cost evaluations of the various alternatives. The Company concluded from the information in the studies that a loss at this property was probable and recorded the liability. As of both December 31, 2016 and 2015, the balance recorded was $0.3 million as a component of accrued pension and other liabilities, respectively. The Company has determined that additional site characterization work is needed to establish the next steps. No estimates regarding the timing or potential cost of these activities can be made until the additional site characterization work is finished. Planning for the additional characterization work has begun. Implementation timing will depend on acceptance by the Ohio Voluntary Action Program administrators. Liability estimates are based on an evaluation of, among other factors, currently available facts, existing technology, presently enacted laws and regulations, and the experience of experts in groundwater remediation. It is possible that a further change in the estimate of this obligation will occur as remediation progresses.
Carbon Imports
General Anti-Dumping Background: In March 2006, the Company and another U.S. producer of activated carbon (collectively, the “Petitioners”) requested that the U.S. Department of Commerce (Commerce Department) investigate unfair pricing of certain thermally activated carbon imported from the People’s Republic of China (China). In 2007, the Commerce Department found that imports of the subject merchandise from China were being unfairly priced (or “dumped”). Following a finding by the U.S. International Trade Commission (ITC) that the domestic industry was injured by unfairly traded imports of activated carbon from China, the Commerce Department issued an anti-dumping order imposing tariffs on Chinese imports to offset the amount of the unfair pricing. The Commerce Department published the antidumping order in the Federal Register in April 2007, and all imports from China remain subject to it. Importers of subject activated carbon from China are required to make cash deposits of estimated anti-dumping duties at the time the goods are entered into the U.S. customs territory. Final assessment of duties and duty deposits are subject to revision based on annual retrospective reviews conducted by the Commerce Department.
The Company is a domestic producer, exporter from China (through its wholly-owned subsidiary Calgon Carbon (Tianjin) Co., Ltd. (Calgon Carbon Tianjin)), and a U.S. importer of the activated carbon that is subject to the anti-dumping order. As such, the Company’s involvement in the Commerce Department’s proceedings is both as a domestic producer (a “petitioner”) and as a foreign exporter (a “respondent”).
The Company’s role as an importer, which has in the past (and may in the future) required it to pay anti-dumping duties, results in a contingent liability related to the final amount of tariffs that are ultimately assessed on the imported product following the Commerce Department’s annual review of relevant shipments and calculation of the anti-dumping duties due. As a result of proceedings before the Commerce Department that concluded in September 2016, the Company is currently required to post a duty of $0.616 per pound when importing activated carbon from Calgon Carbon Tianjin into the U.S. The impact of the tariffs to the Company’s financial results was not material for the years ended December 31, 2016, 2015, and 2014. However, the Company’s ultimate assessment rate and future cash deposit rate on such imports could change in the future, as a result of on-going proceedings before the Commerce Department.
In February 2013, the ITC determined that the anti-dumping order on certain thermally activated carbon from China should remain in effect for an additional five years. As a result, the Commerce Department has conducted annual reviews of sales made to the first unaffiliated U.S. customer, typically over the prior 12-month period. These annual reviews will continue through at least February 2018. In addition, the Commerce Department will continue to perform reviews from February 2018 to February 2019, dependent upon an affirmative outcome of the Second Sunset Review, which will be initiated in February 2018. These reviews can result in changes to the anti-dumping tariff rate (either increasing or reducing the rate) applicable to any foreign exporter. Revision of tariff rates has two effects. First, it will alter the actual amount of tariffs that U.S. Customs and Border Protection (Customs) will collect for the period reviewed, by either collecting additional duties, plus interest above those deposited with Customs by the U.S. importer at the time of entry or refunding a portion of the duties, plus interest deposited at the time of importation to reflect a decline in the margin of dumping. Second, the revised rate becomes the cash deposit rate applied to future entries, and can either increase or decrease the amount of duty deposits an importer will be required to post at the time of importation.
84
Periods of Review (POR) I, II, IV and V, related to the periods that ended on March 31, 2008, 2009, 2011 and 2012, respectively, are final and not subject to further review or appeal. A summary of the proceedings in the remaining PORs follows below.
Period of Review III: In October, 2011, the Commerce Department published the final results of its third annual administrative review, which covers imports that entered the U.S. between April 1, 2009 and March 31, 2010 (POR III). The Company’s ongoing duty deposit rate was adjusted to zero, and the Company recorded a receivable of $1.1 million reflecting expected refunds for duty deposits made during POR III. The Commerce Department continued to assign cooperative respondents involved in POR III a deposit rate of $0.127 per pound. The Commerce Department’s final results of POR III were appealed.
In January 2014, the Commerce Department filed its remand redetermination with the Court of International Trade (Court), continuing to calculate a zero duty for the Company during POR III. In addition, the Commerce Department revised its earlier determination and assigned a zero margin as a separate rate to several Chinese producers/exporters of steam activated carbon to the U.S. that were not subjected to an individual investigation. The Company contested this aspect of the Commerce Department’s redetermination. In November 2014, the Court affirmed the Commerce Department’s remand determination. Various parties appealed the decision to the U.S. Court of Appeals for the Federal Circuit (Court of Appeals), which later affirmed the Court’s decision with respect to several Chinese parties, finding that they should be assigned a zero margin. The Court of Appeals remanded the action to the Court, and a decision from the Court is expected in the first quarter of 2017.
Period of Review VI: In November 2014, the Commerce Department announced the final margins for its sixth administrative review (POR VI), which covers imports that entered the U.S. between April 1, 2012 and March 31, 2013. The Commerce Department calculated a margin of $0.018 per pound for both mandatory and separate rate respondents, including Calgon Carbon Tianjin, and $1.10 per pound for the China-wide rate. In December 2014, an appeal was commenced. The Commerce Department filed its redetermination with the Court in May 2016, and calculated revised margins. In November 2016, the Court sustained in part and remanded in part the Commerce Department’s redetermination. The Commerce Department filed its second redetermination with the Court in January 2017, calculating margins for mandatory respondents ranging from $0.082 per pound to $0.127 per pound and $0.100 per pound for separate rate respondents, including Calgon Carbon Tianjin. The Court’s decision should conclude all litigation regarding POR VI. The impact of the tariffs during this period is not expected to be material to the Company’s financial results.
Period of Review VII: The Commerce Department announced the final results for its seventh administrative review (POR VII) in October 2015, covering imports that entered the U.S. between April 1, 2013 and March 31, 2014. The Commerce Department calculated anti-dumping margins for the mandatory respondents it examined ranging from $0.00 per pound to $0.476 per pound, and it calculated an anti-dumping margin of $0.476 per pound for the separate rate respondents, including Calgon Carbon Tianjin. The impact of the tariffs to the Company’s financial results is not material. In October 2015, appeals were commenced challenging the final results. A decision from the Court is possible in the first quarter of 2017.
Period of Review VIII: In September 2016, the Commerce Department announce the final margins for its eighth administrative review (POR VIII), which covers imports that entered the U.S. between April 1, 2014 and March 31, 2015. The final anti-dumping margins for the mandatory respondents ranged from $0.009 per pound to $0.797 per pound, while the separate rate respondents, including Calgon Carbon Tianjin, were assigned $0.616 per pound. In October 2016, appeals were commenced challenging the final results. A decision from the Court is possible in late 2017 or early 2018.
Period of Review IX: In April 2016, the Commerce Department published a notice allowing parties to request a ninth annual administrative review (POR IX) of the anti-dumping duty order covering the period April 1, 2015 through March
85
31, 2016. The Commerce Department has selected mandatory respondents for review and a decision is likely in the fourth quarter of 2017.
Big Sandy Plant
In 2007, the Company received from the EPA Region 4 a report of a hazardous waste facility inspection performed by the EPA and the Kentucky Department of Environmental Protection (KYDEP) of the Company’s Big Sandy plant in Kentucky. Accompanying the report was a Notice of Violation (NOV) alleging multiple violations of the Federal Resource Conservation and Recovery Act (RCRA) and corresponding EPA and KYDEP hazardous waste regulations as well as the Clean Water Act (CWA).
The Company was required to conduct testing of the portion of stockpiled material dredged from onsite wastewater treatment lagoons that had not previously been tested in accordance with a pre-approved work plan and installed two ground water monitoring wells at the Company’s permitted solid waste landfill where some lagoon solids had previously been disposed. The landfill is considered a non-hazardous facility and regulated by the KYDEP. The testing of the stockpile material was completed and the results have been reviewed by the EPA. The Company received comments from the EPA including a request for a health and safety risk assessment similar to that which the Company performed on other materials from the lagoons. The Company has prepared this assessment and it has been submitted to the EPA. The stockpiled material was removed in 2015 and the Company will not be required to close or retrofit any of the wastewater treatment lagoons as RCRA hazardous waste management units and may continue to use them in their current manner. The Company is subject to daily stipulated penalties for any failure to sample the landfill wells in accordance with the EPA-approved protocols and schedules. As of December 31, 2016 and 2015, there is no liability recorded related to this issue.
Multi-Employer Pension Plan
The Company participates in a multi-employer plan in Europe which almost entirely relates to former employees of operations it has divested. Benefits are distributed by the multi-employer plan. In 2012 the Company learned that the multi-employer plan had previously elected to reduce benefits to entitled parties, and the local Labor Court had concluded that an employer was required to compensate its pensioners for the shortfall if benefits had been reduced by the plan. As a result, the Company accrued a liability for the past shortfall to its former employees, and the Company has had several claims from pensioners seeking compensation for the shortfall. In 2014 the Company also learned that certain pensioners are claiming that the employers should also pay a cost of living adjustment on the amounts paid by the multi-employer plan. In February 2015, the Court published an opinion ruling that employers may be required to pay a cost of living adjustment. As a result, the Company recorded an additional accrual of $0.4 million for the year ended December 31, 2014. As of both December 31, 2016 and 2015, the Company had a $0.9 million liability recorded as a component of payroll and benefits payable within its consolidated balance sheets for the past shortfall adjustments to its former employees. The Company cannot predict if future benefit payments to entitled parties to be made by the multi-employer plan will continue to be reduced.
Other
On February 21, 2017, the Japan Fair Trade Commission (the JFTC) informed the Company’s subsidiary, Calgon Carbon Japan (CCJ) that it is investigating CCJ along with several other manufacturers and distributors that participate in the activated carbon market in Japan over concerns of anti-competitive conduct. The JFTC is investigating whether manufacturers and sellers of activated carbon used in water purification plants, garbage incineration plants and other similar facilities in Japan have acted in concert with each other in violation of the Japan Anti-Monopoly Act. JFTC agents searched the offices of CCJ, reviewing and collecting contracts and other business records and interviewed certain CCJ employees. At this early stage of the investigation, it is difficult to predict the outcome of this matter or what remedies, if any, may be imposed by the JFTC. CCJ is cooperating with the JFTC as it conducts its investigation.
86
In addition to the matters described above, the Company is involved in various other legal proceedings, lawsuits and claims, including employment, product warranty and environmental matters of a nature considered normal to its business. It is the Company’s policy to accrue for amounts related to these legal matters when it is probable that a liability has been incurred and the loss amount is reasonably estimable. Management is currently unable to estimate the amount or range of reasonably possible losses, if any, resulting from such lawsuits and claims.
17. Supplemental Cash Flow Information
Cash paid for interest for the years ended December 31, 2016, 2015, and 2014 was $2.6 million, $1.1 million, and $0.7 million, respectively. Capitalized interest for the years ended December 31, 2016, 2015, and 2014 was $0.3 million, $0.4 million, and $0.6 million, respectively. Income taxes paid, net of refunds for the years ended December 31, 2016, 2015, and 2014 were $9.5 million, $13.9 million, and $17.7 million, respectively.
The Company has reflected $1.9 million, $(0.1) million, and $1.7 million of its capital expenditures as a non-cash increase (decrease) in accounts payable and accrued liabilities for the years ended December 31, 2016, 2015, and 2014, respectively.
18. Segment Information
The Company’s management has identified four reportable segments based on the product line and associated services. Those segments include Activated Carbon and Service, Equipment, Consumer, and Other. The Company’s chief operating decision maker (CODM), its chief executive officer, receives and reviews financial information in this format. The Activated Carbon and Service segment manufactures granular activated carbon for use in applications to remove organic compounds from liquids, gases, water, and air. This segment also consists of services related to activated carbon including reactivation of spent carbon and the leasing, monitoring, and maintenance of carbon fills at customer sites. The service portion of this segment also includes services related to the Company’s ion exchange technologies for treatment of groundwater and process streams. The Equipment segment provides solutions to customers’ air and water process problems through the design, fabrication, and operation of systems that utilize the Company’s enabling technologies: ballast water, ultraviolet light, advanced ion exchange separation, and carbon adsorption. The Consumer segment supplies activated carbon cloth for use in military, industrial, and medical applications. Other is exclusively comprised of the New Business for the two-month period subsequent to the 2016 acquisition. The New Business manufactures and markets granular and powdered wood-based activated carbon, coal-based activated carbon reactivation, diatomaceous earth and perlite filtration media for use in applications for decolorization, purification, decontamination, and filtration of liquids in various applications including food and beverage, industrial, fine chemicals and pharmaceuticals. Intersegment net sales are not material.
In conjunction with the acquisition of the New Business, management has been undertaking a planning process which includes reviewing how the Company will compile and report financial information for review by the Company’s CODM beginning January 1, 2017 to assess performance and allocate resources. Beginning in the first quarter of 2017, the Company is realigning its internal management reporting structure to incorporate the New Business into the existing business, and evaluating the need to reorganize its current reportable segments. The Company anticipates the realigned internal management reporting structure will result in three new reportable segments for review by the CODM. In subsequent periods, the Company will report using the new reportable segment structure and restate prior periods to conform with the change in reportable segments. As this process was not completed as of December 31, 2016, the results of operations of the New Business have been reported as Other.
87
The following segment information represents the results of operations:
|
|
|
Year Ended December 31 |
|
|||||||
|
|
|
2016 |
|
2015 |
|
2014 |
|
|||
|
Net sales |
|
|
|
|
|
|
|
|
|
|
|
Activated Carbon and Service |
|
$ |
454,565 |
|
$ |
486,548 |
|
$ |
498,212 |
|
|
Equipment |
|
|
38,864 |
|
|
39,293 |
|
|
45,319 |
|
|
Consumer |
|
|
8,695 |
|
|
9,163 |
|
|
11,572 |
|
|
Other |
|
|
12,122 |
|
|
— |
|
|
— |
|
|
Consolidated net sales |
|
$ |
514,246 |
|
$ |
535,004 |
|
$ |
555,103 |
|
|
|
|
|
|
|
|
|
|
|
|
|
|
Income (loss) from operations before restructuring |
|
|
|
|
|
|
|
|
|
|
|
Activated Carbon and Service |
|
$ |
36,893 |
|
$ |
67,583 |
|
$ |
78,114 |
|
|
Equipment |
|
|
(4,633) |
|
|
(4,210) |
|
|
(5,657) |
|
|
Consumer |
|
|
1,051 |
|
|
1,421 |
|
|
1,896 |
|
|
Other |
|
|
(8,789) |
|
|
— |
|
|
— |
|
|
|
|
|
24,522 |
|
|
64,794 |
|
|
74,353 |
|
|
Reconciling items: |
|
|
|
|
|
|
|
|
|
|
|
Restructuring income |
|
|
— |
|
|
— |
|
|
252 |
|
|
Interest income |
|
|
99 |
|
|
58 |
|
|
77 |
|
|
Interest expense |
|
|
(2,385) |
|
|
(773) |
|
|
(263) |
|
|
Other expense — net |
|
|
(2,163) |
|
|
(693) |
|
|
(1,911) |
|
|
Income before income tax provision |
|
$ |
20,073 |
|
$ |
63,386 |
|
$ |
72,508 |
|
|
|
|
Year Ended December 31 |
|
|||||||
|
|
|
2016 |
|
2015 |
|
2014 |
|
|||
|
Depreciation and amortization |
|
|
|
|
|
|
|
|
|
|
|
Activated Carbon and Service |
|
$ |
34,445 |
|
$ |
32,443 |
|
$ |
26,820 |
|
|
Equipment |
|
|
1,631 |
|
|
2,400 |
|
|
3,049 |
|
|
Consumer |
|
|
559 |
|
|
610 |
|
|
601 |
|
|
Other |
|
|
1,435 |
|
|
— |
|
|
— |
|
|
Depreciation and amortization |
|
$ |
38,070 |
|
$ |
35,453 |
|
$ |
30,470 |
|
|
|
|
|
|
|
|
|
|
|
|
|
|
Expenditures for long-lived assets |
|
|
|
|
|
|
|
|
|
|
|
Activated Carbon and Service |
|
$ |
30,641 |
|
$ |
57,559 |
|
$ |
60,470 |
|
|
Equipment |
|
|
2,317 |
|
|
4,266 |
|
|
2,947 |
|
|
Consumer |
|
|
156 |
|
|
403 |
|
|
495 |
|
|
Other |
|
|
680 |
|
|
— |
|
|
— |
|
|
Total expenditures (1) |
|
$ |
33,794 |
|
$ |
62,228 |
|
$ |
63,912 |
|
|
(1) |
Includes $4.0 million, $2.1 million and $2.2 million which are included in accounts payable and accrued liabilities at December 31, 2016, 2015 and 2014, respectively. |
88
|
|
|
December 31 |
|
|||||||
|
|
|
2016 |
|
2015 |
|
2014 |
|
|||
|
Total assets |
|
|
|
|
|
|
|
|
|
|
|
Activated Carbon and Service |
|
$ |
538,533 |
|
$ |
597,274 |
|
$ |
564,734 |
|
|
Equipment |
|
|
45,251 |
|
|
52,894 |
|
|
50,610 |
|
|
Consumer |
|
|
5,144 |
|
|
6,350 |
|
|
6,317 |
|
|
Other |
|
|
186,290 |
|
|
— |
|
|
— |
|
|
Total assets |
|
$ |
775,218 |
|
$ |
656,518 |
|
$ |
621,661 |
|
|
|
|
Year Ended December 31 |
|
|||||||
|
|
|
2016 |
|
2015 |
|
2014 |
|
|||
|
Net sales by product |
|
|
|
|
|
|
|
|
|
|
|
Carbon products |
|
$ |
426,305 |
|
$ |
460,251 |
|
$ |
474,222 |
|
|
Capital equipment |
|
|
34,349 |
|
|
35,114 |
|
|
41,238 |
|
|
Equipment leasing |
|
|
14,041 |
|
|
15,235 |
|
|
16,598 |
|
|
Carbon cloth products |
|
|
8,695 |
|
|
9,163 |
|
|
11,564 |
|
|
Spare parts |
|
|
4,515 |
|
|
4,179 |
|
|
4,081 |
|
|
Other services |
|
|
14,219 |
|
|
11,062 |
|
|
7,400 |
|
|
Other products (1) |
|
|
12,122 |
|
|
— |
|
|
— |
|
|
Total net sales |
|
$ |
514,246 |
|
$ |
535,004 |
|
$ |
555,103 |
|
|
(1) |
Includes wood-based activated carbon, reactivation, and mineral-based filtration media products of the New Business. |
Geographic Information
|
|
|
Year Ended December 31 |
|
|||||||
|
|
|
2016 |
|
2015 |
|
2014 |
|
|||
|
Net sales |
|
|
|
|
|
|
|
|
|
|
|
United States |
|
$ |
271,076 |
|
$ |
288,645 |
|
$ |
261,849 |
|
|
United Kingdom |
|
|
36,552 |
|
|
43,217 |
|
|
46,049 |
|
|
Japan |
|
|
35,243 |
|
|
35,753 |
|
|
45,261 |
|
|
France |
|
|
23,646 |
|
|
20,875 |
|
|
28,575 |
|
|
Germany |
|
|
21,416 |
|
|
17,804 |
|
|
20,656 |
|
|
China |
|
|
18,559 |
|
|
17,943 |
|
|
17,166 |
|
|
Canada |
|
|
13,858 |
|
|
17,065 |
|
|
21,910 |
|
|
South Korea |
|
|
10,231 |
|
|
12,218 |
|
|
18,692 |
|
|
Belgium |
|
|
9,373 |
|
|
10,383 |
|
|
11,166 |
|
|
Netherlands |
|
|
5,696 |
|
|
5,184 |
|
|
5,466 |
|
|
Italy |
|
|
5,206 |
|
|
2,432 |
|
|
2,215 |
|
|
Singapore |
|
|
4,126 |
|
|
9,923 |
|
|
6,418 |
|
|
Spain |
|
|
3,812 |
|
|
3,302 |
|
|
4,049 |
|
|
Mexico |
|
|
3,705 |
|
|
2,662 |
|
|
3,751 |
|
|
Denmark |
|
|
3,588 |
|
|
4,252 |
|
|
3,978 |
|
|
Other |
|
|
48,159 |
|
|
43,346 |
|
|
57,902 |
|
|
Total net sales (1) |
|
$ |
514,246 |
|
$ |
535,004 |
|
$ |
555,103 |
|
|
(1) |
Net sales are attributable to countries based on location of customer. |
89
|
|
|
December 31 |
|
|||||||
|
|
|
2016 |
|
2015 |
|
2014 |
|
|||
|
Property, plant and equipment, net |
|
|
|
|
|
|
|
|
|
|
|
United States |
|
$ |
225,105 |
|
$ |
228,057 |
|
$ |
205,429 |
|
|
France |
|
|
52,650 |
|
|
— |
|
|
— |
|
|
Belgium |
|
|
46,648 |
|
|
47,921 |
|
|
52,943 |
|
|
United Kingdom |
|
|
12,586 |
|
|
15,849 |
|
|
11,100 |
|
|
China |
|
|
12,482 |
|
|
13,779 |
|
|
15,583 |
|
|
Italy |
|
|
11,624 |
|
|
— |
|
|
— |
|
|
Japan |
|
|
5,207 |
|
|
5,255 |
|
|
5,309 |
|
|
Singapore |
|
|
74 |
|
|
65 |
|
|
86 |
|
|
Denmark |
|
|
41 |
|
|
53 |
|
|
59 |
|
|
Canada |
|
|
11 |
|
|
24 |
|
|
49 |
|
|
Brazil |
|
|
14 |
|
|
14 |
|
|
22 |
|
|
Germany |
|
|
— |
|
|
2 |
|
|
6 |
|
|
Total property, plant and equipment, net |
|
$ |
366,442 |
|
$ |
311,019 |
|
$ |
290,586 |
|
19. Government Grants
In 2007, the Company was awarded grants in Belgium related to its investment in the expansion of the Feluy facility and creation of employment opportunities. The Company received 0.9 million Euros or $1.2 million for the year ended December 31, 2014, which represented the final payment under the grants. The Company has recognized the grants as a deduction from the carrying amount of the property, plant and equipment on its consolidated balance sheets in the period received.
On December 19, 2014, the Company received an incentive of 3.86 million RMB or approximately $0.6 million from the Suzhou Wuzhong Economic Development Zone (WEDZ), where the Company’s Suzhou, China facility is located. This incentive was provided based on the Company’s commitment to the construction of carbon reactivation lines in two phases. Under phase one, the construction of two reactivation lines and under phase two, the construction of another two reactivation lines on the same site. For the year ended December 31, 2014, the Company recognized 1.93 million RMB or approximately $0.3 million less related expenses as a reduction to other expense - net on its consolidated statements of comprehensive income as phase one of the agreed upon commitment had been completed and all required documentation had been submitted to WEDZ. On May 17, 2016, the Company received an incentive of 3.86 million RMB or approximately $0.6 million from the JiangSu Provincial Bureau based on the same Company commitment. For the year ended December 31, 2016, the Company did not recognize income for the second incentive as all required documentation has not yet been completed. As of December 31, 2016 and 2015, the Company had a $0.8 million and $0.3 million liability recorded as a component of accrued pension and other liabilities within its consolidated balance sheets for the unearned portion of the incentives.
In September 2016, the Company entered into a technology investment agreement with a U.S. government agency to improve the production, infrastructure and manufacturing efficiencies related to the activated carbon capacity expansion project. As part of this agreement, the Company will be reimbursed for approved capital improvements made in conjunction with the federal award. As of December 31, 2016, there had been minimal activity associated with the award, and as such, the Company has not yet requested or received any funds.
20. Acquisition of the New Business
On April 14, 2016, the Company entered into an agreement where it made an irrevocable offer to purchase the New Business. The parties executed a definitive Asset and Share Purchase Agreement on July 25, 2016, with the completion of the transaction subject to various customary conditions and regulatory clearances. The New Business which primarily
90
serves food and beverage, industrial and pharmaceutical customers in Europe and Asia has approximately 300 employees. The Company completed this acquisition for $157.4 million on November 2, 2016 (acquisition date) and financed the transaction through borrowings under the Amended Revolver. Refer to Note 8 for further information related to the U.S. Amended Credit Agreement. The Company’s consolidated financial statements include the New Business’ results of operations from the acquisition date through December 31, 2016. Net sales and loss from operations during this period were $12.1 million and $(8.8) million, respectively.
The transaction was accounted for under the acquisition method of accounting in accordance with ASC 805 “Business Combinations.” Under the acquisition method of accounting, the tangible and identifiable intangible assets acquired and liabilities assumed are recorded based on their fair value at the acquisition date, with excess consideration paid over the net assets acquired recorded as goodwill.
The Company has completed the preliminary detailed valuation analyses necessary to assess the fair values of the tangible and intangible assets acquired and liabilities assumed and the amount of goodwill to be recognized as of the acquisition date. The amounts shown below for certain assets and liabilities are preliminary in nature and are subject to adjustment as additional information is obtained about the facts and circumstances that existed as of the acquisition date. The final determination of the fair values will be completed within the measurement period of up to one year from the acquisition date as permitted, and any adjustments to provisional amounts that are identified during the measurement period will be recorded in the reporting period in which the adjustment is determined. Fair value estimates are based on a series of judgments about future events and uncertainties and rely heavily on estimates and assumptions. The judgments used to determine the estimated fair value assigned to each class of assets acquired and liabilities assumed can materially impact the results of operations. In addition, the preliminary purchase price is subject to customary post closing adjustments.
The following table summarizes the allocation of the preliminary purchase price as of the acquisition date:
|
|
|
November 2 |
|
|
|
|
|
2016 |
|
|
|
Assets |
|
|
|
|
|
Cash and cash equivalents |
|
$ |
3,826 |
|
|
Receivables |
|
|
10,077 |
|
|
Inventories |
|
|
20,895 |
|
|
Other current assets |
|
|
1,171 |
|
|
Property, plant, and equipment |
|
|
67,697 |
|
|
Intangibles |
|
|
37,248 |
|
|
Goodwill |
|
|
42,844 |
|
|
Other assets |
|
|
179 |
|
|
Total assets |
|
$ |
183,937 |
|
|
|
|
|
|
|
|
Liabilities |
|
|
|
|
|
Accounts payable and accrued liabilities |
|
$ |
6,151 |
|
|
Payroll and benefits payable |
|
|
4,360 |
|
|
Accrued income taxes |
|
|
581 |
|
|
Deferred income taxes - long term |
|
|
7,406 |
|
|
Accrued pension and other liabilities |
|
|
8,014 |
|
|
Total liabilities |
|
$ |
26,512 |
|
|
|
|
|
|
|
|
Net assets |
|
$ |
157,425 |
|
|
Cash paid for acquisition |
|
$ |
157,425 |
|
91
The estimated fair values of certain assets and liabilities, including but not limited to, property, plant and equipment, intangibles, goodwill, deferred income taxes, and accrued pension and other liabilities are provisional amounts based, in part, on third party valuations. Given the relatively short time period between the acquisition date and December 31, 2016, these third party valuations are still under review and as such, the estimated fair values continue to be subject to final adjustments.
The Company determined the fair value of the majority of the current assets and current liabilities approximated their carrying value given the highly liquid and short-term nature of these assets and liabilities. The fair value of finished goods inventory was determined based on the estimated selling price of the inventory less the costs of disposal and a reasonable profit allowance for the selling effort. The estimated step-up in fair value of inventory of $2.1 million increased cost of products sold by $1.5 million from the acquisition date to December 31, 2016. The preliminary fair value of property, plant and equipment was determined by using certain estimates and assumptions that are not observable in the market and thus represent a Level 3 fair value measurement.
As part of the preliminary purchase price allocation, the Company determined that the separately identifiable intangible assets consisted of trade names and trademarks, unpatented technology and know-how, and customer relationships, in the amounts of $7.3 million, $14.2 million, and $15.7 million, respectively. Unpatented technology and know-how, as well as customer relationships are being amortized over a weighted-average estimated useful life of 20 years. Trade names and trademarks are considered to have an indefinite life and will be tested for impairment annually or when events or changes in the business environment indicate that the carrying value of the intangible assets may exceed their fair value. The Company used the income approach valuation technique to measure the preliminary fair value of the intangible assets, based on the present value of their future economic benefits reflecting current market expectations. Specifically, the relief from royalty method was used to value the trade names and trademarks as well as the unpatented technology and know-how. The customer relationships were valued using a multi-period excess earnings method. The assumptions used in these fair value measurements are not observable in active markets and thus represent Level 3 fair value measurements. Refer to Note 4 for further information related to intangibles.
Goodwill is calculated as the excess of the consideration transferred over the net assets recognized and represents growth opportunities and expected cost synergies of the combined company. The combined company is expected to be an industry leader in the activated carbon and filtration media markets, with enhanced diversification, a strong presence in Europe, and an expanded reach into emerging markets. Goodwill recognized as a result of the acquisition is not deductible for tax purposes. Refer to Note 4 for further information related to goodwill.
Contingent liabilities assumed include $1.9 million related to AROs for legal obligations associated with the normal operation of the acquired silica mining facilities up to the end of the quarries’ exploration. The Company evaluated the ARO to determine the cost associated with mine reclamation and landfill closures and applied an appropriate discount rate to determine the fair value. The assumptions used in these fair value measurements are not observable in active markets and thus represent Level 3 fair value measurements. Refer to Note 3 for further information related to AROs.
The Company incurred approximately $14.0 million of acquisition-related transaction costs and $0.2 million of integration costs in 2016. The transaction costs primarily relate to advisory, legal, and accounting fees, as well as transfer taxes and the integration costs related to a transition services agreement. These costs are included in the selling, general and administrative expenses line item in the consolidated statement of comprehensive income.
Pro Forma Information (Unaudited)
The Company’s consolidated financial statements include the New Business’ results of operations from the acquisition date through December 31, 2016. The following unaudited pro forma results of operations assume the New Business had been acquired on January 1, 2015. These unaudited pro forma results reflect adjustments that are directly attributable to the business combination, and are factually supportable. The unaudited pro forma results do not include any synergies or other effects of the planned integration that would have occurred had the New Business been acquired
92
on January 1, 2015. The unaudited pro forma results are not necessarily indicative of the actual results of operations that would have been realized nor are they necessarily indicative of future results of the combined operations.
|
|
|
Year Ended December 31 |
|
||||
|
|
|
2016 |
|
2015 |
|
||
|
Net sales |
|
$ |
601,153 |
|
$ |
636,211 |
|
|
Net income |
|
|
29,326 |
|
|
33,119 |
|
|
Net income per common share |
|
|
|
|
|
|
|
|
Basic |
|
$ |
0.58 |
|
$ |
0.64 |
|
|
Diluted |
|
$ |
0.57 |
|
$ |
0.63 |
|
These unaudited pro forma amounts have been calculated after adjusting for the incremental depreciation and amortization expenses of $3.2 million associated with the step-up fair value adjustments to property, plant and equipment and intangible assets in each of the years ended December 31, 2016 and 2015.
The Company financed the acquisition of the New Business by borrowing $160 million under the Amended Revolver. The unaudited pro forma amounts have been calculated after adjusting for the incremental interest expense of $3.3 million and $3.9 million for the years ended December 31, 2016 and 2015, respectively.
The unaudited pro forma results for 2016 were adjusted to eliminate the $1.5 million incremental cost of products sold recognized from the acquisition date to December 31, 2016 as a result of the step-up of inventory. The 2015 unaudited pro forma results were adjusted to include $2.1 million of incremental cost of products sold to reflect the total step up of inventory.
The unaudited pro forma net income for 2016 excludes non-recurring transaction expenses directly attributable to the acquisition of $14.0 million that were incurred by the Company in 2016, while the 2015 results were adjusted to include these expenses.
93
QUARTERLY FINANCIAL DATA — UNAUDITED
|
|
|
2016 |
|
2015 |
|
||||||||||||||||||||
|
(Dollars in thousands, except per share data) |
|
1st Quarter |
|
2nd Quarter |
|
3rd Quarter |
|
4th Quarter (1) |
|
1st Quarter |
|
2nd Quarter |
|
3rd Quarter |
|
4th Quarter |
|
||||||||
|
Net sales |
|
$ |
120,199 |
|
$ |
132,597 |
|
$ |
123,970 |
|
$ |
137,480 |
|
$ |
135,703 |
|
$ |
135,452 |
|
$ |
132,976 |
|
$ |
130,873 |
|
|
Net sales less cost of products sold (excluding depreciation and amortization) |
|
$ |
41,740 |
|
$ |
44,934 |
|
$ |
38,540 |
|
$ |
42,634 |
|
$ |
48,485 |
|
$ |
50,838 |
|
$ |
48,172 |
|
$ |
43,987 |
|
|
Net income |
|
$ |
5,458 |
|
$ |
7,896 |
|
$ |
6,385 |
|
$ |
(5,942) |
|
$ |
11,061 |
|
$ |
12,580 |
|
$ |
12,106 |
|
$ |
7,716 |
|
|
|
|
|
|
|
|
|
|
|
|
|
|
|
|
|
|
|
|
|
|
|
|
|
|
|
|
|
Common Stock Data: |
|
|
|
|
|
|
|
|
|
|
|
|
|
|
|
|
|
|
|
|
|
|
|
|
|
|
Basic: |
|
|
|
|
|
|
|
|
|
|
|
|
|
|
|
|
|
|
|
|
|
|
|
|
|
|
Net income per common share |
|
$ |
0.11 |
|
$ |
0.16 |
|
$ |
0.13 |
|
$ |
(0.12) |
|
$ |
0.21 |
|
$ |
0.24 |
|
$ |
0.23 |
|
$ |
0.15 |
|
|
|
|
|
|
|
|
|
|
|
|
|
|
|
|
|
|
|
|
|
|
|
|
|
|
|
|
|
Diluted: |
|
|
|
|
|
|
|
|
|
|
|
|
|
|
|
|
|
|
|
|
|
|
|
|
|
|
Net income per common share |
|
$ |
0.11 |
|
$ |
0.15 |
|
$ |
0.13 |
|
$ |
(0.12) |
|
$ |
0.21 |
|
$ |
0.24 |
|
$ |
0.23 |
|
$ |
0.15 |
|
|
|
|
|
|
|
|
|
|
|
|
|
|
|
|
|
|
|
|
|
|
|
|
|
|
|
|
|
Average common shares outstanding |
|
|
|
|
|
|
|
|
|
|
|
|
|
|
|
|
|
|
|
|
|
|
|
|
|
|
Basic |
|
|
50,308 |
|
|
50,225 |
|
|
50,246 |
|
|
50,255 |
|
|
52,451 |
|
|
52,314 |
|
|
51,891 |
|
|
50,970 |
|
|
Diluted |
|
|
51,041 |
|
|
50,987 |
|
|
50,984 |
|
|
51,081 |
|
|
53,330 |
|
|
53,179 |
|
|
52,634 |
|
|
51,710 |
|
|
(1) |
Results were negatively impacted by $12.2 million of costs related to the acquisition of the New Business, consisting primarily of $10.5 million of transaction costs. Refer to Note 20 of the consolidated financial statements in Item 8 of this Annual Report for further information. |
94
Item 9. Changes in and Disagreements with Accountants on Accounting and Financial Disclosure:
Not Applicable.
Item 9A. Controls and Procedures:
Evaluation of Disclosure Controls and Procedures
The Company maintains controls and procedures designed to provide reasonable assurance that information required to be disclosed in reports that are filed with or submitted to the U.S. Securities and Exchange Commission is: (1) accumulated and communicated to management, including the Chief Executive Officer and Chief Financial Officer, to allow timely decisions regarding required disclosures and (2) recorded, processed, summarized, and reported within the time periods specified in applicable laws and regulations. Based on this evaluation, the Chief Executive Officer and the Chief Financial Officer concluded that its disclosure controls and procedures were not effective as of December 31, 2016 due to a material weakness in internal control over financial reporting related to the recognition of revenue for a subset of transactions within the Company’s U.S. potable water market.
Management’s Annual Report on Internal Control over Financial Reporting
Management’s Annual Report on Internal Control over Financial Reporting is contained in “Item 8. Financial Statements and Supplementary Data — Report of Management — Responsibility for Financial Statements and Management’s Annual Report on Internal Control over Financial Reporting,” and incorporated herein by reference.
Attestation Report of the Independent Registered Public Accounting Firm
The attestation report of the Independent Registered Public Accounting Firm is contained in “Item 8. Financial Statements and Supplementary Data Report of Independent Registered Public Accounting Firm,” and incorporated herein by reference.
Changes in internal control over financial reporting
Disclosure of changes in internal control over financial reporting is contained in “Item 8. Financial Statements and Supplementary Data — Report of Management — Changes in Internal Control,” and incorporated herein by reference.
None.
95
Item 10. Directors, Executive Officers, and Corporate Governance of the Registrant:
Information concerning the directors and executive officers of the Corporation required by this item is incorporated by reference to the material appearing under the headings “Board of Directors and Committees of the Board,” “Election of Directors (Proposal 1),” “Executive Officers,” and “Corporate Governance” included in the Corporate Governance section of the Company’s Proxy Statement for the 2017 Annual Meeting of its Stockholders.
Item 11. Executive Compensation:
Information required by this item is incorporated by reference to the material appearing under the headings “Executive and Director Compensation” and “Corporate Governance - Compensation Committee Interlocks and Insider Participation” in the Company’s Proxy Statement for the 2017 Annual Meeting of its Stockholders.
Item 12. Security Ownership of Certain Beneficial Owners and Management and Related Stockholder Matters:
The following table sets forth information as of December 31, 2016 concerning common stock issuable under the Company’s equity compensation plans:
Equity Compensation Plan Information
|
|
|
|
|
|
|
|
Number of securities remaining |
|
|
|
|
Number of securities to |
|
Weighted-average |
|
available for future issuance |
|
|
|
|
|
be issued upon exercise |
|
exercise price of |
|
under equity compensation plans |
|
|
|
|
|
of outstanding options, |
|
outstanding options, |
|
(excluding securities reflected in |
|
|
|
|
|
warrants and rights |
|
warrants and rights |
|
column (a)) |
|
|
|
Plan category |
|
(a) |
|
(b) |
|
(c) |
|
|
|
Equity compensation plans approved by security holders |
|
1,684,367 |
|
$ |
17.57 |
|
1,617,213 |
|
|
Equity compensation plans not approved by security holders |
|
— |
|
|
— |
|
43,460 |
(1) |
|
Total |
|
1,684,367 |
|
$ |
17.57 |
|
1,660,673 |
|
|
(1) |
On December 31, 2016 there were 43,460 shares available for issuance under the Company’s 1997 Directors’ Fee Plan, as last amended in 2005. The Plan provides non-employee directors of the Company with payment alternatives for retainer fees by being able to elect to receive common stock of the Company instead of cash for such fees. Under the plan, directors have the alternative to elect their retainer fees in a current payment of shares of common stock of the Company, or to defer payment of such fees into a common stock account. Shares which are deferred are credited to a deferred stock compensation other liability account maintained by the Company. On each date when director fees are otherwise payable to a director who has made a stock deferral election, his or her stock deferral account will be credited with a number of shares equal to the cash amount of the director’s fees payable divided by the fair market value of one share of the common stock on the date on which the fees are payable. Dividends or other distributions payable on common stock are similarly credited to the deferred stock account of a director on the date when such dividends or distributions are payable. The deferred stock compensation accounts are payable to the directors in accordance with their stock deferral elections and are typically paid either in a lump sum or in annual installments after the retirement or other termination of service of the director from the Company’s Board of Directors. |
The additional information required by this item is incorporated by reference to the material appearing under the heading “Security Ownership of Management and Certain Beneficial Owners” in the Company’s Proxy Statement for the 2017 Annual Meeting of its Stockholders.
96
Item 13. Certain Relationships, Related Transactions, and Director Independence:
Information required by this item is incorporated by reference to the material appearing under the headings “Election of Directors (Proposal 1)” and “Corporate Governance” in the Company’s Proxy Statement for the 2017 Annual Meeting of its Stockholders.
Item 14. Principal Accounting Fees and Services:
Information required by this item is incorporated by reference to the material appearing under the heading “Ratification of Appointment of Independent Registered Public Accounting Firm (Proposal 2) — Certain Fees” in the Company’s Proxy Statement for the 2017 Annual Meeting of its Stockholders.
97
Item 15. Exhibits and Financial Statements Schedule:
A. Financial Statements and Reports of Independent Registered Public Accounting Firm
(see Part II, Item 8 of this Form 10-K).
The following information is filed as part of this Form 10-K:
B. Financial Statements Schedule for the years ended December 31, 2016, 2015, and 2014
II — Valuation and Qualifying Accounts for the Years Ended December 31, 2016, 2015, and 2014
C. The Exhibits Listed in the Accompanying Exhibit Index are Filed, Furnished or Incorporated by Reference as Part of this Annual Report on Form 10-K.
98
REPORT OF INDEPENDENT REGISTERED PUBLIC ACCOUNTING FIRM
To the Board of Directors and Stockholders of
Calgon Carbon Corporation
Moon Township, Pennsylvania
We have audited the consolidated financial statements of Calgon Carbon Corporation and subsidiaries (the “Company”) as of December 31, 2016 and 2015, and for each of the three years in the period ended December 31, 2016, and the Company’s internal control over financial reporting as of December 31, 2016, and have issued our reports thereon dated March 1, 2017; such consolidated financial statements and reports are included elsewhere in this Form 10-K. Our audits also included the consolidated financial statement schedule of the Company listed in Item 15. This consolidated financial statement schedule is the responsibility of the Company’s management. Our responsibility is to express an opinion based on our audits. In our opinion, such consolidated financial statement schedule, when considered in relation to the basic consolidated financial statements taken as a whole, presents fairly, in all material respects, the information set forth therein.
|
/s/ DELOITTE & TOUCHE LLP |
|
Pittsburgh, Pennsylvania |
|
March 1, 2017 |
99
The following should be read in conjunction with the previously referenced financial statements:
Schedule II
Valuation and Qualifying Accounts
(Dollars in thousands)
|
|
|
|
|
|
Additions |
|
|
|
|
|
|
|
|
|
|
|
|
|
|
Charged to |
|
Deductions |
|
|
|
|
||
|
|
|
Balance at |
|
Costs and |
|
Returns and |
|
Balance at |
|
||||
|
Description |
|
Beginning of Year |
|
Expenses |
|
Write-Offs |
|
End of Year |
|
||||
|
|
|
|
|
|
|
|
|
|
|
|
|
|
|
|
Year Ended December 31, 2016 |
|
|
|
|
|
|
|
|
|
|
|
|
|
|
Allowance for doubtful accounts |
|
$ |
1,675 |
|
$ |
2,926 |
|
$ |
(3,185) |
|
$ |
1,416 |
|
|
|
|
|
|
|
|
|
|
|
|
|
|
|
|
|
Year Ended December 31, 2015 |
|
|
|
|
|
|
|
|
|
|
|
|
|
|
Allowance for doubtful accounts |
|
|
1,526 |
|
|
1,402 |
|
|
(1,253) |
|
|
1,675 |
|
|
|
|
|
|
|
|
|
|
|
|
|
|
|
|
|
Year Ended December 31, 2014 |
|
|
|
|
|
|
|
|
|
|
|
|
|
|
Allowance for doubtful accounts |
|
|
1,328 |
|
|
1,426 |
|
|
(1,228) |
|
|
1,526 |
|
|
|
|
|
|
|
Additions |
|
|
|
|
|
|
|
|
|
||
|
|
|
|
|
|
Charged to |
|
Charged to |
|
Deductions |
|
|
|
|
|||
|
|
|
Balance at |
|
Costs and |
|
Other |
|
Returns and |
|
Balance at |
|
|||||
|
Description |
|
Beginning of Year |
|
Expenses |
|
Accounts |
|
Write-Offs |
|
End of Year |
|
|||||
|
|
|
|
|
|
|
|
|
|
|
|
|
|
|
|
|
|
|
Year Ended December 31, 2016 |
|
|
|
|
|
|
|
|
|
|
|
|
|
|
|
|
|
Income tax valuation allowance |
|
$ |
2,682 |
|
$ |
153 |
|
$ |
(325) |
|
$ |
— |
|
$ |
2,510 |
|
|
|
|
|
|
|
|
|
|
|
|
|
|
|
|
|
|
|
|
Year Ended December 31, 2015 |
|
|
|
|
|
|
|
|
|
|
|
|
|
|
|
|
|
Income tax valuation allowance |
|
|
2,576 |
|
|
183 |
|
|
— |
|
|
(77) |
|
|
2,682 |
|
|
|
|
|
|
|
|
|
|
|
|
|
|
|
|
|
|
|
|
Year Ended December 31, 2014 |
|
|
|
|
|
|
|
|
|
|
|
|
|
|
|
|
|
Income tax valuation allowance |
|
|
988 |
|
|
— |
|
|
1,616 |
|
|
(28) |
|
|
2,576 |
|
100
C. Exhibit Index
|
|
|
|
|
|
2.1 |
|
Letter Agreement (including the form Asset and Share Purchase Agreement to be entered into by and among Calgon Carbon Corporation, Calgon Carbon Investments, Inc., CECA, S.A., Arkema S.r.l, Arkema Shanghai Distribution Co Ltd and ARKEMA FRANCE), dated April 14, 2016, incorporated herein by reference to Exhibit 2.1 to the Company’s Current Report on Form 8-K filed April 14, 2016 (File No. 001-10776). |
|
|
2.2 |
|
Asset and Share Purchase Agreement by and among CECA, S.A., Arkema S.r.l, Arkema Shanghai Distribution Co Ltd, Arkema France, Chemviron France SAS and Calgon Carbon Corporation dated July 25, 2016, incorporated herein by reference to Exhibit 10.1 to the Company’s Current Report on Form 8-K filed July 29, 2016 (File No. 001-10776). |
|
|
2.3 |
|
Amendatory Agreement in respect of Asset and Share Purchase Agreement by and among CECA, S.A., Arkema S.r.l, Arkema Shanghai Distribution Co Ltd, Arkema France, Chemviron France SAS, Calgon Carbon Corporation, Calgon Carbon (Suzhou) Co., Ltd. and Chemviron SPRL, dated November 2, 2016, incorporated herein by reference to Exhibit 2.2 to the Company’s Current Report on Form 8-K filed November 8, 2016 (File No. 001-10776). |
|
|
3.1 |
|
Restated Certificate of Incorporation, incorporated herein by reference to Exhibit 3.1 to the Company’s Quarterly Report on Form 10-Q for the fiscal quarter ended June 30, 2009, filed on August 7, 2009 (File No. 001-10776). |
|
|
3.2 |
|
Amended and Restated By-laws of the Company, incorporated herein by reference to Exhibit 10.1 to the Company’s Current Report on Form 8-K filed December 19, 2011 (File No. 001-10776). |
|
|
4.1 |
|
Form of Senior Debt Indenture, incorporated herein by reference to Exhibit 4.3 to the Company’s Automatic Shelf Registration Statement on Form S-3ASR filed May 7, 2013 (File No. 333-18840). |
|
|
4.2 |
|
Form of Subordinated Debt Indenture, incorporated herein by reference to Exhibit 4.4 to the Company’s Automatic Shelf Registration Statement on Form S-3ASR filed May 7, 2013 (File No. 333-18840). |
|
|
10.1* |
|
Calgon Carbon Corporation Amended and Restated 2008 Equity Incentive Plan, incorporated herein by reference to Exhibit A to the Company’s Definitive Proxy Statement on Schedule 14A filed March 25, 2014 (File No. 001-10776). |
|
|
10.2* |
|
Form of Restricted Stock Agreement for Non-Employee Directors, incorporated herein by reference to Exhibit 10.2 to the Company’s Annual Report on Form 10-K for the fiscal year ended December 31, 2015, filed on February 26, 2016 (File No. 001-10776). |
|
|
10.3* |
|
Form of Restricted Performance Stock Unit Agreement, incorporated herein by reference to Exhibit 10.1 to the Company’s Current Report on Form 8-K filed February 18, 2016 (File No. 001-10776). |
|
|
10.4* |
|
Form of Restricted Stock Agreement, incorporated herein by reference to Exhibit 10.4 to the Company’s Annual Report on Form 10-K for the fiscal year ended December 31, 2015, filed on February 26, 2016 (File No. 001-10776). |
|
|
10.5* |
|
Form of 2008 Equity Incentive Plan Agreement for Non-Statutory Stock Options, incorporated herein by reference to Exhibit 10.5 to the Company’s Annual Report on Form 10-K for the fiscal year ended December 31, 2015, filed on February 26, 2016 (File No. 001-10776). |
|
|
10.6* |
|
1993 Non-Employee Directors’ Stock Option Plan, as amended, incorporated herein by reference to Exhibit 10.3 to the Company’s Annual Report on Form 10-K for the fiscal year ended December 31, 2005, filed on March 30, 2006 (File No. 001-10776). |
|
|
10.7* |
|
1997 Directors’ Fee Plan, as amended, incorporated herein by reference to Exhibit 10.4 to the Company’s Annual Report on Form 10-K filed for the fiscal year ended December 31, 2005, filed on March 30, 2006 (File No. 001-10776). |
|
|
10.8* |
|
1999 Non-Employee Directors’ Phantom Stock Unit Plan, as amended, incorporated herein by reference to Exhibit 10.2 to the Company’s Annual Report on Form 10-K filed for the fiscal year ended December 31, 2005, filed on March 30, 2006 (File No. 001-10776). |
|
|
10.9* |
|
Offer Letter by and between Calgon Carbon Corporation and Randall S. Dearth dated June 26, 2012, incorporated herein by reference to Exhibit 10.1 to the Company’s Current Report on Form 8-K filed June 27, 2012 (File No. 001-10776). |
|
|
10.10* |
|
Director Compensation Letter by and between Calgon Carbon Corporation and Randall S. Dearth dated June 26, 2012, incorporated herein by reference to Exhibit 10.2 to the Company’s Current Report on Form 8-K filed June 27, 2012 (File No. 001-10776). |
|
101
|
10.11* |
|
Employment Agreement by and between Calgon Carbon Corporation and Randall S. Dearth dated December 18, 2015 and effective January 1, 2016, incorporated herein by reference to Exhibit 10.1 to the Company’s Current Report on Form 8-K filed December 22, 2015 (File No. 001-10776). |
|
|
10.12* |
|
Employment Agreement between Calgon Carbon Corporation and Robert Fortwangler dated December 18, 2015 and effective January 1, 2016, incorporated herein by reference to Exhibit 10.4 to the Company’s Current Report on Form 8-K filed December 22, 2015 (File No. 001-10776). |
|
|
10.13* |
|
Employment Agreement between Calgon Carbon Corporation and Stevan R. Schott dated December 18, 2015 and effective January 1, 2016, incorporated herein by reference to Exhibit 10.2 to the Company’s Current Report on Form 8-K filed December 22, 2015 (File No. 001-10776). |
|
|
10.14* |
|
Employment Agreement between Calgon Carbon Corporation and James A. Coccagno dated December 18, 2015 and effective January 1, 2016, incorporated herein by reference to Exhibit 10.3 to the Company’s Current Report on Form 8-K filed December 22, 2015 (File No. 001-10776). |
|
|
10.15* |
|
Employment Agreement between Calgon Carbon Corporation and Chad Whalen dated December 1, 2015 and effective December 1, 2015, incorporated herein by reference to Exhibit 10.1 to the Company’s Current Report on Form 8-K filed December 7, 2015 (File No. 001-10776). |
|
|
10.16* |
|
Agreement for Consulting Services by and between Calgon Carbon Corporation and Robert P. O’Brien executed on October 12, 2015, incorporated herein by reference to Exhibit 10.1 to the Company’s Current Report on Form 8-K filed October 13, 2015 (File No. 001-10776). |
|
|
10.17 |
|
Form of Indemnification Agreement dated February 25, 2010, incorporated herein by reference to Exhibit 10.1 to the Company’s Current Report on Form 8-K filed March 3, 2010 (File No. 001-10776). |
|
|
10.18 |
|
First Amended and Restated Credit Agreement by and among Calgon Carbon Corporation, the other borrowers party thereto, the guarantors party thereto, the lenders party thereto, PNC Bank, National Association as Administrative Agent, Swing Loan Lender and Issuing Lender, Citizens Bank of Pennsylvania as Syndication Agent, Bank of America, N.A., and Branch Banking and Trust Company as Co-Documentation Agents, and PNC Capital Markets LLC and Citizens Bank, N.A., as Joint Lead Arrangers and Joint Bookrunners, together with Schedules and Exhibits thereto, dated October 4, 2016, incorporated herein by reference to Exhibit 10.1 to the Company’s Current Report on Form 8-K filed October 7, 2016 (File No. 001-10776). |
|
|
10.19 |
|
First Amendment to First Amended and Restated Credit Agreement by and among Calgon Carbon Corporation, the other borrowers party thereto, the guarantors party thereto, the lenders party thereto, and PNC Bank, National Association as Administrative Agent, dated February 23, 2017, incorporated herein by reference to Exhibit 10.1 to the Company’s Current Report on Form 8-K filed February 24, 2017 (File No. 001-10776). |
|
|
10.20 |
|
Redemption, Asset Transfer and Contribution Agreement by and among Calgon Mitsubishi Chemical Corporation, Mitsubishi Chemical Corporation and Calgon Carbon Corporation, dated February 12, 2010, incorporated herein by reference to Exhibit 10.12 to the Company’s Annual Report on Form 10-K for the fiscal year ended December 31, 2009, filed on February 26, 2010 (File No. 001-10776). |
|
|
10.21 |
|
Facility Agreement by and between Calgon Carbon Japan KK and Bank of America, N.A., Tokyo Branch, dated March 24, 2016, incorporated herein by reference to Exhibit 10.1 to the Company’s Current Report on Form 8-K filed March 30, 2016 (File No. 001-10776). |
|
|
10.22 |
|
Continuing Guaranty of Calgon Carbon Corporation in favor of Bank of America, N.A., Tokyo Branch, dated March 24, 2016, incorporated herein by reference to Exhibit 10.2 to the Company’s Current Report on Form 8-K filed March 30, 2016 (File No. 001-10776). |
|
|
10.23 |
|
Facility Letter by and among The Bank of Tokyo-Mitsubishi UJF (China), Ltd., Calgon Carbon (Tianjin) Co., Ltd, Datong Carbon Corporation and Calgon Carbon (Suzhou) Co., Ltd. dated July 19, 2011, incorporated herein by reference to Exhibit 10.1 to the Company’s Current Report on Form 8-K filed August 5, 2013 (File No. 001-10776). |
|
|
10.24 |
|
Amended Facility Letter by and among The Bank of Tokyo-Mitsubishi UJF (China), Ltd., Calgon Carbon (Tianjin) Co., Ltd. and Calgon Carbon (Suzhou) Co., Ltd., incorporated herein by reference to Exhibit 10.2 to the Company’s Current Report on Form 8-K filed August 5, 2013 (File No. 001-10776). |
|
|
10.25 |
|
Uncommitted Revolving Loan Facility Letter by and between The Bank of Tokyo-Mitsubishi UJF (China), Ltd., Shanghai Branch and Calgon Carbon (Suzhou) Co., Ltd. dated August 14, 2014, incorporated herein by reference to Exhibit 10.1 to the Company’s Current Report on Form 8-K filed August 18, 2014 (File No. 001-10776). |
|
102
|
10.26 |
|
Unconditional Guarantee from Calgon Carbon Corporation in favor of The Bank of Tokyo-Mitsubishi UJF (China), Ltd., Shanghai Branch dated August 14, 2014, incorporated herein by reference to Exhibit 10.2 to the Company’s Current Report on Form 8-K filed August 18, 2014 (File No. 001-10776). |
|
|
10.27 |
|
Amendment Agreement of Facility Agreement by and between Calgon Carbon (Suzhou) Co., Ltd. and The Bank of Tokyo-Mitsubishi UFJ (China), Ltd., acting by and through its Shanghai Branch effective July 19, 2015 and dated August 7, 2015, incorporated herein by reference to Exhibit 10.2 to the Company’s Current Report on Form 8-K filed August 11, 2015 (File No. 001-10776). |
|
|
10.28 |
|
Service Contract for the Supply, Placement, Removal and Thermal Reactivation of Granular Activated Carbon by and between Calgon Carbon Corporation and the City of Phoenix, Arizona entered into on March 9, 2012, incorporated herein by reference to Exhibit 10.1 to the Company’s Current Report on Form 8-K filed March 14, 2012 (File No. 001-10776). |
|
|
14.1 |
|
Code of Business Conduct and Ethics, incorporated herein by reference to Exhibit 14.1 to the Company’s Annual Report on Form 10-K for the fiscal year ended December 31, 2015, filed on February 26, 2016 (File No. 001-10776). |
|
|
21.0 |
|
The wholly owned subsidiaries of the Company at December 31, 2016 are Chemviron Carbon GmbH, a German corporation; Calgon Carbon Canada, Inc., an Ontario corporation; Chemviron Carbon Ltd., a United Kingdom corporation; Calgon Carbon Investments, Inc., a Delaware corporation; Charcoal Cloth (International) Limited, a United Kingdom corporation; Charcoal Cloth Limited, a United Kingdom corporation; Waterlink (UK) Holdings Ltd., a United Kingdom corporation, Sutcliffe Croftshaw Limited, a United Kingdom corporation; Sutcliffe Speakman Limited, a United Kingdom corporation; Sutcliffe Speakman Carbons Ltd., a United Kingdom corporation; Lakeland Processing Limited, a United Kingdom corporation; Sutcliffe Speakmanco 5 Ltd., a United Kingdom corporation; Chemviron Carbon ApS, a Danish corporation, Chemviron Carbon AB, a Swedish corporation; Calgon Carbon (Tianjin) Co., Limited, a Chinese corporation; Calgon Carbon Asia PTE Limited, a Singapore corporation; BSC Columbus, LLC, a Delaware limited liability company; CCC Columbus, LLC, a Delaware limited liability company; Calgon Carbon (Suzhou) Co., Ltd., a Chinese corporation; Calgon Carbon Hong Kong Limited, a Hong Kong corporation; Calgon Carbon Japan KK, a Japanese corporation; Calgon Carbon Holdings, LLC, a Delaware limited liability company; Calgon Carbon Mexico S. de R.L. de C.V., a Mexican corporation; Calgon Carbon Payco S. de R.L. de C.V., a Mexican corporation; Calgon Carbon Sistemas de Filtração Importação e Exportação Ltda., a Brazilian corporation; Calgon Carbon UV Technologies LLC, a Delaware limited liability company, Calgon Carbon UV Technologies Canada Inc., an Ontario corporation, Calgon Carbon India LLP, an Indian limited liability partnership, CC Koolstof, LLC, a Delaware limited liability partnership, Chemviron Sprl, a Belgian company, Chemviron France SAS, a French company, Chemviron Italia S.r.l., an Italian company, and 20% of Calgon Carbon (Thailand) Company Limited, a Thailand corporation |
|
|
23.1 |
|
Consent of Independent Registered Public Accounting Firm |
|
|
31.1 |
|
Rule 13a-14(a) Certification of Chief Executive Officer |
|
|
31.2 |
|
Rule 13a-14(a) Certification of Chief Financial Officer |
|
|
32.1 |
|
Certification of Chief Executive Officer Pursuant to 18 U.S.C. Section 1350, as Adopted Pursuant to Section 906 of the Sarbanes-Oxley Act of 2002 |
|
|
32.2 |
|
Certification of Chief Financial Officer Pursuant to 18 U.S.C. Section 1350, as Adopted Pursuant to Section 906 of the Sarbanes-Oxley Act of 2002 |
|
|
|
|
|
|
|
101.INS |
|
XBRL Instance Document |
|
|
101.SCH |
|
XBRL Taxonomy Extension Schema Document |
|
|
101.CAL |
|
XBRL Taxonomy Extension Calculation Linkbase Document |
|
|
101.DEF |
|
XBRL Taxonomy Extension Definition Linkbase Document |
|
|
101.LAB |
|
XBRL Taxonomy Extension Label Linkbase Document |
|
|
101.PRE |
|
XBRL Taxonomy Extension Presentation Linkbase Document |
|
Note:The Registrant hereby undertakes to furnish, upon request of the Commission, copies of all instruments defining the rights of holders of long-term debt of the Registrant and its consolidated subsidiaries. The total amount of securities authorized thereunder does not exceed 10% of the total assets of the Registrant and its subsidiaries on a consolidated basis.
*Management contract or compensatory plan, contract or arrangement required to be filed by Item 601(b)(10)(iii) of Regulation S-K.
103
Pursuant to the requirements of Section 13 or 15(d) of the Securities Exchange Act of 1934, the registrant has duly caused this report to be signed on its behalf by the undersigned, thereunto duly authorized.
|
|
Calgon Carbon Corporation |
|
|
|
By |
/s/ RANDALL S. DEARTH |
|
|
Randall S. Dearth |
|
|
|
Chairman, President and Chief Executive Officer |
|
|
|
March 1, 2017 |
|
Pursuant to the requirements of the Securities Exchange Act of 1934, this report has been signed below by the following persons on behalf of the registrant and in the capacities on the dates indicated.
|
Signature |
|
Title |
|
Date |
|
|
|
|
|
|
|
/S/ RANDALL S. DEARTH |
|
Chairman, President and Chief Executive Officer |
|
March 1, 2017 |
|
Randall S. Dearth |
|
(Principal Executive Officer) |
|
|
|
|
|
|
|
|
|
/S/ ROBERT M. FORTWANGLER |
|
Chief Financial Officer |
|
March 1, 2017 |
|
Robert M. Fortwangler |
|
(Principal Financial Officer and Principal Accounting Officer) |
|
|
|
|
|
|
|
|
|
/S/ J. RICH ALEXANDER |
|
Director |
|
March 1, 2017 |
|
J. Rich Alexander |
|
|
|
|
|
|
|
|
|
|
|
/S/ WILLIAM J. LYONS |
|
Director |
|
March 1, 2017 |
|
William J. Lyons |
|
|
|
|
|
|
|
|
|
|
|
/S/ LOUIS S. MASSIMO |
|
Director |
|
March 1, 2017 |
|
Louis S. Massimo |
|
|
|
|
|
|
|
|
|
|
|
/S/ WILLIAM R. NEWLIN |
|
Director |
|
March 1, 2017 |
|
William R. Newlin |
|
|
|
|
|
|
|
|
|
|
|
/S/ JOHN J. PARO |
|
Director |
|
March 1, 2017 |
|
John J. Paro |
|
|
|
|
|
|
|
|
|
|
|
/S/ JULIE S. ROBERTS |
|
Director |
|
March 1, 2017 |
|
Julie S. Roberts |
|
|
|
|
|
|
|
|
|
|
|
/S/ TIMOTHY G. RUPERT |
|
Director |
|
March 1, 2017 |
|
Timothy G. Rupert |
|
|
|
|
|
|
|
|
|
|
|
/S/ DONALD C. TEMPLIN |
|
Director |
|
March 1, 2017 |
|
Donald C. Templin |
|
|
|
|
104