Attached files
| file | filename |
|---|---|
| 8-K - 8-K - SEACOAST BANKING CORP OF FLORIDA | v408979_8k.htm |
| EX-99.2 - EXHIBIT 99.2 - SEACOAST BANKING CORP OF FLORIDA | v408979_ex99-2.htm |
| EX-99.1 - EXHIBIT 99.1 - SEACOAST BANKING CORP OF FLORIDA | v408979_ex99-1.htm |
Exhibit 99.3

First Quarter 2015 April 29 th , 2015

2 Cautionary Notice Regarding Forward - Looking Statements This press release contains “forward - looking statements” within the meaning of Section 27 A of the Securities Act of 1933 and Section 21 E of the Securities Exchange Act of 1934 , including, without limitation, statements about future financial and operating results, ability to realized deferred tax assets, cost savings, enhanced revenues, economic and seasonal conditions in our markets, and improvements to reported earnings that may be realized from cost controls and for integration of banks that we have acquired, as well as statements with respect to Seacoast’s objectives, expectations and intentions and other statements that are not historical facts . Actual results may differ from those set forth in the forward - looking statements . Forward - looking statements include statements with respect to our beliefs, plans, objectives, goals, expectations, anticipations, estimates and intentions, and involve known and unknown risks, uncertainties and other factors, which may be beyond our control, and which may cause the actual results, performance or achievements of Seacoast to be materially different from future results, performance or achievements expressed or implied by such forward - looking statements . You should not expect us to update any forward - looking statements . You can identify these forward - looking statements through our use of words such as “may,” “will,” “anticipate,” “assume,” “should,” “support”, “indicate,” “would,” “believe,” “contemplate,” “expect,” “estimate,” “continue,” “further”, “point to,” “project,” “could,” “intend” or other similar words and expressions of the future . These forward - looking statements may not be realized due to a variety of factors, including, without limitation : the effects of future economic and market conditions, including seasonality ; governmental monetary and fiscal policies, as well as legislative, tax and regulatory changes ; changes in accounting policies, rules and practices ; the risks of changes in interest rates on the level and composition of deposits, loan demand, liquidity and the values of loan collateral, securities, and interest sensitive assets and liabilities ; interest rate risks, sensitivities and the shape of the yield curve ; the effects of competition from other commercial banks, thrifts, mortgage banking firms, consumer finance companies, credit unions, securities brokerage firms, insurance companies, money market and other mutual funds and other financial institutions operating in our market areas and elsewhere, including institutions operating regionally, nationally and internationally, together with such competitors offering banking products and services by mail, telephone, computer and the Internet ; and the failure of assumptions underlying the establishment of reserves for possible loan losses . The risks of mergers and acquisitions, include, without limitation : unexpected transaction costs, including the costs of integrating operations ; the risks that the businesses will not be integrated successfully or that such integration may be more difficult, time - consuming or costly than expected ; the potential failure to fully or timely realize expected revenues and revenue synergies, including as the result of revenues following the merger being lower than expected ; the risk of deposit and customer attrition ; any changes in deposit mix ; unexpected operating and other costs, which may differ or change from expectations ; the risks of customer and employee loss and business disruption, including, without limitation, as the result of difficulties in maintaining relationships with employees ; increased competitive pressures and solicitations of customers by competitors ; as well as the difficulties and risks inherent with entering new markets . All written or oral forward - looking statements attributable to us are expressly qualified in their entirety by this cautionary notice, including, without limitation, those risks and uncertainties described in our annual report on Form 10 - K for the year ended December 31 , 2014 under “Special Cautionary Notice Regarding Forward - Looking Statements” and “Risk Factors”, and otherwise in our SEC reports and filings . Such reports are available upon request from the Company, or from the Securities and Exchange Commission, including through the SEC’s Internet website at http : //www . sec . gov . First Quarter 2015

First Quarter 2015 3 Financial Highlights Growth Highlights Q1 2015 Financial and Growth Highlights • Total loans increased $32.6 million or 7% (annualized) from Q4 14, and increased 41.3% from a year ago. Excluding the acquisition of BANKshares , loans increased $218.7 million or 15.9% from prior year levels. • Deposits increased $193.3 million or 8.0% from the prior quarter and 43.4% from a year earlier. Excluding the acquisition of BANKshares , deposits increased $273.7 million or 15.0% from prior year levels. • Acquired Grand Bankshares , Inc. (estimated to close in 3Q 15) adding approximately $208 million in assets, $184 million in deposits, and $127 million in gross loans to Seacoast's operations, along with 3 branch locations in Palm Beach County . • Net income grew 155% to $5.9 million, or $0.18 per diluted share, versus $2.3 million, or $0.09 per diluted share, in 1Q 14 and a net loss of $1.5 million, or ($0.05) per diluted share in Q4 14. • Adjusted net income (1) , for the Q1 2015 increased 47.8 % to $6.2 million or $ 0.19 per diluted share, compared to $4.2 million, or $0.13 per diluted share in 4Q14. • Net interest margin improved to 3.62% compared with 3.56% in preceding quarter due to loan growth, acquisition, and investment purchases . (1) Non - GAAP measure, excludes merger related charges, branch closure expenses, and other adjustments (See Appendix for reconciliation to GAA P)

First Quarter 2015 4 Earnings Trend Improve • The effective tax rate in the first quarter decreased to 37.7 % from 44.4% (higher from nondeductible merger related charges) for the 2014 calendar year. • Adjusted Pretax, pre - provision income (1) significantly improved indicative of higher quality earnings. (Dollars in thousands) First Quarter Fourth Quarter Third Quarter Second Quarter First Quarter 2015 2014 2014 2014 2014 GAAP Net Income $5,859 ($1,517) $2,996 $1,918 $ 2,299 GAAP Earnings per diluted share $ 0.18 ($0.05) $ 0.12 $ 0.07 $ 0.09 Adjusted Net Income (1) $6,177 $4,179 $3,286 $2,990 $2,533 Adjusted Pretax, pre - provision income (1) $10,342 $7,464 $4,341 $3,821 $3,395 Adjusted Earnings per diluted share (1) $0.19 $0.13 $0.13 $0.12 $0.10 Average shares outstanding 33,135 33,124 26,026 25,998 25,657 (1) Non - GAAP measure, excludes merger related charges, branch closure expenses, and other adjustments (See Appendix for reconciliation to GAA P)

First Quarter 2015 5 Loan Growth Momentum Continues • Total loans were $ 1.854 billion at March 31, 2015, up $32.6 million from December 31, 2014, or 1.8% (7% annualized) from the fourth quarter. • The commercial pipeline (in underwriting and approval or approved and not yet closed) totaled $82.1 million at March 31, 2015, the highest in the trailing four quarters and suggests continued strength. • T he residential pipeline totals $48.5 million at March 31, 2015 compared to $21.4 million at December 31, 2014 and $26.7 million one year ago. $675 $682 $701 $774 $780 $637 $653 $690 $1,048 $ 1,074 $1,312 $1,335 $1,391 $ 1,822 $ 1,854 0 200 400 600 800 1,000 1,200 1,400 1,600 1,800 2,000 Q1-14 Q2-14 Q3-14 Q4-14 Q1-15 Total Loans ($ in Millions) Consumer Commercial

First Quarter 2015 6 Deposit Balances Extend Growth Trends • Average noninterest bearing demand deposits increased to 30.3% of total deposits compared with 26.9% for the first quarter 2014 • Average Low/No cost deposits increased to 87.2% of total deposits compared to 84.9% one year ago $481 $506 $506 $728 $754 $ 1,036 $ 1,041 $1,042 $ 1,307 $ 1,416 $270 $259 $252 $327 $318 $1,787 $1,806 $1,800 $2,362 $2,488 $0 $250 $500 $750 $1,000 $1,250 $1,500 $1,750 $2,000 $2,250 $2,500 $2,750 $3,000 Q1-14 Q2-14 Q3-14 Q4-14 Q1-15 Average Deposit Balances ($ in Millions) Non Interest Bearing Low Cost Deposits Time Deposits

First Quarter 2015 7 Funding Costs Remain Low 14 13 12 11 12 33 33 32 31 32 Q1-14 Q2-14 Q3-14 Q4-14 Q1-15 Funding Costs (in BPS) Deposit Costs Interest Bearing

First Quarter 2015 8 • Net interest income for the quarter totaled $ 25.7 million, a $1 million or 15% annualized linked quarter . • Net interest margin for the quarter increased to 3.62% versus prior quarter of 3.56% in the fourth quarter 2014. • Improvement in net interest income and margin was the result of increased loan growth (a $54.5 million average balance increase), the reinvestment of excess cash balances, and additional accretion on purchased loans. $16,277 $16,779 $17,282 $24,883 $25,834 3.07% 3.10% 3.17% 3.56% 3.62% 0 5,000 10,000 15,000 20,000 25,000 30,000 0.00% 1.00% 2.00% 3.00% 4.00% 5.00% 6.00% 7.00% Q1-14 Q2-14 Q3-14 Q4-14 Q1-15 Net Interest Income and Net Interest Margin ($ in thousands) Net Interest Income Net Interest Margin Net Interest Income and Margin Meaningfully Improved
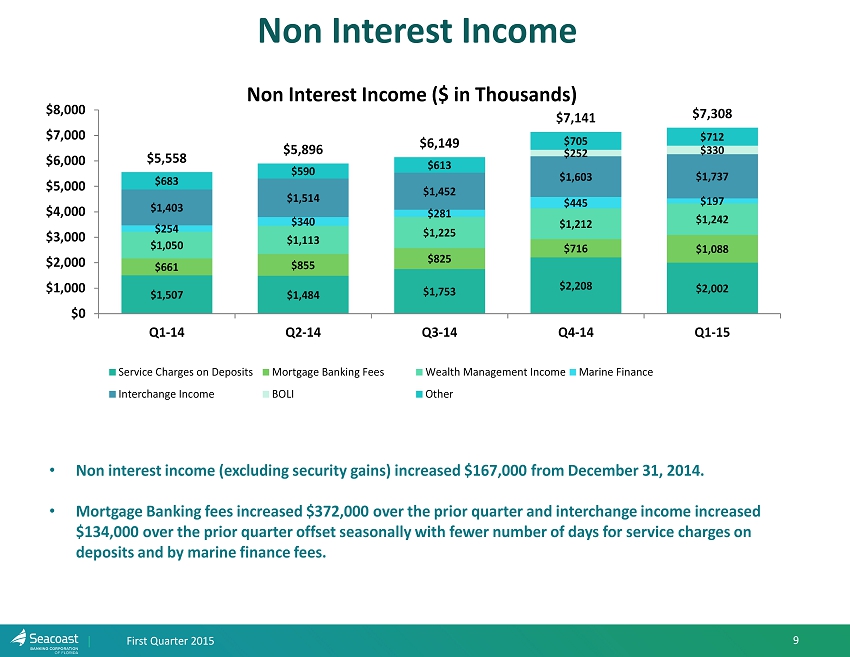
First Quarter 2015 9 Non Interest Income • Non interest income (excluding security gains) increased $167,000 from December 31, 2014. • Mortgage Banking fees increased $372,000 over the prior quarter and interchange income increased $134,000 over the prior quarter offset seasonally with fewer number of days for service charges on deposits and by marine finance fees. $1,507 $1,484 $1,753 $2,208 $2,002 $661 $855 $825 $716 $1,088 $1,050 $1,113 $1,225 $1,212 $1,242 $254 $340 $281 $445 $197 $1,403 $1,514 $1,452 $1,603 $1,737 $252 $330 $683 $590 $613 $705 $712 $5,558 $5,896 $6,149 $7,141 $7,308 $0 $1,000 $2,000 $3,000 $4,000 $5,000 $6,000 $7,000 $8,000 Q1-14 Q2-14 Q3-14 Q4-14 Q1-15 Non Interest Income ($ in Thousands) Service Charges on Deposits Mortgage Banking Fees Wealth Management Income Marine Finance Interchange Income BOLI Other

First Quarter 2015 10 Non Interest Expense Moderates $9,594 $9,668 $9,917 $12,459 $ 11,192 $1,695 $1,811 $1,769 $1,925 $2,184 $2,702 $2,798 $2,820 $ 3,427 $ 3,251 $813 $675 $717 $1,072 $975 $935 $924 $884 $1,741 $1,388 $386 $411 $387 $476 $589 $2,259 $2,513 $2,350 $ 3,309 $ 3,096 $18,384 $18,800 $18,844 $ 24,409 $ 22,675 $0 $3,000 $6,000 $9,000 $12,000 $15,000 $18,000 $21,000 $24,000 $27,000 Q1-14 Q2-14 Q3-14 Q4-14 Q1-15 Core Operating Expenses (1) ($ in Thousands) Salaries and Benefits Data Processing Cost Occupancy / Telephone Marketing Legal and Professional FDIC Other • Core operating expense (non - GAAP) totaled $22.7 million for the first quarter of 2015 compared to $24.4 million in the fourth quarter of 2014. • The improvement in core operating expense and our adjusted efficiency ratio (67.4% in 1Q15 versus 74.8% in 4Q14) is reflective of a full quarter benefit from expense reduction initiatives completed in Q4 14. (1) Non - GAAP measure, excludes merger related charges, branch closure expenses, and other adjustments (See Appendix for reconciliation to GAA P)

SBCF Florida’s Economic Improvement • Employment increased 3.7% in 2014 with 285,00 net new jobs • Construction employment accounts for just 5.2% of jobs, down from 8.7% at the peak and 6.5% on average • Unemployment as of March is down to 5.7% from 6.5% a year ago. First Quarter 2015 11

12 Source: Wells Fargo Securities Florida Economic Outlook March 2015 . First Quarter 2015

13 Source: Wells Fargo Securities Florida Economic Outlook March 2015 . First Quarter 2015

14 Source: Wells Fargo Securities Florida Economic Outlook March 2015 . First Quarter 2015

15 Source: Wells Fargo Securities Florida Economic Outlook March 2015 . First Quarter 2015

First Quarter 2015 16 Appendix

First Quarter 2015 17 Explanation of Certain Unaudited Non - GAAP Financial M easures • This press release contains financial information determined by methods other than Generally Accepted Accounting Principles (“GAAP”). The financial highlights provide reconciliations between GAAP net income and adjusted net income, GAAP income and adjusted pretax, preprovision income. Management uses these non - GAAP financial measures in its analysis of the Company’s performance and believes these presentations provide useful supplemental information, and a clearer understanding of the Company’s performance. The Company believes the non - GAAP measures enhance investors’ understanding of the Company’s business and performance. These measures are also useful in understanding performance trends and facilitate comparisons with the performance of other financial institutions. The limitations associated with operating measures are the risk that persons might disagree as to the appropriateness of items comprising these measures and that different companies might calculate these measures differently. The Company provides reconciliations between GAAP and these non - GAAP measures. These disclosures should not be considered an alternative to GAAP.

First Quarter 2015 18 Net Income - GAAP to Non - GAAP Reconciliation: Presented below is net income excluding adjustments for merger related charges, branch closure charges, and other non core expenses. The Company believes that these results of operations are a more meaningful depiction of the underlying fundamentals of its business and ove rall performance. (1) Non - GAAP measure, excludes merger related charges, branch closure expenses, and other adjustments (See Appendix for reconciliation to GAA P) (Dollars in thousands) First Quarter 2015 Fourth Quarter 2014 Third Quarter 2014 Second Quarter 2014 First Quarter 2014 Net income $5,859 ($1,517) $2,996 $1,918 $2,299 Severance 12 478 328 181 212 Merger related charges 275 2,722 399 1,234 6 Branch closure charges and costs related to expense initiatives 0 4,261 68 114 0 Marketing and brand refresh expense 0 697 0 0 0 Stock compensation expense and other incentive costs related to improved outlook 0 1,213 0 0 0 Security (gains) 0 (108) (344) 0 (17) Miscellaneous losses (gains) 0 119 (45) 144 0 Recovery of nonaccrual loan interest 0 0 (192) 0 0 Net loss on OREO and repossessed assets 81 9 156 92 53 Asset dispositions expense 143 103 139 118 128 Effective tax rate on adjustments (193) (3,798) (219) (811) (148) Adjusted Net Income (1) $6,177 $4,179 $3,286 $2,990 $2,533 Provision (recapture) for loan losses 433 118 (1,425) (1,444) (735) Income taxes 3,732 3,167 2,480 2,275 1,597 Adjusted pretax, pre-provision income (1) $10,342 $7,464 $4,341 $3,821 $3,395 Adjusted earnings per diluted share (1) $0.19 $0.13 $0.13 $0.12 $0.10 Average shares outstanding 33,135 33,124 26,026 25,998 25,657

First Quarter 2015 19 Non - Interest Expense - GAAP to Non - GAAP Reconciliation: Presented below is core operating expenses and other non core expenses. The Company believes that these results of operations are a more meaningful depiction of the underlying fundamentals of its business and overall performance. (1) Non - GAAP measure, excludes merger related charges, branch closure expenses, and other adjustments (See Appendix for reconciliation to GAA P) (Dollars in thousands) First Quarter 2015 Fourth Quarter 2014 Third Quarter 2014 Second Quarter 2014 First Quarter 2014 Noninterest Expense: Salaries and wages $8,777 $9,998 $7,868 $7,587 $7,412 Employee benefits 2,415 2,461 2,049 2,081 2,182 Outsourced data processing costs 2,184 1,925 1,769 1,811 1,695 Telephone / data lines 496 419 313 306 293 Occupancy expense 2,023 2,325 1,879 1,888 1,838 Furniture and equipment expense 732 683 628 604 571 Marketing expense 975 1,072 717 675 813 Legal and professional fees 1,388 1,741 884 924 935 FDIC assessments 589 476 387 411 386 Amortization of intangibles 315 446 195 196 196 Other 2,781 2,863 2,155 2,317 2,063 Total Core Operating Expense 22,675 24,409 18,844 18,800 18,384 Non-GAAP adjustments Severance 12 478 328 181 212 Merger related charges 275 2,722 399 1,234 6 Branch closure charges and costs related to expense initiatives 0 4,261 68 114 0 Marketing and brand refresh expense 0 697 0 0 0 Stock compensation expense and other incentive costs related to improved outlook 0 1,213 0 0 0 Miscellaneous losses (gains) 0 119 (45) 144 0 Net loss on OREO and repossessed assets 81 9 156 92 53 Asset dispositions expense 143 103 139 118 128 Total Adjusted Operating Expenses $23,186 $34,011 $19,889 $20,683 $18,789